3.2. Distribution of Temperature and Humidity
Figure 3 shows the monthly mean temperature and relative humidity in NV and AC modes.
Table 2 shows the correlation coefficient in NV and AC modes.
The monthly mean indoor and globe temperature is very similar in NV and AC mode, and thus the correlation coefficient is also high in both modes. In NV mode, indoor temperatures are higher than the outdoor air temperature. However, in AC mode, the indoor temperatures are lower than the outdoor air temperature, except in September. The Japanese government recommends the indoor temperature settings of 28 °C in summer. The results showed that the mean indoor temperature setting in AC mode was similar to the recommendation.
The mean indoor relative humidity is lower than the outdoor relative humidity (
Figure 3b). Due to the mechanical cooling, the mean indoor relative humidity or correlation coefficient of the AC mode is lower than the NV mode. The results showed that the relative humidity is slightly higher than the standard: 60%.
Figure 3.
Monthly mean temperature (a) and relative humidity (b) in naturally ventilated (NV) and cooling by air conditioning (AC) modes during voting.
Figure 3.
Monthly mean temperature (a) and relative humidity (b) in naturally ventilated (NV) and cooling by air conditioning (AC) modes during voting.
Table 2.
Correlation coefficient in NV and AC modes.
Table 2.
Correlation coefficient in NV and AC modes.
| Mode | Items | Ti:To | Tg:To | Ti:Tg | RHi:RHo |
|---|
| NV | r | 0.57 | 0.57 | 0.98 | 0.50 |
| N | 1860 | 1915 | 1860 | 1860 |
| AC | r | 0.22 | 0.20 | 0.89 | 0.07 |
| N | 1805 | 2076 | 1805 | 1805 |
3.3. Distribution of Thermal Sensation
Table 3 shows the correlation coefficient of the thermal sensation and thermal preference or temperatures. The correlation coefficient of the SHASE scale and thermal preference is higher than the ASHRAE scale and thermal preference. The SHASE scale is better correlated with the indoor air temperature and globe temperature. Thus, we have used the SHASE scale for further analysis.
Mean thermal sensation vote was 4.7 in NV mode, 4.3 in AC mode. Even though residents used the cooling, they sometimes felt “hot”. The proportion of people voting in the thermal comfort zone (votes 3, 4 or 5) in the NV and AC modes is 84% and 97% (
Table 4).
It can be said that residents were generally satisfied in the thermal environment of their houses. This may be due to the thermal adaptation of the residents to the local climate and culture.
Table 3.
Correlation coefficient with ASHRAE and SHASE scales.
Table 3.
Correlation coefficient with ASHRAE and SHASE scales.
| Mode | Items | ASHRAE | SHASE |
|---|
| TP | Ti | Tg | TP | Ti | Tg |
|---|
| NV | r | 0.73 | 0.36 | 0.36 | 0.81 | 0.38 | 0.37 |
| N | 1,915 | 1860 | 1915 | 1915 | 1860 | 1915 |
| AC | r | 0.77 | 0.30 | 0.28 | 0.86 | 0.35 | 0.32 |
| N | 2076 | 1805 | 2076 | 2076 | 1805 | 2076 |
Table 4.
Percentage of thermal sensation in NV and AC modes.
Table 4.
Percentage of thermal sensation in NV and AC modes.
| Mode | Items | Thermal Sensation | Total |
|---|
| 1 | 2 | 3 | 4 | 5 | 6 | 7 |
|---|
| NV | N | 1 | – | 24 | 904 | 685 | 253 | 48 | 1915 |
| P (%) | 0.1 | – | 1.3 | 47.2 | 35.8 | 13.2 | 2.5 | 100 |
| AC | N | 2 | 5 | 152 | 1284 | 569 | 58 | 6 | 2076 |
| P (%) | 0.1 | 0.2 | 7.3 | 61.8 | 27.4 | 2.8 | 0.3 | 100 |
3.4. Thermal Comfort Zone
To clarify the thermal comfort zone, the Probit regression analysis [
15] is conducted for the thermal sensation votes (TSV) (SHASE scale) categories and temperatures for NV and AC modes. The analysis method is Ordinal regression using Probit as the link function and the temperature as the covariate.
The results of the Probit analysis is shown in
Table 5. The “mean” temperature is calculated by dividing the constant by regression coefficient. For example, the mean temperature of the first equation will be 4.790/0.289 = 16.6 °C (
Table 5). The inverse of the Probit regression is the standard deviation of the cumulative Normal distribution. For example, the standard deviation of air temperature of the NV mode will be 1/0.289 = 3.460 °C (
Table 5). These calculations are fully given in the
Table 5. Transforming the Probits using the following function into proportions gives the curve of
Figure 4a–d. The vertical axis is the proportion of votes.
where the “quant” is the indoor air temperature (°C) or globe temperature (°C), the “mean” and “S.D.” are given in the
Table 5.
The highest line is for category 1 (very cold) and so on successively. Thus, it can be seen that the temperature for thermal neutrality (a probability of 0.5) is around 26 °C for the AC mode.
Reckoning the three central categories as representing thermal comfort, and transforming the Probits into proportions gives the bell-curve of
Figure 4e,f. The result is remarkable in two respects. The proportion of people comfortable at the optimum is very high for AC mode, only just less that 100%, and the range over which 80% are comfortable is wide—from around 23 to 30 °C in NV mode. This is presumably because people in their own homes are free to clothe themselves according to the room temperature, without the constraints that are apt to apply at the office.
Table 5.
Results of the Probit analysis for NV and AC modes.
Table 5.
Results of the Probit analysis for NV and AC modes.
| Mode | Indoor air temperature Ti (°C) | Globe temperature Tg (°C) |
|---|
| Equation | Mean | S.D. | Equation | Mean | S.D. |
|---|
| NV | P(≤1) = 0.289Ti − 4.790 | 16.6 | 3.460 | P(≤1) = 0.285Tg − 4.691 | 16.5 | 3.509 |
| P(≤2) = 0.289Ti − 5.919 | 20.5 | P(≤2) = 0.285Tg − 5.817 | 20.4 |
| P(≤4) = 0.289Ti − 8.292 | 28.7 | P(≤4) = 0.285Tg − 8.238 | 28.9 |
| P(≤5) = 0.289Ti − 9.461 | 32.7 | P(≤5) = 0.285Tg − 9.388 | 32.9 |
| P(≤6) = 0.289Ti − 10.506 | 36.4 | P(≤6) = 0.285Tg − 10.424 | 36.6 |
| AC | P(≤1) = 0.260Ti − 3.861 | 14.9 | 3.846 | P(≤1) = 0.250Tg − 3.701 | 14.8 | 3.846 |
| P(≤2) = 0.260Ti − 4.150 | 16.0 | P(≤2) = 0.250Tg − 4.085 | 16.3 |
| P(≤3) = 0.260Ti − 5.655 | 21.8 | P(≤3) = 0.250Tg − 5.410 | 21.6 |
| P(≤4) = 0.260Ti − 8.043 | 30.9 | P(≤4) = 0.250Tg − 7.506 | 30.0 |
| P(≤5) = 0.260Ti − 9.210 | 35.4 | P(≤5) = 0.250Tg − 8.953 | 35.8 |
| P(≤6) = 0.260Ti − 10.118 | 38.9 | P(≤6) = 0.250Tg − 9.912 | 39.6 |
Figure 4.
Proportion of thermal sensation vote (TSV) or comfortable (TSV 3, 4 or 5) for temperatures: (a) Proportion of TSV and indoor air temperature in NV mode; (b) Proportion of TSV and globe temperature in NV mode; (c) Proportion of TSV and indoor air temperature in AC mode; (d) Proportion of TSV and globe temperature in AC mode; (e) Proportion of comfortable and indoor air temperature; (f) Proportion of comfortable and globe temperature.
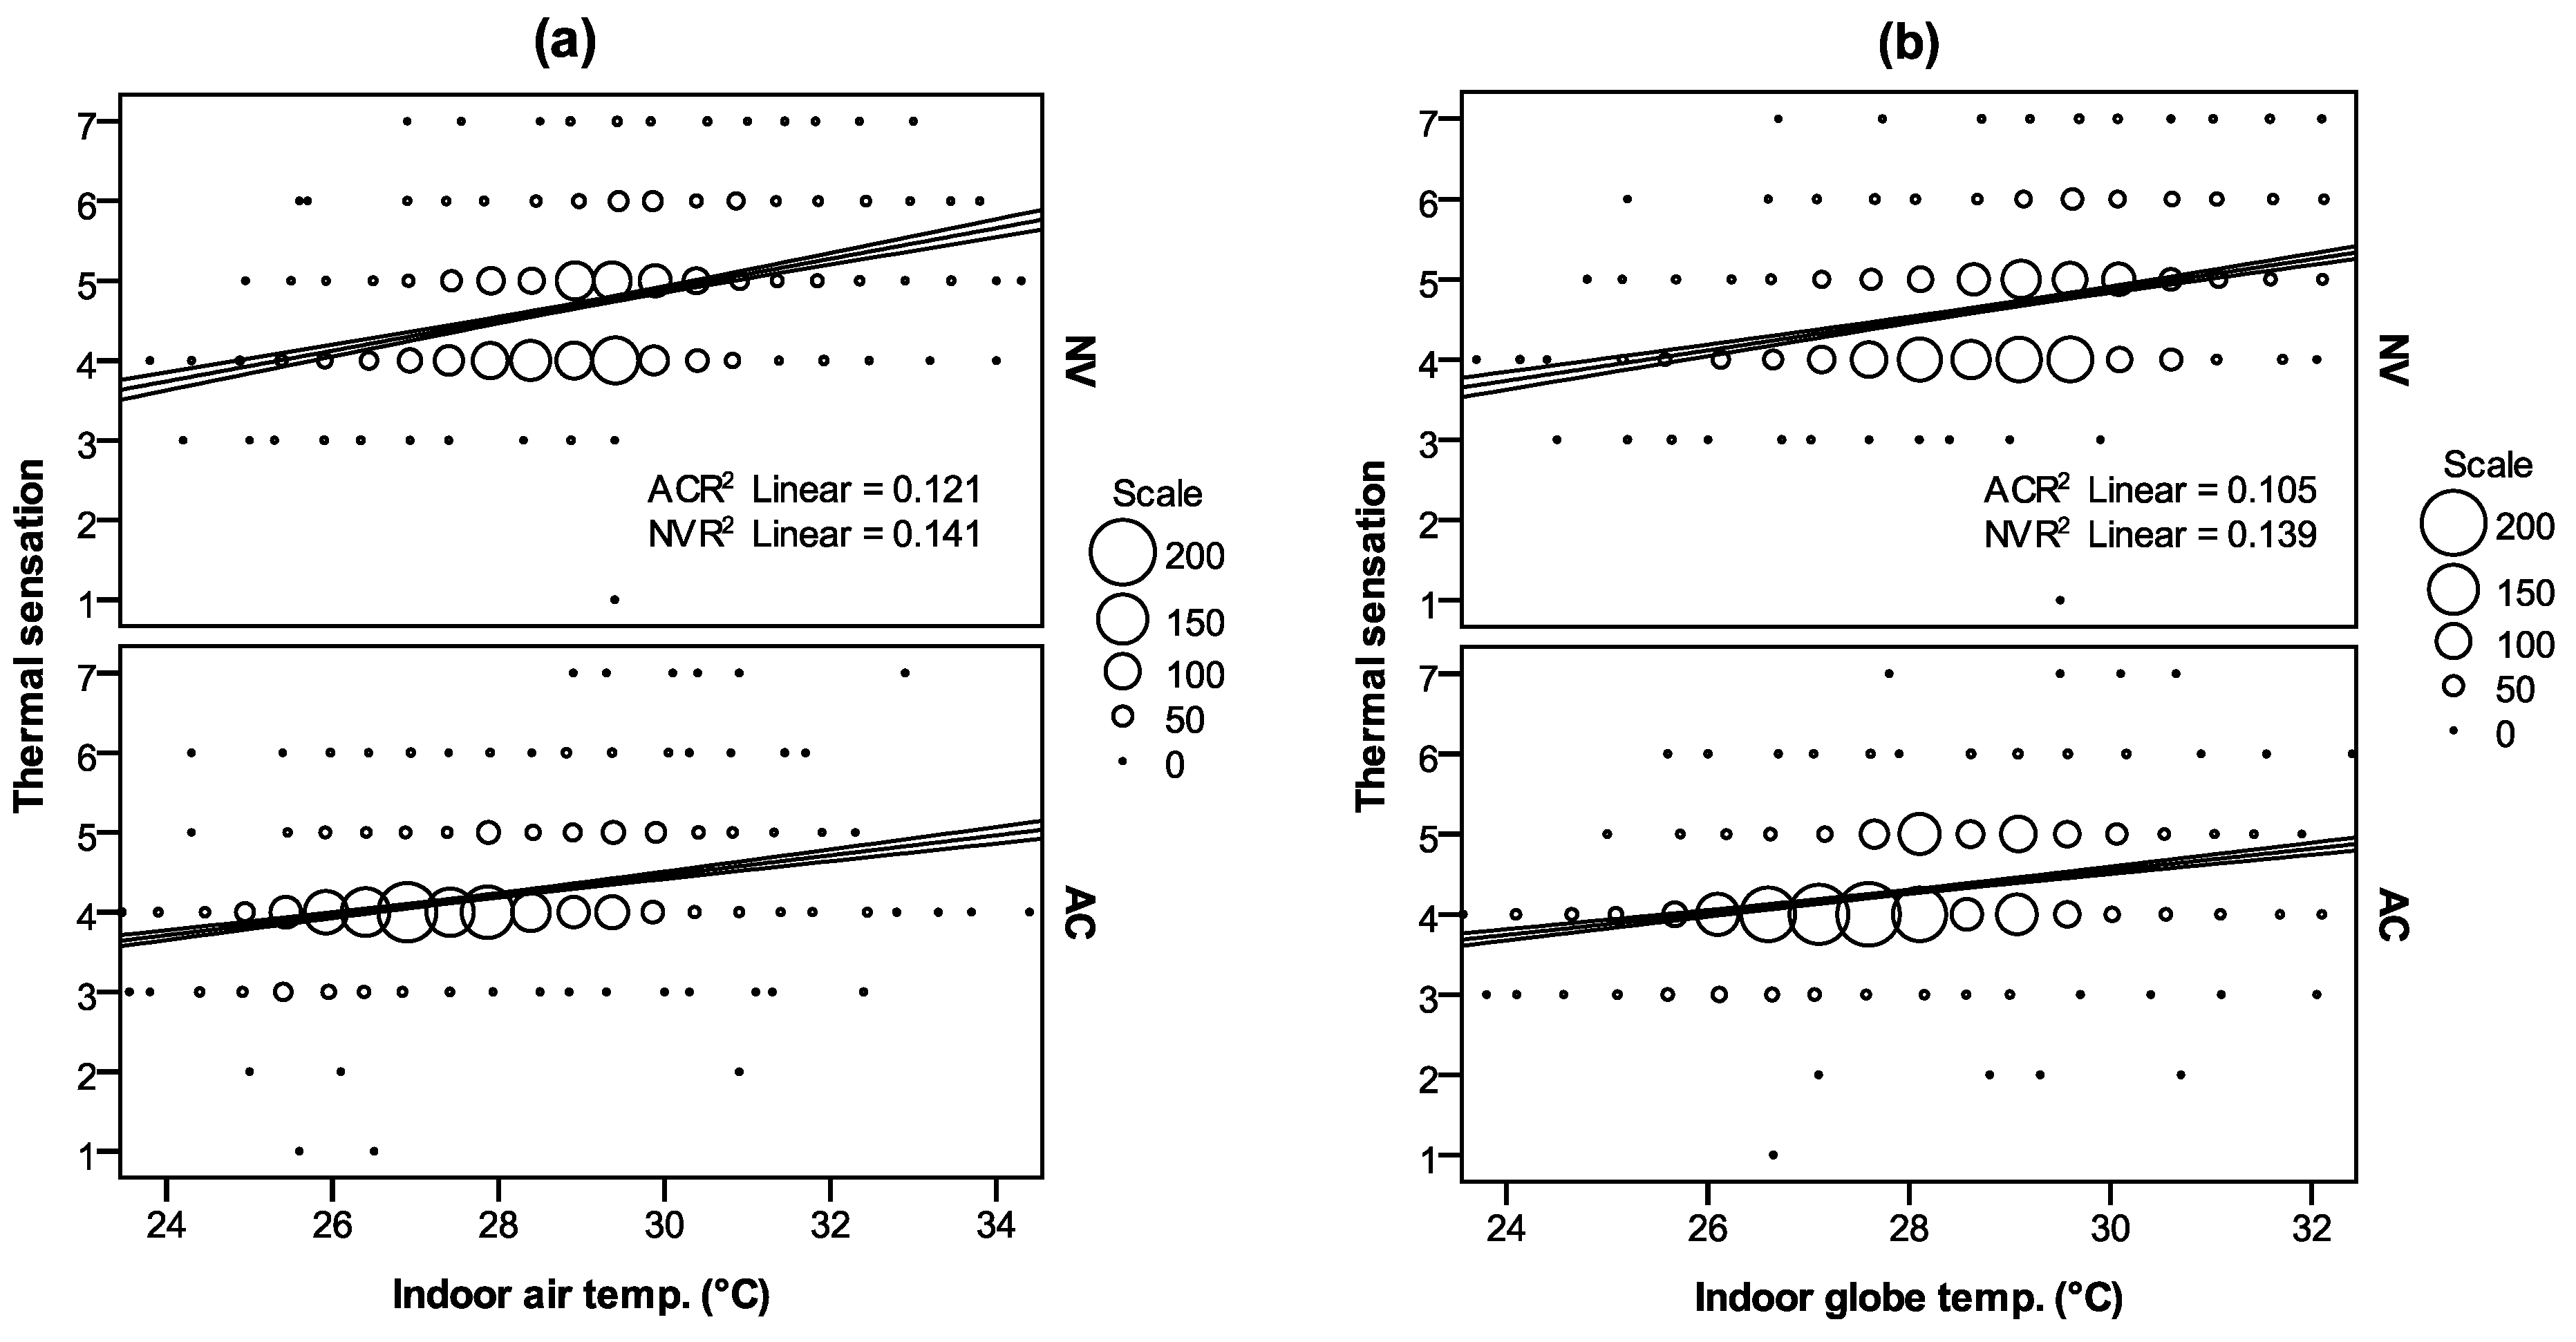
3.5. Prediction of Comfort Temperature by Regression Method
Regression analysis of the thermal sensation and indoor air temperature was conducted to predict the comfort temperature (
Figure 5). The following regression equations are obtained for the thermal sensation (
C) and indoor air temperature (
Ti, °C) or globe temperature (
Tg, °C).
AC mode:
n: Number of sample;
R2: Coefficient of determination;
p: Significant level of regression coefficient.
The regression coefficient for the NV mode is higher than that of the AC. When the indoor or globe comfort temperature is predicted by substituting “4 neutral” in the Equations (2) to (5), it would be 25.4 °C in the NV mode and 26.4 °C or 25.9 °C in the AC mode.
As shown in the figure, the comfort temperature is predicted around the few data points, and thus a linear model is not suitable to predict the comfort temperature. This might be due to the problem of applying the regression method in the presence of adaptive behavior, where it can be misleading when used to estimate the comfort temperature, as has been found in previous research [
5,
6]. So to avoid this problem the comfort temperature is estimated using the Griffiths method in the next section.
Figure 5.
Relation between thermal sensation and the temperature: (a) Thermal sensation and indoor air temperature; (b) Thermal sensation and indoor globe temperature.
Figure 5.
Relation between thermal sensation and the temperature: (a) Thermal sensation and indoor air temperature; (b) Thermal sensation and indoor globe temperature.
3.6. Prediction of Comfort Temperature by Griffiths Method
Griffiths [
16] suggested a way in which the comfort temperature can be calculated from a small sample of data. Griffiths made the assumption that the increase in temperature for each scale point on the thermal sensation scale was effectively 3K for a seven point scale [
17]. This means that for each thermal sensation vote away from neutral, he subtracted or added 3K from the actual temperature at the time to obtain the temperature that might be expected to result in neutrality [
17]. The detail of the Griffiths method can be found in the various publications [
7,
17,
18]. The comfort temperature is predicted by the Griffiths’ method which is given below.
where
Tc is the comfort temperature by Griffiths’ method (°C),
T is the indoor air temperature (°C) or globe temperature (°C) and
a is the regression coefficient.
In applying the Griffiths’ method, Nicol
et al. [
7] and Humphreys
et al. [
19] used the constants 0.25, 0.33 and 0.50 for a 7 point thermal sensation scale. We have also investigated the comfort temperature using these regression coefficients. The mean comfort temperature with each coefficient is not very different (
Table 6), so it matters little which coefficient is adopted. The comfort temperature calculated with the coefficient 0.50 is used for further analysis.
Table 6.
Comfort temperature predicted by Griffiths’ method.
Table 6.
Comfort temperature predicted by Griffiths’ method.
| Mode | RC | Tci (°C) | Tcg (°C) |
|---|
| N | Mean | S.D. | N | Mean | S.D. |
|---|
| NV | 0.25 | 1860 | 26.2 | 3.1 | 1915 | 26.3 | 3.0 |
| 0.33 | 1860 | 26.9 | 2.4 | 1915 | 26.9 | 2.4 |
| 0.50 | 1860 | 27.6 | 1.8 | 1915 | 27.6 | 1.8 |
| AC | 0.25 | 1805 | 26.9 | 2.5 | 2076 | 26.8 | 2.6 |
| 0.33 | 1805 | 27.1 | 2.1 | 2076 | 27.0 | 2.1 |
| 0.50 | 1805 | 27.3 | 1.8 | 2076 | 27.3 | 1.7 |
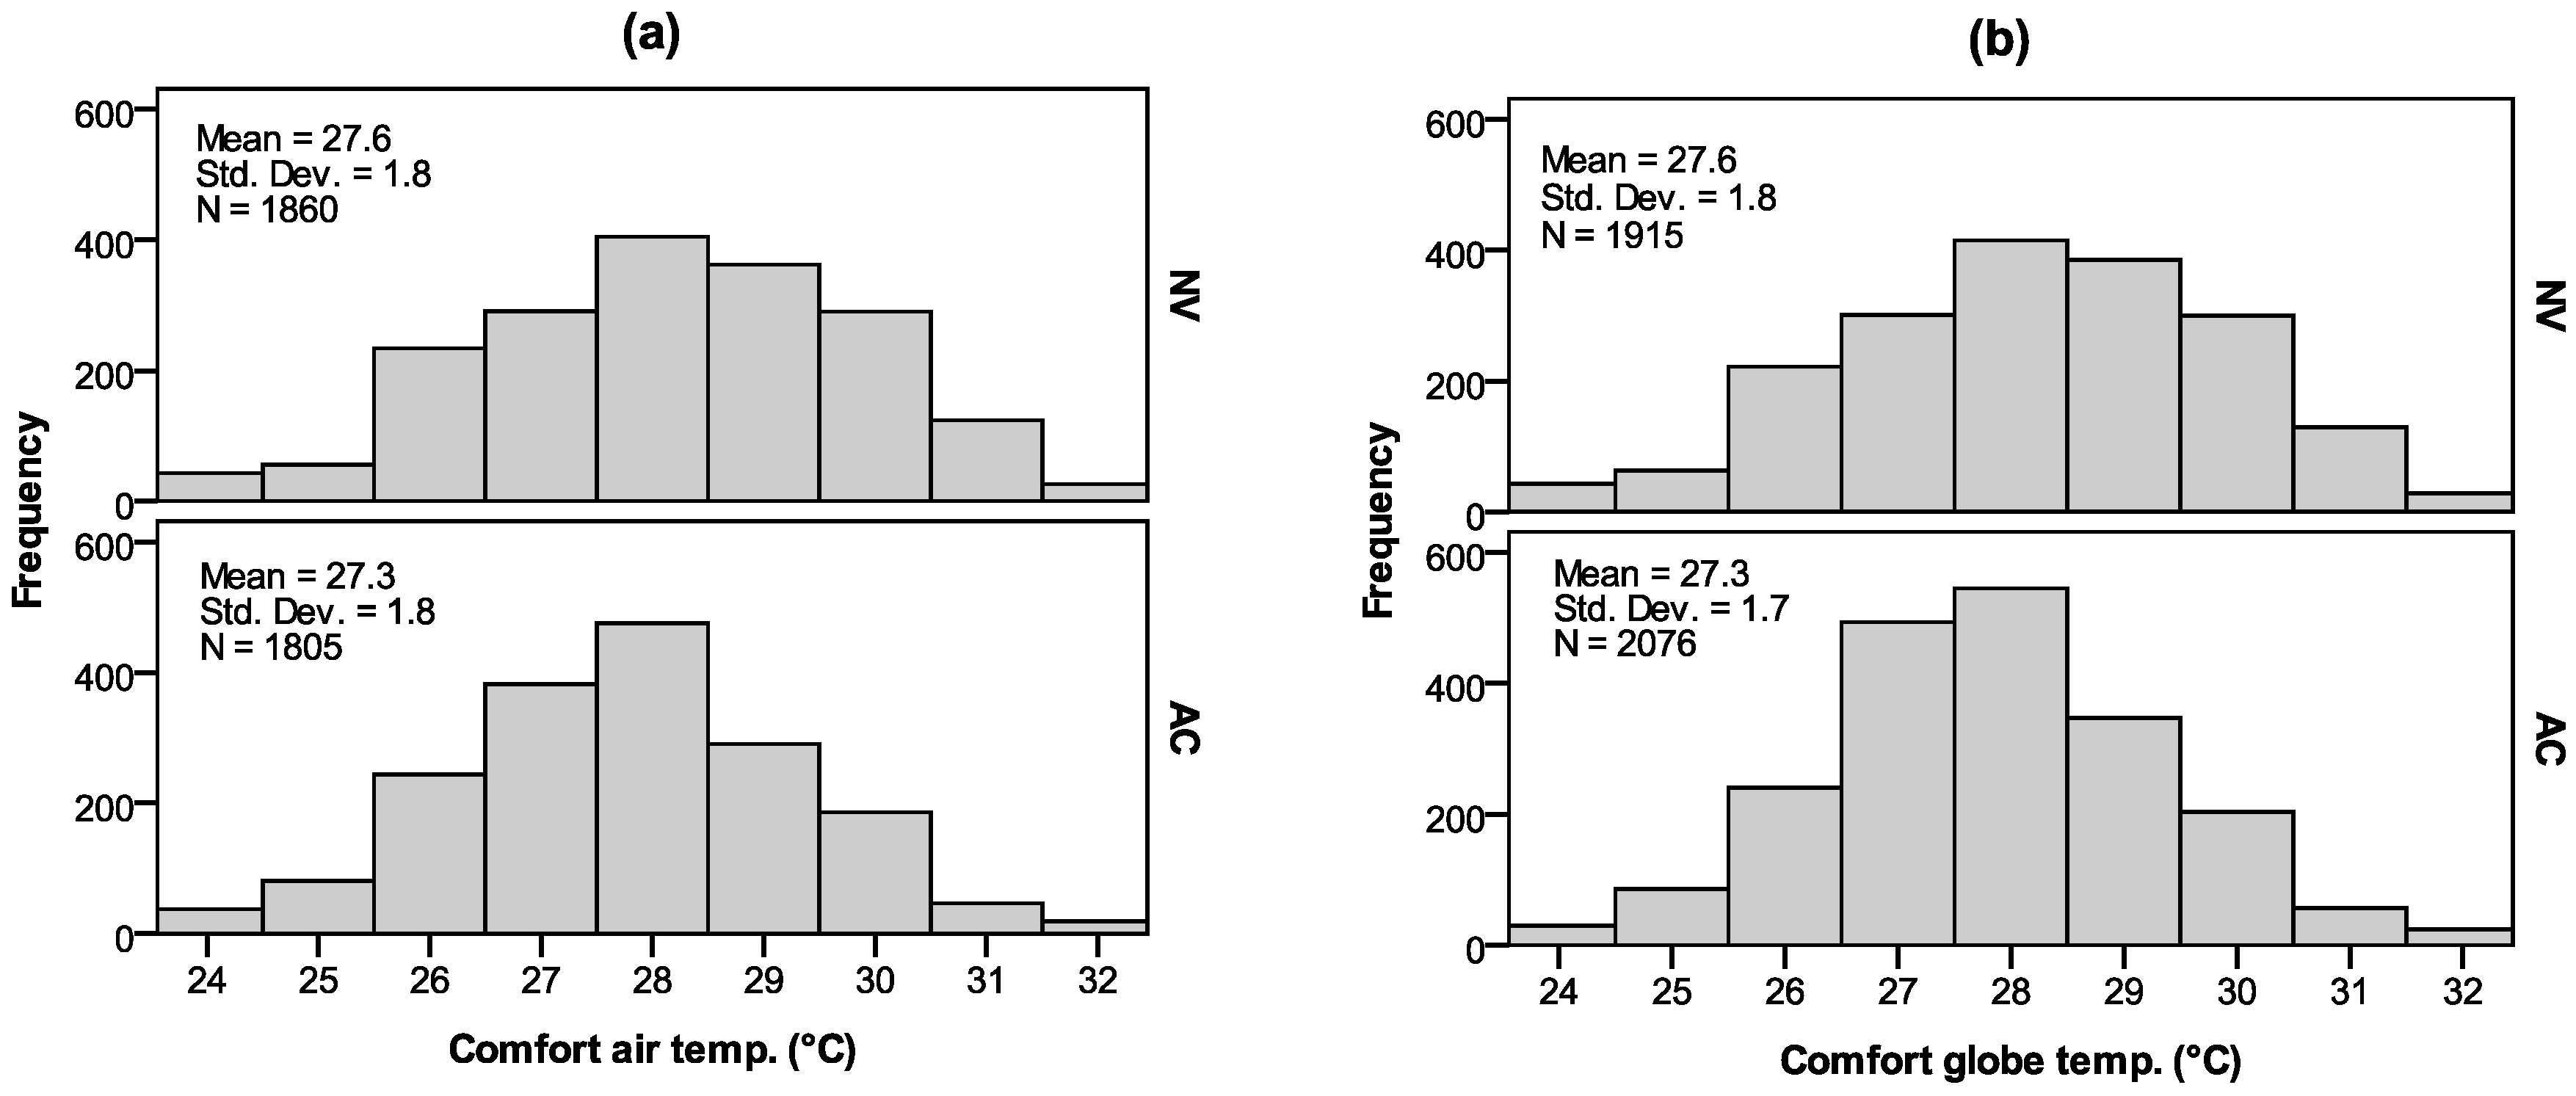
The mean comfort air or globe temperature by the Griffiths’ method is 27.6 °C in NV mode and 27.3 °C in AC mode (
Figure 6). Since the mean comfort temperature of the Griffiths’ method is comparable to the indoor air and globe temperature when voting “4 neutral” (
Table 7). It is probable that the comfort temperature as estimated by the Griffiths’ method is more appropriate.
Table 8 shows a comparison of the comfort temperature obtained in this study with existing research. The comfort temperature of the existing research is similar to this research.
Figure 6.
Comfort temperature predicted by Griffiths method: (a) Comfort indoor air temperature; (b) Comfort globe temperature.
Figure 6.
Comfort temperature predicted by Griffiths method: (a) Comfort indoor air temperature; (b) Comfort globe temperature.
Table 7.
Indoor air temperature and globe temperature when voting “4 neutral”.
Table 7.
Indoor air temperature and globe temperature when voting “4 neutral”.
| Mode | Items | N | Mean (°C) | S.D. (°C) |
|---|
| NV | Ti | 851 | 28.5 | 1.5 |
| Tg | 904 | 28.5 | 1.5 |
| AC | Ti | 1264 | 27.4 | 1.7 |
| Tg | 1284 | 27.6 | 1.6 |
Table 8.
Comparison of comfort temperature in summer with existing research.
Table 8.
Comparison of comfort temperature in summer with existing research.
| Area | Reference | Comfort Temperature (°C) |
|---|
| Japan (Kanto) | This study (NV mode) | 27.6 |
| Japan (Gifu) | Rijal et al. [5] | 26.1 |
| Japan (Kanto) | Katsuno et al. [4] | 27.6 |
| Japan (Kanto) | Yoshimura et al. [2] | 29 |
| Japan (Kanto) | Rijal and Yoshimura [3] | 27.2 * |
| Japan (Kansai) | Nakaya et al. [1] | 27.6 |
| Nepal | Rijal et al. [6] | 21.1–30.0 |
| Pakistan | Nicol and Roaf [8] | 26.7–29.9 |
| UK | Rijal and Stevenson [9] | 22.9 |
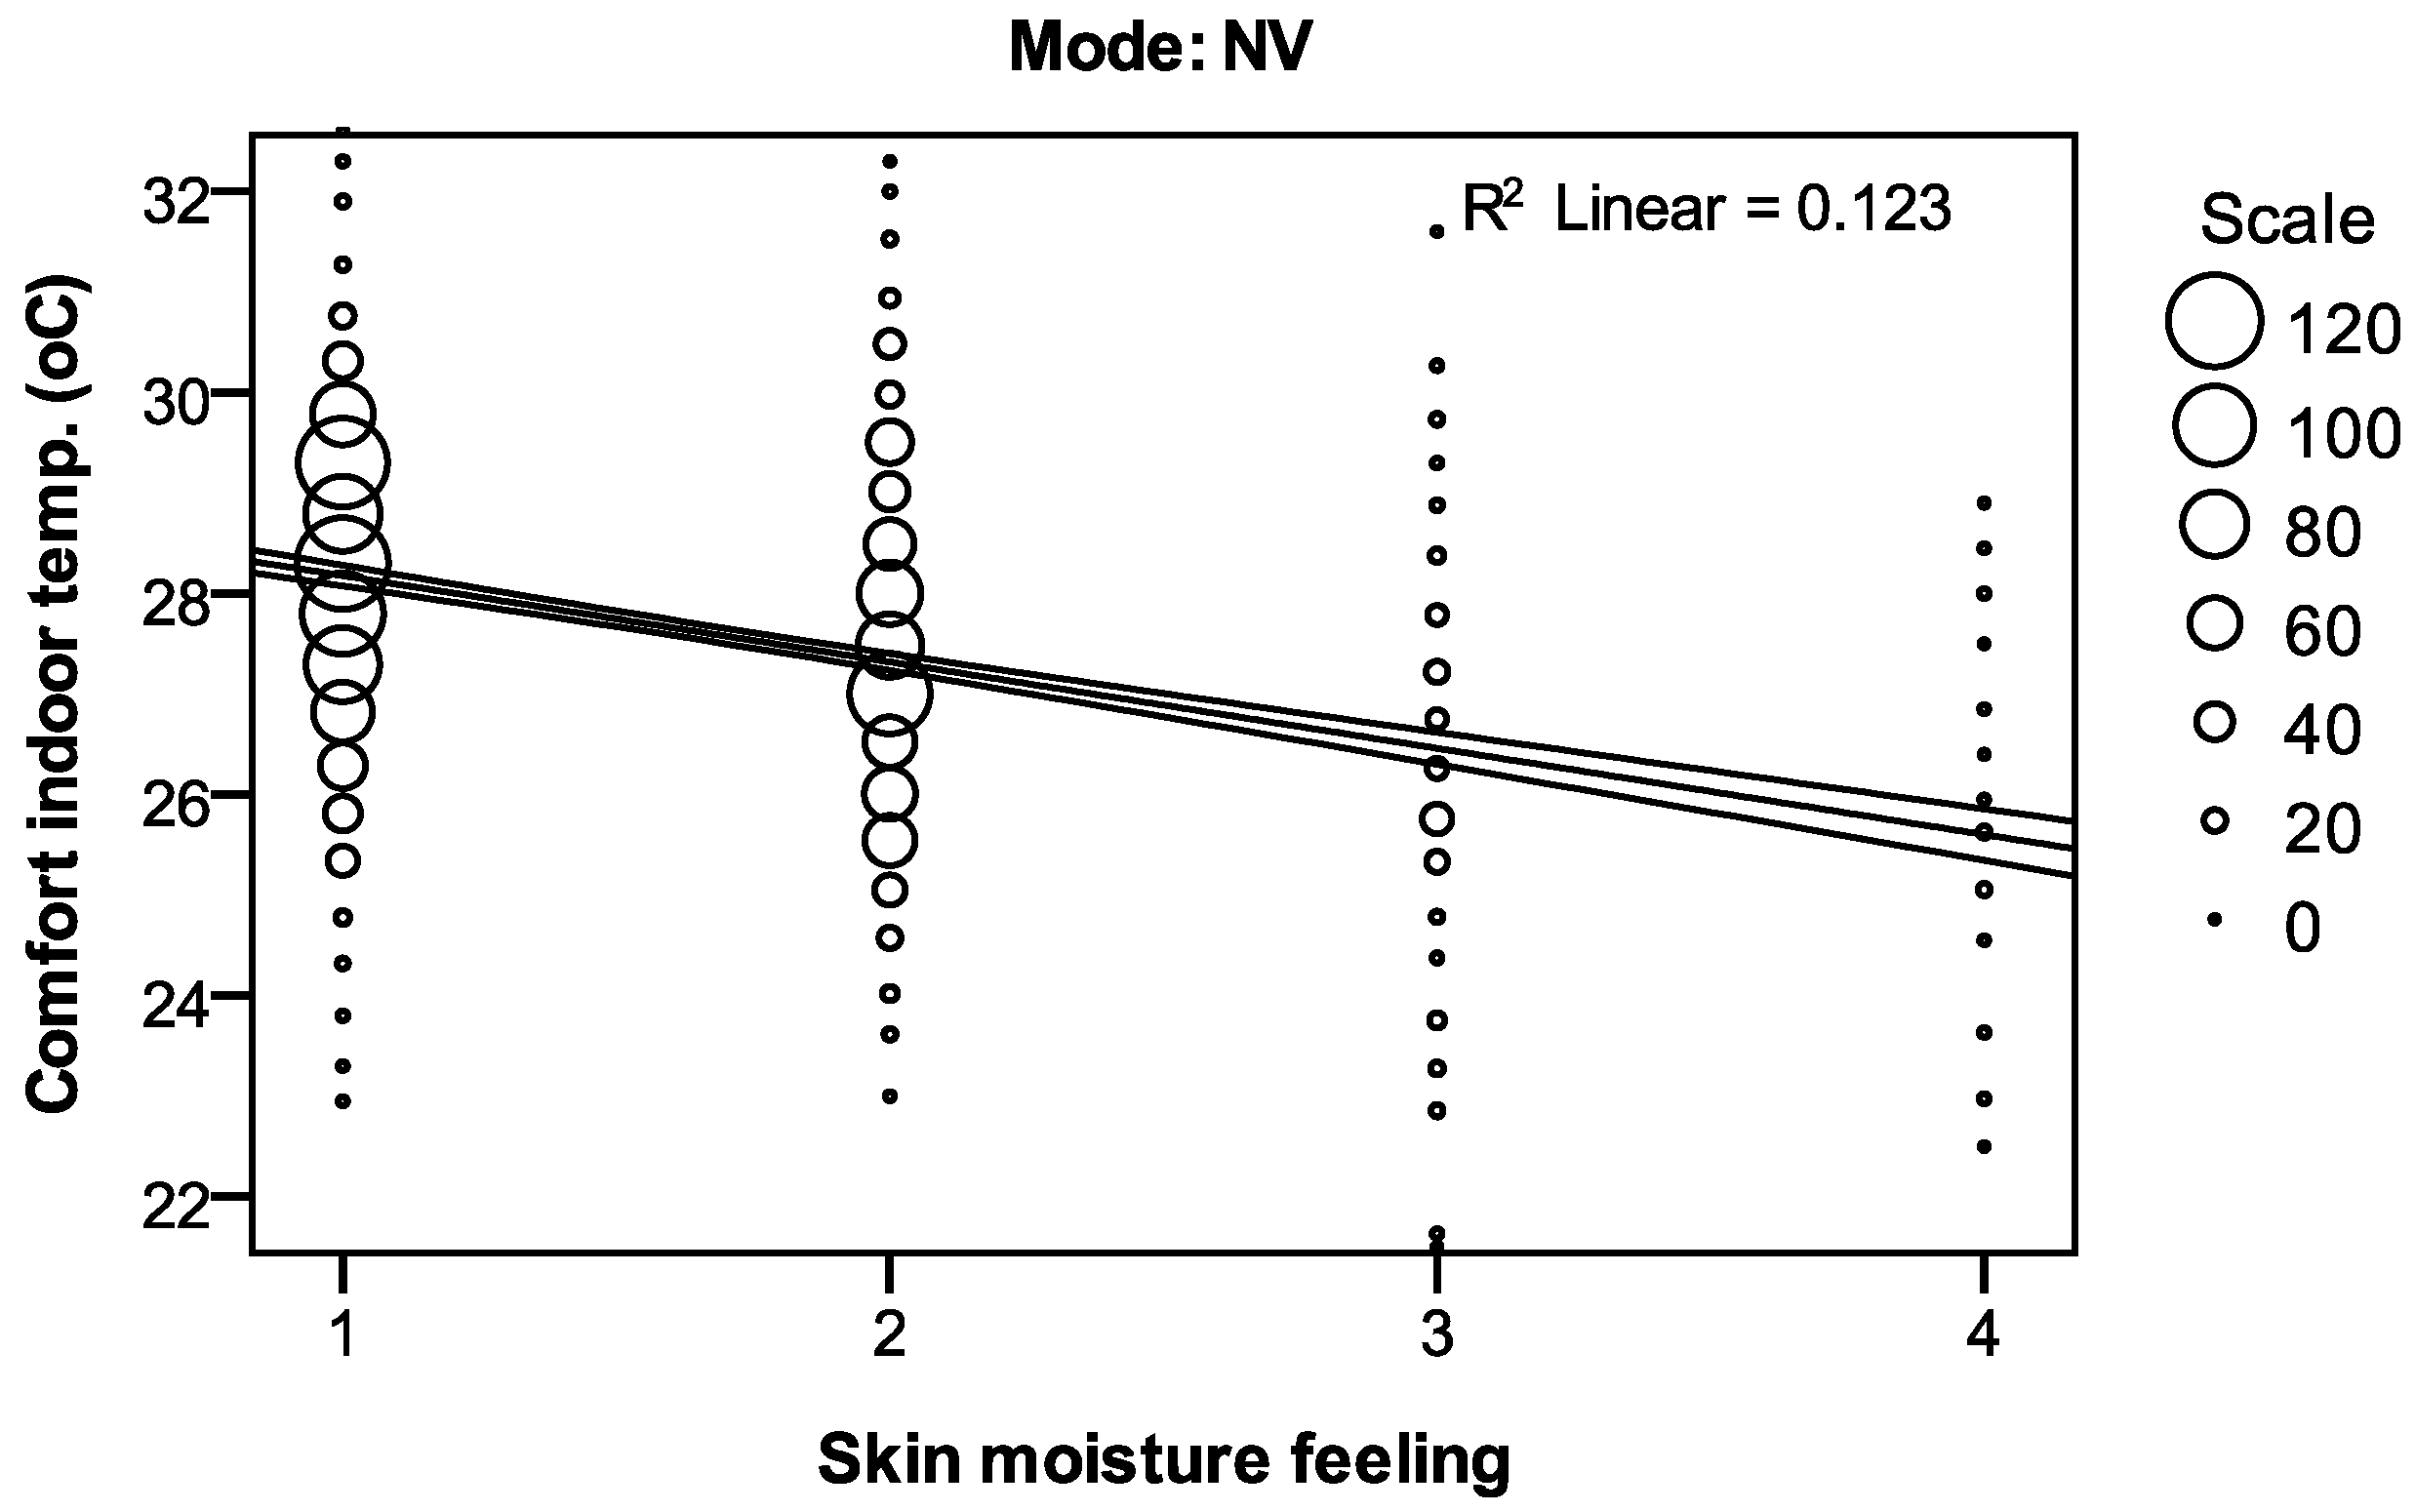
3.7. Comfort Temperature and Humidity
The humidity is one of the key issues in the hottest season. In a moist environment, people become uncomfortable with a smaller change in temperature than they do in a dry environment [
12]. The comfort temperature is analyzed by relating it to the relative humidity, absolute humidity and skin moisture. The comfort temperatures were correlated with the indoor relative humidity and skin moisture sensation (
Table 9). However, the correlation effect of the comfort temperature and relative humidity might have simply been arrived at from the correlation between air temperature and relative humidity. To investigate the effect of humidity on the comfort temperature, the multiple regression analysis was conducted for the NV mode.
where
Tci: Comfort indoor temperature (°C);
RHi: Indoor relative humidity (%);
AHi: Indoor absolute humidity (g/kg’);
SM: Skin moisture sensation.
As shown in the equations, the relative humidity and absolute humidity have no important effect on the comfort temperature. However, Nicol [
12] found that in a humid climate or in conditions when the relative humidity is high people may require temperatures that are about 1°C lower to remain comfortable. As for the skin moisture, it has significantly affected the comfort temperature (
Figure 7). Nicol [
20] found that when indoor air temperature is 31–40 °C, the increased wind velocity reduced the skin moisture.
The results showed that the evaporation of the skin moisture is important to increase the comfort temperature in Japan’s hot and humid season.
Table 9.
Correlation coefficient in NV mode.
Table 9.
Correlation coefficient in NV mode.
| Items | Tci:RHi | Tcg:RHi | Tci:AHi | Tcg:AHi | Tci:SM | Tcg:SM |
|---|
| r | −0.37 | −0.34 | −0.03 | −0.01 | −0.35 | −0.34 |
| p | <0.001 | <0.001 | 0.135 | 0.784 | <0.001 | <0.001 |
| N | 1860 | 1860 | 1860 | 1860 | 1860 | 1915 |
Figure 7.
Relation between the comfort air temperature and the skin moisture sensation.
Figure 7.
Relation between the comfort air temperature and the skin moisture sensation.
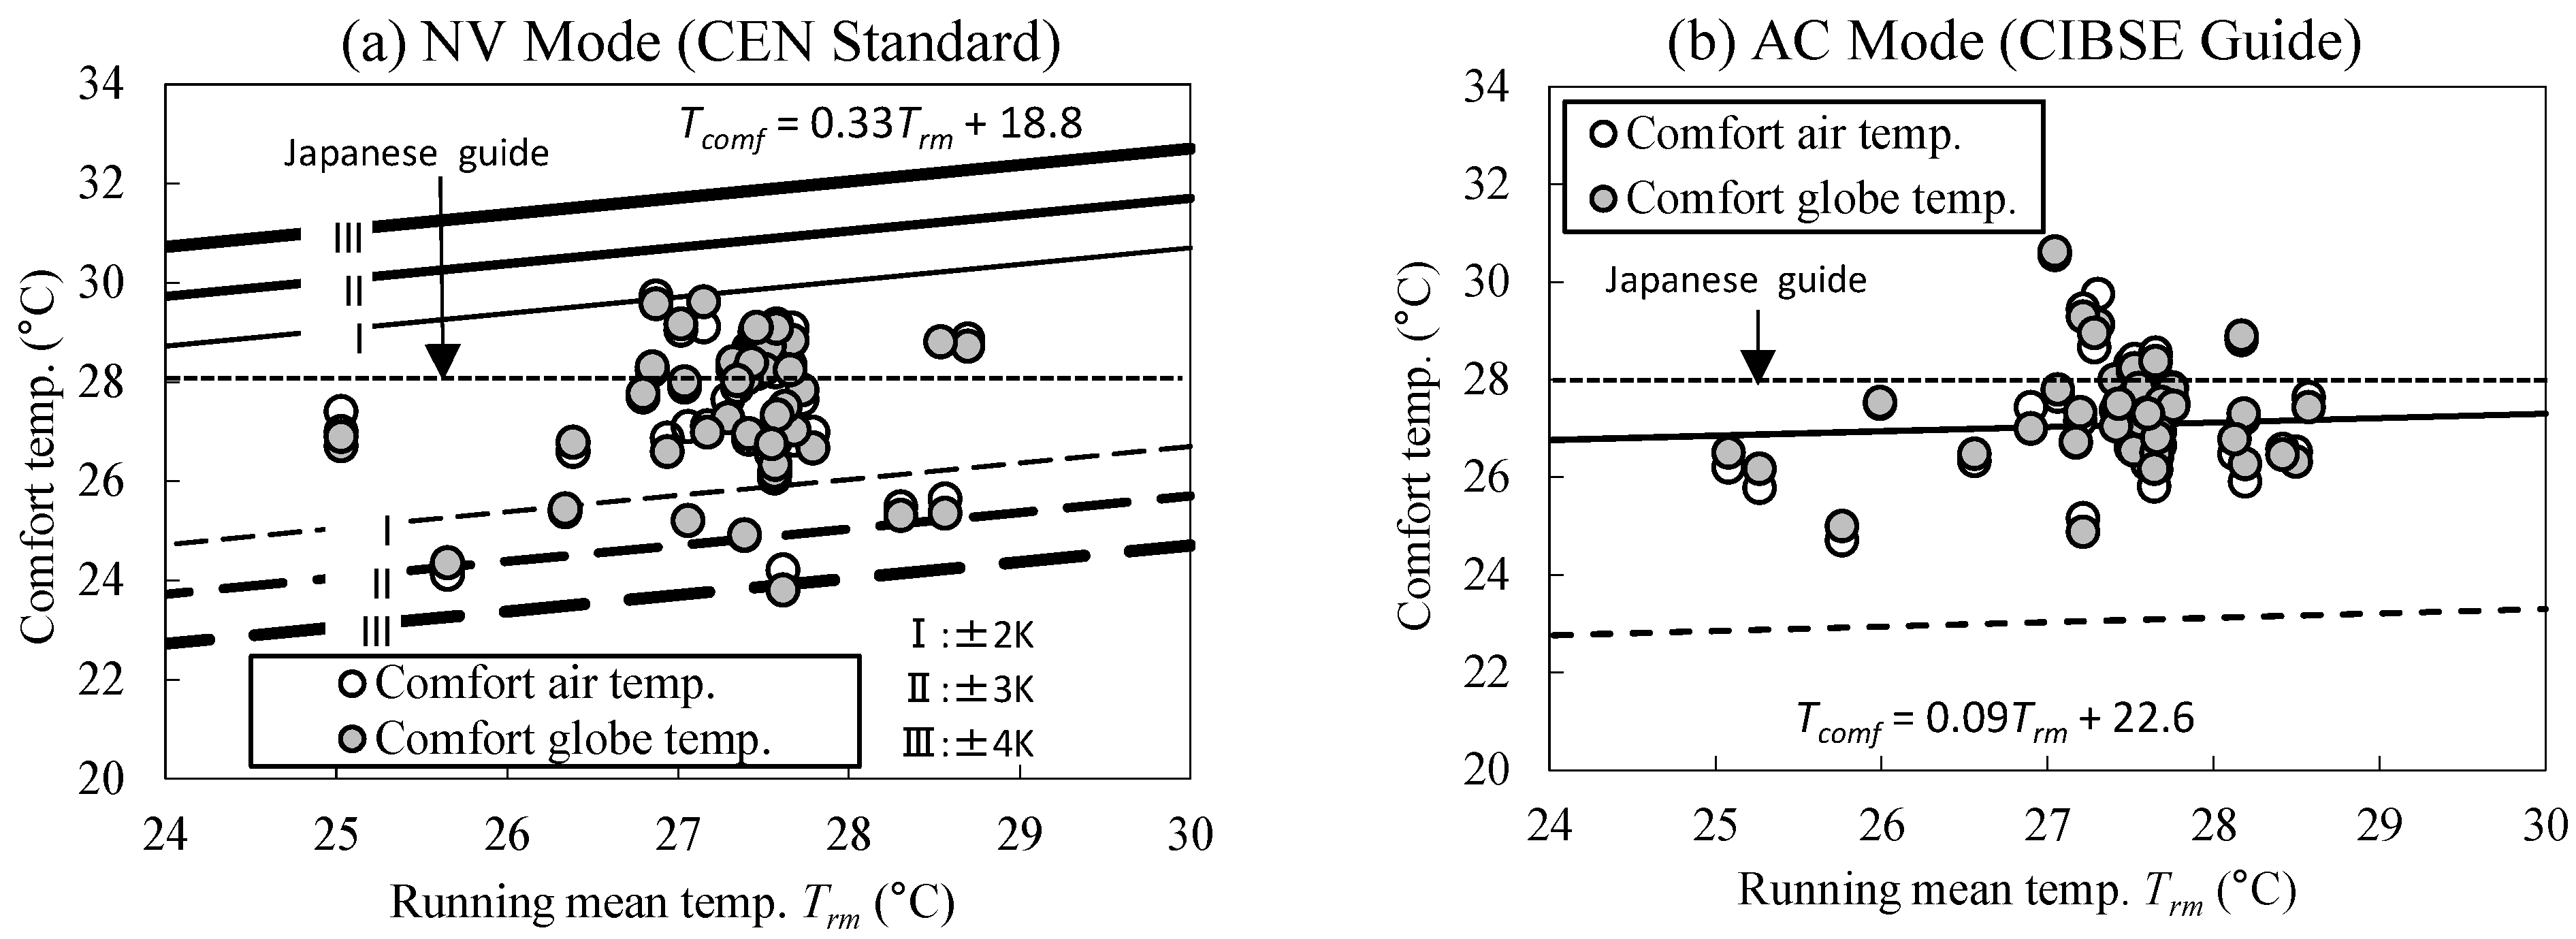
3.8. A Comparison with the Adaptive Model
It is well known that people adapt to the outdoor temperature, and thus comfort temperature has seasonal and regional differences [
14]. To predict such comfort temperature, the CEN and CIBSE proposed the adaptive model for office buildings. We wished to compare our results with these adaptive models.
The running mean outdoor temperature (
Trm) is used in the adaptive model which is the exponentially weighted daily mean outdoor temperature. It is calculated using the following equation [
11,
17,
21,
22].
where
Trm−1 is the running mean outdoor temperature for the previous day (°C),
Tod−1 is the daily mean outdoor temperature for the previous day (°C). So, if the running mean has been calculated (or assumed) for one day, then it can be readily calculated for the next day, and so on. α is a constant between the 0 and 1 which defines the speed at which the running mean responds to the outdoor air temperature. In this research α is assumed to be 0.8.
Figure 8 shows the relation between the comfort temperature and the running mean outdoor temperature. The six parallel lines in
Figure 8a show the acceptable zone of the adaptive model of CEN standard [
11]. The two parallel lines in
Figure 8b show upper and lower margins of the comfort temperature [
22]. The Japanese guide line is also shown in the figure.
Generally the comfort temperature of NV mode is within the acceptable zone of the adaptive model. As for the AC mode, the comfort temperature is higher than the CIBSE guide [
22]. The results showed that the residents are living by adapting to the higher indoor air temperature of the houses.
Figure 8.
Comparison with the adaptive model: (a) NV mode (CEN standard); (b) AC mode (CIBSE guide).
Figure 8.
Comparison with the adaptive model: (a) NV mode (CEN standard); (b) AC mode (CIBSE guide).
3.9. Occupant Behavior
As we have shown in the previous sections, the residents questioned are living by adapting to higher indoor air temperature of the houses. Residents might be regulating the thermal environments by using various adaptations: behavioral, physiological and psychological [
23]. This section focuses on the behavioral adaptation. Nicol and Humphreys [
24] made use of logistic regression analysis to predict occupant control behavior in naturally ventilated buildings. We have also adopted the logistic regression method to predict the window opening and fan use in the living room. The relationship between the probability of windows open or fan use (
p) and the indoor or outdoor temperature (
T) is of the form:
where exp (exponential function) is the base of natural logarithm,
b is the regression coefficient for
T, and
c is the constant in the regression equation.
The following regression equations were obtained in between the window opening or fan use and temperatures for NV mode.
Fan use:
where
Ti is indoor air temperature (°C),
Tg is indoor globe temperature (°C),
To is outdoor air temperature (°C) and
R2 is Cox and Snell
R2.
These equations are shown in
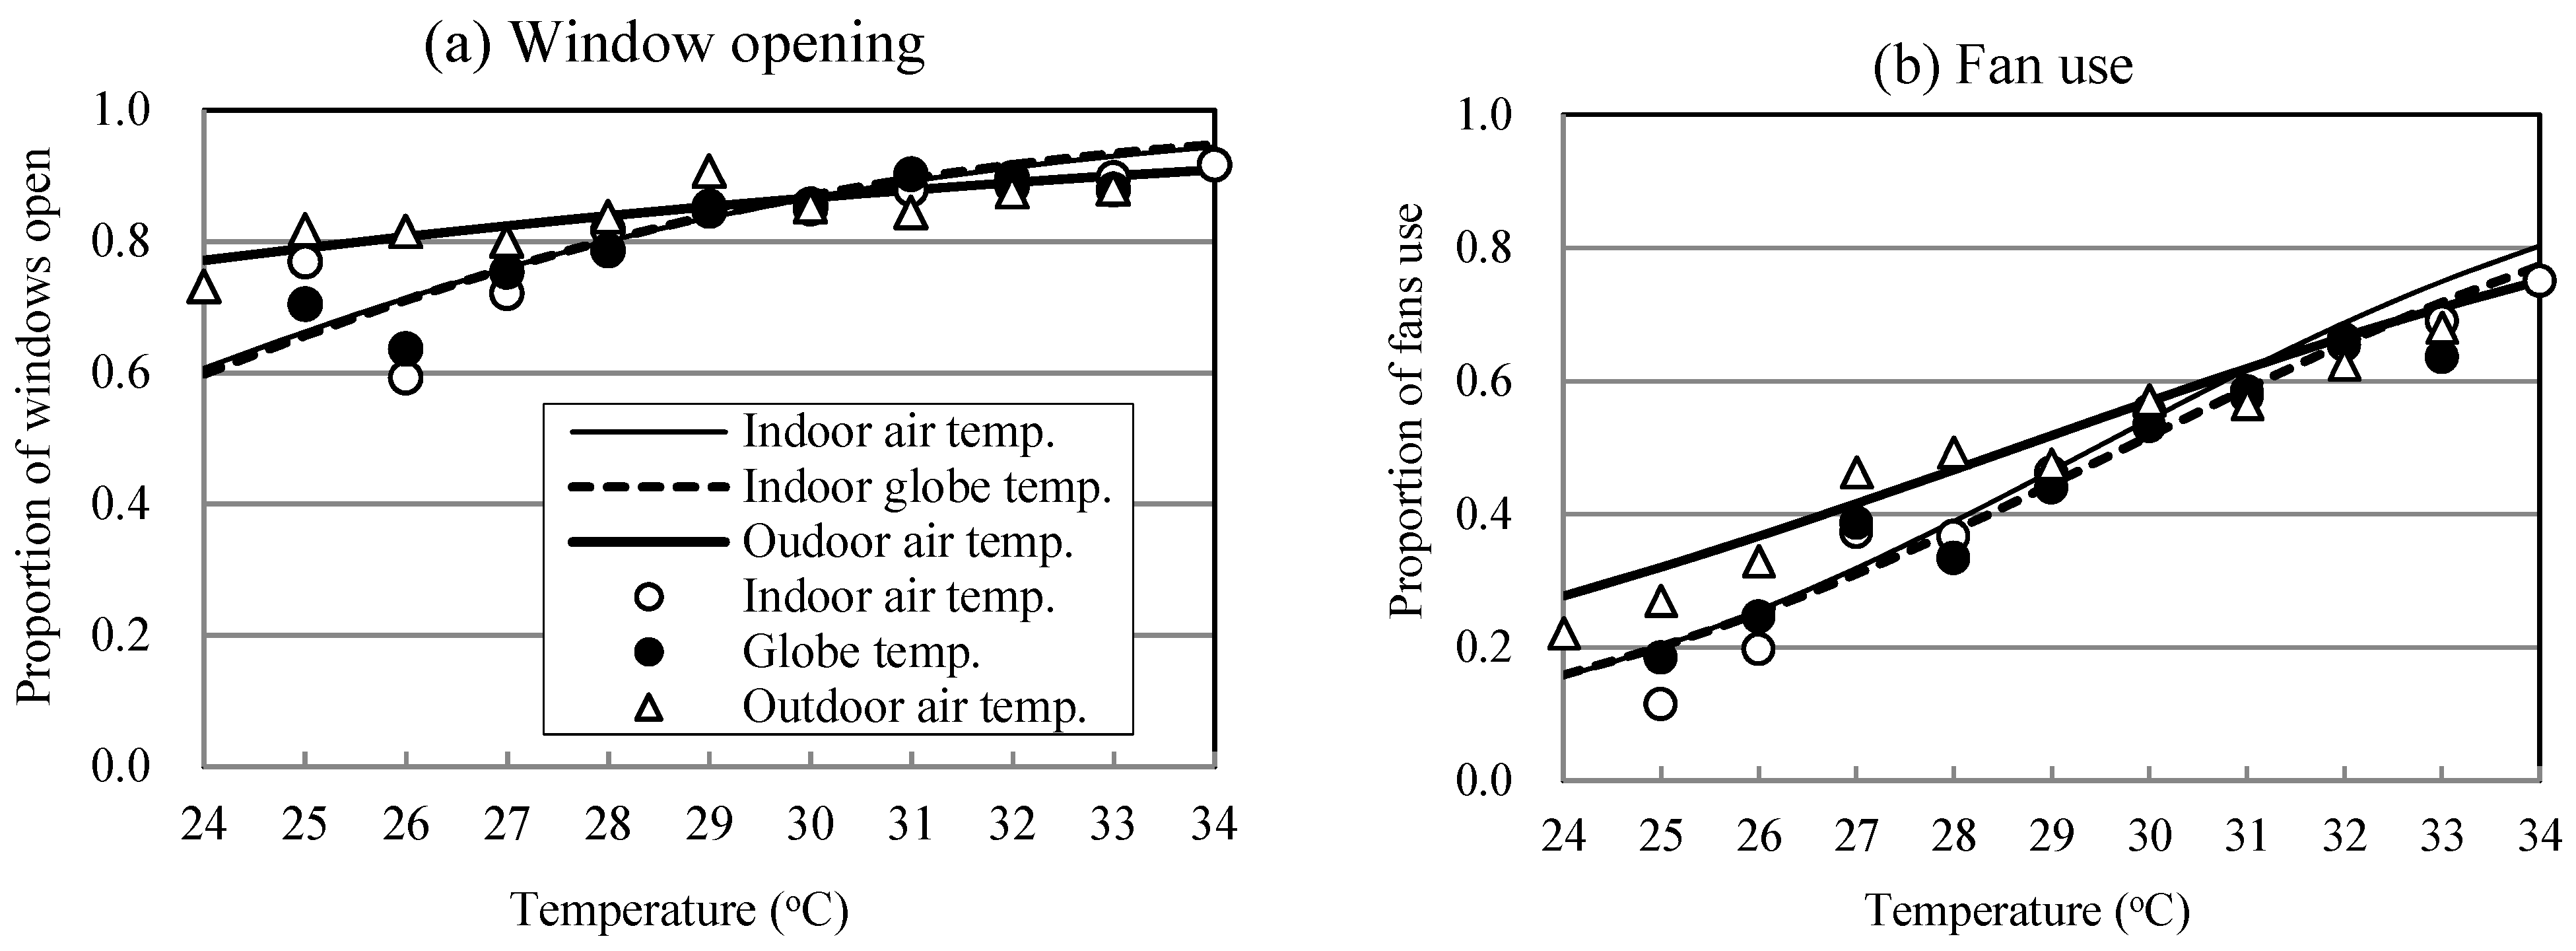
Figure 9. The predicted window opening or fan use is well matched with the measured values. The proportion of window opening or fan use is increased when temperature rises. The window opening behavior is similar to the previous research [
5,
18].
The regression coefficient for indoor air temperature or globe temperature is higher than the outdoor air temperature. It seems that the occupants respond more closely to the indoor temperatures than outdoor air temperature while operating the windows and fans.
Window opening and fan use might be important to increase the air movement and lower the indoor air temperature. Window opening is effective at increasing the indoor comfort temperature [
5,
25]. Theoretically, if wind velocity is 1 m/s, the indoor comfort temperature can be increased by some 3 or 4 °C [
12,
26,
27]. Nicol [
12] found that the presence of air movement can be equivalent to a reduction in indoor temperature of as much as 4 °C. When outdoor running mean temperature is 30 °C, the indoor comfort temperature when the fan is on is 31 °C which is 2.2 °C higher than when the fan is off [
18,
27].
Thus, the results showed that residents undertake behavioral adaptation to regulate their hot and humid thermal environment.
Figure 9.
Relation between the use of controls and temperature: (a) Window opening; (b) Fan use. Measured values were grouped for every 1 °C for indoor or outdoor air temperature. The grouped data for samples less than 10 are not shown.
Figure 9.
Relation between the use of controls and temperature: (a) Window opening; (b) Fan use. Measured values were grouped for every 1 °C for indoor or outdoor air temperature. The grouped data for samples less than 10 are not shown.


