Article

Diurnal Thermal Behavior of Pavements, Vegetation, and Water Pond in a Hot-Humid City

1
College of Architecture, Nanjing Tech University, Nanjing 211800, China
2
State Key Laboratory of Subtropical Building Science, South China University of Technology, Guangzhou 510640, China
*
Author to whom correspondence should be addressed.
Buildings 2016, 6(1), 2; https://doi.org/10.3390/buildings6010002
Submission received: 23 November 2015 / Revised: 13 December 2015 / Accepted: 21 December 2015 / Published: 24 December 2015
(This article belongs to the Special Issue Sustainable Buildings: Design for Comfort and Users)

Abstract

:
This study investigated the diurnal thermal behavior of several urban surfaces and landscape components, including pavements, vegetation, and a water pond. The field experiment was conducted in a university campus of Guangzhou, South China, which is characterized by a hot and humid summer. The temperature of ground surface and grass leaves and the air temperature and humidity from 0.1 to 1.5 m heights were measured for a period of 24 h under hot summer conditions. The results showed that the concrete and granite slab pavements elevated the temperature of the air above them throughout the day. In contrast, the trees and the pond lowered the air temperature near ground during the daytime but produced a slight warming effect during the nighttime. The influence of vegetation on air temperature and humidity is affected by the configurations of greenery. Compared to the open lawn, the grass shaded by trees was more effective in cooling and the mixture of shrub and grass created a stronger cooling effect during the nighttime. The knowledge of thermal behavior of various urban surfaces and landscape components is an important tool for planners and designers. If utilized properly, it can lead to climatic rehabilitation in urban areas and an improvement of the outdoor thermal environment.

1. Introduction

Urban areas modify the materials, the structure and the energy balance of the surface of the Earth compared with the surrounding rural areas. It is most important to recognize the thermal behavior of various urban surfaces and landscape components such as pavements, vegetation, and water bodies, because this is directly integrated with the Urban Heat Island (UHI) phenomenon and environmental aspects such as heat stress and public health.
A number of studies have been carried out to investigate the thermal performance of different types of pavements. Field experiments in Singapore showed that granite slab, terracotta bricks, and interlocking blocks gave lower surface temperatures and heat output to the environment than conventional asphalt concrete pavements [1]. Some studies demonstrated that the solar reflectance of a paved surface is a critical factor affecting its surface temperature [2,3]. A field measurement conducted in Tel-Aviv showed that asphalt paved roads and rooftops were the warmest urban elements during the daytime while exterior walls and trees had the highest surface temperatures at night [4]. Observation in subtropical Taiwan revealed that there were significant differences in air temperature among several pavements at noon time during hot summer weather [5]. In addition to studies on traditional pavements, several innovative and effective strategies for mitigating the UHI phenomenon and improving outdoor thermal environments have been proposed: the application of cool materials for roofs, facades, and pavements [6,7,8,9,10,11], the urban form and design [12], other novel solutions such as suspending white sails in the square [13]. The latest review synthesized the influence of cool pavements, such as reflective pavements and evaporative pavements, on the urban thermal environment [14].
The thermal effects of vegetation have been widely studied. Taha et al. [15] measured the micro-meteorological parameters in and around an isolated orchard in a warm climate zone. They found that, compared to the air temperature in an open field, the area beneath trees showed lower temperatures during the daytime but higher temperatures at night. Souch and Souch [16] investigated the effects of trees on air temperature and humidity in a hot-humid climate in terms of different factors such as tree species, environments, and physical characteristics of trees. The results demonstrated that temperatures were reduced and humidities were elevated under the canopies of all the trees; however, the difference between species was insignificant, and the clumps had no greater effect than the individual tree. In another project, Giridharan et al. [17] noted that, in high-rise high density urban environments, the influence of vegetation in lowering outdoor temperature was affected by the on-site variables such as sky view factor and altitude. Chow et al. [18] examined the horizontal and vertical nocturnal cooling influence of a small park with an irrigated lawn and xeric surfaces in a hot-arid city. A distinct park cool island, with mean observed magnitudes of 0.7–3.6 °C, was documented. The impacts of xeriscaping on near-surface temperatures and outdoor thermal comfort in a desert city were examined [19]. Park et al. [20] performed the outdoor measurements at a scale model site consisting of an array of concrete cubes each 1.5 m high. The quantitative effects of vegetation along the sidewalk and in median strips on the thermal environment in the summer have been extensively examined. Morille et al. evaluated the influence of various greenery types on building cooling needs and demonstrated that green walls and trees appear to be the most efficient to reduce cooling needs [21]. Tan et al. delineated two tree planting strategies for mitigating daytime UHI effects in a high-density urban environment [22]. In addition to the greenery at the street level, the environmental benefits of green roofs, such as alleviating UHI effects, reducing energy use, and improving microclimate and air quality, have also been extensively investigated [23,24,25,26].
Several studies have focused on the effects of the water features in urban space on outdoor thermal environment. Nishimura et al. [27] reported that the artificial water facilities, including a shallow pond, a small waterfall, and a spray fountain created an air temperature decline area on the leeward side. Another field measurement performed by Xu et al. [28] showed that the urban lake significantly reduced air temperature and increased humidity in the littoral zone, and such effects were gradually decreased as the distance from water increases. The investigation conducted by Tominaga et al. [29] showed that the evaporative cooling effect induced by the water surface lowered the temperature by approximately 2 °C at the pedestrian level and propagated downwind over an unobstructed distance of 100 m. Nevertheless, based on weather observations by Dutch hobby meteorologists and a station network in Rotterdam (The Netherlands), Steeneveld et al. concluded that water bodies increased rather than decreased the daily maximum UHI. That could be attributed greatly to the fact that the high heat capacity of water suppresses the diurnal and annual cycle over water, and water temperatures remain relatively high after evening and season transitions [30].
Apart from the method of field measurement, the technique of numerical simulation has also been widely used in urban microclimate study and continues to grow in popularity. Several researchers employed numerical models to conduct parametric and quantitative analyses by focusing on single environmental factor such as trees [31,32,33], the integrated effects of vegetation with other elements [34,35], and urban form and design [36,37,38]. Such studies have shown that numerical simulation is an effective and powerful method to deal with the complexities and non-linearities of urban climate systems. However, the present study is focused on the field experiment, and therefore the literature review of numerical studies is not presented in detail.
Previous studies provided deep insights into the thermal effects of pavements, vegetation, and water bodies in urban areas under different climatic conditions. However, we noticed that pavements and trees have received the most attention while water ponds, short vegetation, as well as different greenery configurations have been less studied. Besides, most studies focused on air temperature and fewer studies addressed both air temperature and humidity. In addition, most field data were merely available during the daytime, and relatively fewer data were measured during both daytime and nighttime.
The objective of the study is to perform a field measurement to investigate the effects of selected urban surfaces and landscape elements, including pavements, vegetation, and a water pond, on air temperature and humidity in a hot-humid city. The temperature of ground surfaces and grass leaves and the air temperature and humidity from 0.1 to 1.5 m heights were measured for a period of 24 h under hot summer conditions. This study aims to increase our understanding on the microclimatic effects of typical urban surfaces and landscape components in the hot and humid climate zone.

2. Material and Method
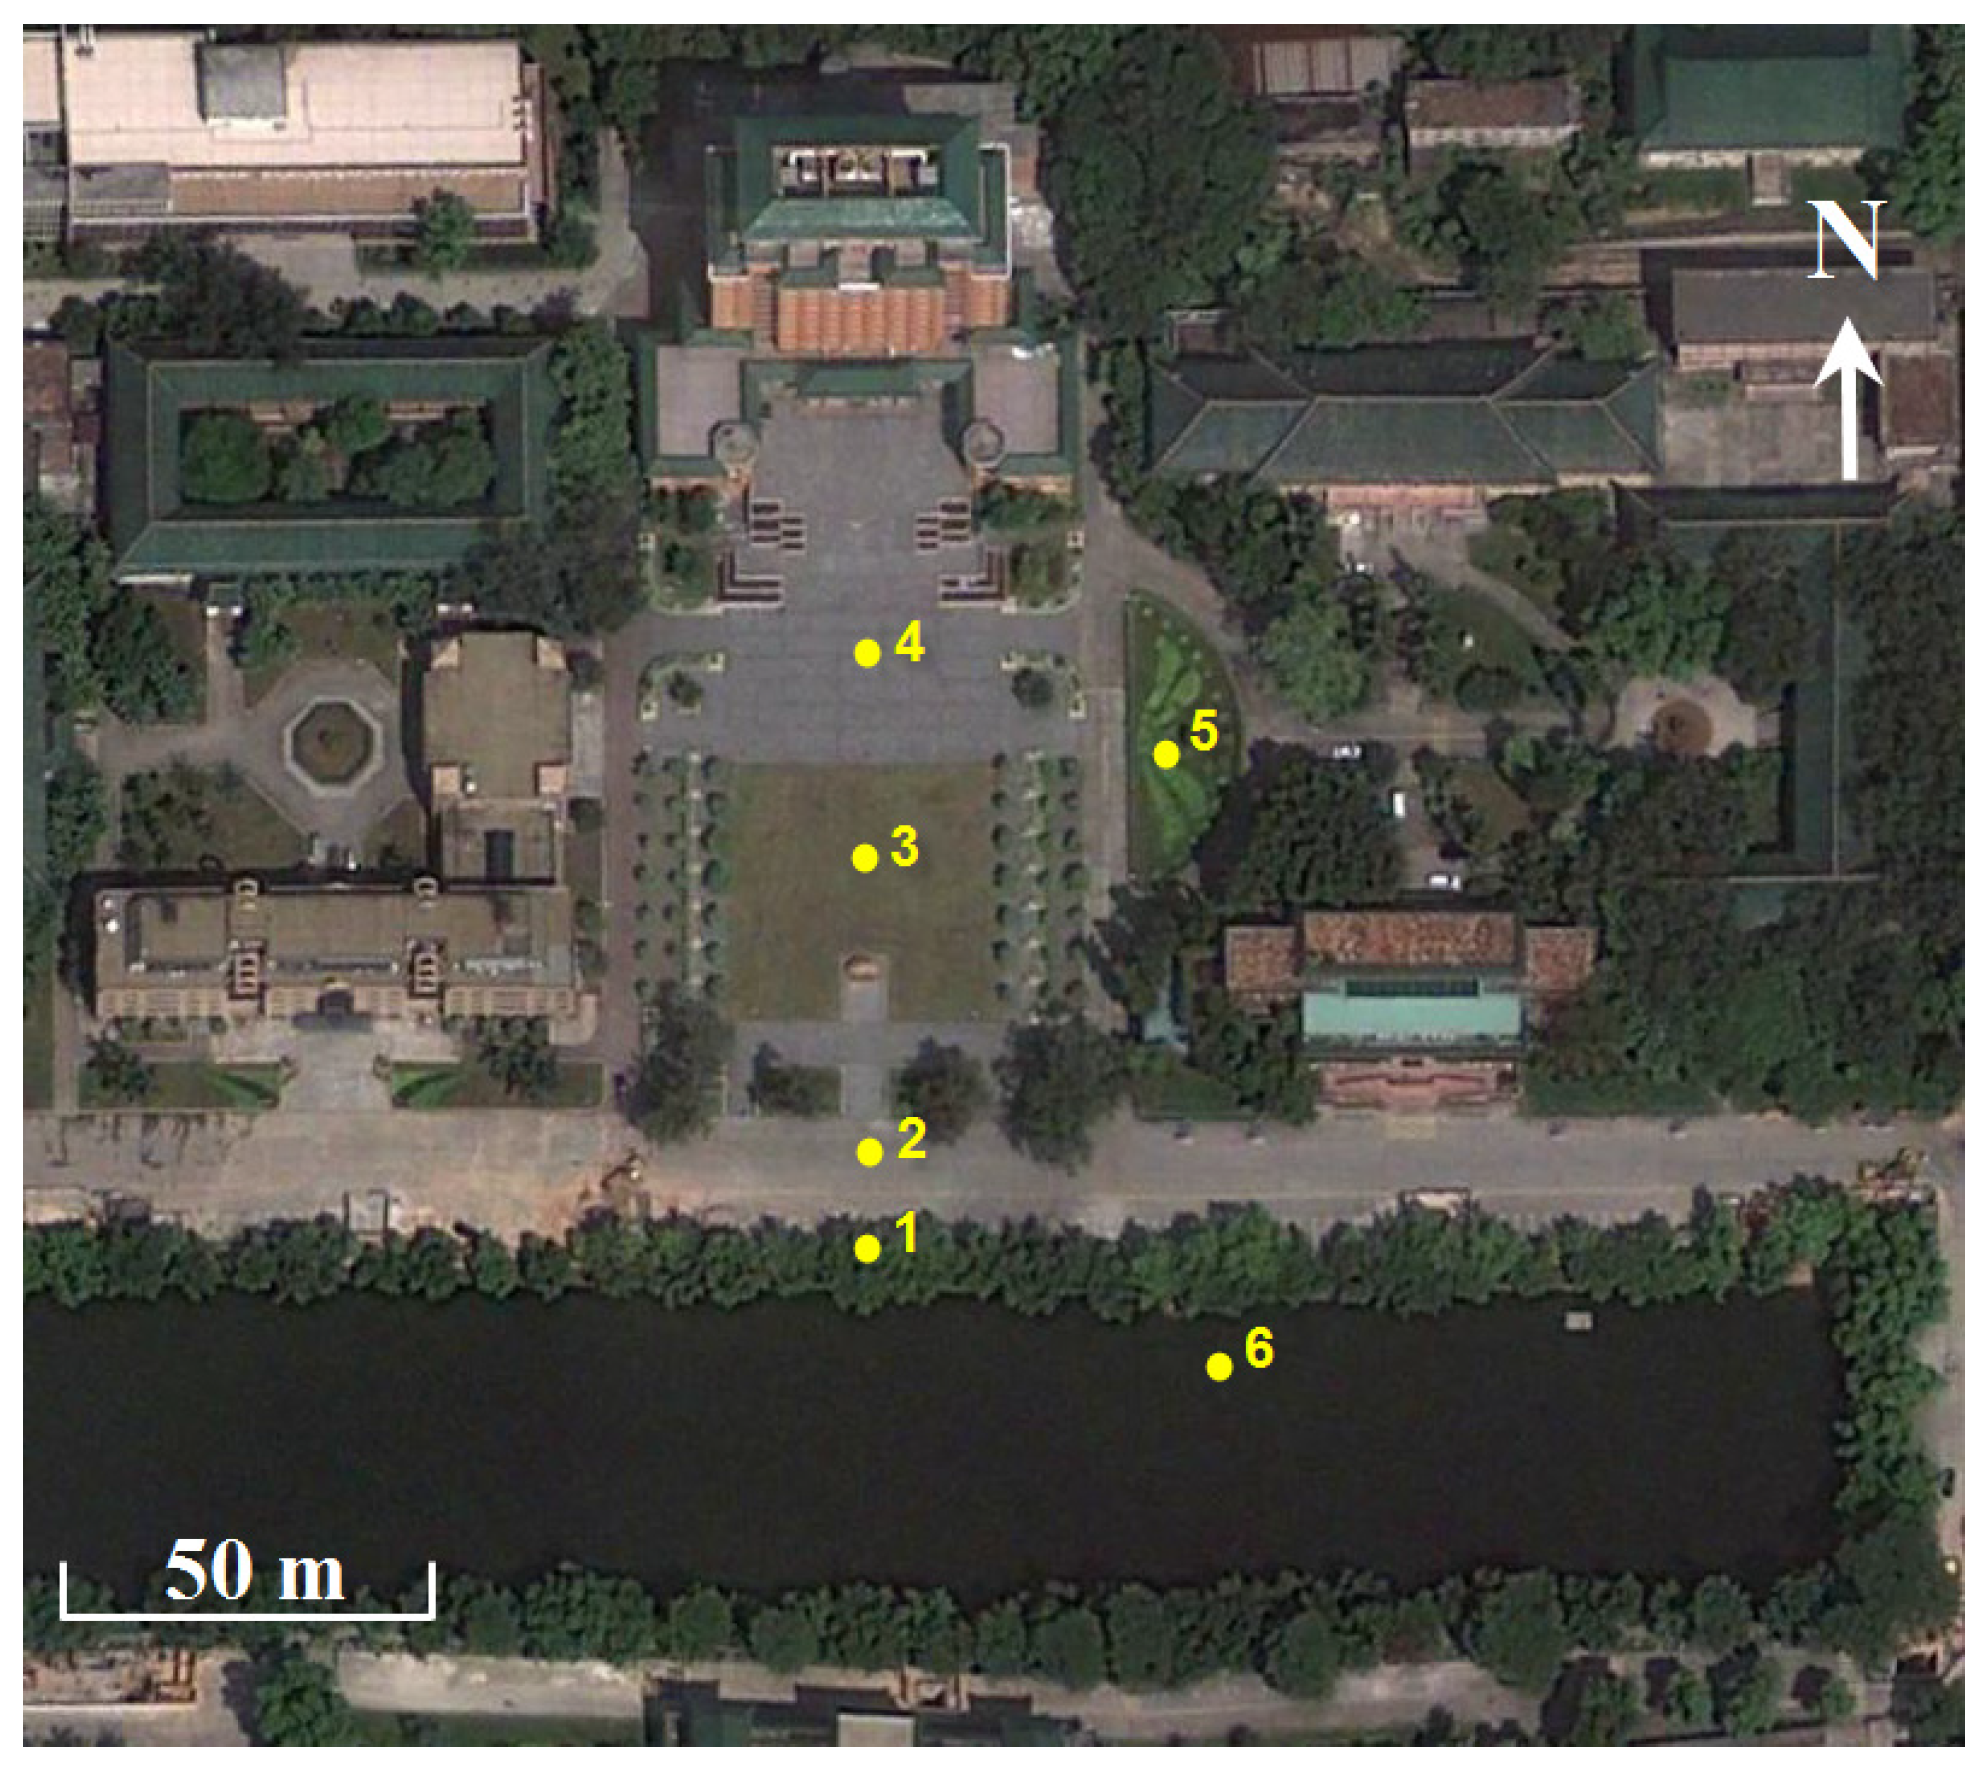
2.1. Study Area

The field measurement was conducted in Guangzhou (23°09′ N, 113°20′ E), the biggest city in the south of China with a population of more than 12 million. The climate of Guangzhou is characterized by a hot and humid summer. The statistic data of Chinese Typical Year Weather [39] show that June to September are the hottest months of the year, with daily average temperatures ranging from 27.5 to 29 °C, daily maximum temperatures ranging from 34.4 to 35.9 °C, a daily average relative humidity of around 80%, and an average wind speed of 1.6 m/s. The combined effects of high temperature and high relative humidity have made the thermal environment a major consideration in designing outdoor spaces in Guangzhou.
The experimental site is located in the campus of South China University of Technology, Guangzhou. Figure 1 shows the characteristics of the site and the locations of the six observation points. Four buildings, three-storeys tall, are located at the east and west sides, and a 12-storey building is located at the north side. These buildings form a semi-enclosed outdoor space. Such a layout, to some extent, reduces the advective exchange of heat and vapor between the studied area and its surrounding area. A pond, about 2 m deep, is located in the southern edge of the site. Banyan trees have been planted along the shore of the pond in a row, with an average height of about 9 m. Six observation points were placed in the site to collect the micro-meteorological data. Point 1 is situated beneath the trees near the north shore of the pond. The area of Point 2 is paved with concrete. Point 3 is placed at the center of the 40 m × 40 m lawn covered with short grass. The field of Point 4 is a small square paved with artificially rebonded granite slab. For the area of Point 5, low shrub (~1 m high) has been planted on the periphery and grass has been planted in the center. Point 6 is placed in the pond. The green area of the site was not watered during the period.
Figure 1. Satellite photography of the study area and the locations of six observation points (1-beneath trees, 2-concrete road, 3-short grass, 4-granite slab pavement, 5-shrub&grass, 6-pond).
Buildings 06 00002 g001

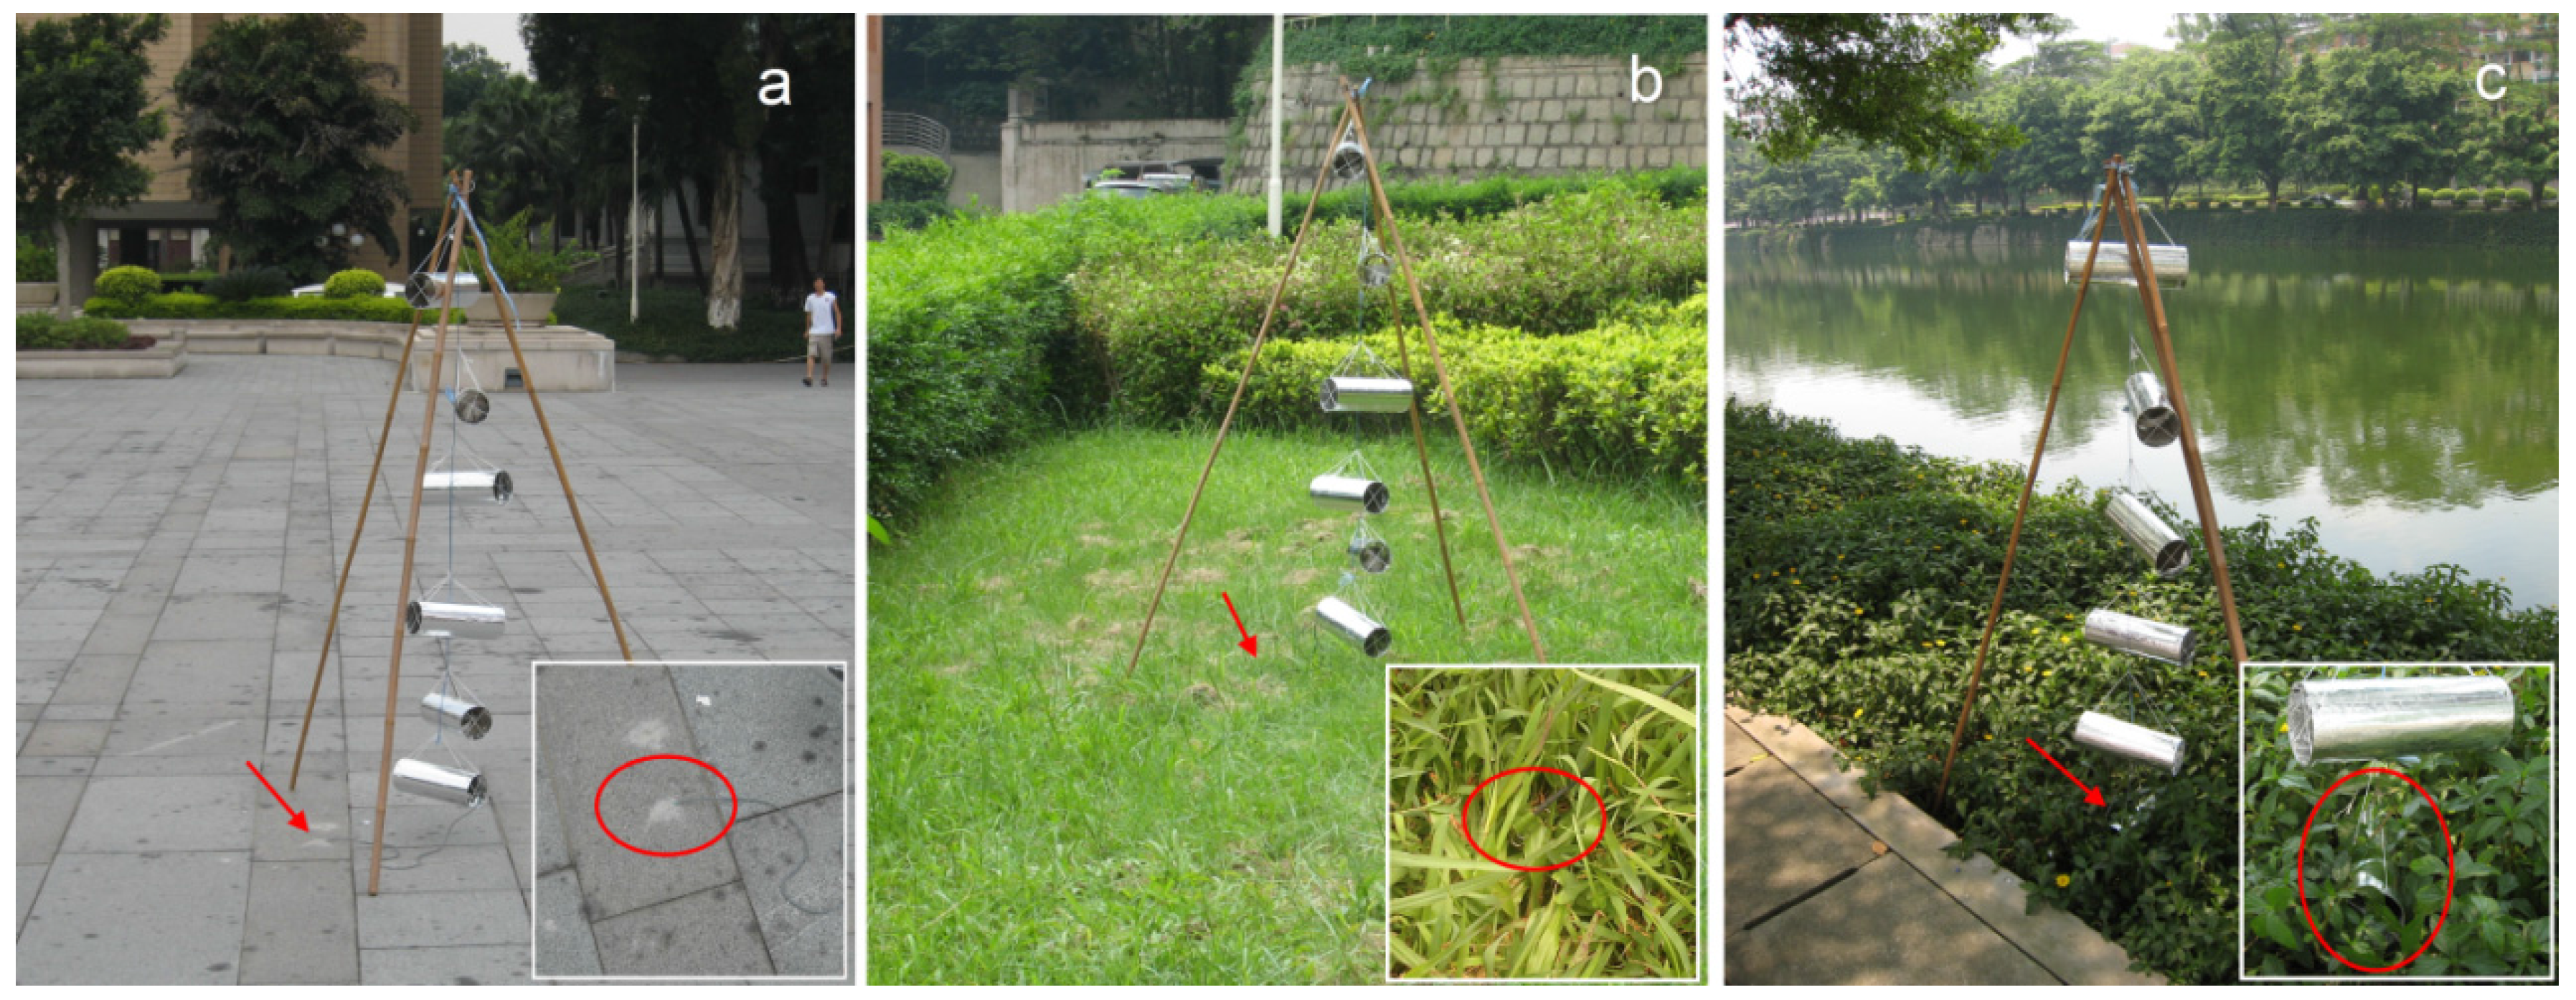
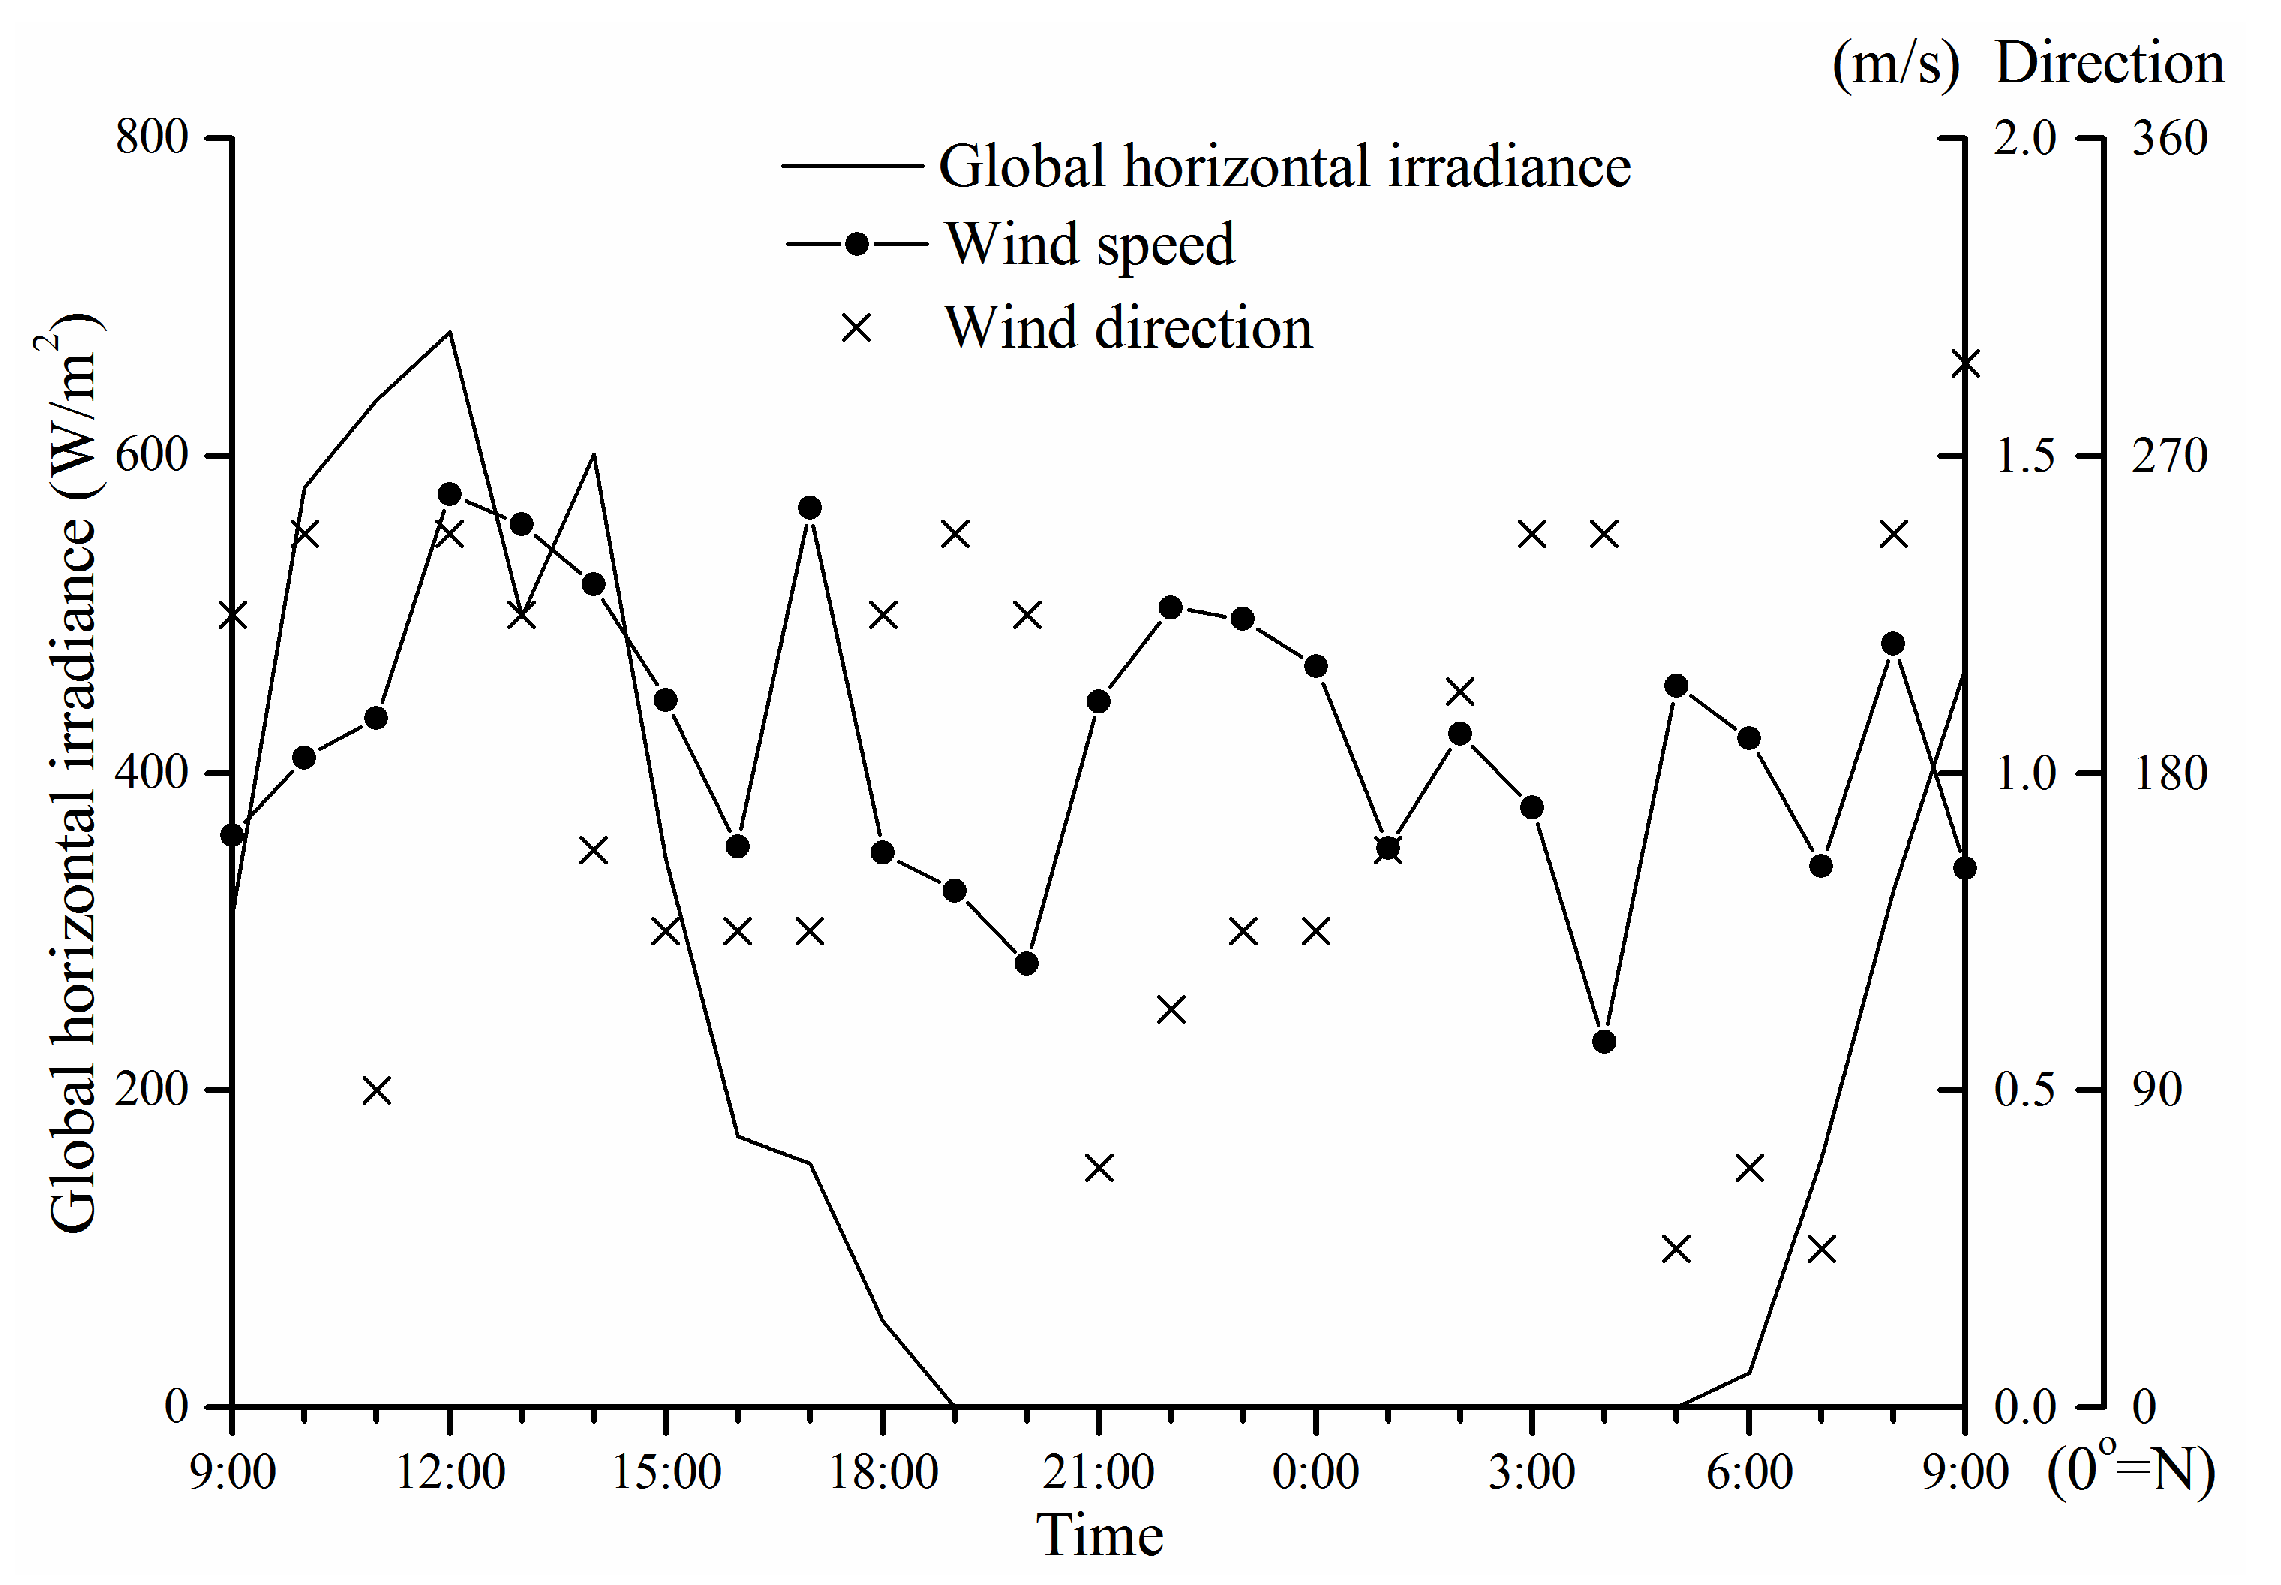
2.2. Description of Field Measurement

For each observation point, the temperature of ground surfaces and grass leaves and the air temperature and relative humidity at six heights (0.1, 0.3, 0.5, 0.8, 1.2, 1.5 m above ground) were measured simultaneously at 5 min intervals. Air temperature and relative humidity were collected using the HOBO data logger (type H08-032-08, Onset Corporation, Cape Cod, MA, USA), which has an accuracy of 0.3 K/3% RH. The HOBO data logger was mounted inside a radiation shield made by an open-ended stainless steel tube wrapped with aluminum foil, with a dimension of 18 cm in length and 10 cm in diameter. We originally thought that the space between the tube and the HOBO logger was large enough to maintain good ventilation. However, in a later experiment, we found that the temperature measured inside the home-made radiation shield was higher than the temperature measured inside a Stevenson box under the low wind speed and relatively high solar insolation conditions (with an average wind speed of 0.9 m/s and the maximum solar radiation about 686 W/m2 for the period of 08:00–16:00, the maximum error was 1.0 °C). For the present experiment, it can be concluded that the maximum error induced by the home-made radiation shield was within 1.0 °C, given that during the experimental period the maximum solar radiation was 678 W/m2 and the average wind speed was 1.1 m/s (as shown in Figure 4). In addition, since we mainly discussed the differences of air temperature and humidity between the points in the paper, the errors were to some extent reduced because all the points were affected by the shields under the same background weather conditions. Despite all that, it is strongly recommended to use Stevenson boxes or fan-aspirated shields for outdoor air temperature measurement.
The instruments were mounted on a tripod at the six predefined heights (Figure 2). The temperature of ground surfaces and grass leaves was recorded using a data logger with an external temperature probe (type BES-01, accuracy 0.5 K, Harbin Institute of Technology, Harbin, China). For the concrete and granite slab pavements, heat sink paste was used to enhance the thermal contact between the probe and the surface, and aluminum foil tape was used to fix the probe. Then a thin layer of powder concrete was placed over the foil tape to make it thermally look like the real concrete/granite slab surfaces (Figure 2a). For the open lawn covered with short grass (Point 3), the surface soil temperature was measured by inserting the probe into the soil about 1 cm deep. We collected the grass leaf temperature at Point 4 by wrapping the probe with a live grass blade and fixing it with a paper clip (Figure 2b). The surface water temperature of the pond was measured by submerging the probe in the water about 1 cm deep. There are two types of ground surface beneath the trees near the shore of the pond: the part near the pond, about 1.5 m wide, was covered with shade-loving grasses (~15 cm high), and the opposite side is sidewalk paved by interlocking blocks. It can be seen in Figure 2c that the data logger at 0.1 m height is located in the canopy of the grass cover.
Figure 2. Details of the measurements for air temperature/humidity profiles, surface temperature, and grass leaf temperature: (a) granite slab pavement; (b) shrub + grass; and (c) beneath trees.
Buildings 06 00002 g002
The field measurement was performed during a 24 h period from 9:00 LT of 25 July to 9:00 LT of 26 July 2008. The meteorological conditions of the experimental period, including air temperature, relative humidity, global horizontal solar radiation, wind speed, and wind direction, are presented in Figure 3 and Figure 4, respectively. The meteorological data was obtained from the Guangzhou National Weather Station, which was 800 m northwest of the study area. It was observed that the weather condition during the period was cloudless and hot, with temperatures ranging from 27.6 to 36.2 °C, relative humidity ranging from 44% to 84%, and quite light wind—less than 1.5 m/s. The experimental day can be considered as a typical summer day of Guangzhou, compared with the statistical characteristics from Chinese Typical Year Weather data for the period from June to September (Section 2.1).
Figure 3. Air temperature and relative humidity from the nearby meteorological station (25–26 July 2008).
Buildings 06 00002 g003
Figure 4. Solar radiation and wind velocity from the nearby meteorological station (25–26 July 2008).
Buildings 06 00002 g004

3. Results and Discussion

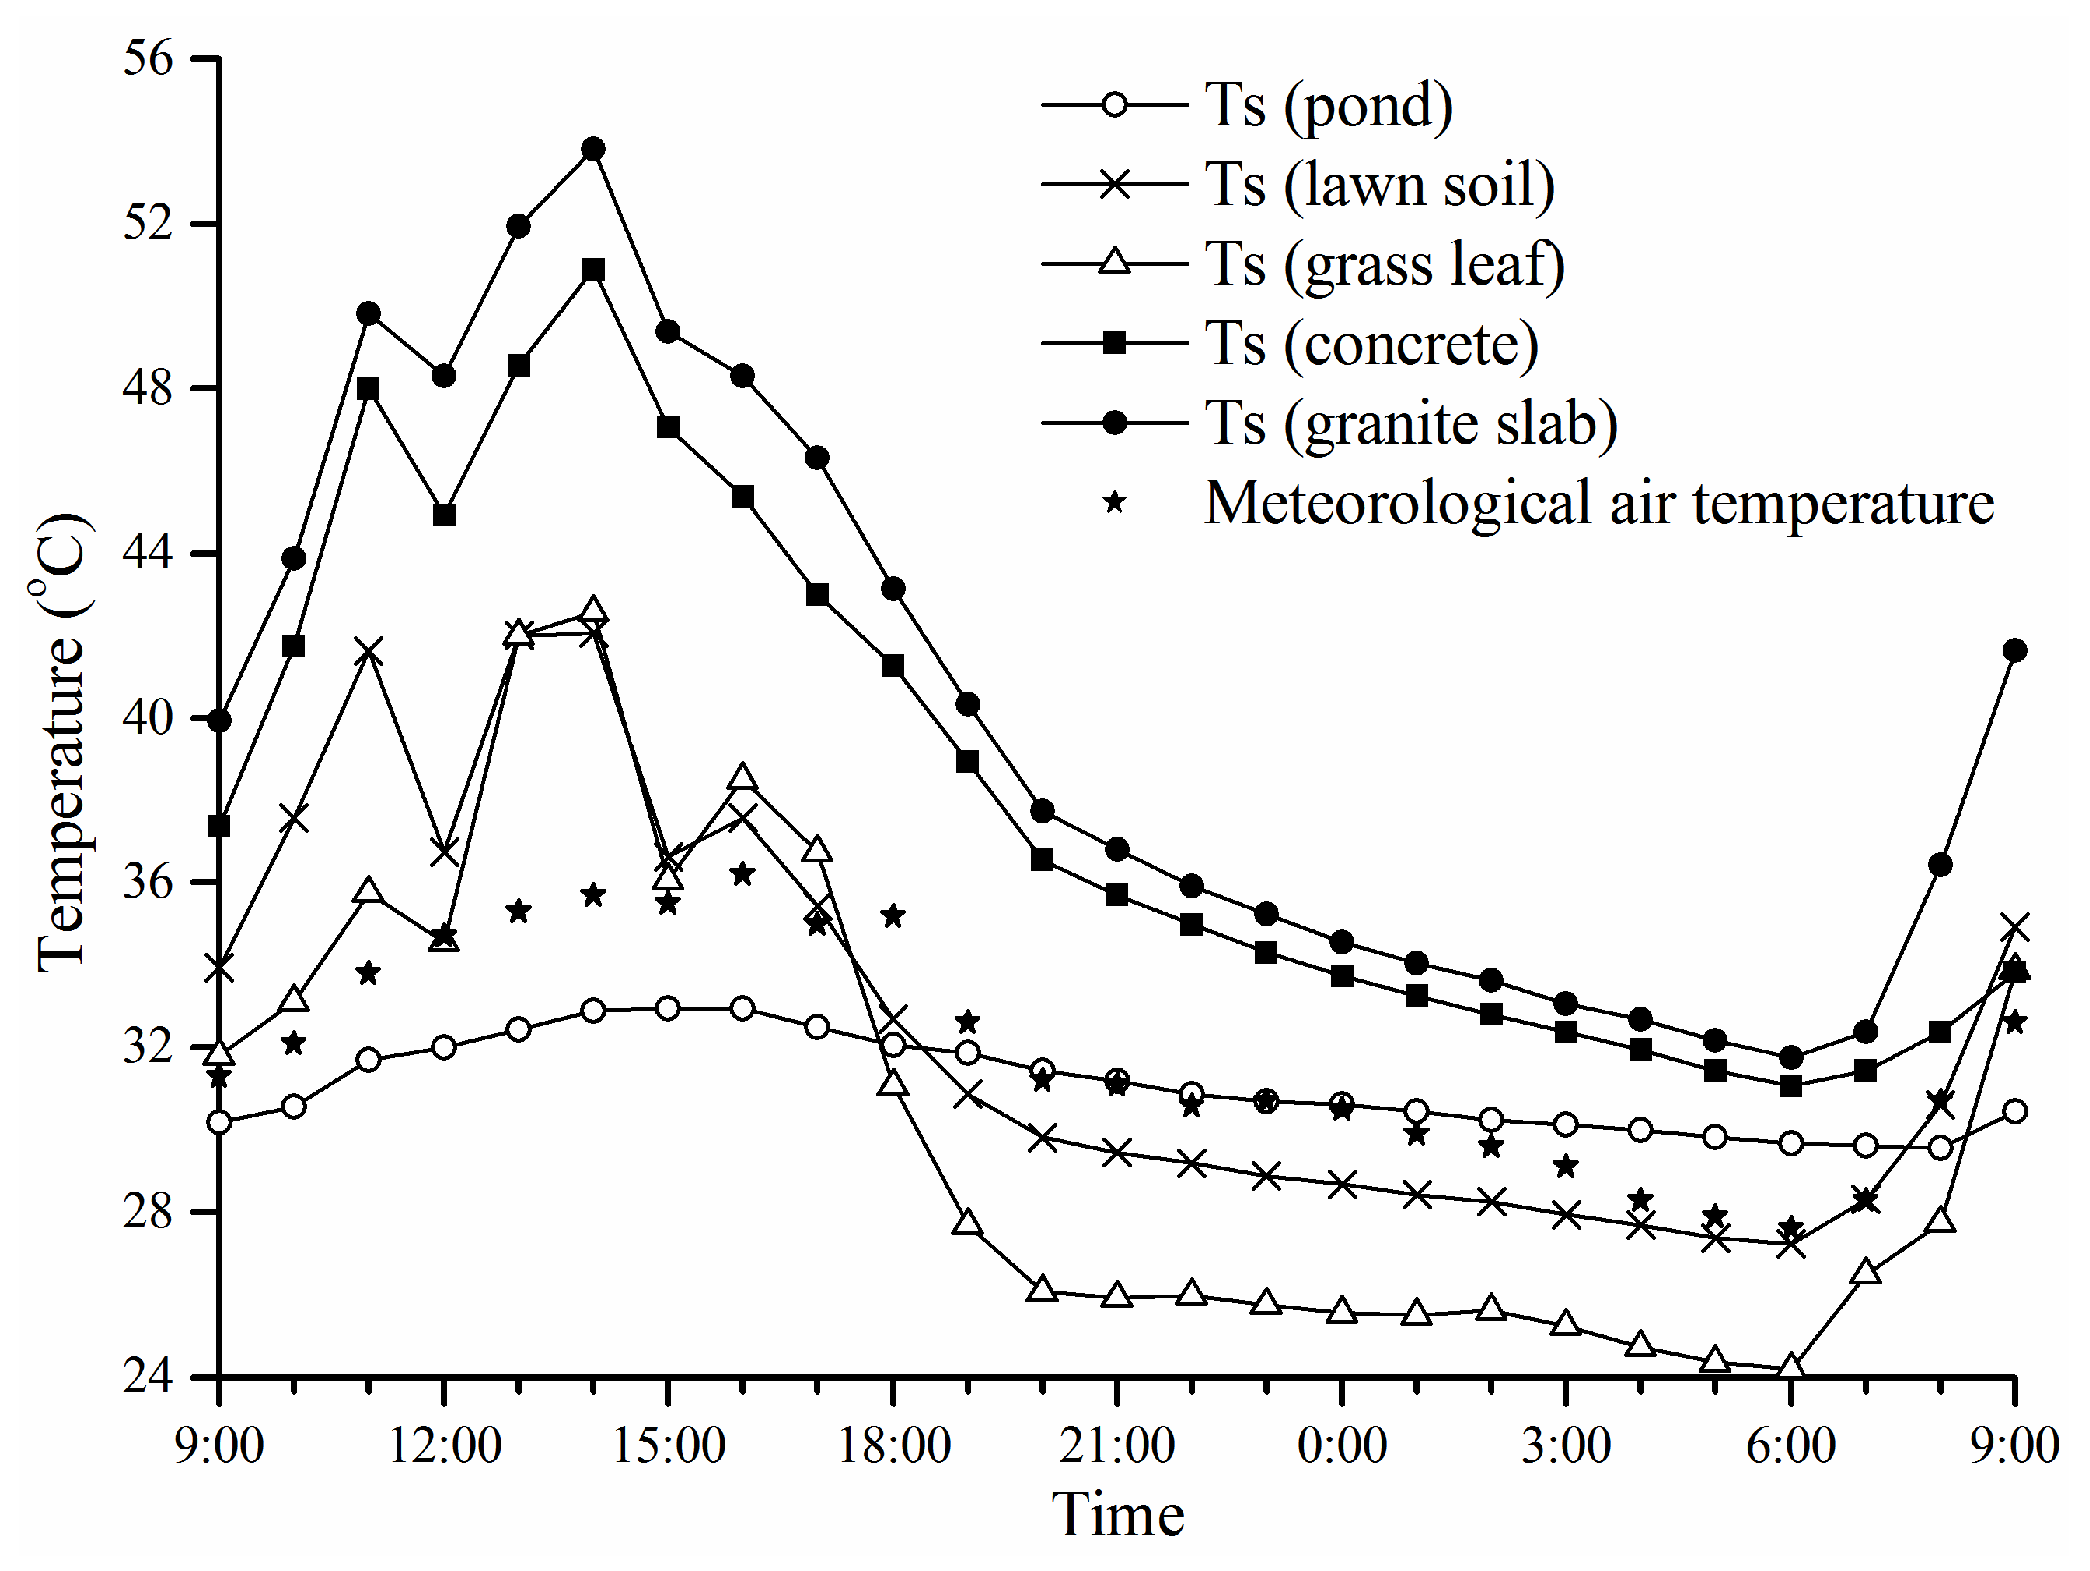
3.1. Surface Temperature

Figure 5 presents the surface temperature of the studied objects and the meteorological air temperature over the period. The data showed that the surface temperatures of the concrete and granite slab pavements were significantly higher than those of the other surfaces throughout the period, with midday temperatures above 50 °C. The surface lawn soil and the grass leaves were hotter than the pond surface during the daytime but cooler during the nighttime. During the night and morning hours (18:00–12:00), it was observed that the grass leaves were significantly cooler than the soil surface, with an average temperature difference of 3 °C.
Further comparisons between the surface temperatures and the meteorological air temperatures show that: (1) the surface temperatures of the concrete and granite slab pavements were significantly higher than the air temperature throughout the period with maximum temperature differences of 15.2 and 18.1 °C at 14:00, respectively; (2) the surface temperatures of the soil and grass leaves were generally higher than the air temperature during the daytime (09:00–17:00) but lower for the rest of the period; and (3) the surface water temperatures of the pond were evidently lower than the air temperature during the daytime (08:00–19:00) with a mean temperature difference of 2.2 °C, but higher than the air temperature for the rest of the period with a mean temperature difference of 0.8 °C.
Based on the above comparisons and the well-documented heat transfer processes of ground surfaces, some characteristics of the thermal performances of the studied surfaces under sunny and hot weather conditions could be deduced: (1) given the fact that the surface temperature of the pavements was significantly higher than the air temperature throughout the day and there was no evaporation, the concrete and granite slab pavements exposed to direct solar radiation released sensible heat to the atmosphere by convection and radiative emission throughout the day, and consequently elevated the temperature of the atmosphere above them; (2) compared to the paved surfaces, the open lawn released less amount of sensible heat to the atmosphere during the daytime, and cooled the atmosphere after sunset; and (3) evidently, the pond lowered the air temperature during the daytime but decreased the cooling rates of the atmosphere during the nighttime (especially after midnight) due to the high heat capacity of water.
Figure 5. Surface temperature (Ts) variations for the studied surface types during the period. For the lawn soil and the pond, surface soil temperature and surface water temperature were measured.
Buildings 06 00002 g005

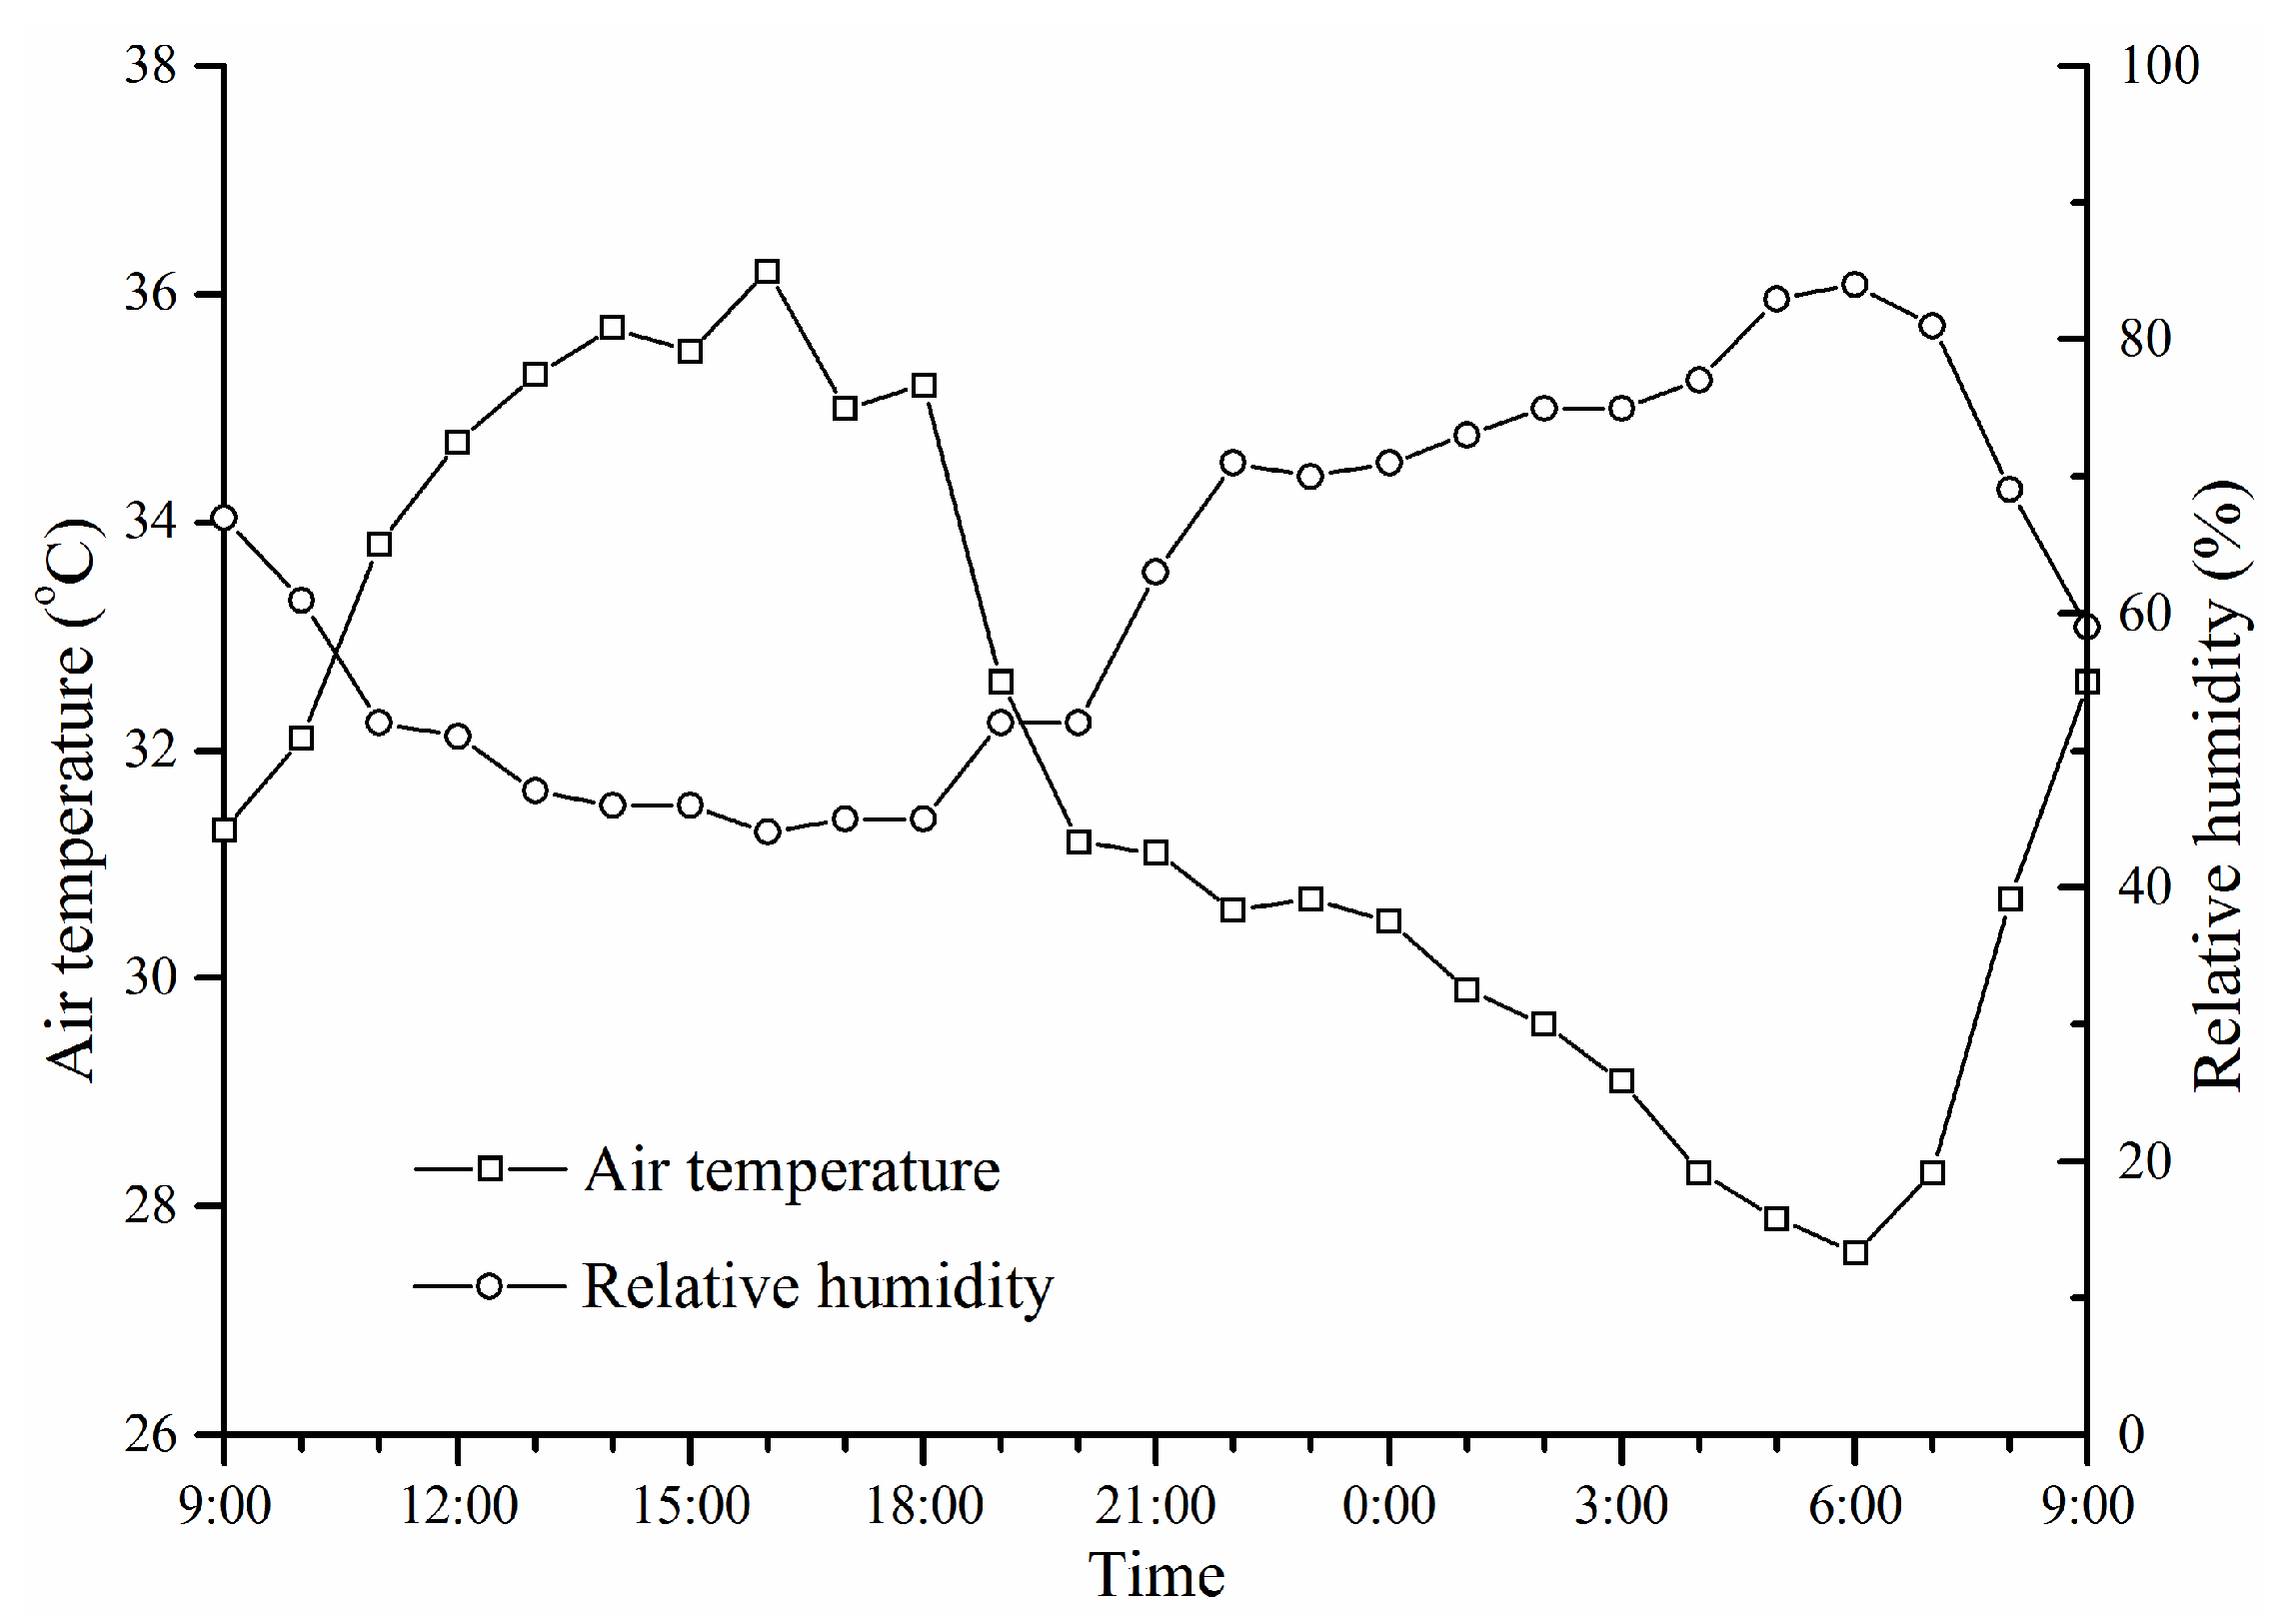
3.2. Air Temperature

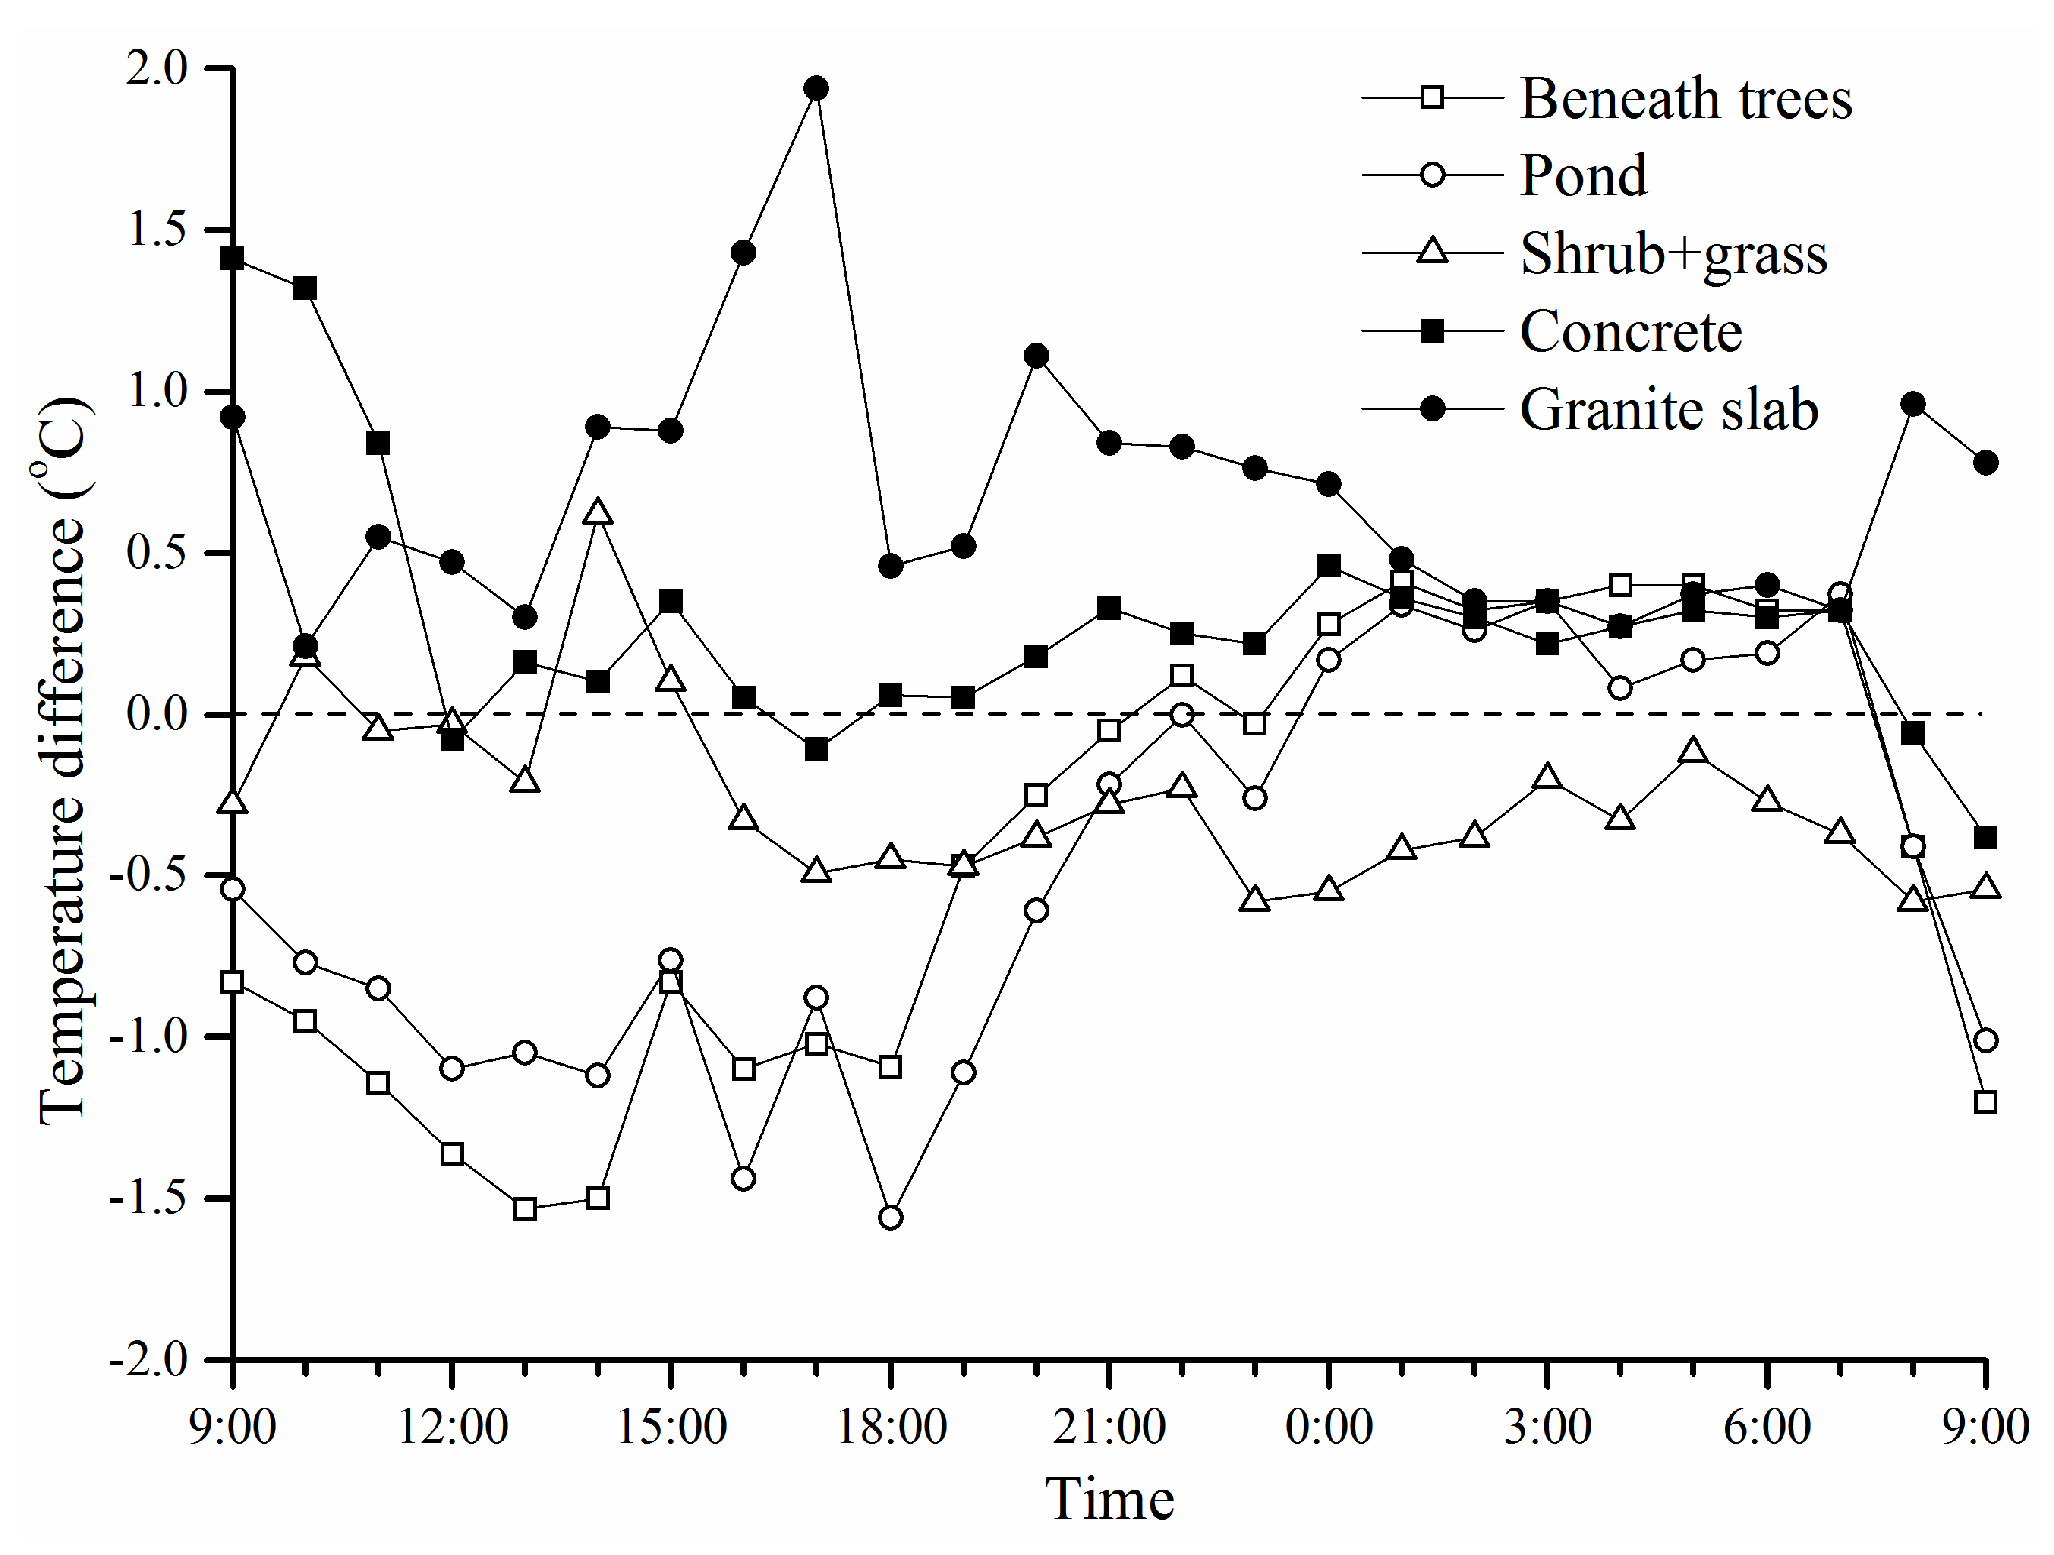
3.2.1. Differences in Air Temperature at 1.5 m above Ground

Considering that a typical meteorological observation station should be located on a flat open area covered by short grass, we used the data from Point 3 (the open lawn covered with short grass) as the reference temperature in this study. Then, the time-series temperature data from the other points were compared to the data from Point 3 to analyze the distinct effects of different landscape components on air temperature.
Figure 6 presents the differences in air temperature at 1.5 m above ground between the points and the reference point. The data indicated that the areas paved with granite slab and concrete were generally hotter than the lawn throughout the period with maximum temperature differences of up to 1.9 °C and 1.4 °C, respectively. The area of mixture of shrub and grass was cooler than the open lawn after 16:00 and throughout the night, with an average temperature difference of 0.4 °C. This is most likely because the leaf temperature was lower than the air temperature during the nighttime (as shown in Figure 5), and therefore, the mixture of shrub and grass, which has a relatively high leaf area density compared to the short grass lawn, produced a better cooling effect on the surrounding air. It is clear that the air temperatures beneath the trees and over the pond were significantly lower than that of the open lawn during the period 8:00–20:00, with a maximum reduction of temperature approaching 1.5 °C in the afternoon. This could be attributed to evaporation from the water surface and shade and evapotranspiration from the trees. However, we observed that the temperatures beneath the trees and above the pond were slightly higher than that of the open lawn from midnight to sunrise. For the space beneath the trees, the diurnal patterns of warmer nighttime temperatures and cooler daytime temperatures compared to the open lawn area are similar to the patterns documented in the previous studies [15,16]. They demonstrated that the nocturnal warming beneath trees was likely caused by wind speed reduction and smaller sky view factors. For the pond, the nocturnal warming effect could be related to the fact that the surface water temperature is higher than the air temperature during the nighttime (as shown in Figure 5) because of the high heat capacity of water.
Figure 6. Differences in air temperature at 1.5 m above ground between the points and the reference point (Point 3-the open lawn).
Buildings 06 00002 g006

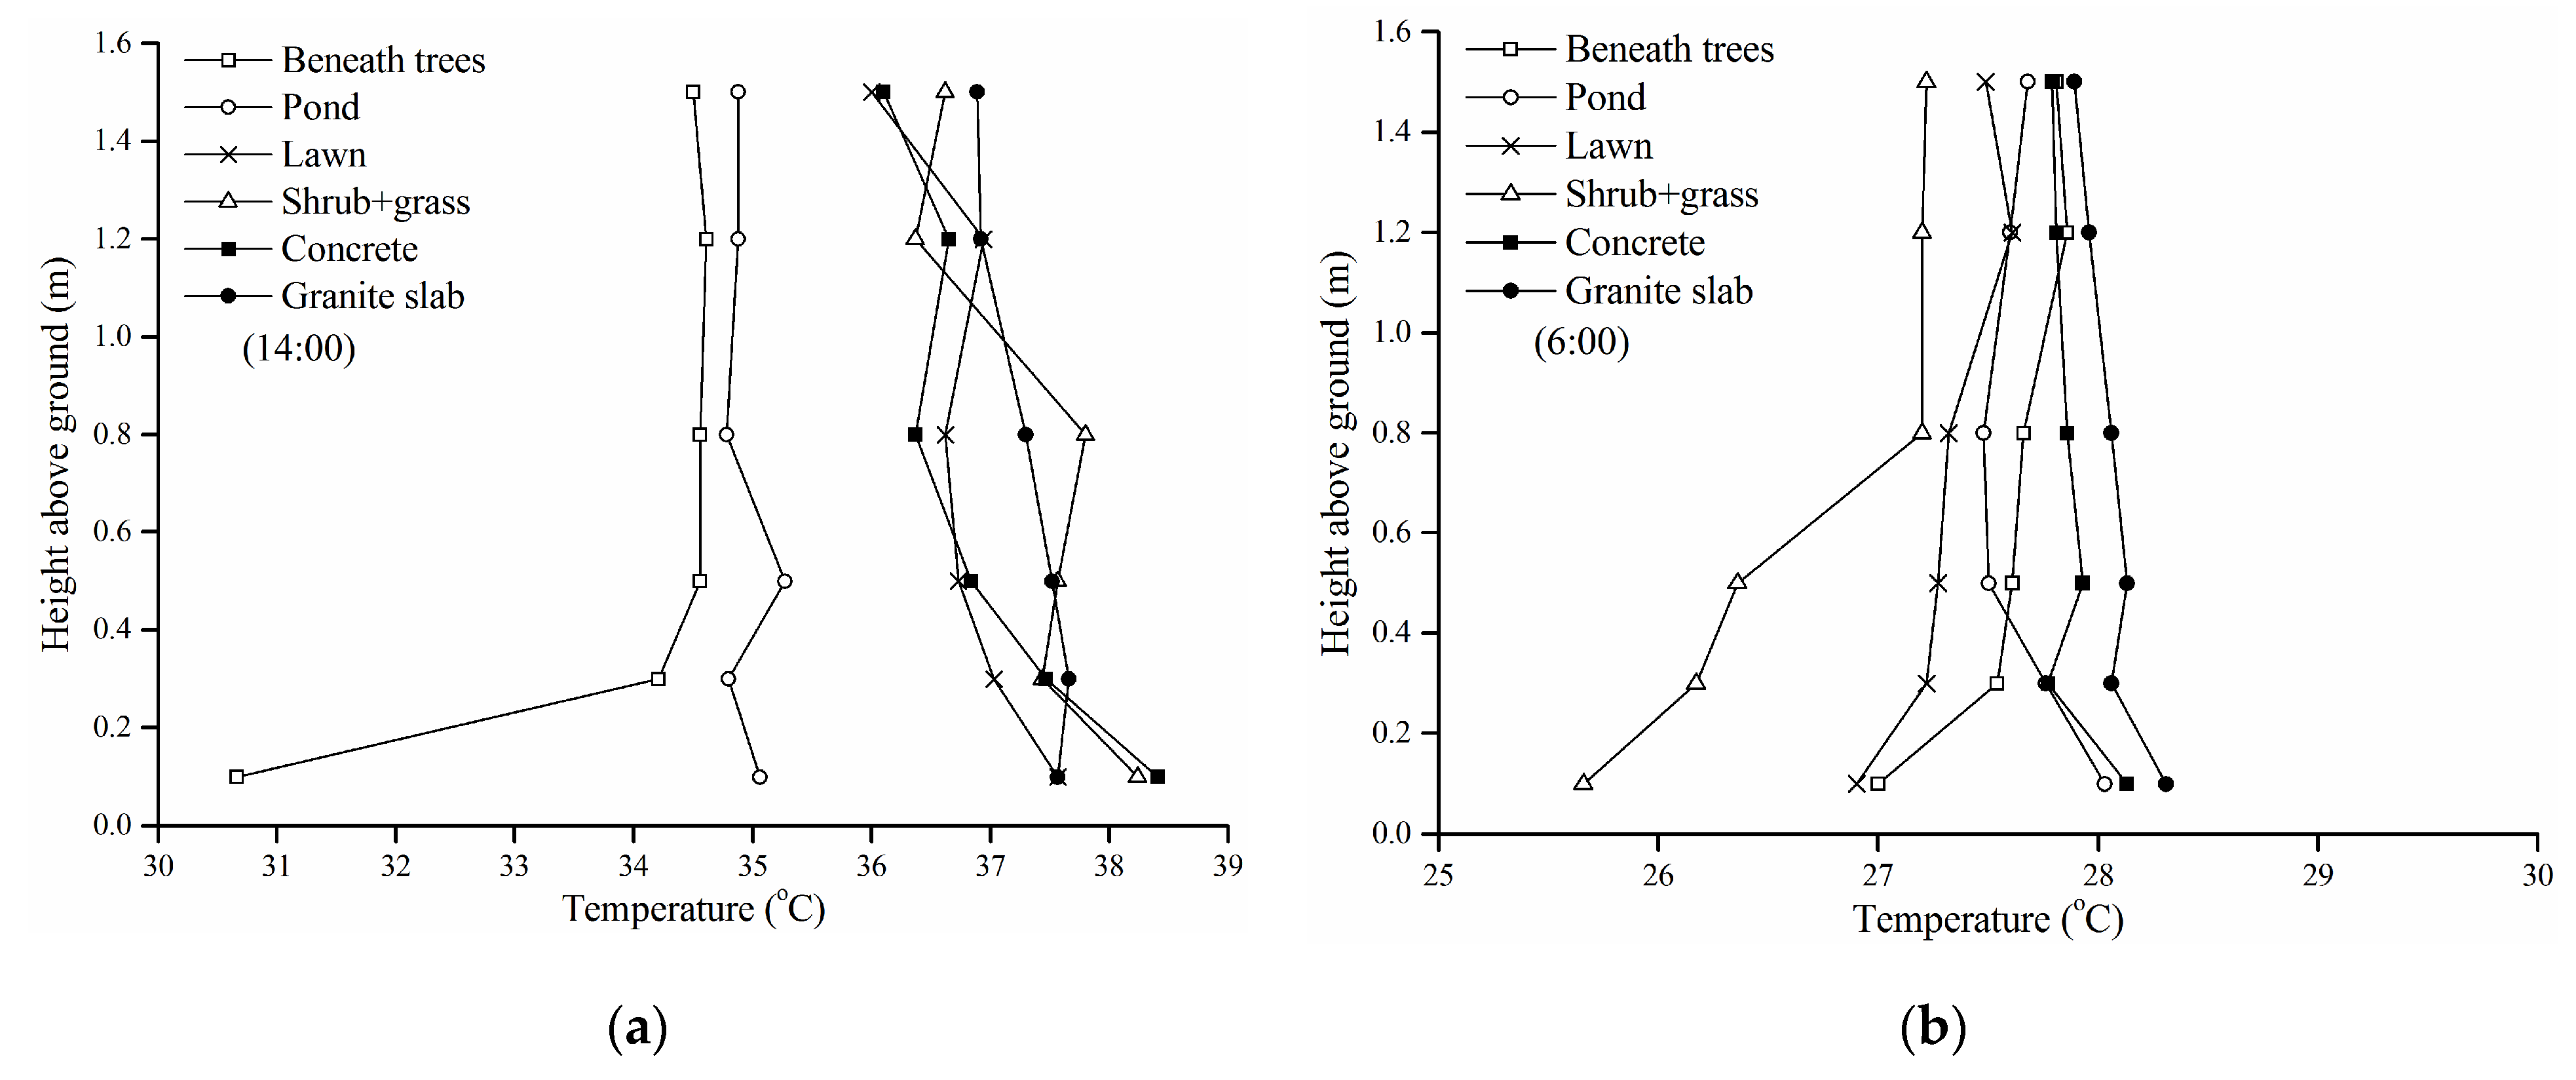
3.2.2. Vertical Profiles of Air Temperature

Figure 7 presents the vertical temperature profiles at 14:00 and 6:00 for each surface. From the data at 14:00, it can be seen that the areas above the pond and beneath the trees had considerably lower temperatures at all the heights than the other locations and had near-neutral atmosphere layers from 0.3 to 1.5 m. Another noticeable observation was that there was a sharp temperature drop at 0.1 m level under the trees. That implies the grass shaded by trees had a strong cooling effect in the hot afternoon as the temperature measured at 0.1 m level under the trees is actually the canopy temperature of the grass (see Figure 2c). A field measurement conducted in a hot dry region also showed that the shaded grass produced a greater cooling than the unshaded grass [40]. For the granite slab, the concrete, the lawn, and the mixture of shrub and grass, it was observed that there were no significant differences in temperature at all the heights at 14:00 among them, and slightly unstable atmosphere conditions from 0.1 to 1.5 m above these surface appeared.
The temperatures at 6:00 indicated that the differences among the locations were greater at lower heights and smaller at higher heights. At 6:00, clear temperature inversions were found over the green areas (open lawn, grass under trees, shrub + grass) while slightly unstable atmospheric conditions were found above the paved surfaces (granite slab, concrete) and the pond. Another noticeable observation at 6:00 was that the mixture of shrub and grass had a sharp temperature inversion from 0.1 to 0.8 m, implying the significant cooling effect produced by the combination of shrub and grass during the nighttime.
Figure 7. Vertical temperature profiles for each location at 14:00 (a) and 6:00 (b).
Buildings 06 00002 g007

3.3. Air Humidity

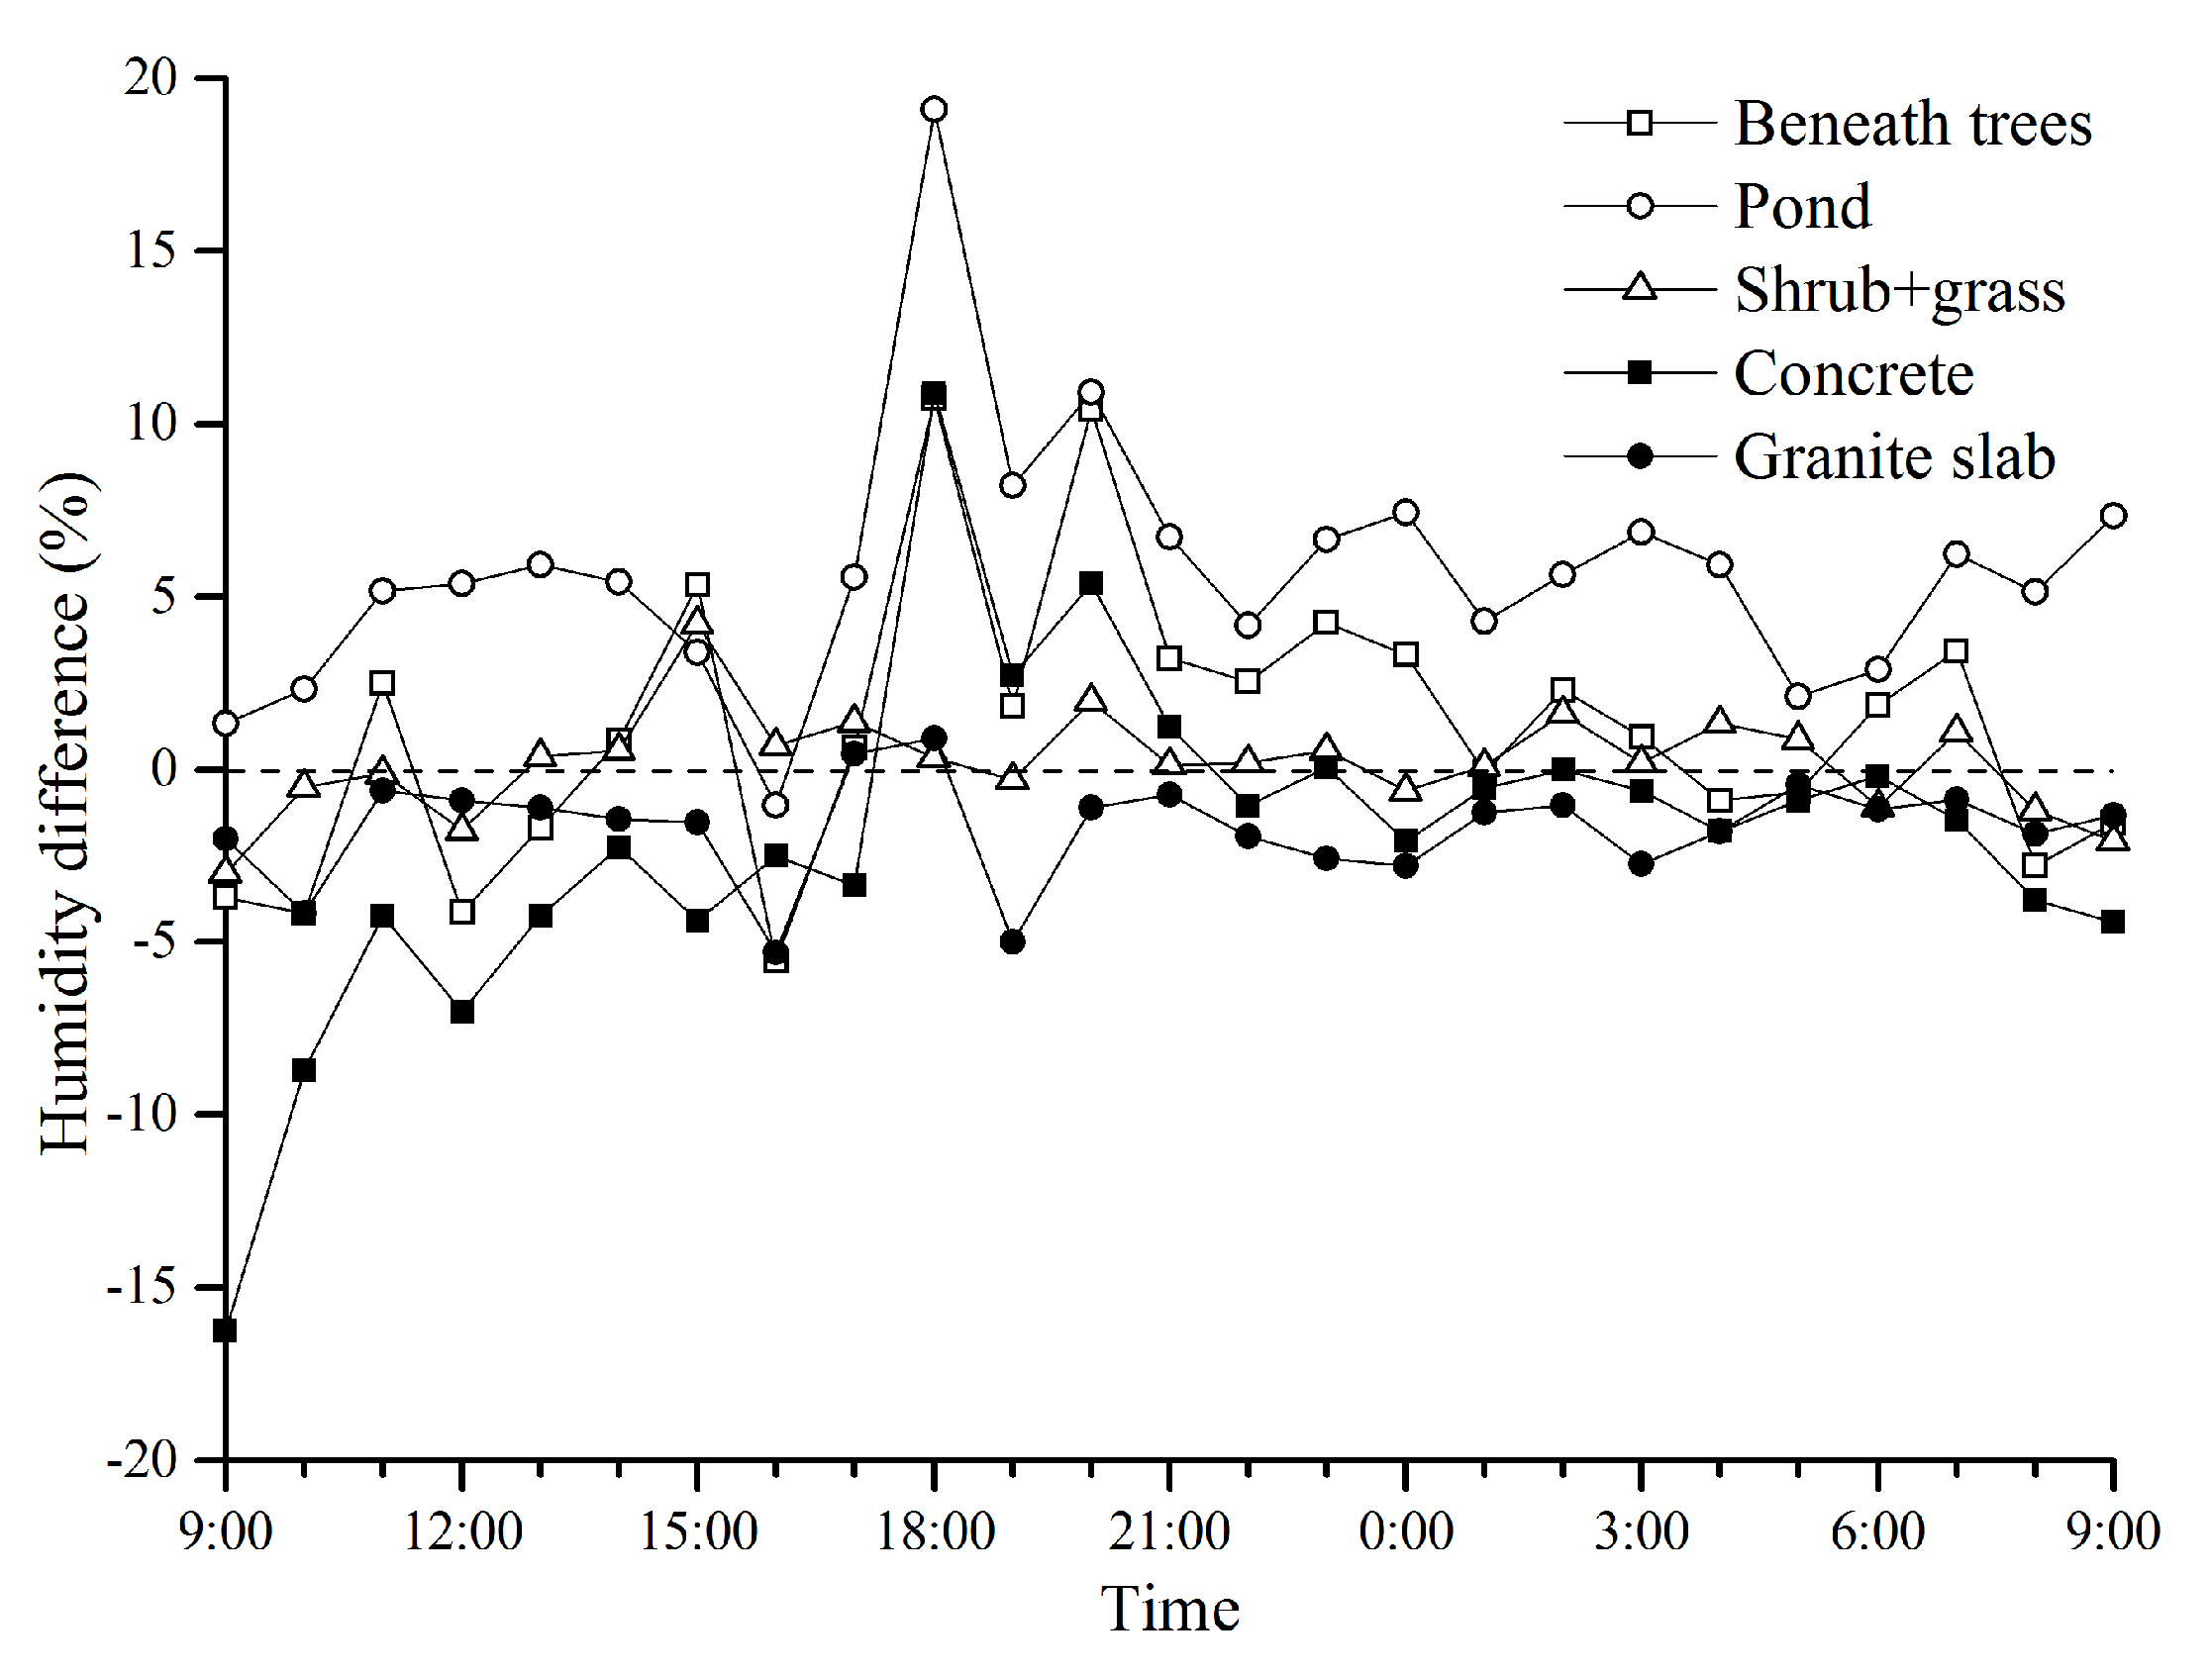
3.3.1. Differences of Air Humidity at 1.5 m above Ground

Similar to the analysis of air temperature differences in Section 3.2.1, the specific humidity at 1.5 m level at Point 3 (the open lawn) was used as the reference humidity and compared with those of the other points. For comparative study, the observed relative humidity was converted to specific humidity according to the measured air temperature by assuming a pressure of 1 atmosphere. Figure 8 presents the percentage differences in specific humidity at 1.5 m level between the points and the reference point. It was observed that the area above the pond had the highest humidity values for most of the period. On the average for the period, the humidity above the pond was 6% higher than that above the open lawn. The result indicated that the pond increased the humidity of the atmosphere above it during both daytime and nighttime in hot summer. The humidity beneath the trees was also higher than that above the open lawn for most of the period. This could be created by a synergistic humidifying effect of the vegetation and the adjacent pond. Not surprisingly, humidity above the impervious concrete and granite slab pavements was generally lower than that of the lawn. There was no significant difference in air humidity between the open lawn and the mixture of shrub and grass.
Figure 8. Differences in specific humidity at 1.5 m above ground between the points and the reference point (Point 3-the open lawn).
Buildings 06 00002 g008

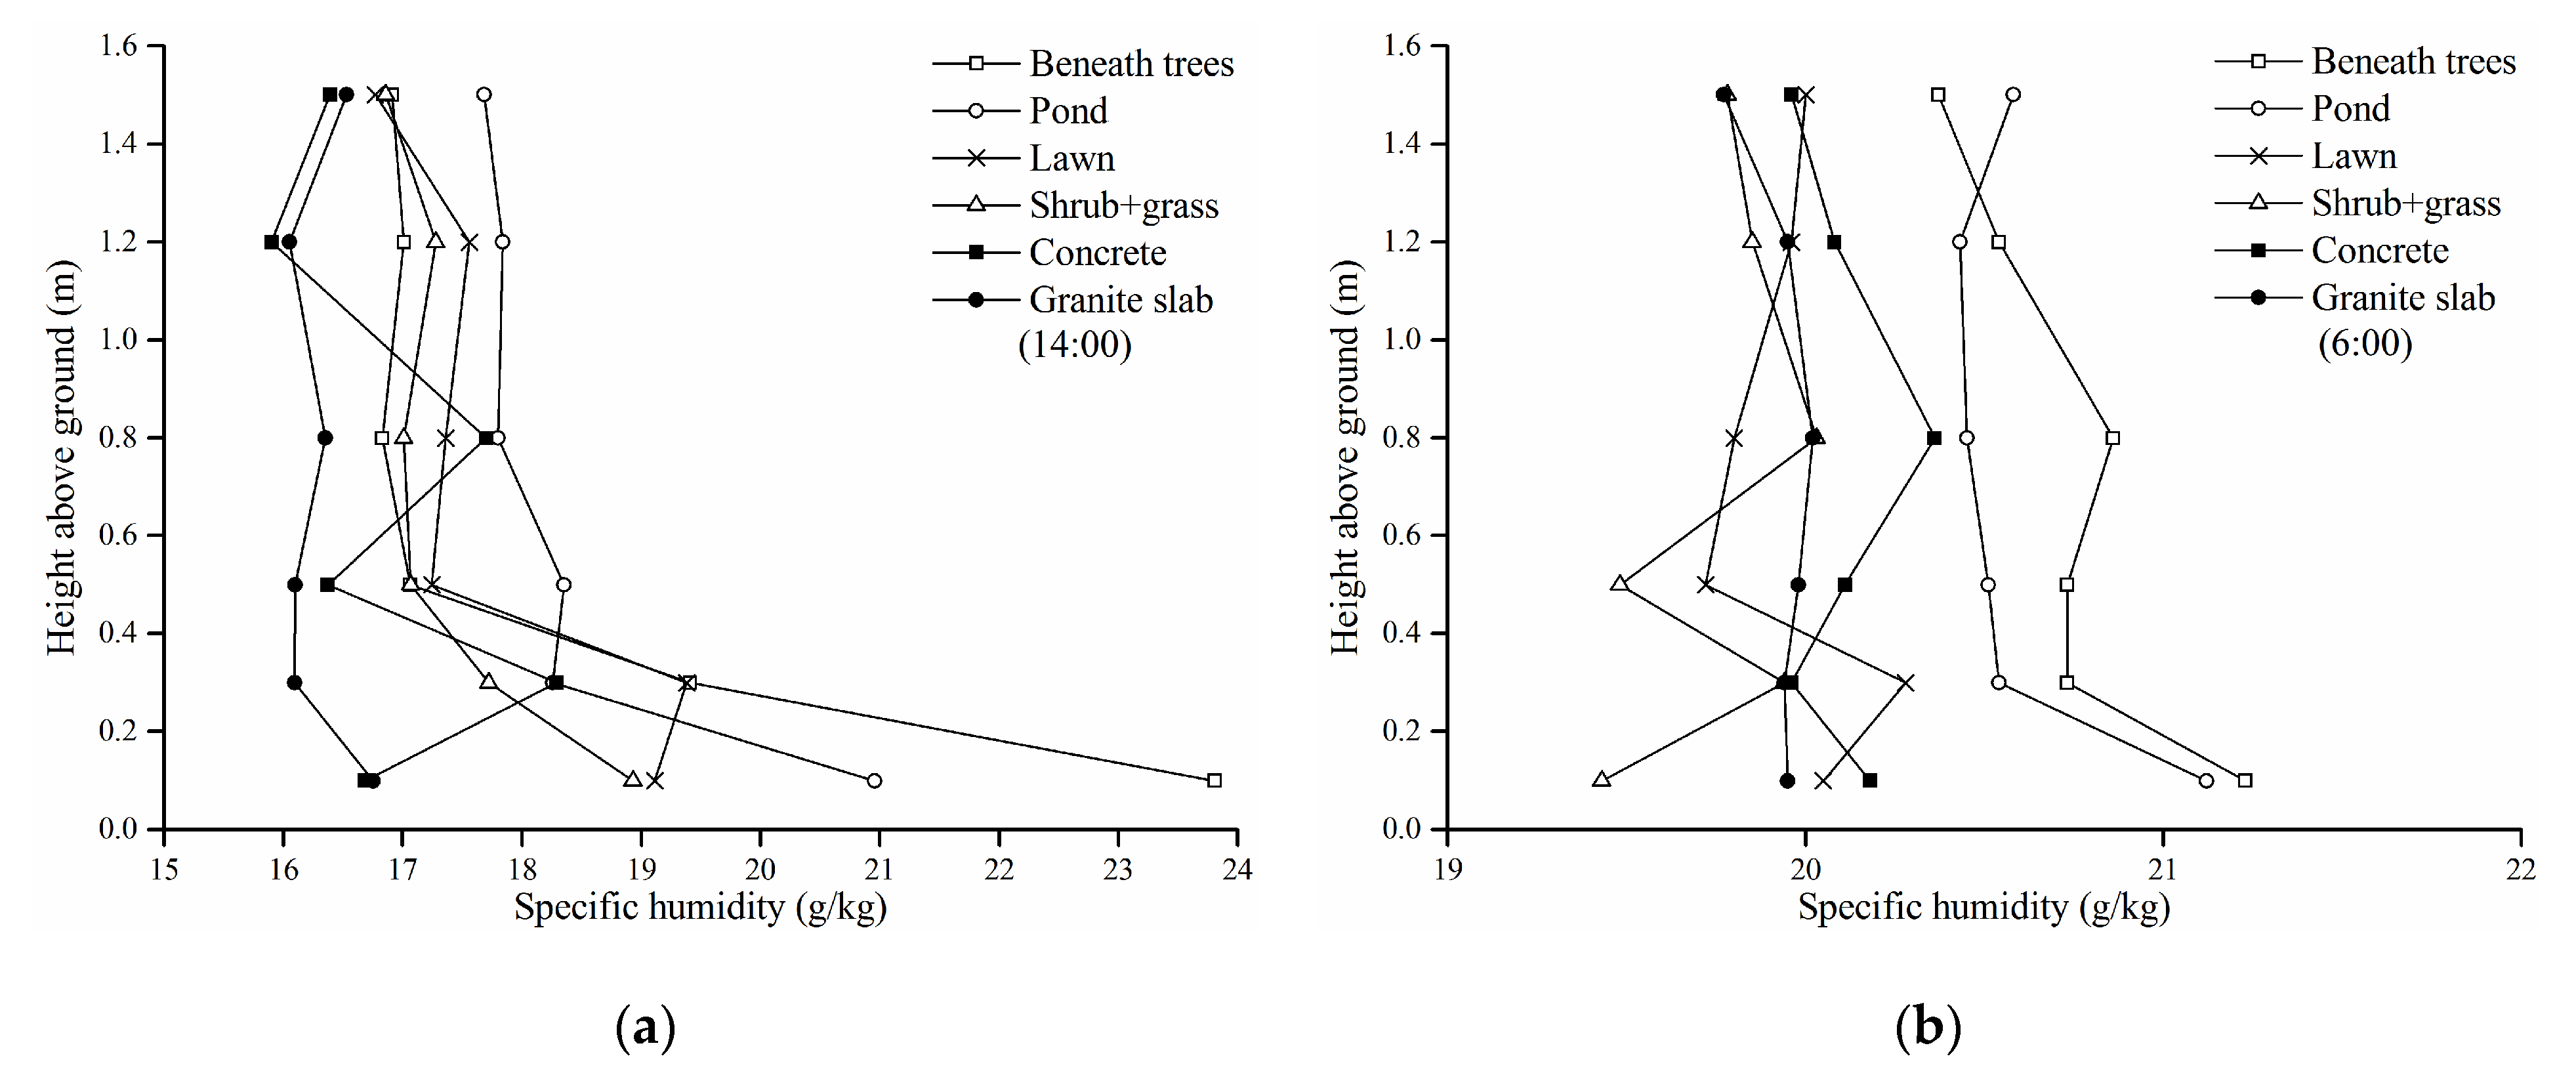
3.3.2. Vertical Profiles of Air Humidity

Figure 9 presents the vertical specific humidity profiles at 14:00 and 6:00 for each surface. From the data at 14:00, it can be seen that the humidity above the concrete and granite slab pavements was generally lower than those of the other evaporable surfaces. For the green areas and the pond, there were greater humidity gradients from 0.1 to 0.5 m while relatively small changes were observed from 0.8 to 1.5 m. A notable observation was that the humidity at 0.1 m height under the trees (in the grass canopy) was much higher, higher even than that above the pond, indicating a strong humidification effect created by the grass shaded by trees. This suggested that the sharp temperature drop in the grass canopy under the trees at 14:00 (as shown in Figure 7) should be related to the evaporative cooling effect of the shaded grass. The data at 6:00 showed that the humidity above the pond and under the trees were significantly higher than those of the other surfaces at all heights. Remarkably, the space under the trees had the highest humidity at all the heights except for 1.5 m level.
Figure 9. Vertical humidity profiles for each location at 14:00 (a) and 6:00 (b).
Buildings 06 00002 g009

4. Limitations and Future Study

The generalizability of the results is somewhat limiting since the field measurement was merely conducted for 24 h. At the next stage, an intensive field measurement campaign is planned to be conducted to monitor the long-term thermal responses of typical urban surfaces for different seasons and weather conditions. In addition, more environmental variables such as mean radiant temperature [41,42] and the thermophysical properties of materials [43] should be taken into account, so that the thermal behavior of urban surfaces and landscape components can be better understood. The horizontal spatial distribution of temperature and humidity, affected by a number of factors (e.g., the area of a surface, the distance from a surface, wind speed and direction, and air flow fields), will be involved in the future study. It is also necessary to combine the methods of field measurement and numerical simulation considering the requirement on the prediction of thermal environments for planners and designers. There are a few flaws in the field measurement such as the limitation of instruments. For example, errors are induced during the measurement of air temperature by using the home-made radiation shield, as illustrated in Section 2.2. The temperature fields of the surfaces were more or less altered when employing the contacting measurement method in the experiment. It is recommended that measuring the temperature of a surface be done by means of non-contact instruments such as infrared thermometer and thermal infrared imager.

5. Conclusions

Based on the results of the field measurement, some characteristics of the thermal performances of the selected urban surfaces and landscape components under hot summer conditions can be summarized as below.
The concrete and granite slab pavements exposed to direct solar radiation elevated the temperature of the atmosphere above them throughout the hot summer day. That indicates such impervious artificial surfaces can be regarded as “heat sources” to the summer urban environment and the usage of impervious pavements should be reduced. Compared to the open lawn, the grass shaded by trees produced a greater cooling effect during the daytime but showed a slight warming effect during the nighttime; and the mixture of shrub and grass showed a higher cooling efficiency during the nighttime. The results imply that multi-layer greenery composed of grass, shrub, and tree can efficiently enhance the cooling effect of greenery. That also implies that the configurations of different greenery species are quite important for the outdoor thermal environment and are worth being further studied. The water pond lowered the air temperature during the daytime but decreased the cooling rates of the atmosphere above it during the nighttime, and the humidity above pond were elevated throughout the day. That indicates that the effects of artificial water facilities need to be comprehensively evaluated, especially for hot and humid climatic regions.
The knowledge of thermal behavior of various urban surfaces and landscape components is an important tool for planners and designers. If utilized properly, it can lead to climatic rehabilitation in urban areas and an improvement of the outdoor thermal environment.

Acknowledgments

This research is supported by National Natural Science Foundation of China (Project No. 51408303 and 51138004), the State Key Laboratory of Subtropical Building Science, South China University of Technology, China (No. 2015ZC12 and 2014KB21) and the Natural Science Foundation of the Jiangsu Higher Education Institutions of China (No. 14KJB560010).

Author Contributions

Xiaoshan Yang conducted the field measurements and wrote the manuscript. Lihua Zhao provided guidance and suggestions. All authors have read and approved the final manuscript.

Conflicts of Interest

The authors declare no conflict of interest.

References

  1. Tan, S.; Fwa, T. Influence of pavement materials on the thermal environment of outdoor spaces. Build. Environ. 1992, 27, 289–295. [Google Scholar] [CrossRef]
  2. Doulos, L.; Santamouris, M.; Livada, I. Passive cooling of outdoor urban spaces. The role of materials. Sol. Energy 2004, 77, 231–249. [Google Scholar] [CrossRef]
  3. Synnefa, A.; Karlessi, T.; Gaitani, N.; Santamouris, M.; Assimakopoulos, D.N.; Papakatsikas, C. Experimental testing of cool colored thin layer asphalt and estimation of its potential to improve the urban microclimate. Build. Environ. 2011, 46, 38–44. [Google Scholar] [CrossRef]
  4. Chudnovsky, A.; Ben-Dor, E.; Saaroni, H. Diurnal thermal behavior of selected urban objects using remote sensing measurements. Energy Build. 2004, 36, 1063–1074. [Google Scholar] [CrossRef]
  5. Lin, T.; Ho, Y.; Huang, Y. Seasonal effect of pavement on outdoor thermal environments in subtropical Taiwan. Build. Environ. 2007, 42, 4124–4131. [Google Scholar] [CrossRef]
  6. Touchaei, A.G.; Akbari, H. The climate effects of increasing the albedo of roofs in a cold region. Adv. Build. Energy Res. 2013, 7, 186–191. [Google Scholar] [CrossRef]
  7. Rossi, F.; Castellani, B.; Presciutti, A.; Morini, E.; Filipponi, M.; Nicolini, A.; Santamouris, M. Retroreflective façades for urban heat island mitigation: Experimental investigation and energy evaluations. Appl. Energy 2015, 145, 8–20. [Google Scholar] [CrossRef]
  8. Bonamente, E.; Rossi, F.; Coccia, V.; Pisello, A.L.; Nicolini, A.; Castellani, B.; Cotana, F.; Filipponi, M. An energy-balanced analytic model for urban heat canyons: Comparison with experimental data. Adv. Build. Energy Res. 2013, 7, 222–234. [Google Scholar] [CrossRef]
  9. Pisello, A.L.; Pignatta, G.; Castaldo, V.L.; Cotana, F. Experimental analysis of natural gravel covering as cool roofing and cool pavement. Sustainability 2014, 6, 4706–4722. [Google Scholar] [CrossRef]
  10. Castaldo, V.L.; Coccia, V.; Cotana, F.; Pignatta, G.; Pisello, A.L.; Rossi, F. Thermal-energy analysis of natural “cool” stone aggregates as passive cooling and global warming mitigation technique. Urban Clim. 2015, 14, 301–314. [Google Scholar] [CrossRef]
  11. Toraldo, E.; Mariani, E.; Alberti, S.; Crispino, M. Experimental investigation into the thermal behavior of wearing courses for road pavements due to environmental conditions. Constr. Build. Mater. 2015, 98, 846–852. [Google Scholar] [CrossRef]
  12. Ignatius, M.; Wong, N.H.; Jusuf, S.K. Urban microclimate analysis with consideration of local ambient temperature, external heat gain, urban ventilation, and outdoor thermal comfort in the tropics. Sustain. Cities Soc. 2015, 19, 121–135. [Google Scholar] [CrossRef]
  13. Rossi, F.; Anderini, E.; Castellani, B.; Nicolini, A.; Morini, E. Integrated improvement of occupants’comfort in urban areas during outdoor events. Build. Environ. 2015, 93, 285–292. [Google Scholar] [CrossRef]
  14. Qin, Y. A review on the development of cool pavements to mitigate urban heat island effect. Renew. Sustain. Energy Rev. 2015, 52, 445–459. [Google Scholar] [CrossRef]
  15. Taha, H.; Akbari, H.; Rosenfeld, A. Heat island and oasis effects of vegetative canopies: Micro-meteorological field-measurements. Theor. Appl. Climatol. 1991, 44, 123–138. [Google Scholar] [CrossRef]
  16. Souch, C.A.; Souch, C. The effect of trees on summertime below canopy urban climates: A case study Bloomington, Indiana. Arboric. J. 1993, 19, 303–312. [Google Scholar]
  17. Giridharan, R.; Lau, S.S.Y.; Ganesan, S.; Givoni, B. Lowering the outdoor temperature in high-rise high-density residential developments of coastal Hong Kong: The vegetation influence. Build. Environ. 2008, 43, 1583–1595. [Google Scholar] [CrossRef]
  18. Chow, W.T.L.; Pope, R.L.; Martin, C.A.; Brazel, A.J. Observing and modeling the nocturnal park cool island of an arid city: Horizontal and vertical impacts. Theor. Appl. Climatol. 2011, 103, 197–211. [Google Scholar] [CrossRef]
  19. Chow, W.T.L.; Brazel, A.J. Assessing xeriscaping as a sustainable heat island mitigation approach for a desert city. Build. Environ. 2012, 47, 170–181. [Google Scholar] [CrossRef]
  20. Park, M.; Hagishima, A.; Tanimoto, J.; Narita, K. Effect of urban vegetation on outdoor thermal environment: Field measurement at a scale model site. Build. Environ. 2012, 56, 38–46. [Google Scholar] [CrossRef]
  21. Morille, B.; Musy, M.; Malys, L. Preliminary study of the impact of urban greenery types on energy consumption of building at a district scale: Academic study on a canyon street in Nantes (France) weather conditions. Energy Build. 2015, in press. [Google Scholar] [CrossRef]
  22. Tan, Z.; Lau, K.K.; Ng, E. Urban tree design approaches for mitigating daytime urban heat island effects in a high-density urban environment. Energy Build. 2015, in press. [Google Scholar] [CrossRef]
  23. Peng, L.L.H.; Jim, C.Y. Green-roof effects on neighborhood microclimate and human thermal sensation. Energies 2013, 6, 598–618. [Google Scholar] [CrossRef] [Green Version]
  24. Jim, C.Y. Assessing climate-adaptation effect of extensive tropical green roofs in cities. Landsc. Urban Plan. 2015, 138, 54–70. [Google Scholar] [CrossRef]
  25. Peng, L.L.H.; Jim, C.Y. Economic evaluation of green-roof environmental benefits in the context of climate change: The case of Hong Kong. Urban For. Urban Green. 2015, 14, 554–561. [Google Scholar] [CrossRef]
  26. Peng, L.L.H.; Jim, C.Y. Seasonal and diurnal thermal performance of a subtropical extensive green roof: The impacts of background weather parameters. Sustainability 2015, 7, 11098–11113. [Google Scholar] [CrossRef] [Green Version]
  27. Nishimura, N.; Nomura, T.; Iyota, H.; Kimoto, S. Novel water facilities for creation of comfortable urban micrometeorology. Sol. Energy 1998, 64, 197–207. [Google Scholar] [CrossRef]
  28. Xu, J.; Wei, Q.; Huang, X.; Zhu, X.; Li, G. Evaluation of human thermal comfort near urban waterbody during summer. Build. Environ. 2010, 45, 1072–1080. [Google Scholar] [CrossRef]
  29. Tominaga, Y.; Sato, Y.; Sadohara, S. CFD simulations of the effect of evaporative cooling from water bodies in a micro-scale urban environment: Validation and application studies. Sustain. Cities Soc. 2015, in press. [Google Scholar] [CrossRef]
  30. Steeneveld, G.J.; Koopmans, S.; Heusinkveld, B.G.; Theeuwes, N.E. Refreshing the role of open water surfaces on mitigating the maximum urban heat island effect. Landsc. Urban Plan. 2014, 121, 92–96. [Google Scholar] [CrossRef]
  31. Dimoudi, A.; Nikolopoulou, M. Vegetation in the urban environment: microclimatic analysis and benefits. Energy Build. 2003, 35, 69–76. [Google Scholar] [CrossRef]
  32. Ng, E.; Chen, L.; Wang, Y.; Yuan, C. A study on the cooling effects of greening in a high-density city: An experience from Hong Kong. Build. Environ. 2012, 47, 256–271. [Google Scholar] [CrossRef]
  33. Shashua-Bar, L.; Hoffman, M.E. Quantitative evaluation of passive cooling of the UCL microclimate in hot regions in summer, case study: urban streets and courtyards with trees. Build. Environ. 2004, 39, 1087–1099. [Google Scholar] [CrossRef]
  34. Robitu, M.; Musy, M.; Inard, C.; Groleau, D. Modeling the influence of vegetation and water pond on urban microclimate. Sol. Energy 2006, 80, 435–447. [Google Scholar] [CrossRef]
  35. Shashua-Bar, L.; Hoffman, M.E.; Tzamir, Y. Integrated thermal effects of generic built forms and vegetation on the UCL microclimate. Build. Environ. 2006, 41, 343–354. [Google Scholar] [CrossRef]
  36. Ali-Toudert, F.; Mayer, H. Numerical study on the effects of aspect ratio and orientation of an urban street canyon on outdoor thermal comfort in hot and dry climate. Build. Environ. 2006, 41, 94–108. [Google Scholar] [CrossRef]
  37. Emmanuel, R.; Fernando, H.J.S. Urban heat islands in humid and arid climates: role of urban form and thermal properties in Colombo, Sri Lanka and Phoenix, USA. Clim. Res. 2007, 34, 241–251. [Google Scholar] [CrossRef]
  38. Middel, A.; Häb, K.; Brazel, A.J.; Martin, C.A.; Guhathakurta, S. Impact of urban form and design on mid-afternoon microclimate in Phoenix Local Climate Zones. Landsc. Urban Plan. 2014, 122, 16–28. [Google Scholar] [CrossRef]
  39. Zhang, Q.; Huang, J. Chinese Typical Year Weather Data for Architectural Use; China Machine Press: Beijing, China, 2004. (In Chinese) [Google Scholar]
  40. Shashua-Bar, L.; Pearlmutter, D.; Erell, E. The cooling efficiency of urban landscape strategies in a hot dry climate. Landsc. Urban Plan. 2009, 92, 179–186. [Google Scholar] [CrossRef]
  41. Alfano, F.R.; Dell’Isola, M.; Palella, B.I.; Riccio, G.; Russi, A. On the measurement of the mean radiant temperature and its influence on the indoor thermal environment assessment. Build. Environ. 2013, 63, 79–88. [Google Scholar] [CrossRef]
  42. Thorsson, S.; Lindberg, F.; Eliasson, I.; Holmer, B. Different methods for estimating the mean radiant temperature in an outdoor urban setting. Int. J. Climatol. 2007, 27, 1983–1993. [Google Scholar] [CrossRef]
  43. Yang, X.; Zhao, L.; Bruse, M.; Meng, Q. Evaluation of a microclimate model for predicting the thermal behavior of different ground surfaces. Build. Environ. 2013, 60, 93–104. [Google Scholar] [CrossRef]

