Article

Structural Resistance of Reinforced Concrete Buildings in Areas of Moderate Seismicity and Assessment of Strategies for Structural Improvement

by
David Dominguez-Santos
1,
Pablo Ballesteros-Perez
2 and
Daniel Mora-Melia
1,*
1
Departamento de Ingeniería y Gestión de la Construcción, Facultad de Ingeniería, Universidad de Talca, Casilla 747, Talca, Chile
2
School of Construction Management and Engineering, University of Reading, Whiteknights, Reading RG6 6AW, UK
*
Author to whom correspondence should be addressed.
Buildings 2017, 7(4), 89; https://doi.org/10.3390/buildings7040089
Submission received: 28 July 2017 / Revised: 28 September 2017 / Accepted: 3 October 2017 / Published: 13 October 2017

Abstract

:
Moderate magnitude seismic events have occurred during the last decade in non-seismic areas and have highlighted that many existing buildings do not sufficiently resist these types of events. The objective of this work is to illustrate that most buildings dating from 2002–2010 constructed from wide beams, which were designed to previous earthquake resistance codes, do not offer a satisfactory seismic behaviour, and to identify which structural attributes can best help alleviate this problem. In this work the effect of a real earthquake of medium magnitude (Lorca, 2011) on buildings of three, five and eight stories with unidirectional frames of wide-beam concrete was assessed. The methodology included non-linear static (pushover) analyses and dynamic response simulations with the aim to understand the effect on the seismic performance of changing some of the geometrical and material parameters. Maximum displacements and capacity curves for the top floor of a set of representative buildings were evaluated and compared. In particular, capacity curves obtained from non-linear static (pushover) analysis are compared for different building configurations, as well as the maximum displacements obtained through non-linear dynamic analysis. This paper highlights the seismic vulnerability of buildings constructed between 2002 and 2010 and the results indicate that a higher density of infill walls (walls whose bricks are not part of the main structure) is the feature that most significantly improves the seismic behaviour of the structures analysed. Moreover, counterintuitively, incorporating stronger concrete and reinforcing steel and using alternative column arrangements only have a small positive effect on the seismic behaviour of these types of buildings.

1. Introduction

Moderate magnitude seismic events (5.5–6.5 degrees Richter) occurring during the last decade in areas classified as “non-seismic” (those where seismic events higher than 4.0 degrees Richter are not expected) have demonstrated that the design of many existing buildings is insufficient to resist these types of events. Some examples are the destruction of many buildings and the corresponding loss of human life in cities such as Vrancea in 2004 [1], L’Aquila in 2009 [2,3], the Balkan region in 2010 [4] and Lorca in 2011 [5,6], highlight the poor structural performance of these buildings in earthquakes of medium magnitude.
In terms of legislation, it was envisaged that the Eurocodes would serve as a basis for structural design in the European Union. Of these, Eurocode 8 (EC 8) [7] applies to the design and construction of buildings and civil engineering works in seismic regions. Since its publication in 1998, adherence to EC 8 recommendations has progressively become more widespread, and some European countries (e.g., Spain, Italy and France) have reviewed their national seismic codes accordingly.
However, the recent catastrophic outcomes after medium magnitude seismic events have been enough to prompt reconsideration of many previous studies on seismic vulnerability, forcing a change of paradigm in the way buildings are constructed and raising the question of whether the current seismic codes are sufficiently reliable. As a result, some seismic codes have been updated to include new design elements such as energy dissipaters, base isolators, additional walls and stiffeners.
All the same, during the period 2002 to 2010, construction costs were considered more important than quality in a number of European countries, and many buildings were thus built in an unsatisfactory manner. In this study, the vulnerability of some of the buildings constructed from 2002 to 2010 is evaluated. Particularly, the seismic behaviour of reinforced concrete elements in these buildings is studied by means of non-linear static (pushover) and dynamic analyses. This strategy, despite good enough for providing a first approximation, also exhibits some limitations. These limitations are the practical difficulty of calibrating the results with experimental tests and the sometimes difficult to ascertain non-linear performance of structures [8,9].
This work is the continuation of other studies concerning vulnerability analysis of buildings constructed at the end of the 20th century (e.g., [10,11]). The results of the analyses performed in this research show that most 2002–2010 buildings with wide beams built following previous earthquake resistance codes do not offer a satisfactory performance in a seismic event. However, the introduction of infill walls can substantially improve the seismic behaviour of these structures.

2. Background

The observed damage to buildings caused by earthquakes highlights that the vulnerability of constructed buildings needs to be assessed. In recent years, different methods for evaluating the seismic vulnerability of buildings have been developed. Some of them are based on professional experience, and others compare the structural behaviour predicted by static and dynamic analyses [10]. Alam et al. [12] have compared a number of existing seismic vulnerability assessment techniques for buildings using a multi-criteria decision-making tool. In addition, much progress has been made in the technical and scientific evaluation of structural reinforced concrete (RC) buildings by means of empirical and mechanical methods [13]. The procedures used are either linear or non-linear, and static or dynamic, according to the specific aspect to be analysed.
Previous analytical methods developed with a similar aim to this study include: Freeman et al.’s non-linear static analysis [14]—a method embedded in ATC-40 [15]; Priestley et al.’s method [16]; and the method developed by Fajfar and Fischinger [17] which is currently used in EC 8 [7]. This study will make use of dynamic analyses based on a recorded seismic event. This approach has been used by many researchers previously because the damage predicted is very close to that observed in real buildings.
There are a number of complementary approaches that have not been used in this research, but that might be considered for future complementary analyses. For instance, some authors have employed vulnerability curves based on intensity and damage probability matrices [18] and structural damage assessment as measured by the index developed by Park and Ang [19]. Rossetto and Elnashai [20] have proposed vulnerability functions for European RC buildings based on empirical evidence. Other authors have used deterministic methods to predict damage and the structural behaviour of buildings. Monte Carlo simulations have also been employed (e.g., [21,22,23]). Vargas et al. [24] have assessed the vulnerability of reinforced concrete 2D frames using a probabilistic approach that considered a stochastic risk analysis (Risk–EU methodology). Meanwhile, Vielma-Perez et al. [25] have carried out non-linear analyses of reinforced concrete structures using the finite element method, obtaining damage thresholds and analysing inter-story drift. Their analyses predicted the stages of damage using analytical approaches based on performance, involving the probabilistic methods for assessing seismic vulnerability included in FEMA 440 [26].

3. Materials and Methods

3.1. Methodology Outline

In this work, optimal earthquake-resistant construction strategies are proposed for a representative set of buildings. These were determined by varying the mechanical characteristics of the structural materials employed—concrete and steel—and by adding infill walls, which are structurally independent from the main building structure of columns and beams, to different parts of the building.
Maximum displacements and capacity curves obtained for the top floor of a set of representative buildings were evaluated and compared. In particular, the capacity curves from the non-linear static (pushover) analyses were compared and maximum displacements from non-linear dynamic analysis were examined. For the dynamic analyses, comparisons were made for a moderate magnitude ground motion based on data from the Lorca earthquake.
The structures analysed were buildings with one-way slabs and wide beams as this design of building is abundant in many European countries [10]. This type of building is characterised by its capacity for rapid construction and the simplicity of resources required, factors directly related to its relatively low cost of construction. There are other designs available for low-height buildings [27], such as those employing confined masonry instead of reinforced concrete, but these configurations are not common in the regions under consideration (the south-west European countries which are characterised as moderately seismic, e.g., France, Spain and Italy).
Traditionally, the almost total absence of earthquake-proof structural elements and/or resistant configurations in the building types common in European non-seismic areas has made it necessary to incorporate infill walls, normally brick-based, to mitigate the risk of potential earthquake damage [10]. This is the reason why infill walls have been included in the analyses in this study. The seismic performance of each design will be assessed as it relates to the number and layout of infill walls in the building, the properties of the materials used in the structure and the economic aspects of the design. Recommendations for future constructions will be proposed based on the findings of this study. The results of the analyses will be compared with those from previous studies (e.g., [10,13,28,29]).

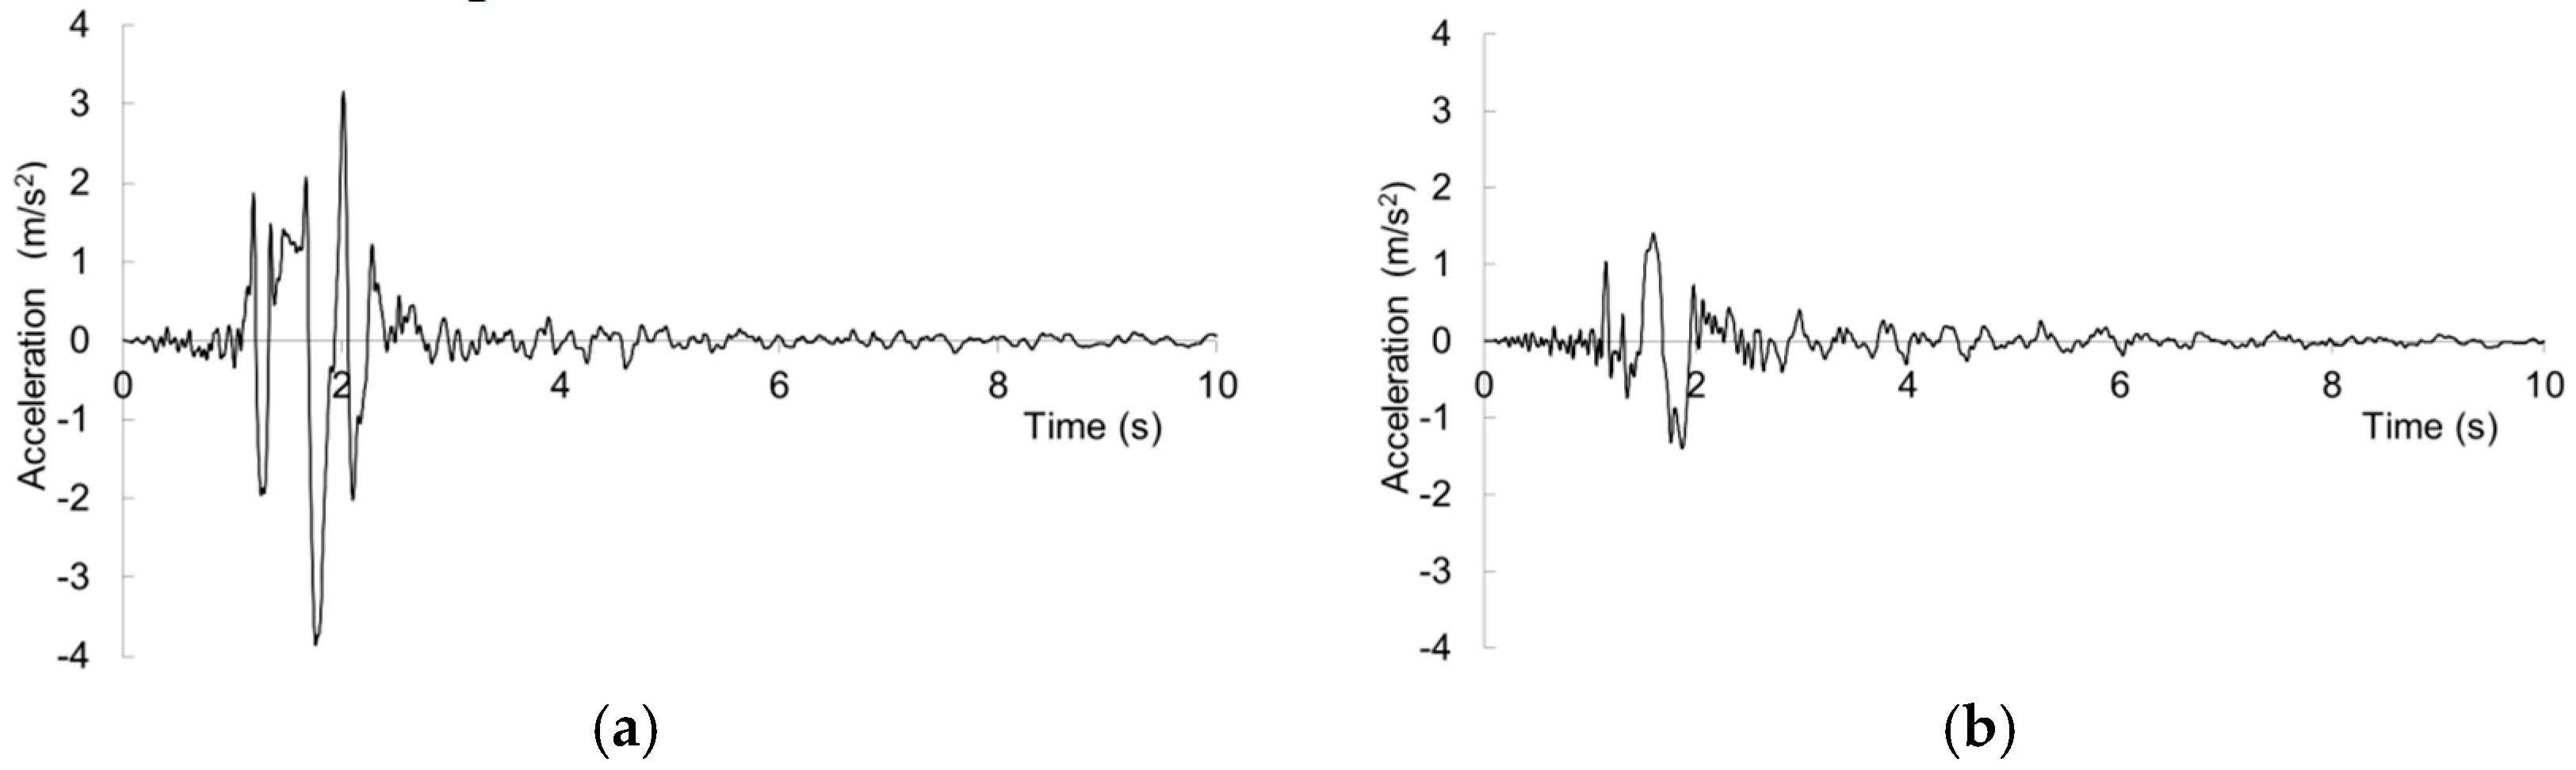
3.2. Representative Earthquake

For this work, the earthquake in Lorca was used as a representative medium intensity seismic event. It was after the impact of this earthquake that seismic vulnerability studies became more important in Spain [30,31] and other European areas where buildings have similar structures, e.g., France [32,33] and Italy [34,35].
The Lorca earthquake occurred on 11 May 2011 at 18:47 local time, 2 km northwest of the town of Lorca. It was one of the most destructive earthquakes ever recorded in Spain despite its moderate magnitude of Mw = 5.1 according to the Geological and Mining Institute of Spain 2011, or Mw = 5.3 to 5.4 according to other seismological centres. Its severity has been attributed to its limited hypo-central depth (approximately 1000 m) and the very short distance between its epicentre and Lorca’s town centre.
Figure 1a,b show the accelerograms of the horizontal components from the most severe recordings of the event. The data indicate that the quake had an impulsive character, especially in the North–South component [28].
For the North-South component, the dimensionless Manfredi’s index [36] was ID = 2.57, whereas for the East-West component it was ID = 3.53. Manfredi’s index quantifies the presence of velocity pulses, i.e., impulsive records with directivity effects caused by the proximity of a fault. The index is defined as the ratio between the integral of the square of the acceleration over the total duration, and the product of the maximum values of the acceleration and speed. Generally, it is considered that ID values below 10 correspond to impulsive events, usually caused by the proximity of a fault, which is why the recording from Lorca is considered impulsive in both directions.
The Arias intensity is a measure of seismic hazard and relates seismic oscillations to the damage caused to a building’s infrastructure. The Arias intensity of the Lorca earthquake was 0.527 for the North–South component and 0.117 for East-West component.
Figure 1c shows a comparison between the response spectra in both directions (North–South and East–West) with a spectrum defined according to the Spanish Earthquake design code NCSE02 for the seismic acceleration of Lorca (ab = 0.12 g) with hard ground. In the figure, Sa is the absolute acceleration. It is immediately clear from the earthquake records that both components of the measured earthquake (especially the North–South) exceed the requirements of NCSE02 for almost all periods of interest.

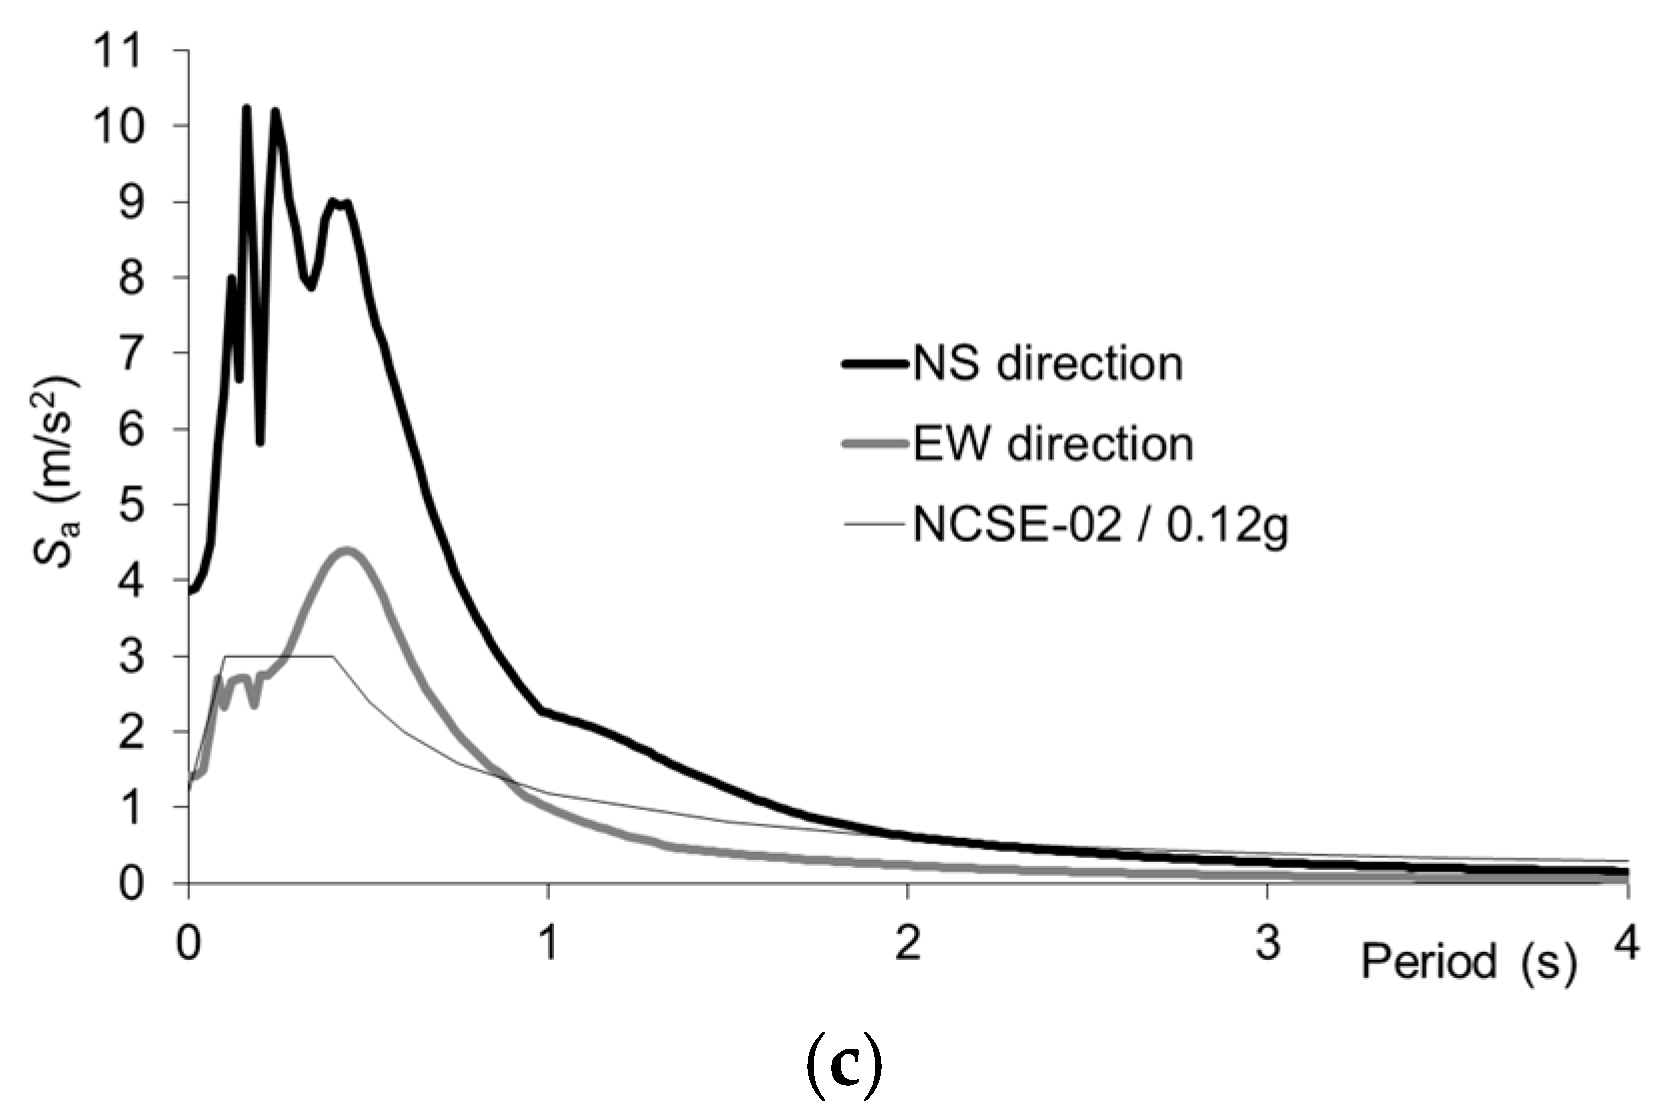
3.3. Representative Buildings

For this study, buildings of three, five and eight stories were considered. The dimensions adopted were selected based on a preliminary statistical analysis of data from a survey of projects with similar characteristics and the opinions of experts who have recent experience in the construction industry. The survey results were verified in accordance with on-site regulations. The constructional features and structural layouts of the buildings are described in detail Figure 2 and later in Table 1; they all correspond to buildings with wide beams.
The wide beam building design has been widely used in Spain, Italy and France because of its ease of installation, it saves time and money because of its one-level formwork, and the ease of disposal of existing facilities in the suspended ceiling [11]. This system is used in buildings that do not require long spans between columns (5–6 m or less), such as residential, administrative or small business buildings and/or in locations where high seismic capacity is not required. However, previous studies have proven the poor performance of this structural form during earthquakes [11], which supports deeper investigation of the seismic response of this type of building, particularly with a rectangular (not square) configuration as studied here.
For the structural designs analysed, the requirements of the Spanish Code EHE-08 [37] were considered. These RC codes have specific sections related to seismic assessment. In addition, the recommendations of seismic codes from other European countries (e.g., France and Italy) were used to complement the Spanish codes. It is worth noting that in recent years most European countries have been adapting their national codes to reflect the current European codes (Eurocodes). Therefore, this study can be considered representative of a significant percentage of existing buildings in the region under study.
Figure 2a–c show the structural diagrams for the three heights of building with rectangle-based configurations considered in this study. In these buildings, the ground floor height is 4 m, and the upper floor heights are 3 m. The configurations are regular and symmetrical with the length in the X direction double the length in the Y direction. The façades are symmetrical two-to-two. Figure 2d shows that in the transverse direction (perpendicular to the frames) there are edge beams on the walls, with a width equal to that of the columns.
Figure 2e shows details of a node commonly found between beams and joists in buildings in non-seismic European countries [11]. With this type of node, the overlap bars ensure continuity between the joists for negative moments but not for positive moments. Figure 2e also contains details of a slab with semi-resistant joists in the transverse direction, and a 60 cm separation between beam axes. In this study, the slabs were assumed to contain 5 mm reinforcing steel bars or welded steel meshes. These were located in the 5 cm thick compression layer or in the top layer and were assumed to spread loads evenly across the whole slab surface. For the analysis, it was assumed that there was a 5 cm thick layer of concrete covering the steel reinforcement bars.
The most important characteristics of the building models used in this study of seismic behaviour are summarised in Table 1. The materials used for the structural models without walls were HA-25 concrete and B-500-S steel. Properties for these materials were obtained from [38]. The structure of each building assessed is denoted by two numbers and a symbol in column 1 of Table 1: the first number indicates the number of stories; the second number represents the span between the columns in metres (equal in both directions); and the symbol specifies whether the cross-sections of the pillars were square (indicated by ■) or rectangular (▐). With the rectangular beams, the longest column dimension was in line with the frame direction.
In the buildings with 5 m span supports between frames, the plan dimensions were 15 × 30 m2. In the buildings with a 6 m span, the plan dimensions were 18 × 36 m2. Columns 3 and 4 in Table 1 contain the cross-sectional dimensions of the columns on the ground and upper floors, respectively. The columns were sized as follows: in buildings with square columns, the minimum column size was 35 × 35 cm and the ground floor column cross-sections increased by 10 cm in both axes each time the building height increased by 3 levels. In buildings with rectangular columns, the minimum size was 40 × 30 cm, and the length of the major axis increased by 20 cm each time the building height increased by 3 stories while the length of the minor axis remained constant.
The fifth column of Table 1 shows the cross-sectional dimensions of the wide beams assumed for each building. The sixth column of Table 1 represents the weight of each building and was calculated using the G + 0.3 Q approach according to EC 8. Finally, columns seven to nine contain the fundamental periods of the buildings based on the number of existing infill walls present in the layout.
The initial characteristic strength of the concrete was fck = 250 kg/cm2 (for HA-25 concrete) and the steel elastic limit was fyk = 5000 kg/cm2 (for B 500-S steel).
In practice, the layouts of infill walls (partition walls, enclosures and walls of stairwells and elevators) are quite varied, both in their distribution and connection to the main structure, and with regards the materials employed (perforated masonry or hollow bricks). In this study, the contribution of the hollow bricks generally used for the interior walls and the inner surfaces of the enclosure (ventilated façade) to the structural response were neglected, given the high fragility of these bricks [39].
Consequently, only the walls constructed from perforated bricks were assumed to contribute to the structural response of the buildings. In this paper, three scenarios were considered: no infill walls (“without walls”), low density of infill walls (“−walls”) and high density of infill walls (“+ walls”); Figure 3 describes the location of the walls assumed for the latter two scenarios.
The “without walls” case can be taken to represent either a building under construction (comprising frames with beams, columns and slabs) or administrative buildings and small shops which have hollow brick walls or infill walls separated from the main structure. The enclosures in these buildings would be curtain walls made from a material that is extraordinarily fragile and would thus not contribute to the structural response of the building.
The low- and high-density masonry wall infill cases can be assumed to represent residential buildings, small shops and administrative buildings. In these cases, a “ventilated façade” is included made of a double layer of bricks separated by an air chamber with 5 cm thick insulation. The outer bricks were assumed to be 12 cm thick and perforated, whereas the inner bricks were 7 cm thick and hollow. A single layer cement mortar with exterior finishing and gypsum interior finishing was also included. However, as discussed earlier, the contribution of hollow bricks is considered negligible due to their fragility, and the building’s structural resistance therefore relies purely on the perforated brick walls in its structure. It is worth noting that these brick walls are separate from the main structure of beams and columns. For the analysis, the same wall layout is assumed for all floors, and the wall heights were equal to the clearance height between stories.
Finally, because the models analysed were intended to represent residential, administrative and small shop buildings, live loads of 2 kN/m2 [38] were applied to all floors except the top floor, where a 1 kN/m2 load corresponding to a roof inclined at more than 20° was added. Also, an overhead load of 1 kN/m2 was included to represent internal partitions [38], and a linear load of 7 kN/m [38] was used to represent the weight of the perforated bricks with existing coverings located in the enclosures and the core communications areas (elevators and stairs).

4. Analysis

This section describes the modelling approach used for simulating the seismic behaviour of the representative buildings in the non-linear static (pushover) and dynamic analyses. The analyses were performed using the structural analysis software Seismostruct v.7.0.2 developed by the Company Seismosoft® (Pavia, Italy)[40] which is based on the finite element method. This software can be used to estimate the displacement of spatial frames under static and dynamic loads and can take into account non-linear material behaviour across the geometry. Particularly, large deformations were taken into account through P-Delta. In the subsequent sections, the different model elements and the analysis approaches will be described.

4.1. Main Frame Modelling

The main frame was modelled using beam elements [41,42]. The structural elements (columns and beams), cross-sections, and constitutive materials were specified. The concrete was modelled as per the recommendations proposed in [43], and the behaviour of the steel reinforcing bars was represented using Ferrara’s bilinear model [44].
In particular, the columns, beams and joists were represented by nonlinear beam elements [45], where the non-linearities were concentrated in plastic hinges located within 15% of the total element length [42]. Following the method used by Scott and Fenves [42], ref. [46] the joints/connections between the columns and the wide beams were assumed to be rigid, and the hysteretic behaviour of the stress distribution was modelled by using fibres which were defined based on the material properties and shape of the structural elements (each element section was discretised into 300 fibres). The analysis results were compared to the experimental results available in Benavent-Climent et al. [29] and satisfactory agreement was obtained.
The slabs were modelled as rigid diaphragms [47], with movements restricted to the Z plane (X and Y directions). Arguably, use of rigid truss elements is preferred over a rigid diaphragm constraint, however, this work has preferred rigid diaphragms for simplicity of calculation and shorter processing time. In fact, the results of both models should not vary significantly, because the analysed structures represent simple geometries. Furthermore, loads were only considered on beams or linear horizontal elements, but never on the slabs.
The tolerances used for the displacements and rotations were of the order of 10−5. A maximum number of 300 iterations was deemed sufficient for the calculations.
For the numerical analysis, the Newmark-β method [48] was used. This method can be considered as a generalisation of the linear acceleration method and is a numerical integration technique which is widely used for numerical evaluation of the dynamic response of structures. In this method, the factors Beta (β) and Gamma (γ) are coefficients that depend on the natural frequency (w) and the damping (Ϛ) of the structure. For this work, the values of β = 0.25 and γ = 0.5 were used, as with these values the Newmark-β method is implicit and unconditionally stable [49]. Finally, Rayleigh damping of 4% for mode 1 and 6% for mode 2 (30) was assumed. Both values correspond to standard values typical of a reinforced concrete structure. As the building is not symmetrical the same value has not been used in mode 1 and mode 2, since the rigidity in both directions is not the same. Finally, the method for modal combination used in the analyses was the complete quadratic combination (CQC) method with a damping of 0.04.
The outputs included the maximum base shear forces, the seismic forces applied and the maximum deformations of the buildings, taking into account both elastic and plastic deformation. To obtain these results, a number of performance criteria were defined. For example, a criterion for the maximum deformation of each material was adopted based on the traditional laws of elasticity and the resistance of the materials. The maximum strain for concrete cracking was taken to be 0.0001, for concrete cover peeling −0.002, for concrete core crushing −0.006, for yielding of the steel 0.0025 and for fracture of the steel 0.06. In addition, criteria based on rotation and curvature were employed where the rotational capacity was defined following Mergos and Kappos [50] and the shear capacity following Eurocode 8.
For the majority of this work, a 2D model was used due to the symmetry of the structure to decrease computational effort. The results from the 2D simulations were compared with the results from 3D analyses, and similar results were obtained. Therefore, the 3D models were only used for obtaining more accurate results for the time-history dynamic analyses.

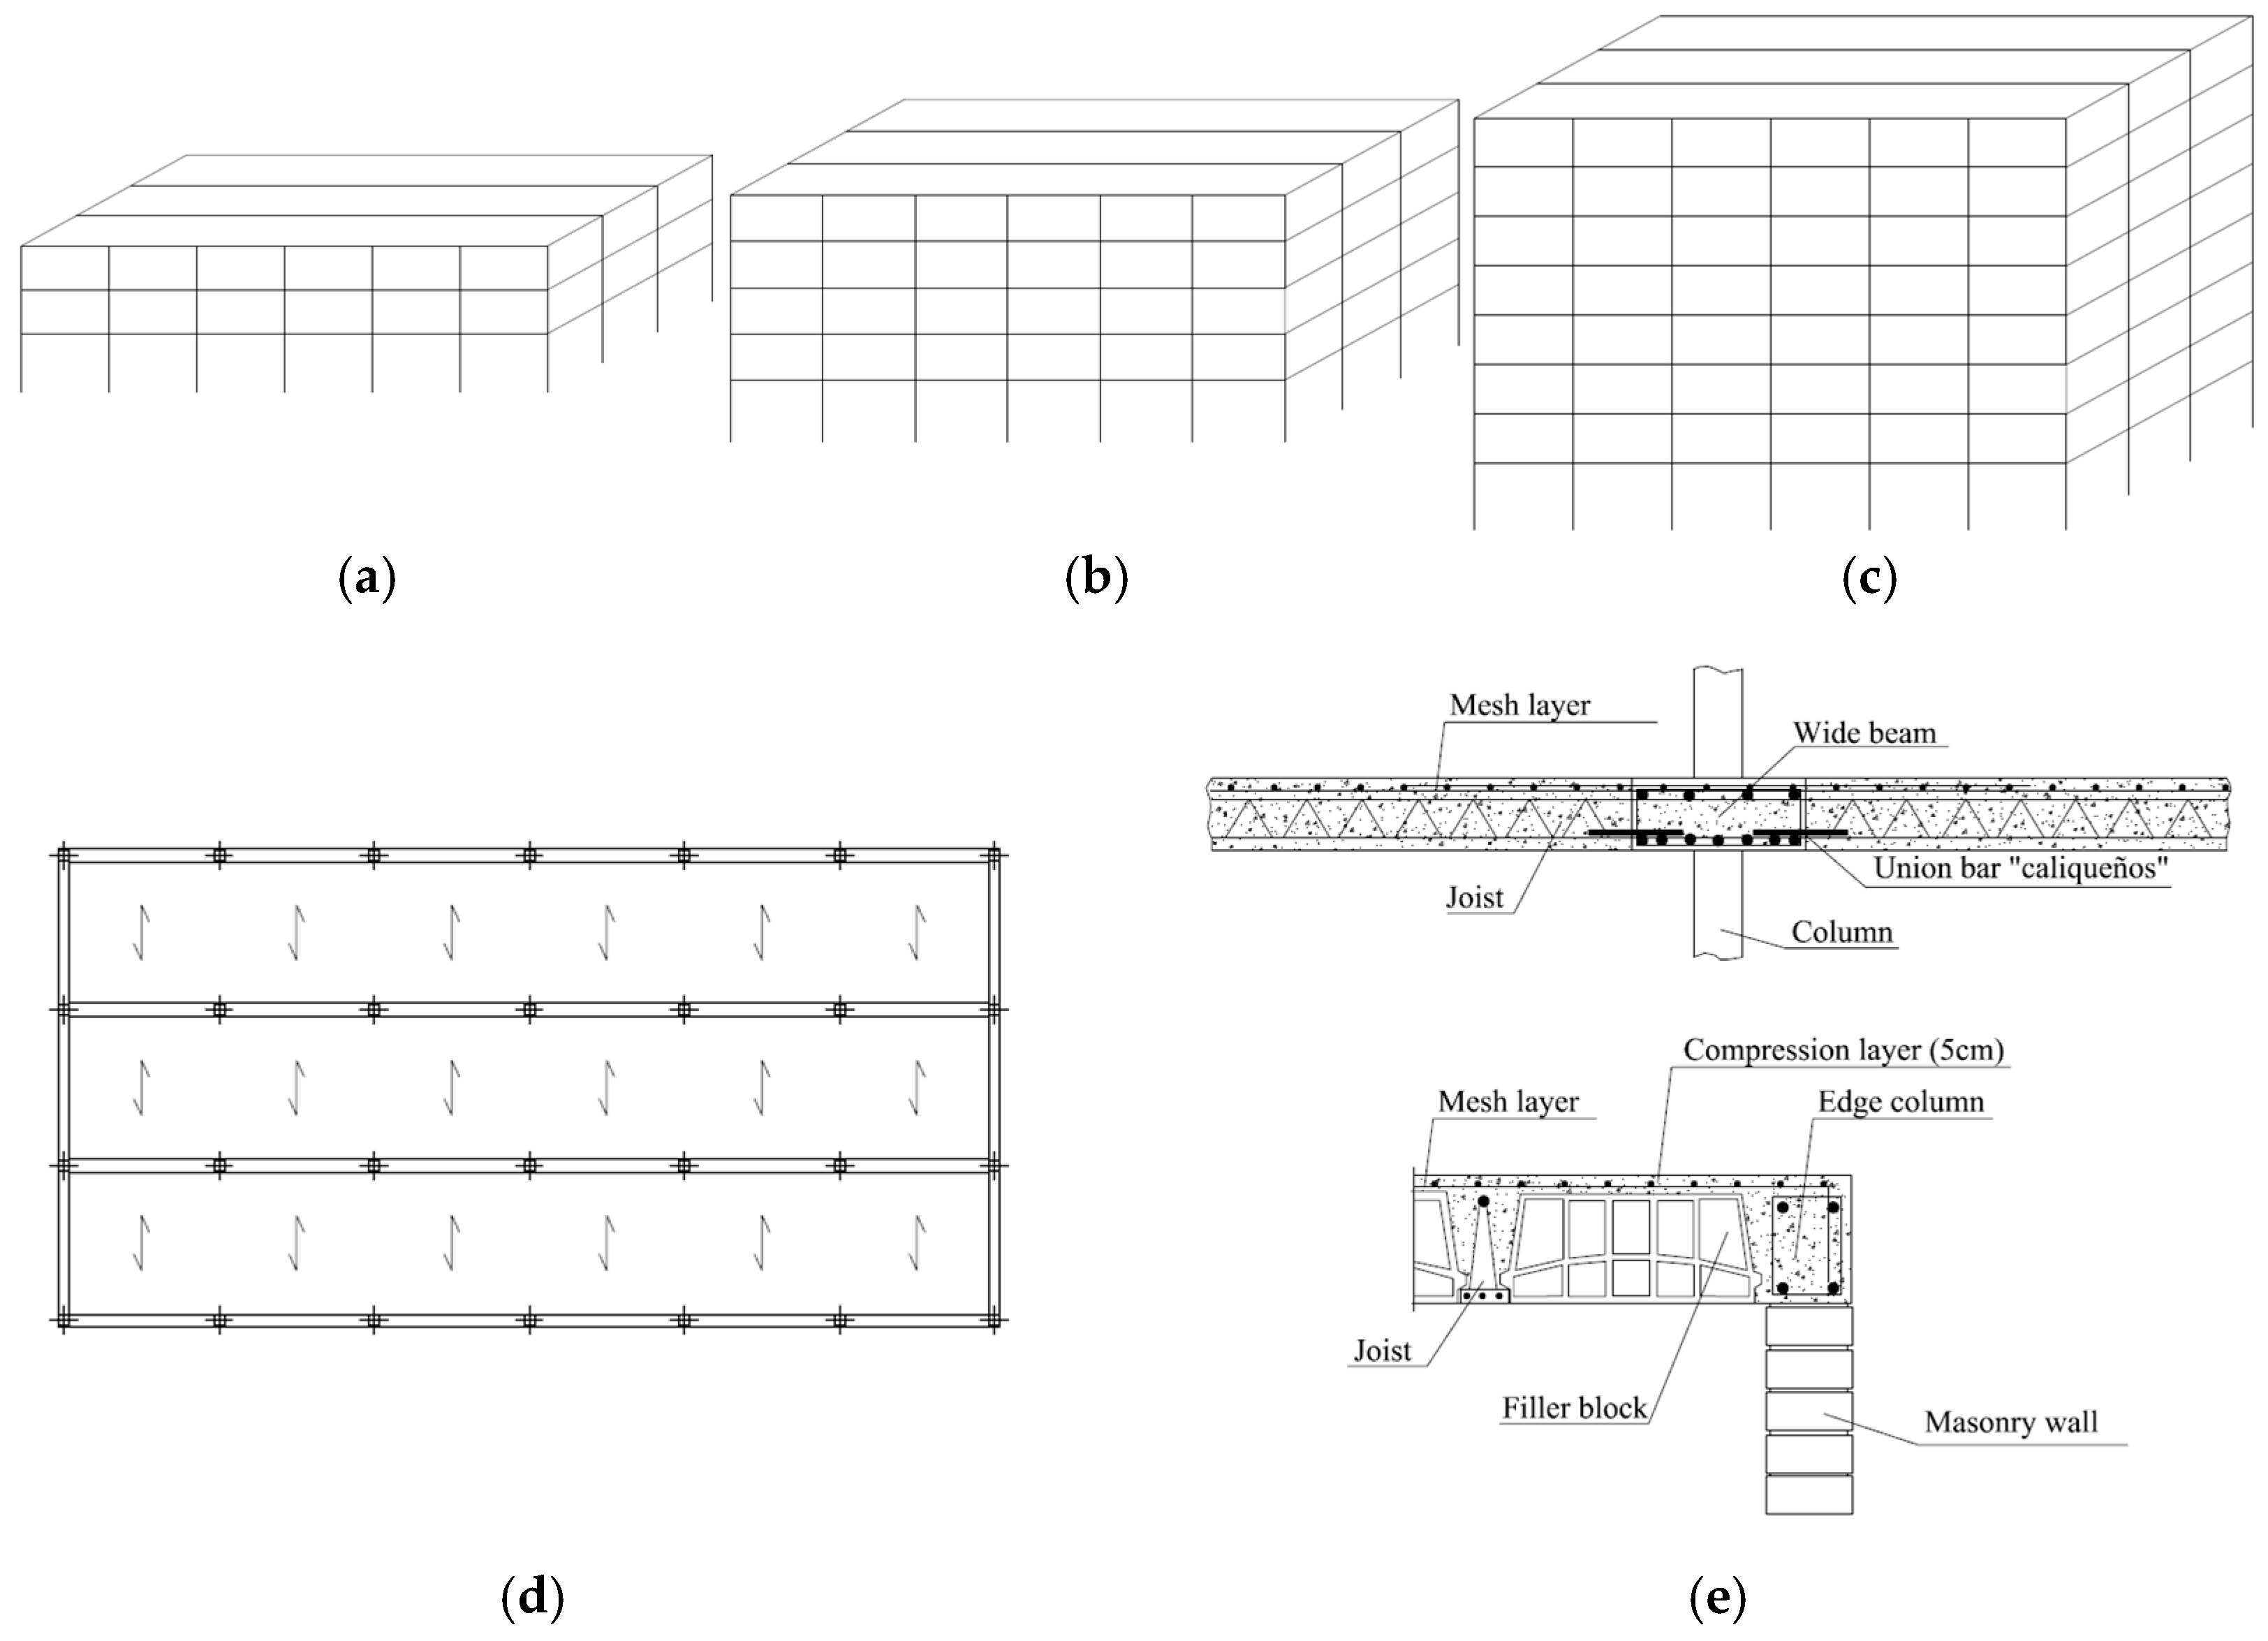
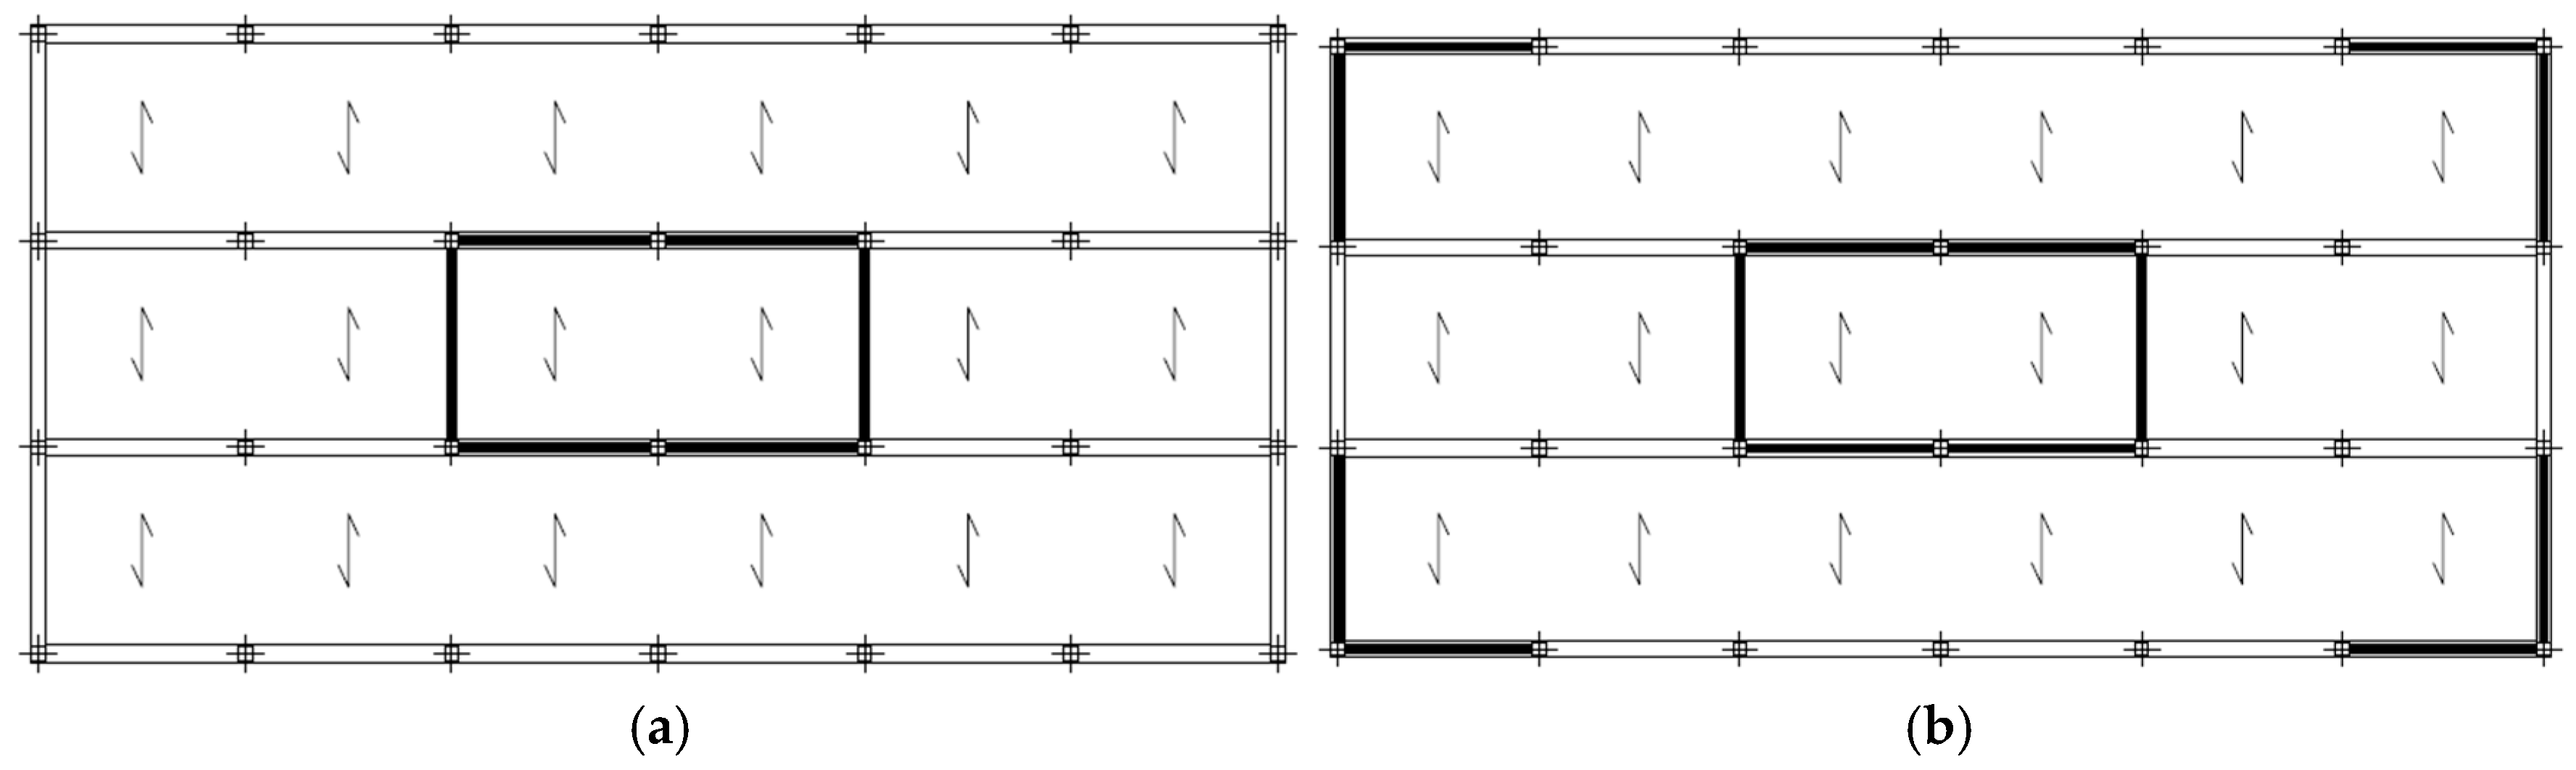
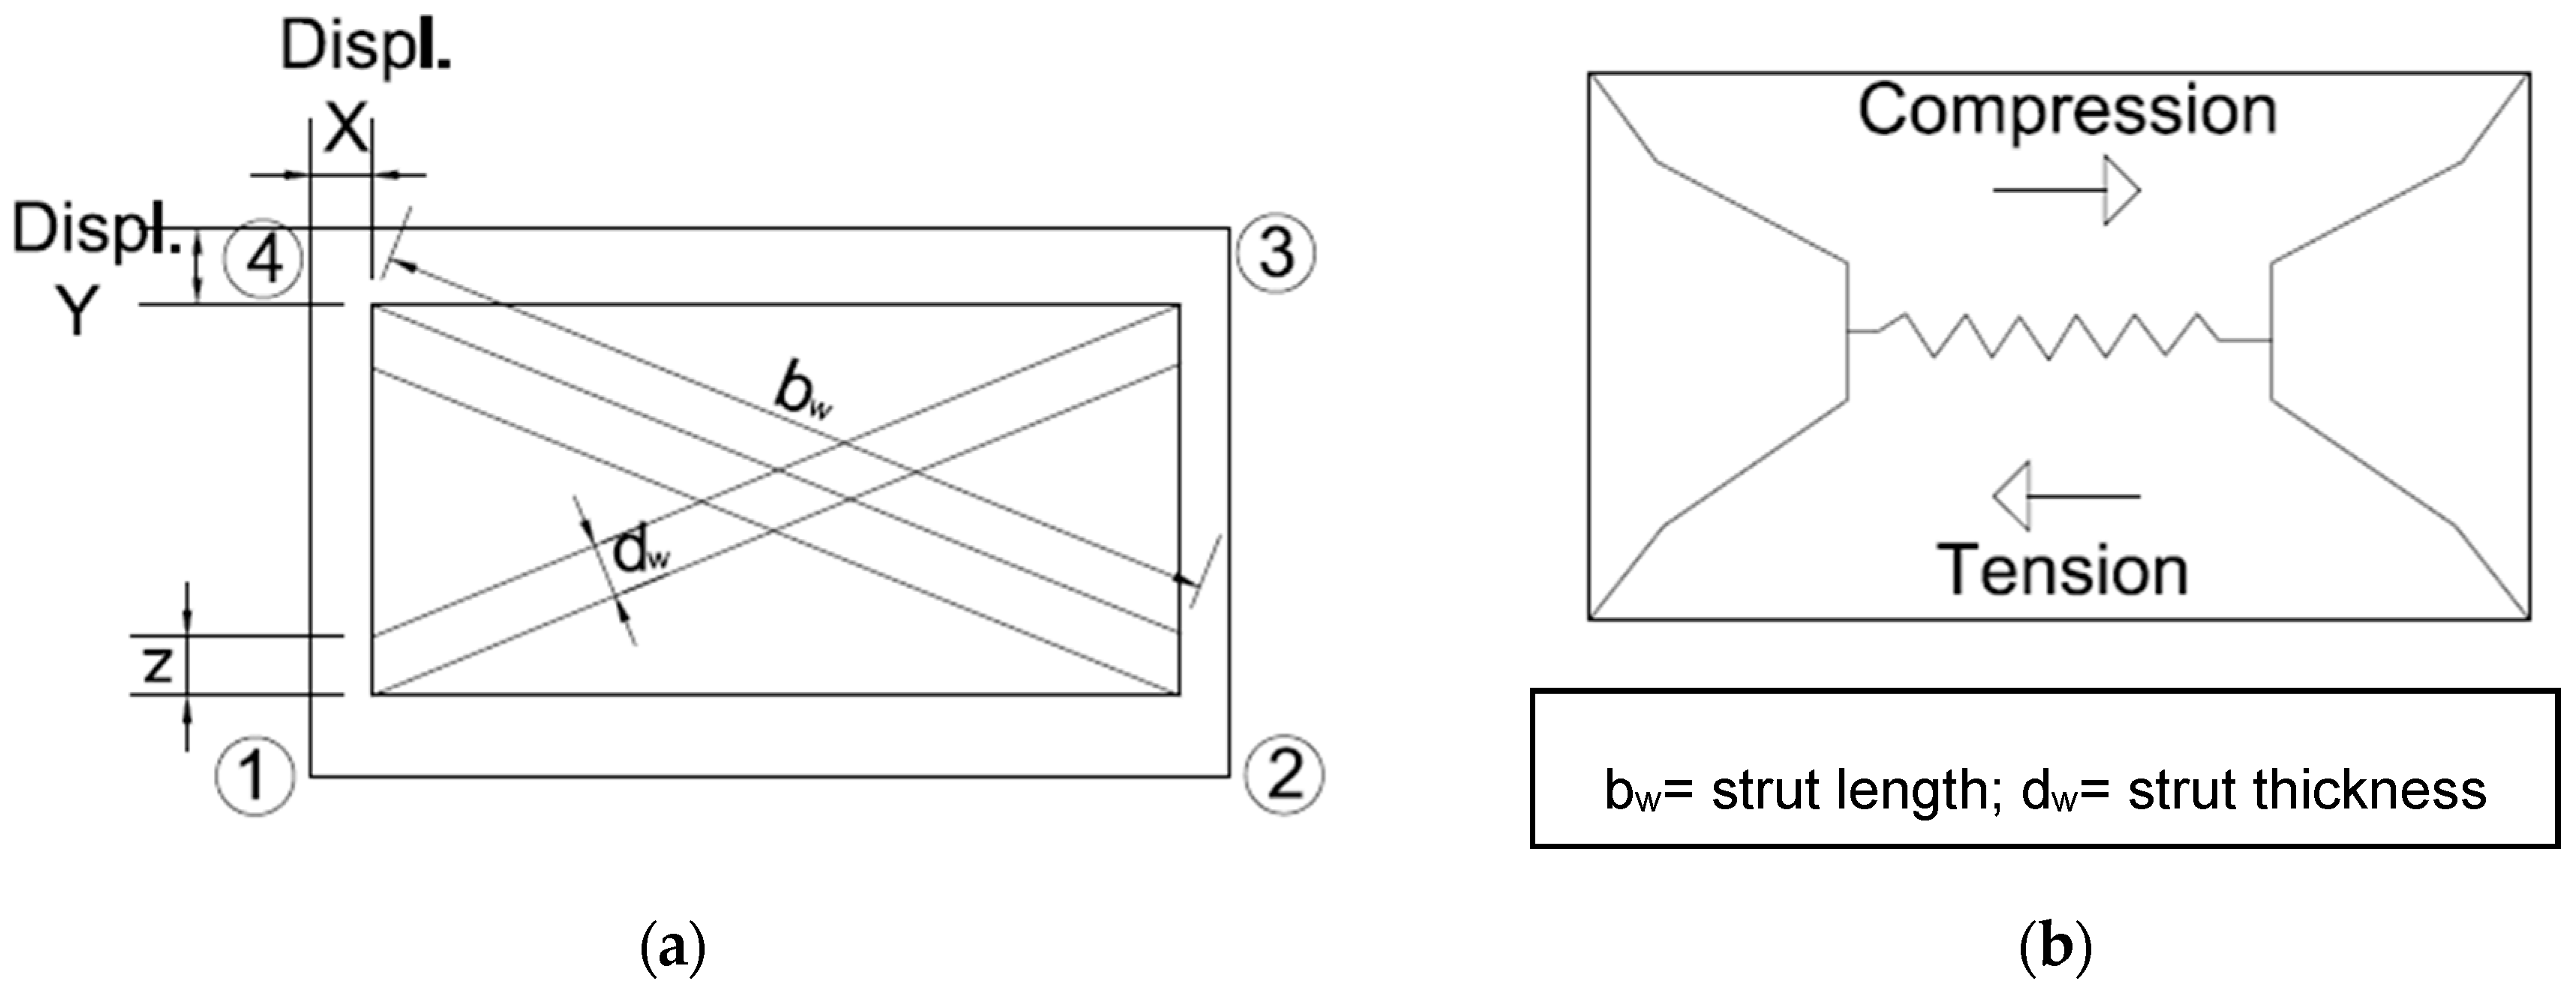
4.2. Infill Wall Modelling

The infill walls were modelled by including “infill panel” elements that connected adjacent floors. Figure 4 shows the strut and tie model used for the discretisation of masonry elements. In the figure, the element is defined by four nodes, as recommended by Crisafulli [51]. The model can be used to represent the nonlinear response of infill panels in frame structures and it has been implemented by Piestley et al. [52] in the Seismosoft® software.
In Figure 4, the four internal nodes are used to represent the contact points between the frame and the wall (the widths and heights of the columns and beams are estimated). The four outer fictitious nodes represent the contact lengths between the frame elements and the wall. Internal forces are transformed into applied forces on the four outer nodes, which are defined in the software in an anti-clockwise sequence.
The Crisafulli approach can be used to model the shear strength of a confined masonry wall. The schematic on the right in Figure 4 shows the distribution of the principal stresses and strains along the main diagonal of the masonry wall. The greatest strains occur at the centre of the panel, which is why it is modelled with a spring. The strains are compressive in the upper half of the wall and tensile in the lower half.
This model can only be used to describe the most common failure modes where the left side of Figure 4 represents the failure of the connecting struts, while the right side represents failure by shear. Incorporating a model describing all types of masonry failure would be impractical because of the complexity involved.
The brick strength was assumed to be fb = 12 MPa, according to the standard typologies of bricks defined in [38], whereas the failure strength of the mortar was fm = 8 MPa. The general formulation to evaluate the characteristic compressive strength of a masonry section fk is given in Eurocode 6 [53] as:
f k = K × f b α × f m β
where K, α and β are parameters which depend on the type of material, the percentage of holes (grouping) and the filling of the joints. In particular, the value of K is related to the type of brick and the kind of jointing. For the type of brick considered in this work, K = 0.45, α = 0.7 and β = 0.3, as specified in Eurocode 6 [53]. Hence, according to equation (1), fk was taken to be 4.781 MPa. The axial and shear elastic moduli were calculated using the formulations in Eurocode 6 to be E = 500·fk = 2391 MPa and G = 0.4·E = 956 MPa.
For modelling the brick walls, three parameters needed to be considered: the initial (elastic) stiffness, the shear strength and the compression resistance of the struts. Values for these parameters were obtained using the formulations described by Mostafaei and Kabeyasawa [54]. The initial stiffness was taken to be twice the final stiffness, which is calculated as the ratio between the final resistance over the final displacement. The wall resistance and stiffness were determined using the methodology described by Dominguez [11] and the details of the connecting struts and cables as modelled in Mostafaei and Kabeyasawa [54] (see Figure 4).
The height (z) of the connecting struts in contact with the columns was determined from the expressions found in [55], and the equivalent strain modulus was obtained following the recommendations in Eurocodes 6 [53] and 8 [7]. The area of the contact surface between the connecting strut and the wall (Aw = 0.13 m2) was calculated as the product of the panel thickness and the equivalent connecting strut width (bw), which was taken to be 25% of the panel diagonal length. Furthermore, the Coulomb approach as described in the ACI 530-88 standard was used for obtaining the friction and cohesion coefficients for the brick mortar.
The parameters used for discretising the shear curve for the hysteretic masonry model for the connecting struts were obtained from other parameters that take into account the shear resistance from adherence, the maximum shear resistance as described in [54], and the friction coefficient as defined in ACI 530-88 [56]. The surface area of the connecting strut was calculated from the effective width, as described in [54].
Finally, the thickness of each wall was taken to be 12 cm (equal to the perforated brick thickness), and the wall-frame contact length was set at 1/3 of the effective contact length (z) defined in [57].

5. Results

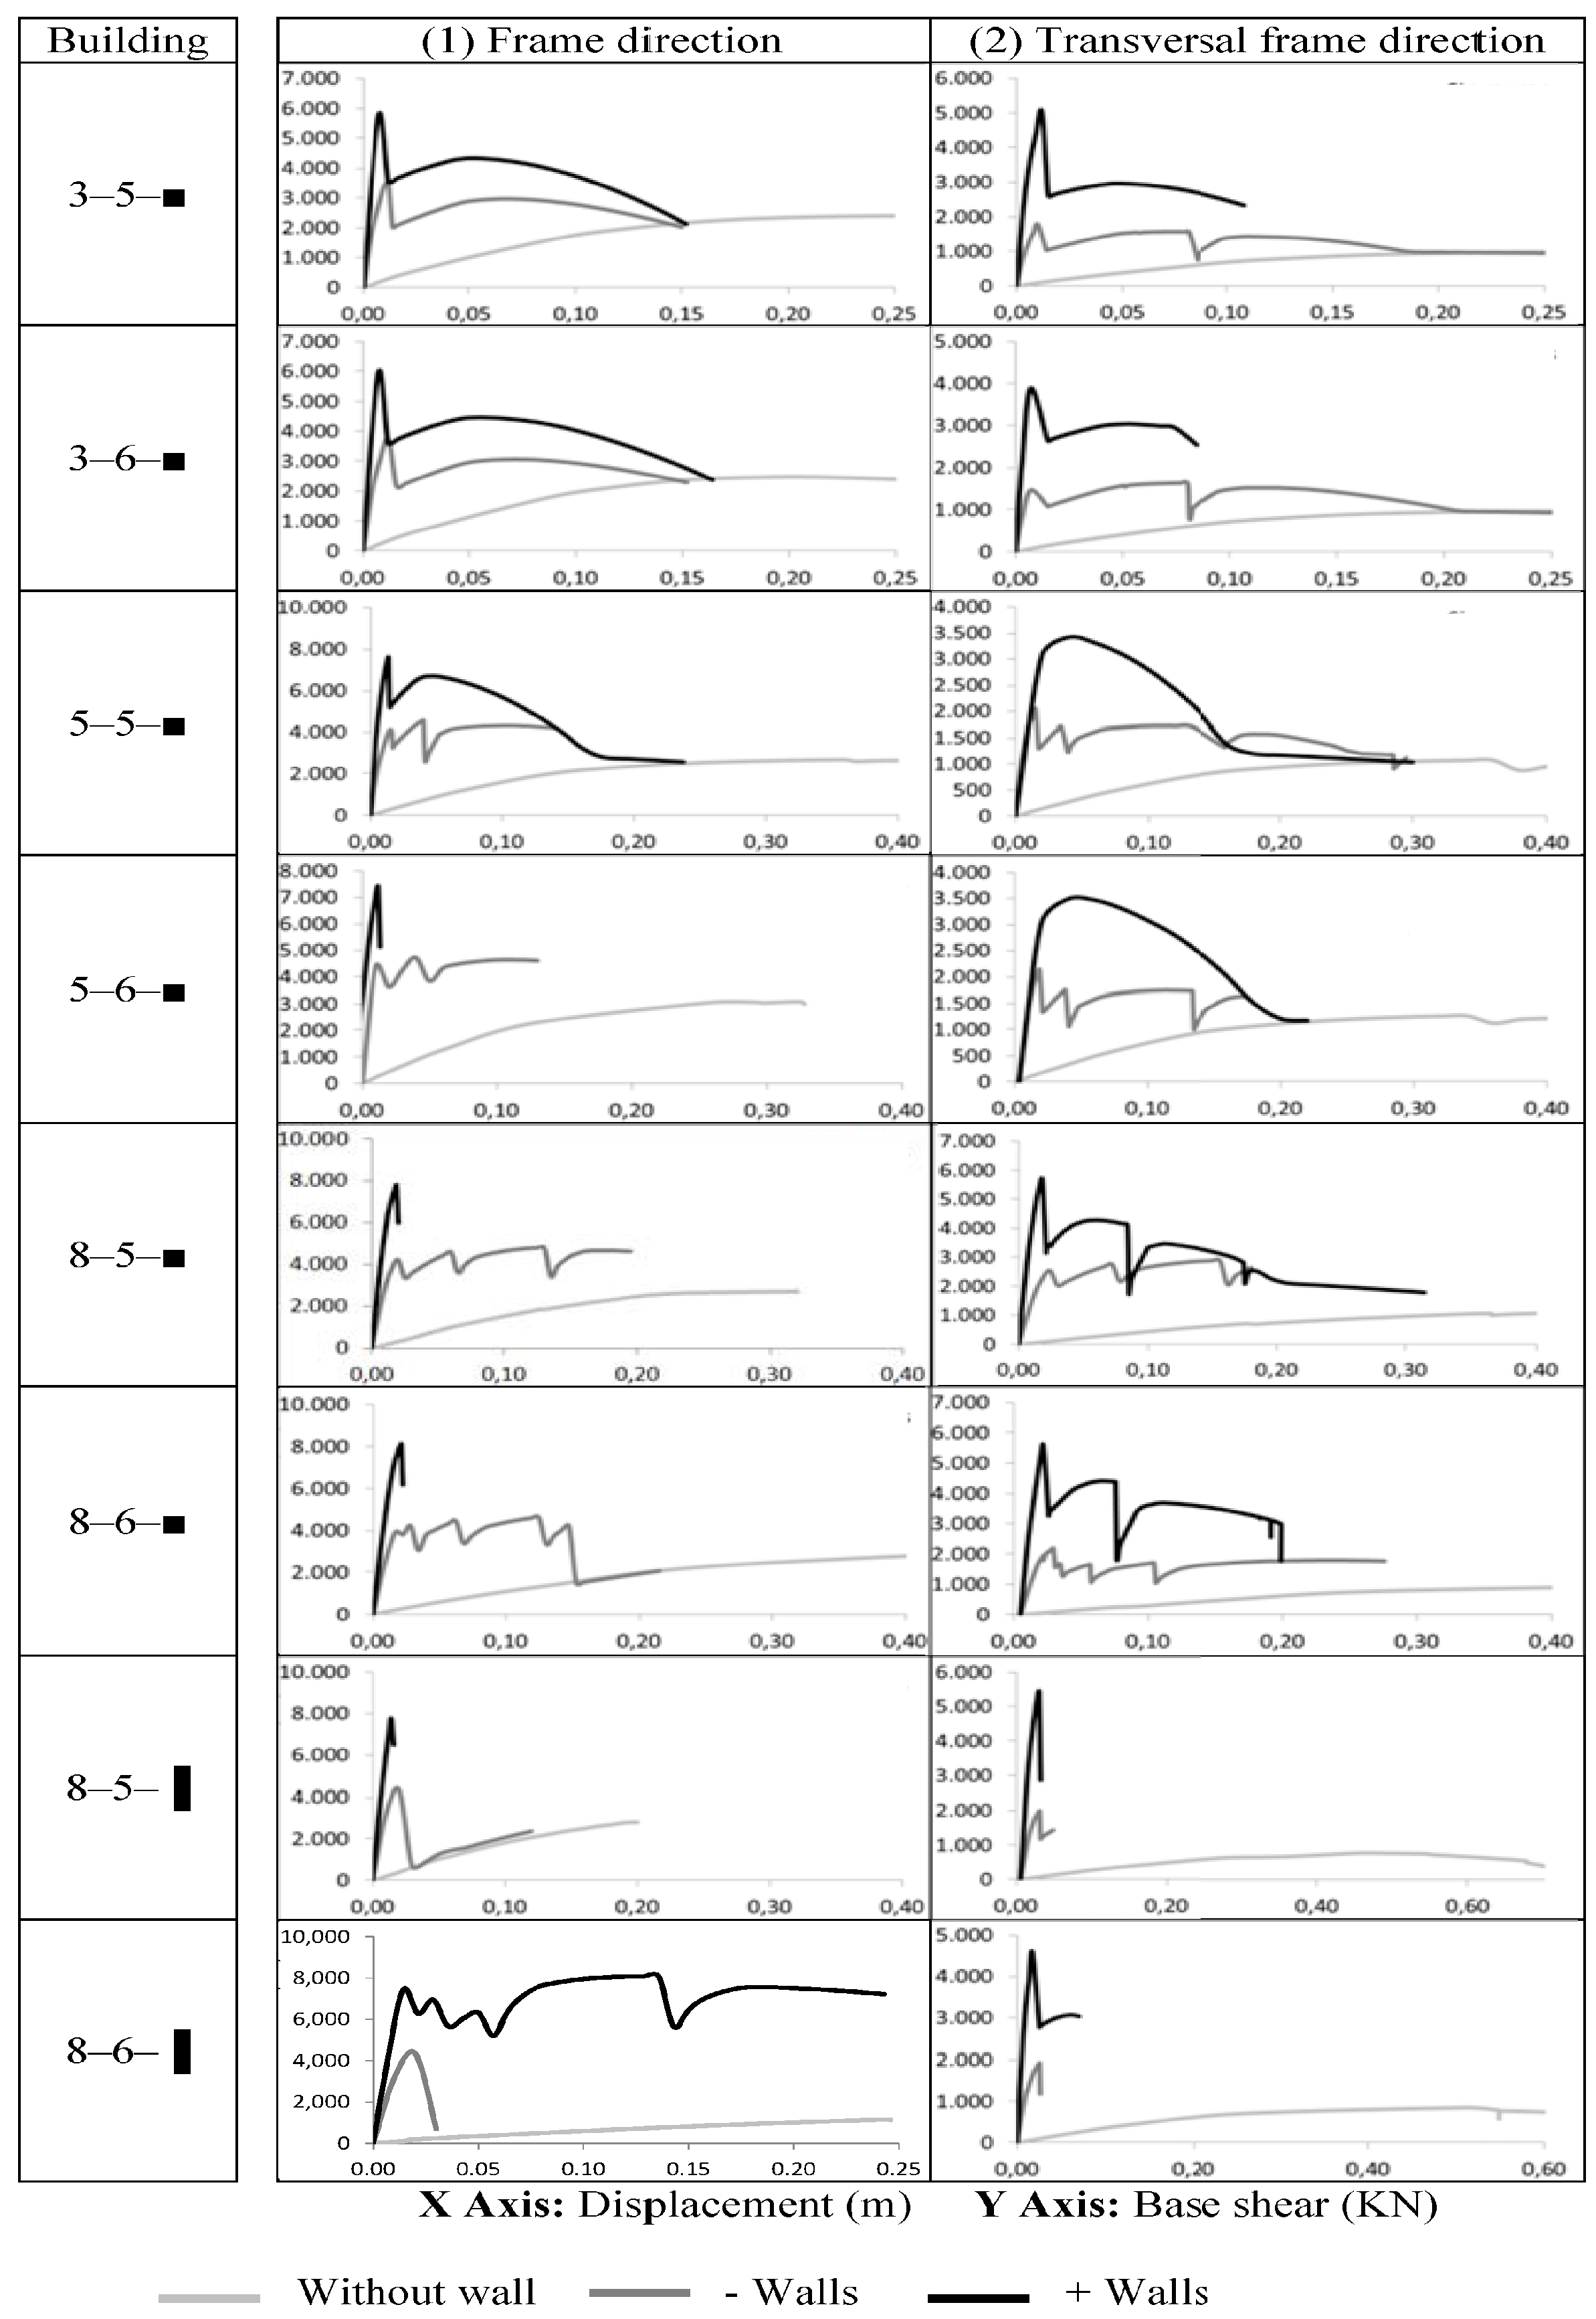
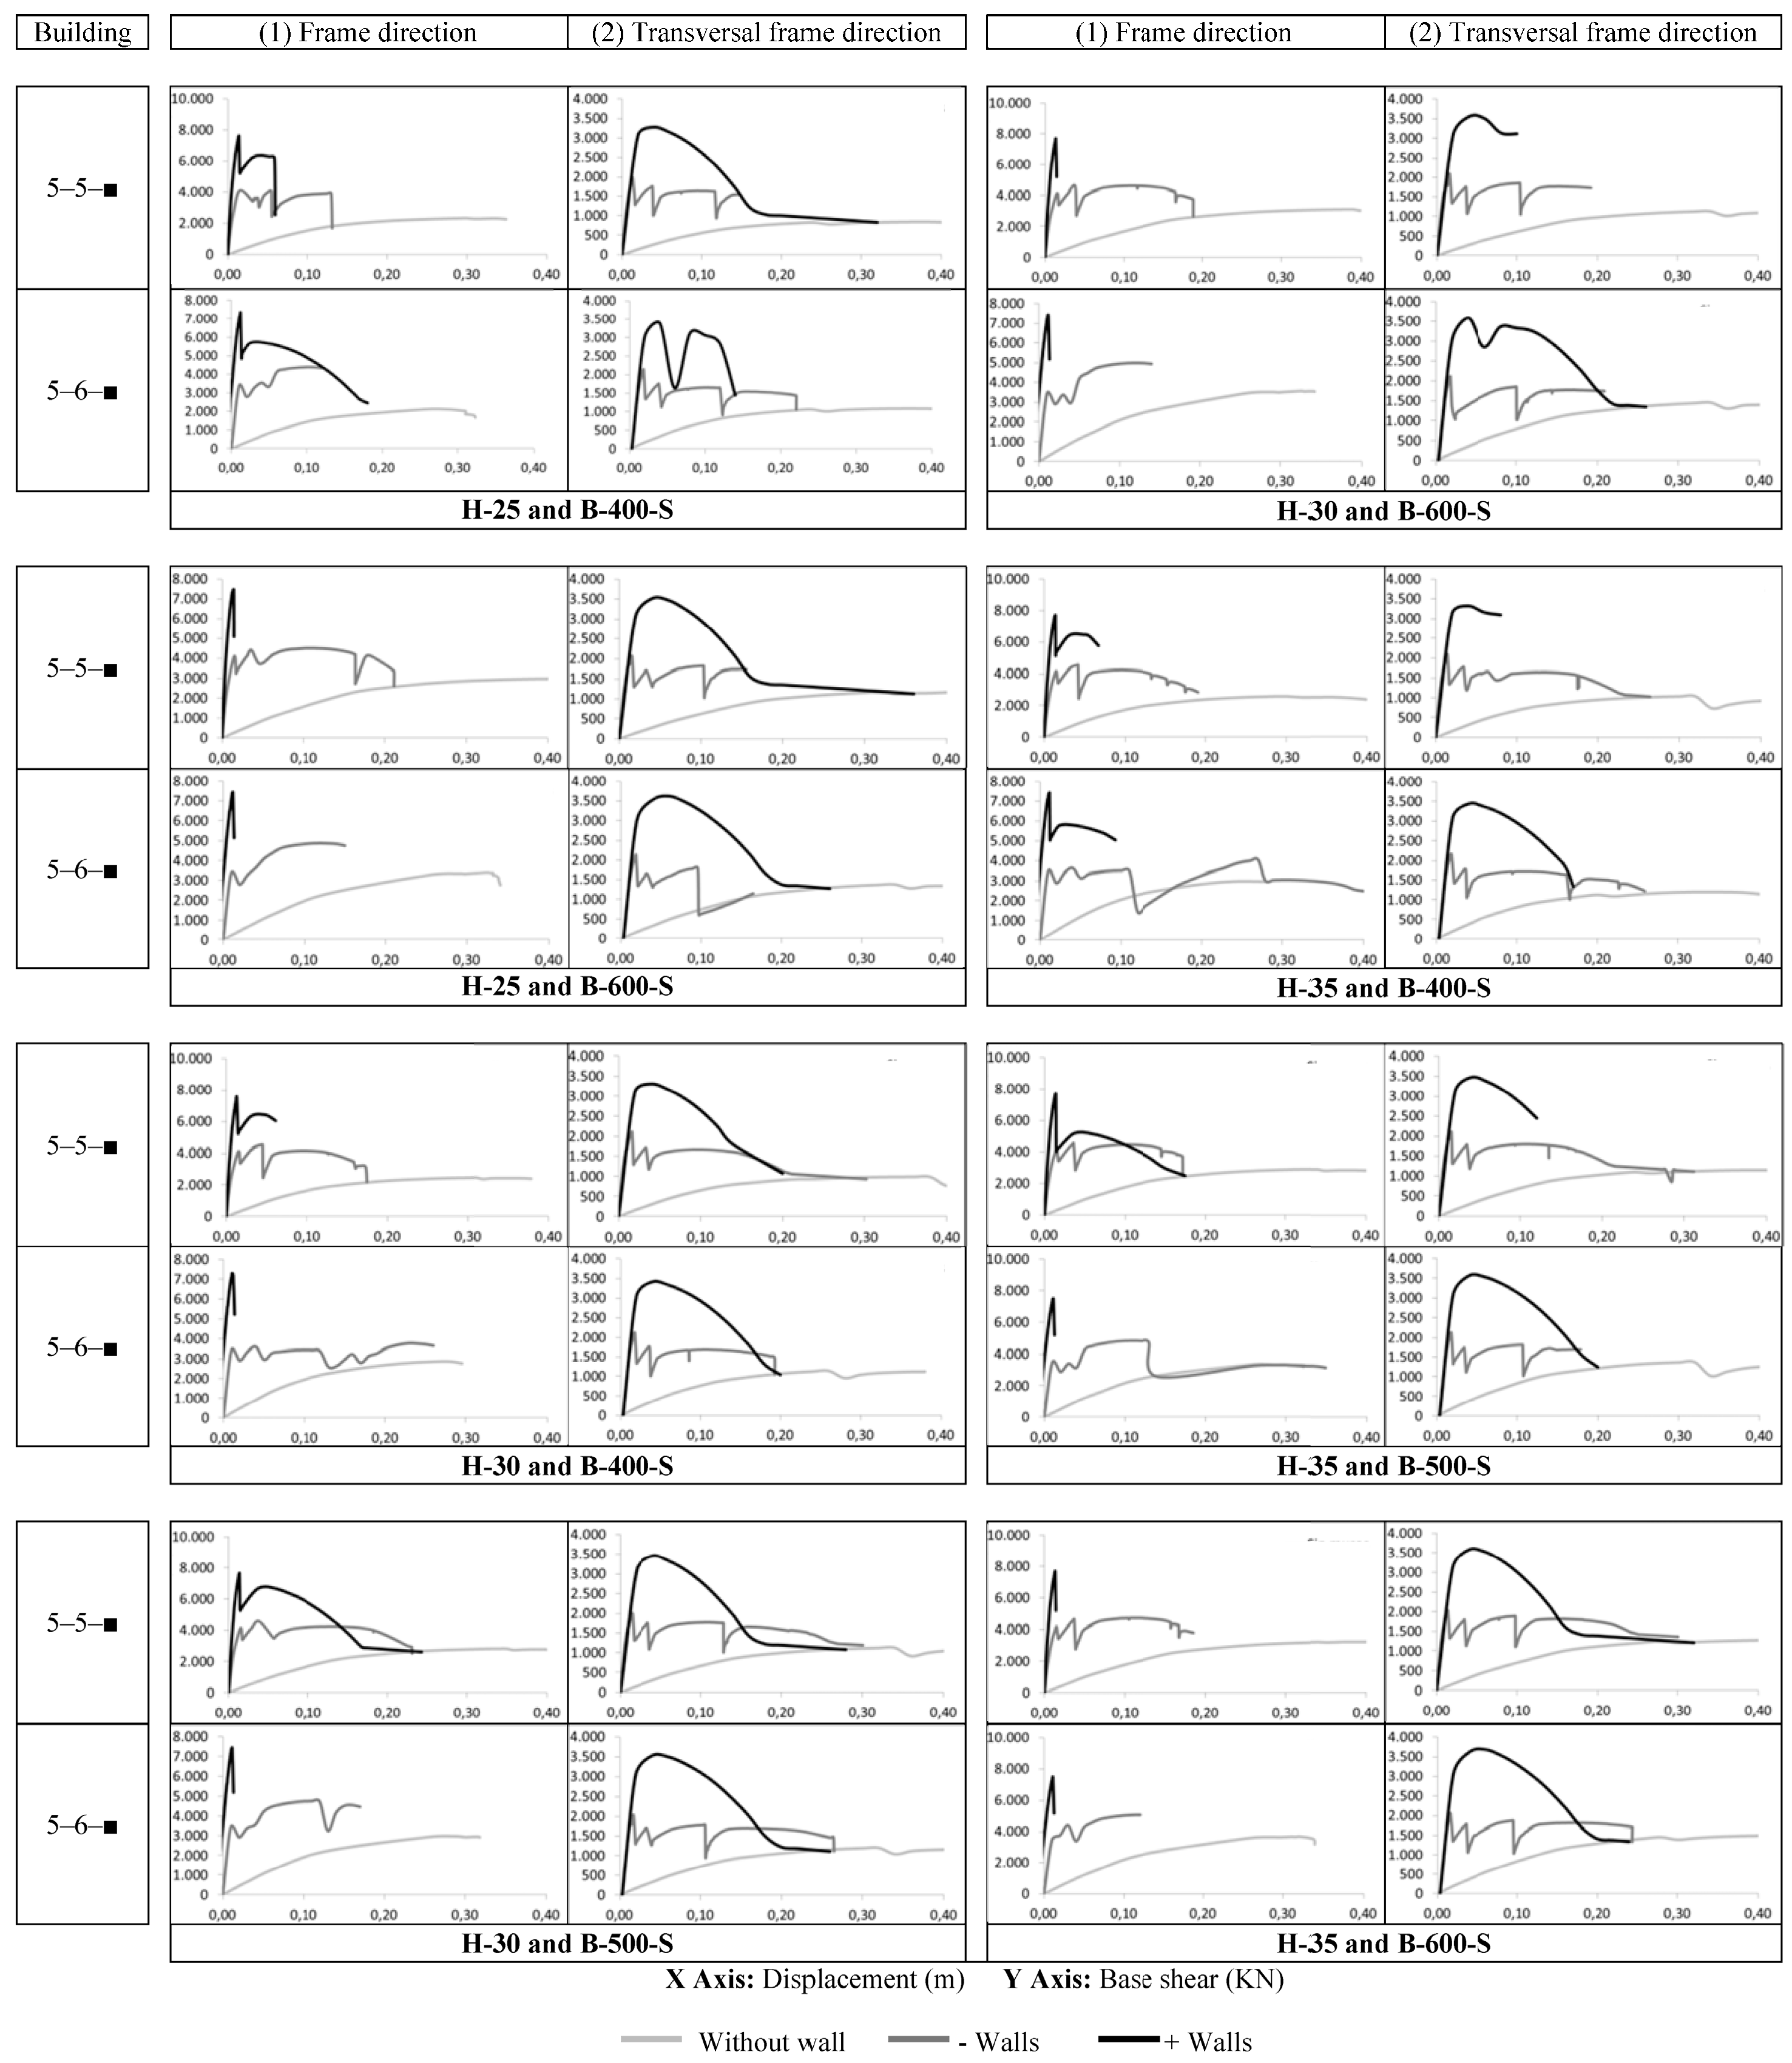
5.1. Non-Linear Static (Pushover) Analysis

A pushover analysis aims to calculate the maximum horizontal load (base shear force) that a structure can withstand. A triangular load distribution was assumed for the calculations in this study. The load was proportionally increased by a factor (λp) until structural instability was reached. At this point, a response control was introduced based on a node displacement increment; in this case, the node was located on the upper-most floor.
Figure 5 shows the capacity or “pushover” curves for the range of building structures described in Table 1 constructed from H-25 concrete (25 MPa) and B-500-S corrugated reinforcing steel. There are two columns in Figure 5: the one on the left shows the maximum upper floor displacements in the frame direction, and the column to the right shows the corresponding displacements in the transverse direction. Curves are shown for all three types of infill wall layouts as explained earlier (without walls, −walls, +walls).
Figure 6 illustrates the capacity or pushover curves for the 5–5–■ and 5–6–■ buildings described in Table 1 for a number of combinations of concrete and steel material properties corresponding to H-30 (30 MPa) and H-35 (35 MPa) concrete and B-400-S and B-600-S reinforcing steel. Similar to Figure 5, the two columns show maximum upper floor frame and transverse direction displacements.
Figure 5 and Figure 6 above show the static “non-linear” behaviour of buildings with and without walls. It is evident from the figures that increasing the strength of the concrete and steel has little effect. Notably, for both the buildings “with walls” in both directions (where the overall building behaviour is well represented by these elements) and in the transverse direction for the buildings “without walls” (where the model results are dominated by the bi-articulated elements due to the lack of continuity of the reinforcement in the lower part of the structure), the results are very similar.
In particular, it is clear that the existence of walls mainly affects the initial parts of the curves, and significantly increases the initial stiffness. This increase is shown in the higher initial slope of the curves and the higher maximum base shear force (ordinate axis) when walls are included. The maximum shear force in the direction of the frames in the buildings “without walls” is approximately twice the maximum base shear force in the transverse direction. This difference reduces as walls are introduced.
Moreover, the maximum displacements occur in the taller buildings, especially in the direction transverse to the frames, due to the greater number of plastic hinges generated in the structure before collapse. Finally, it is necessary to emphasise the early failure of the walls in the structures. Wall failure is associated with the discontinuities in the curves for the buildings with walls. Once all of the walls have failed, the curves for the buildings with walls become similar to the curves for the buildings without walls.
In the same manner, both figures show how the capacity curves decay, mainly due to the breakage of masonry walls. These elements are both stiff and fragile and thus tend to break at the same time. It is for this reason that the decay of the capacity curves is initially very abrupt. In addition, it is clear that the initial stiffness and the maximum base shear force increase significantly with the number of walls. Once the walls collapse, the curves tend to follow the behaviour of the buildings without walls.
It should be noted that the behaviour of buildings without walls is far more ductile that that of the buildings with walls. This can be seen by comparing the lengths of the capacity curves at the point of collapse. This increase in ductility is due to the number of joints that are formed. For design purposes, the ultimate displacement of the structure is normally defined as the displacement at which the base shear force decreases by 20% from the maximum. In this case, the decay of the base shear force prior to collapse occurs in buildings which do not have walls, in other words it affects only the structural elements (columns and beams).
The use of wide beams and slabs with joists creates structures which are very rigid in their transverse direction. It is therefore evident that with this type of structure it is necessary to consider seismically induced damage. The main types of damage induced by seismic events come from excessive flexure of the columns and beams, as well as from strut compression in the infill walls. For this reason, using brick walls in both directions increases the building’s overall structural resistance and stiffness. The contribution of these walls is particularly significant for shorter buildings.

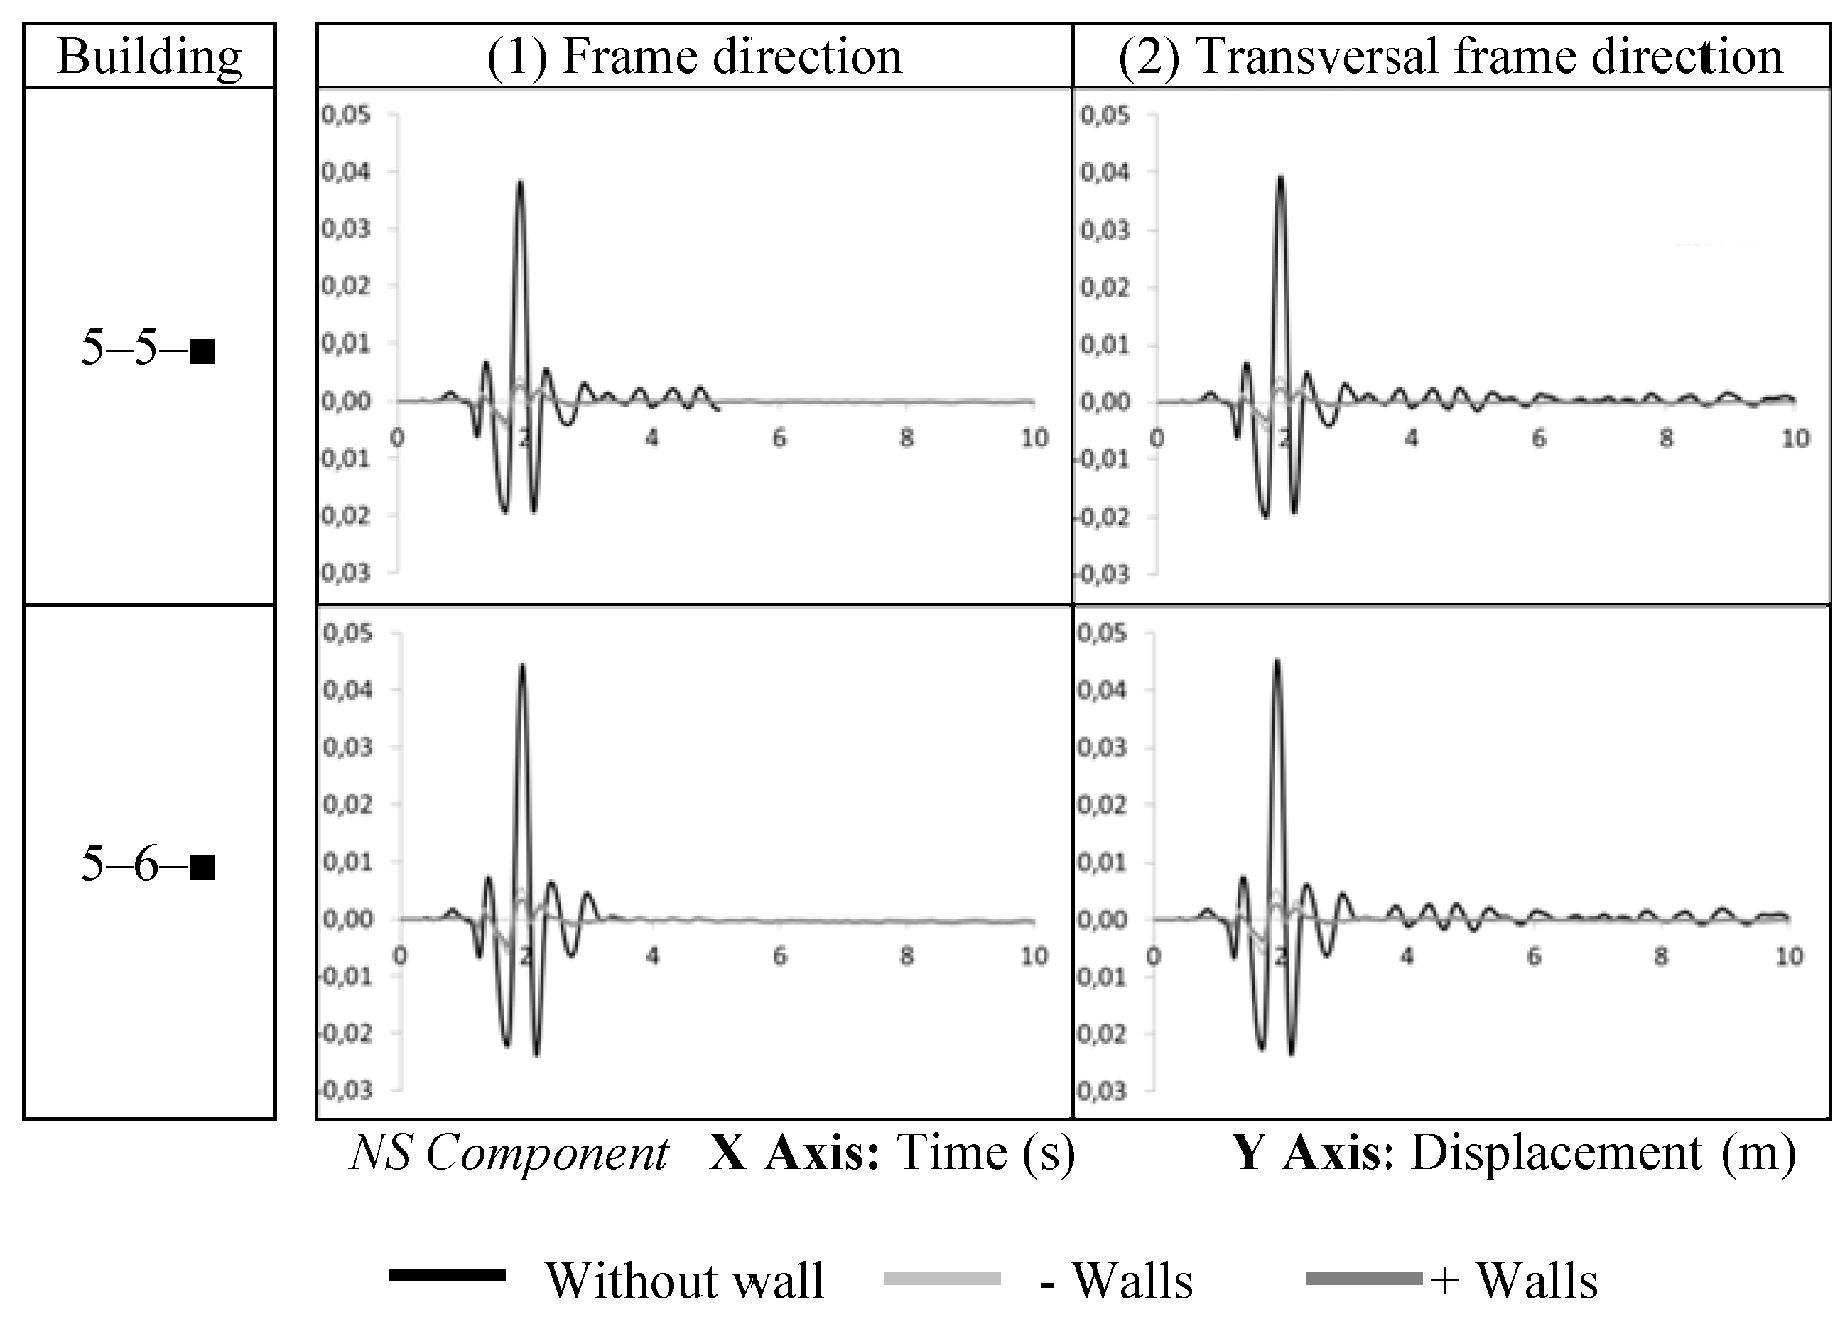
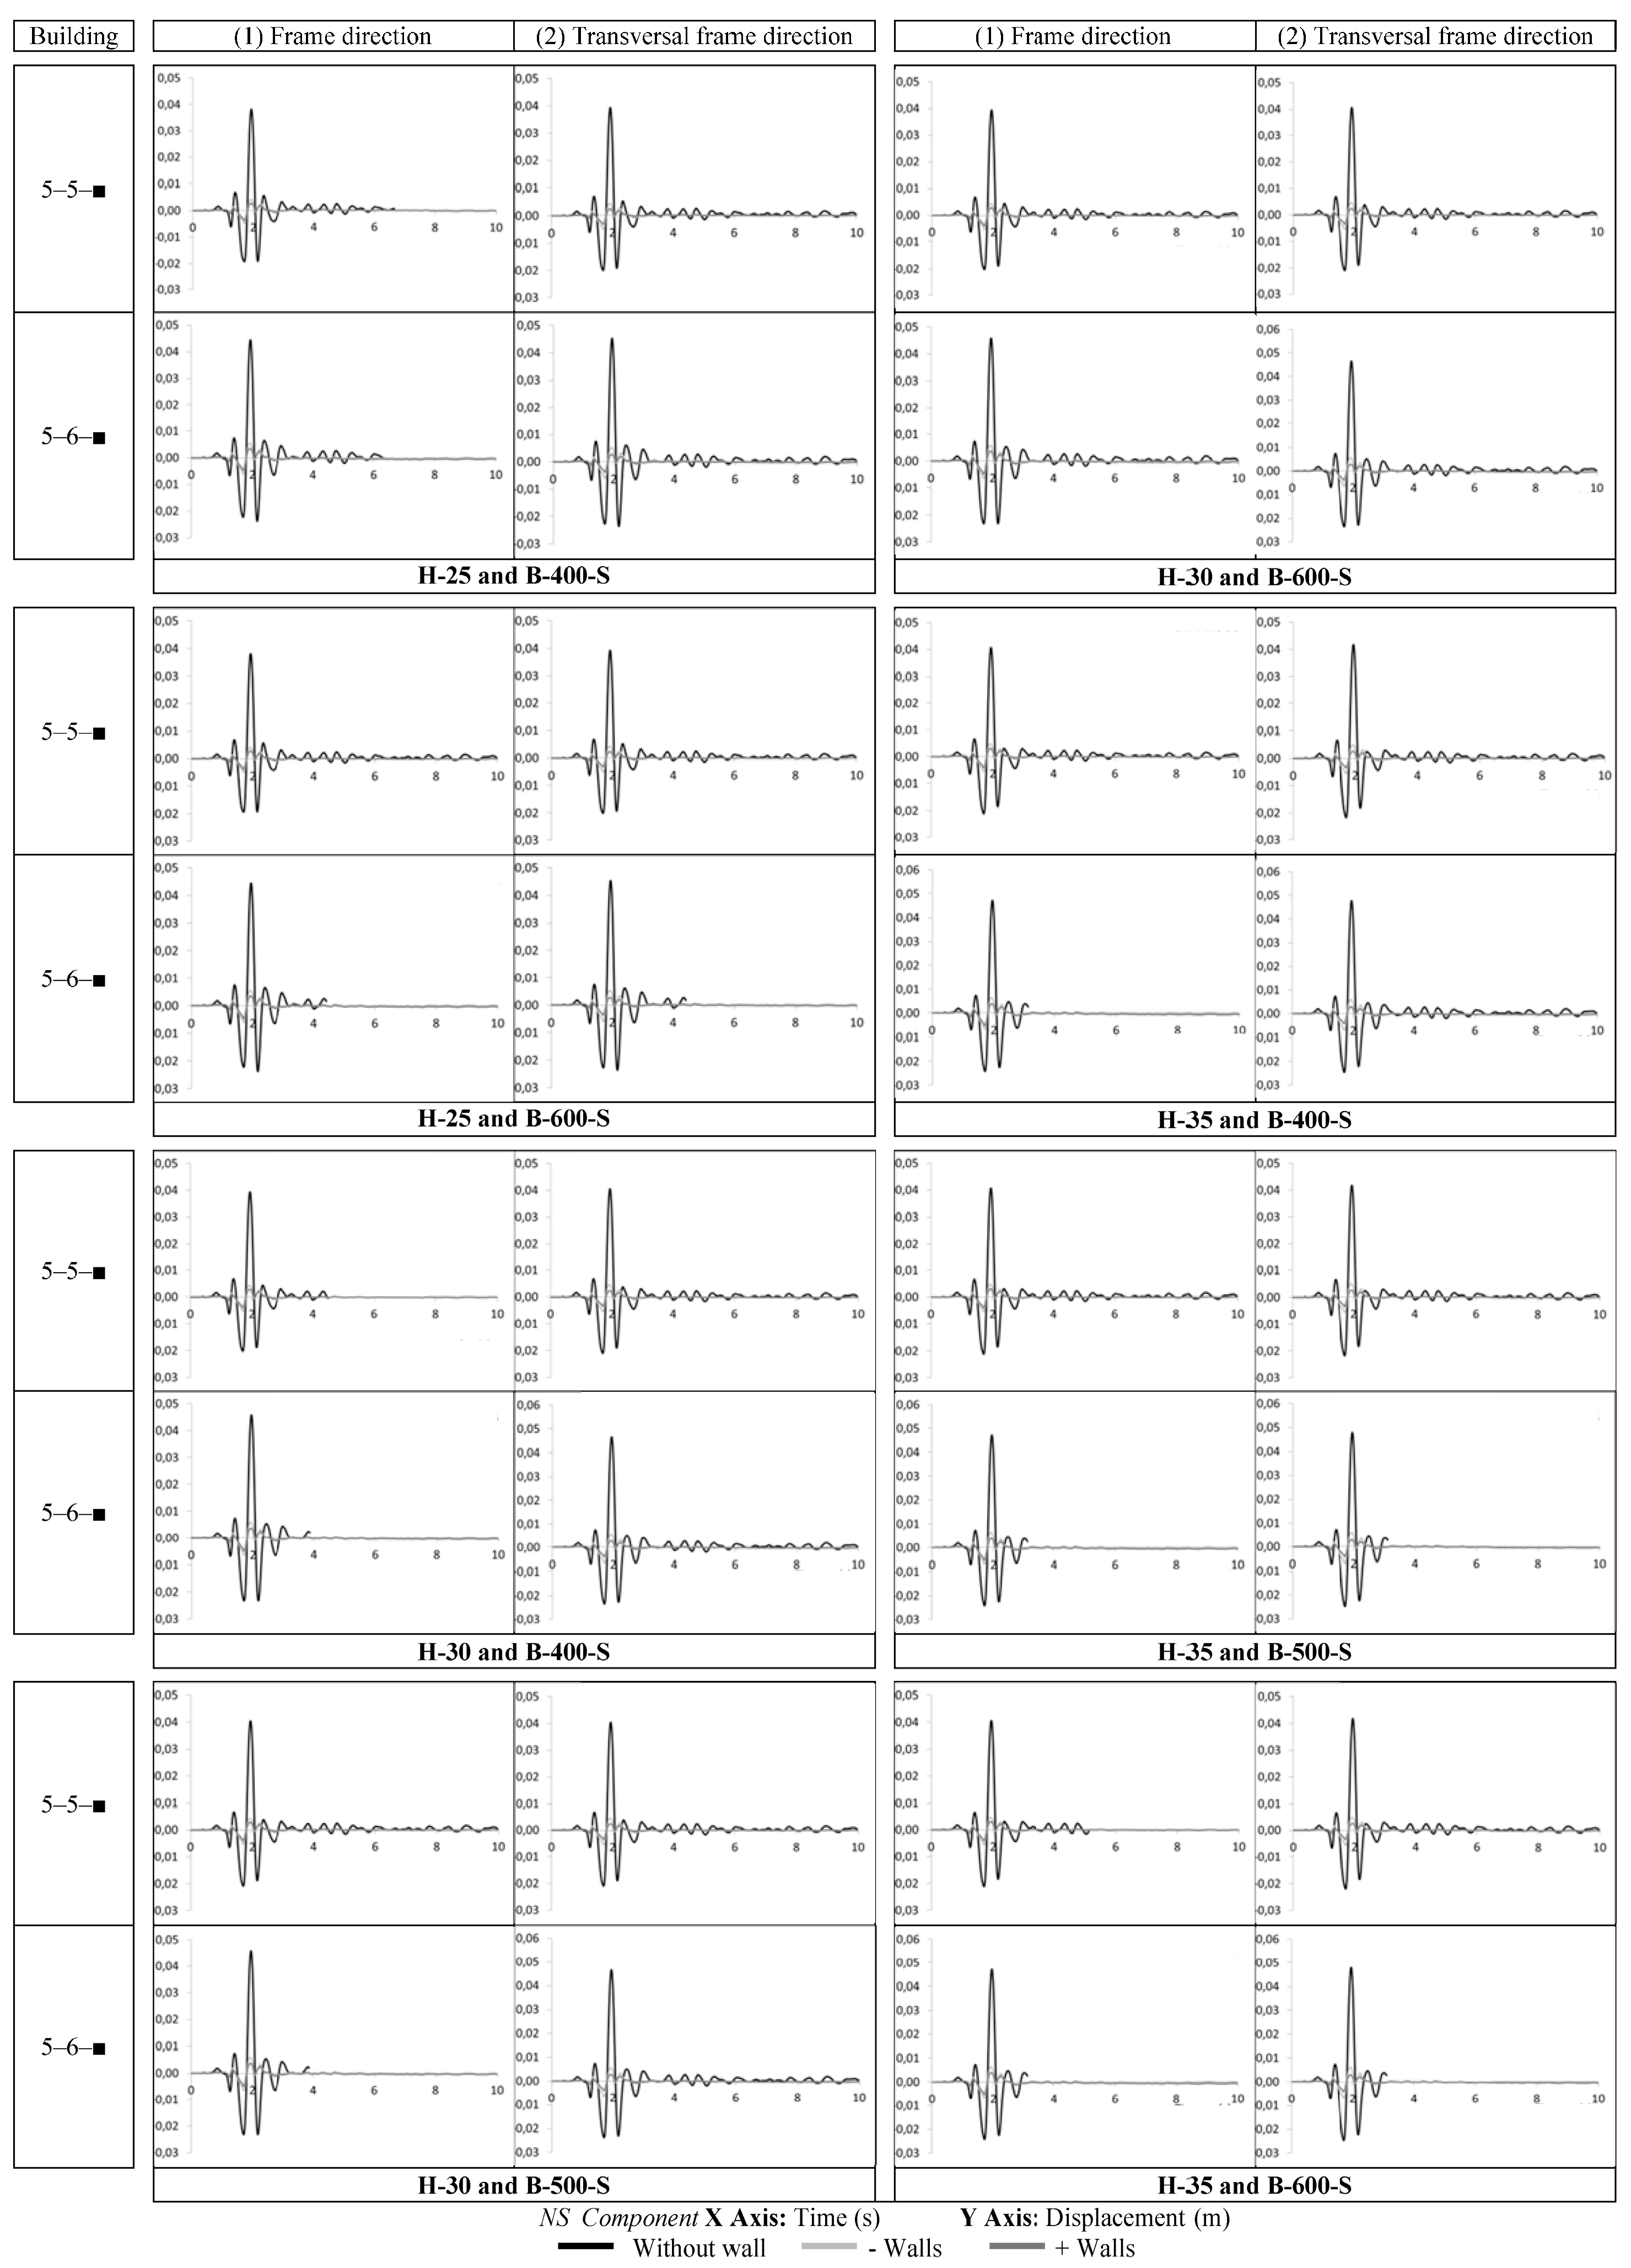
5.2. Dynamic Analysis

Non-linear dynamic analyses [45,58,59] were performed in discrete time following Newmark’s method [48] as discussed above. The time period (Δt) used in the analyses was 0.005 s to match the data from the Lorca earthquake register for the two directions (X, Y). The structure buffer (understood as the visual representation model used by the “Seismostruct” software to represent the structure of the building) was represented by the Rayleigh model (Chopra) with a damping factor of 5%, an average value of our two modes damping values (4% and 6%) which has been used in diverse studies conducted in recent years for this type of building.
Figure 7 shows the displacement of the upper floor from the time-history responses of the 5–5–■ and 5–6–■ buildings, corresponding to the North–South acceleration data shown in Figure 1. This accelerogram was chosen as it was the most severe. The building structures were selected for this analysis as they were deemed to be the most representative of real-life settings. The dynamic responses for both types of building were calculated using the initial set of materials properties for H-25 concrete and B-500-S steel reinforcement. The left column of Figure 7 shows the upper-floor building displacements in the frame direction, and the right column shows the transverse displacements.
Figure 8 shows the dynamic response [60] of the 5–5–■ and 5–6–■ buildings with a range of materials properties used for the constituent parts. Concrete characteristic resistances of fck = 300 kg/cm2 (H-30) and fck = 350 kg/cm2 (H-35), and steel elastic limits of fyk = 4000 kg/cm2 (B 400-S) and fyk = 6000 kg/cm2 (B 600-S) were used for this set of analyses. The same typology of brick walls, symmetric plant layout (“−walls” and “+walls”), heights (to avoid the “short column” effect), brick resistance (fb = 12 MPa) and mortar resistance (fm = 8 MPa) were assumed as in the initial analyses.
The results in Figure 7 and Figure 8 show that the difference in the dynamic response of the 5-storey building without walls is not significant when different concrete and steel strengths are used as evidenced by the similarity in the maximum displacements calculated. On the other hand, the increase in the distance between columns in the buildings without walls leads to a small increase in the maximum displacement of the frames in both directions.
These maximum displacements are very small for the cases with walls, and virtually the same behaviour is seen in both directions. As mentioned before, when there are walls, the strength of the buildings relies on the walls and not on the structural elements of the frames.
Comparing the results for the maximum displacements in the pushover analyses with those obtained in the dynamic calculations, it is possible to conclude that the buildings would not have collapsed during the Lorca earthquake, regardless of whether they contained any walls. In the dynamic analyses, the maximum displacement of the buildings without walls was less than 0.4 m, meaning they would have only reached the plastic regime and would not have collapsed, as can be seen by the capacity curves from the non-linear “push-over” static calculations. The buildings’ resistance improves with the inclusion of walls, and the displacements are practically zero throughout the analysis.

6. Conclusions

After careful interpretation of the results from the analyses carried out in this study, the following practical conclusions can be drawn:
The inclusion of brick walls substantially improves buildings’ seismic resistance, especially for short buildings. In addition, the inclusion of a higher number of walls in the layout significantly reduces a building’s fundamental period. This is related to the associated mass increase, but also to the increase in stiffness. As the interception of the capacity curve with the demand spectrum corresponds to a point with a larger acceleration demand, larger loads are experienced by the structure. Therefore, on the one hand, the inclusion of walls significantly increases the stiffness and reduces the fundamental period of a building in both directions, as can be seen in Table 1, but on the other hand, the walls also increase the mass of the building, leading to an increase in the seismic forces. In medium and short buildings, this effect is not as significant as the increase in stiffness caused by the walls, so overall the building’s resistance will be improved by the addition of walls. However, this is not as clear cut for taller buildings, as the mass increases to a greater extent, and the stiffness may decrease due to the greater height of the building.
Reducing the span between columns can improve a building’s performance when there are no additional walls. The use of rectangular columns does not significantly improve a building’s resistance, rather the structure becomes more fragile and rigid. In particular, the building’s response in the direction of the shorter column dimension diminishes, increasing the structure’s fragility.
When higher strength concrete is used, there are only meaningful resistance improvements in buildings without walls because with walls, the building’s behaviour is dominated by the walls rather than the structural framework. Similarly, an increase in the elastic limit of the reinforcing steel does not have a significant effect on the building’s behaviour. Therefore, the maximum displacements measured when the material properties are changed only have significant variations in buildings without walls.
The inclusion of a small quantity of infill walls almost doubles the resistance of the buildings considered and reduces the maximum displacements of the upper floor by 70% (at least in the case of the dynamic study under loading from the Lorca earthquake in the North-South direction). Comparing the cases with the higher density of infill walls (“+walls”) and the lower density infill walls (“−walls”), the resistant capacity is doubled as the additional walls are added and the upper floor maximum displacements are reduced by 25%.
During the static loading, the brick walls failed before the structural elements (beams and columns). In some capacity curves, the building’s resistance increases as more infill walls are included. Once the walls are broken, the capacity curves tend towards those of the buildings without walls (it is thus concluded that the behaviour of the infill walls is independent from the main structure).
In summary, this study has made contributions on two fronts. First, it has found that the use of high strength concrete and steel in the types of building considered only slightly improves seismic resistance, especially in buildings with infill walls. The effect is more significant in the direction transverse to the frames where there is no continuity of the reinforcement at the bottom of the structural elements. The overall effect is that the frames turn into articulated structures.
Second, this work shows how the use of brick walls can improve the seismic behaviour of buildings with less than eight stories. In addition, the use of beams in both directions rather than prefabricated elements (joists) can improve the structural behaviour of buildings. It should be noted that the proposed recommendations are suitable for buildings in regions with low-to-moderate seismicity.
Finally, regarding the effect of the bond between the walls and the frame on the overall effectiveness of the walls, it is important to highlight that the walls are not anchored to the structure, but are separated, so they are considered as independent elements in the behavior of the structure. The union of both elements would lead to a greater complexity in the structural modeling of the buildings, giving rise to the generation of confined walls, which is outside the objectives of this work.

Acknowledgments

This research was funded by the Chilean CONICYT grant under the program: FONDECYT Initiation for Research in 2014 (Project folio 11140128).

Author Contributions

All authors contributed extensively to the work presented in this paper. David Dominguez-Santos contributed to the research, modelling, data analysis and manuscript writing. Pablo Ballesteros-Perez contributed to the modeling, the manuscript writing and the manuscript review. Daniel Mora-Melia contributed to the literature review, the data analysis, the manuscript writing and manuscript review.

Conflicts of Interest

The authors declare no conflict of interest.

References

  1. Milsom, J. The Vrancea seismic zone and its analogue in the Banda Arc, eastern Indonesia. Tectonophysics 2005, 410, 325–336. [Google Scholar] [CrossRef]
  2. Chiarabba, C.; Amato, A.; Anselmi, M.; Baccheschi, P.; Bianchi, I.; Cattaneo, M.; Cecere, G.; Chiaraluce, L.; Ciaccio, M.G.; de Gori, P. The 2009 L’Aquila (central Italy) M(W)6.3 earthquake: Main shock and aftershocks. Geophys. J. Int. 2009, 36, L18308. [Google Scholar]
  3. Gigantesco, A.; Mirante, N.; Granchelli, C.; Diodati, G.; Cofini, V.; Mancini, C.; Carbonelli, A.; Tarolla, E.; Minardi, V.; Salmaso, S. Psychopathological chronic sequelae of the 2009 earthquake in L’Aquila, Italy. J. Affect. Disord. 2013, 148, 265–271. [Google Scholar] [CrossRef] [PubMed]
  4. Abolmasov, B.; Jovanovski, M.; Feri, P.; Mihali, S. Losses due to historical earthquakes in the Balkan region: Overview of publicly available data. Geofizika 2011, 28, 161–181. [Google Scholar]
  5. Escobedo, A. Damage assessment on building structures subjected to the recent near-fault earthquake in Lorca (Spain). In Proceedings of the 15th World Conference On Earthquake Engineering, Lisbon, Portugal, 24–28 September 2012. [Google Scholar]
  6. López-Comino, J.-A.; de Lis Mancnilla, F.; Morales, J.; Stich, D. Rupture directivity of the 2011, Mw 5.2 Lorca earthquake (Spain). Geophys. Res. Lett. 2012, 39. [Google Scholar] [CrossRef]
  7. European Committee for Standardization. Eurocode 8: Design of Structures for Earthquake Resistance—Part 1: General Rules, Seismic Actions and Rules for Buildings; European Committee for Standardization: Brussels, Belgium, 2004. [Google Scholar]
  8. López-López, A.; Tomás, A.; Sánchez-Olivares, G. Behaviour of reinforced concrete rectangular sections based on tests complying with seismic construction requirements. Struct. Concr. 2016, 17, 656–667. [Google Scholar] [CrossRef]
  9. López-López, A.; Tomás, A.; Sánchez-Olivares, G. Influence of adjusted models of plastic hinges in nonlinear behaviour of reinforced concrete buildings. Eng. Struct. 2016, 124, 245–257. [Google Scholar] [CrossRef]
  10. López-Almansa, F.; Domínguez, D.; Benavent-Climent, A. Vulnerability analysis of RC buildings with wide beams located in moderate seismicity regions. Eng. Struct. 2013, 46, 687–702. [Google Scholar] [CrossRef] [Green Version]
  11. Dominguez, D.; Almansa, F.L.; Climent, A.B. Comportamiento, para el terremoto de Lorca de 11-05-2011, de edificios de vigas planas proyectados sin tener en cuenta la acción sísmica. Inf. Constr. 2014, 66. (In Spanish) [Google Scholar] [CrossRef] [Green Version]
  12. Alam, N.; Alam, M.S.; Tesfamariam, S. Buildings’ seismic vulnerability assessment methods: A comparative study. Nat. Hazards 2012, 62, 405–424. [Google Scholar] [CrossRef]
  13. Calvi, G.M.; Pinho, R.; Magenes, G.; Bommer, J.J.; Crowley, H. Development of seismic vulnerability assessment methodologies over the past 30 years. Earthquake 2006, 43, 75–104. [Google Scholar]
  14. Freeman, S.A.; Nicoletti, J.P.; Tyrrell, J.B. Evaluations of existing buildings for seismic risk—A case study of Puget Sound naval shipyard, Bremerton, Washington. In Proceedings of the US National Conference on Earthquake Engineering, Ann Arbor, MI, USA, 18–20 June 1975; pp. 113–122. [Google Scholar]
  15. Comartin, C.D.; Rojahn, C.; Niewiarowski, R.W. Seismic Evaluation and Retrofit of Concrete Buildings; California Seismic Safety Commission: Sacramento, CA, USA, 1996; ATC-40.
  16. Calvi, G.M.; Priestley, N. Design and Assessment of Bridges. In Advanced Earthquake Engineering Analysis; Pecker, A., Ed.; Springer: Berlin, Germany, 2007; pp. 155–179. [Google Scholar]
  17. Fajfar, P.; Fischinger, M. N2—A method for non-linear seismic analysis of regular buildings. In Proceedings of the 9th World Conference on Earthquake Engineering, Tokyo, Japan, 2–9 August 1988; pp. 111–116. [Google Scholar]
  18. Churilov, S.; Dumova-Jovanoska, E. In-plane shear behaviour of unreinforced and jacketed brick masonry walls. Soil Dyn. Earthq. Eng. 2013, 50, 85–105. [Google Scholar] [CrossRef]
  19. Ghosh, S.; Datta, D.; Katakdhond, A.A. Estimation of the Park-Ang damage index for planar multi-storey frames using equivalent single-degree systems. Eng. Struct. 2011, 33, 2509–2524. [Google Scholar] [CrossRef]
  20. Rossetto, T.; Elnashai, A. A new analytical procedure for the derivation of displacement-based vulnerability curves for populations of RC structures. Eng. Struct. 2005, 27, 397–409. [Google Scholar] [CrossRef]
  21. Haldar, A.; Mahadevan, S. Probability, Reliability, and Statistical Methods in Engineering Design; John Wiley: Hoboken, NJ, USA, 2000. [Google Scholar]
  22. Kroese, D.P.; Brereton, T.; Taimre, T.; Botev, Z.I. Why the Monte Carlo method is so important today. Wiley Interdiscip. Rev. Comput. Stat. 2014, 6, 386–392. [Google Scholar] [CrossRef]
  23. Casas, J.R.; Wisniewski, D.F.; Cervenka, J.; Plos, M. Safety and Probabilistic Modelling: Background Document D4.4; Sustainable Bridges–VI Framework Program: Brussels, Belgium, 2007. [Google Scholar]
  24. Vargas, Y.F.; Pujades, L.G.; Barbat, A.H.; Hurtado, J.E. Incremental dynamic analysis and pushover analysis. A probabilistic comparison. In Computational Methods in Stochastic Dynamics; Springer: Berlin, Germany, 2011. [Google Scholar]
  25. Vielma-Perez, J.C.; Barbat, A.H.; Oller, S. Curvas de fragilidad y matrices de probabilidad de daño de edificios de concreto armado con ductilidad limitada. Rev. Desastr. Nat. Accid. Infraestruct. Civ. 2007, 7, 273–286. (In Spanish) [Google Scholar]
  26. Applied Technology Council. Improvement of Nonlinear Static Seismic Analysis Procedures; ATC-55 Project; Federal Emergency Management Agency: Washington, DC, USA, 2005.
  27. Marques, R.; Lourenço, P.B. Unreinforced and confined masonry buildings in seismic regions: Validation of macro-element models and cost analysis. Eng. Struct. 2014, 64, 52–67. [Google Scholar] [CrossRef] [Green Version]
  28. Domínguez, D. Seismic vulnerability analysis of wide-beam buildings in Spain. In Proceedings of the 15th World Conference on Earthquake Engineering, Lisboa, Portugal, 24–28 September 2012. [Google Scholar]
  29. Benavent-Climent, A.; Cahís, X.; Vico, J.M. Interior wide beam-column connections in existing RC frames subjected to lateral earthquake loading. Bull. Earthq. Eng. 2009, 8, 401–420. [Google Scholar] [CrossRef]
  30. Barbat, A.H.; Pujades, L.G.; Lantada, N. Performance of buildings under earthquakes in Barcelona, Spain. Comput. Civ. Infrastruct. Eng. 2006, 21, 573–593. [Google Scholar] [CrossRef]
  31. Barbat, A.H.; Carreño, M.L.; Pujades, L.G.; Lantada, N.; Cardona, O.D.; Marulanda, M.C. Seismic vulnerability and risk evaluation methods for urban areas. A review with application to a pilot area. Struct. Infrastruct. Eng. 2010, 6, 17–38. [Google Scholar] [CrossRef]
  32. Guéguen, P.; Michel, C.; LeCorre, L. A simplified approach for vulnerability assessment in moderate-to-low seismic hazard regions: Application to Grenoble (France). Bull. Earthq. Eng. 2007, 5, 467–490. [Google Scholar] [CrossRef]
  33. Michel, C.; Guéguen, P.; Lestuzzi, P.; Bard, P.-Y. Comparison between seismic vulnerability models and experimental dynamic properties of existing buildings in France. Bull. Earthq. Eng. 2010, 8, 1295–1307. [Google Scholar] [CrossRef]
  34. Mucciarelli, M.; Contri, P.; Monachesi, G.; Calvano, G.; Gallipoli, M. An empirical method to assess the seismic vulnerability of existing buildings using the HVSR technique. Pure Appl. Geophys. 2002, 158, 2635–2647. [Google Scholar] [CrossRef]
  35. Dolce, M.; Kappos, A.; Masi, A.; Penelis, G.; Vona, M. Vulnerability assessment and earthquake damage scenarios of the building stock of Potenza (Southern Italy) using Italian and Greek methodologies. Eng. Struct. 2006, 28, 357–371. [Google Scholar] [CrossRef]
  36. Manfredi, G. Evaluation of seismic energy demand. Earthq. Eng. Struct. Dyn. 2001, 30, 485–499. [Google Scholar] [CrossRef]
  37. Ministerio de Fomento. Instrucción de Hormigón Estructural EHE 08; Ministerio de Fomento: Madrid, Spain, 2008. (In Spanish)
  38. Ministerio de Vivienda. Documento básico. Código técnico de la edificación. Acciones en la edificación, DB-CTE-SE-AE; Ministerio de Vivienda: Madrid, Spain, 2006. (In Spanish)
  39. De Luca, F.; Verderame, G.M.; Gómez-Martínez, F.; Pérez-García, A. The structural role played by masonry infills on RC building performances after the 2011 Lorca, Spain, earthquake. Bull. Earthq. Eng. 2013, 12, 1999–2026. [Google Scholar] [CrossRef] [Green Version]
  40. SeismoSoft. SeismoStruct—A Computer Program for Static and Dynamic Nonlinear Analysis of Framed Structures. Available online: http://www.seismosoft.com (accessed on 30 December 2016).
  41. Zieenkiewicz, O.C.; Taylor, R.L. The Finite Element Method; Elsevier: Amsterdam, The Netherlands, 1993. [Google Scholar]
  42. Scott, M.H.; Fenves, G.L. Plastic hinge integration methods for force-based beam–column elements. J. Struct. Eng. 2006, 132, 244–252. [Google Scholar] [CrossRef]
  43. Mander, J.B.; Priestley, M.J.N.; Park, R. Theoretical stress strain model for confined concrete. J. Struct. Eng. 1988, 114, 1804–1825. [Google Scholar] [CrossRef]
  44. Ferrara, E.; Bosco, M.; Ghersi, A.; Marino, E.M.; Rossi, P.P. Improvement of the model proposed by Menegotto and Pinto for steel. Eng. Struct. 2016, 124, 442–456. [Google Scholar]
  45. Spacone, E.; Filippou, F. Flexibility-based frame models for nonlinear dynamic analysis. In Proceedings of the 11th World Conference on Earthquake Engineering, Acapulco, Mexico, 23–28 June 1996. [Google Scholar]
  46. Scott, M.H.; Fenves, G.L.; McKenna, F.; Filippou, F.C. Software patterns for nonlinear beam-column models. J. Struct. Eng. 2008, 134, 562–571. [Google Scholar] [CrossRef]
  47. Belletti, B.; Damoni, C.; Hendriks, M.; de Boer, A. Analytical and numerical evaluation of the design shear resistance of reinforced concrete slabs. Struct. Concr. 2014, 15, 317–330. [Google Scholar] [CrossRef]
  48. Newmark, N.M. A method of computation for structural dynamics. J. Eng. Mech. Div. 1959, 85, 67–94. [Google Scholar]
  49. Gavin, H. Numerical Integration for Structural Dynamics; Department of Civil and Environmental Engineering, Duke University: Durham, NC, USA, 2001. [Google Scholar]
  50. Mergos, P.E.; Kappos, A.J. Estimating fixed-end rotations of reinforced concrete members at yielding and ultimate. Struct. Concr. 2015, 16, 537–545. [Google Scholar] [CrossRef]
  51. Crisafulli, F.J.; Carr, A.J.; Park, R. Experimental response of framed masonry structures designed with new reinforcing details. Bull. N. Z. Soc. Earthq. Eng. 2005, 38, 19–32. [Google Scholar]
  52. Priestley, M.J.N.; Grant, D.N.; Blandon, C.A. Direct displacement-based seismic design. In Proceedings of the 2005 New Zealand Society for Earthquake Engineering Conference, Wairakei, New Zealand, 11–13 March 2005. [Google Scholar]
  53. European Committee for Standardization. Eurocode 6: Design of Masonry Structures; European Committee for Standardization: Brussels, Belgium, 2005. [Google Scholar]
  54. Mostafaei, H.; Kabeyasawa, T. Masonry walls on the seismic response of reinforced concrete buildings subjected to the 2003 Bam earthquake strong motion: A case study of Bam telephone center. Earthq. Res. Inst. Univ. 2004, 79, 133–156. [Google Scholar]
  55. Priestley, M.J.N.; Paulay, T. Seismic Design of Reinforced Concrete and Masonry Buildings; Wiley: Hoboken, NJ, USA, 1992. [Google Scholar]
  56. American Concrete Institute. Building Code Requirements for Masonry Structures and Specifications for Masonry Structures; American Concrete Institute: Farmington Hills, MI, USA, 1988. [Google Scholar]
  57. Madia, F.C.A.; Parsekian, G.A. Modeling a reinforced concrete building frame with infill. In Proceedings of the 11th North American Masonry Conference, University of Minnesota, Minneapolis, MN, USA, 5–8 June 2011. [Google Scholar]
  58. Filippou, F.C.; Ambrisi, A.D.; Issa, A. Nonlinear Static and Dynamic Analysis of Reinforced Concrete Subassemblages; Earthquake Engineering Research Center, College of Engineering, University of California: Oakland, CS, USA, 1992. [Google Scholar]
  59. Magnusson, J.; Hallgren, M.; Ansell, A. Shear in concrete structures subjected to dynamic loads. Struct. Concr. 2014, 15, 55–65. [Google Scholar] [CrossRef]
  60. Spiliopoulos, K.V.; Lykidis, G.C. An efficient three-dimensional solid finite element dynamic analysis of reinforced concrete structures. Earthq. Eng. Struct. Dyn. 2006, 35, 137–157. [Google Scholar] [CrossRef]
Figure 1. Accelerogram and response spectra from Lorca (11 May 2011); (a) North–South direction (NS); (b) East–West direction (EW); (c) Comparison of response spectra.
Buildings 07 00089 g001aBuildings 07 00089 g001b
Figure 2. Structural and construction details of buildings with wide beams considered; (a) 3 Storey building; (b) 5 Storey building; (c) 8 Storey building; (d) Plan type of building considered; (e) Waffle slab detail.
Buildings 07 00089 g002
Figure 3. Locations of the infill walls (shaded in black colour) within the building structures considered; (a) “−Walls”; (b) “+Walls”.
Buildings 07 00089 g003
Figure 4. Infill wall model: element definition and displacements (a) and distribution of stresses (b).
Buildings 07 00089 g004
Figure 5. Capacity curves of buildings with H-25 (25 MPa) concrete and B-500-S steel.
Buildings 07 00089 g005
Figure 6. Capacity curves of buildings 5–5–■ and 5–6–■ made from various combinations of H-25, H-30 and H35 concrete and B-400-S, B-500-S and B-600-S steel.
Buildings 07 00089 g006
Figure 7. Dynamic response of buildings 5–5–■ and 5–6–■ (HA-25 and B-500-S) to a seismic event based on Lorca’s earthquake register (11th May 2011).
Buildings 07 00089 g007
Figure 8. Response of buildings 5–5–■ and 5–6–■ built with various combinations of H-25, H-30 and H35 and B-400-S, B-500-S and B-600S.
Buildings 07 00089 g008
Table 1. Structural details and fundamental periods of buildings considered.
BuildingHeight (m)Columns Ground Floor (cm2)Column Upper Floor (cm2)Wide Beams (cm2)Weight (kN)Fundamental Period (s) (Frame Direction/in the Transversal Frame Dir.)
“Without Walls”“−Walls”“+Walls”
3–5–■1035 × 3535 × 3540 × 30117251.041/0.9140.211/0.2090.140/0.139
3–6–■1035 × 3535 × 3540 × 35141701.162/1.0160.232/0.2300.153/0.153
5–5–■1645 × 4535 × 3540 × 30195421.551/1.3760.342/0.3400.228/0.227
5–6–■1645 × 4535 × 3540 × 35236171.731/1.5340.377/0.3750.250/0.249
8–5–■2555 × 5535 × 3540 × 30312673.108/3.0710.547/0.5460.361/0.361
8–6–■2555 × 5535 × 3540 × 35377873.576/3.4460.602/0.6010.397/0.397
8–5–▐2580 × 3040 × 3040 × 30297044.927/1.8450.538/0.5200.354/0.348
8–6–▐2580 × 3040 × 3040 × 35358985.481/2.0730.592/0.5720.389/0.383

