Spatial Multi-Criteria Decision Support System and Strategic Environmental Assessment: A Case Study


Department of Industrial Engineering, University of Naples Federico II, Via Claudio 21, 80125 Naples, Italy
*
Author to whom correspondence should be addressed.
Buildings 2017, 7(4), 96; https://doi.org/10.3390/buildings7040096
Submission received: 18 July 2017
/
Revised: 16 October 2017
/
Accepted: 18 October 2017
/
Published: 26 October 2017
(This article belongs to the Special Issue Real Estate Economics, Management and Investments)
Abstract
:This contribution focuses on the Strategic Environmental Assessment (SEA) as an important tool to ensure sustainable development and reach a high level of environmental protection. More specifically, this paper provides an evaluation method based on the integration of Geographic Information System (GIS) and Multi-criteria Analysis—named Integrated Spatial Multi-criteria Decision Support System (ISMDSS)—to support the preparation of environmental assessment reports and the construction of scenarios for the adoption of urban plans, as an innovative tool that integrates objectives and multidimensional (economic, environmental, and social) components, as well as different approaches and models for the construction of a long-term shared vision. In particular, considerations are made by presenting a thought-provoking case study on the SEA of the urban plan of the municipality of Marzano di Nola, located in the province of Avellino in the Campania region. The experiment carried out showed the potentiality of the ISMDSS to evaluate the impacts of different scenarios with the aim of developing a sustainable urban municipal plan. The spatial dimension is useful in understanding the dynamics that characterize each environmental topic in a specific area, by considering not only the components of the natural and developed environment, but also the interactions with social and economic components.
1. Introduction
In recent decades, the awareness of the multidimensionality and complexity of planning process has led to the introduction of a new evaluation approach to support the decision-making process, with the aim of integrating different components (including socioeconomic, ecologic environmental, and technical dimensions), reducing elements of uncertainty, and promoting the participation of different kinds of stakeholders [1,2,3,4,5].
Of note, the Directive 2001/42/EC (SEA Directive) has introduced the Strategic Environmental Assessment (SEA) of plans, with the aim of ensuring a high level of environmental protection and promoting the integration of environmental and social considerations in strategic decision-making processes (article 1 of the directive).
In Italy, SEA is regulated by Legislative Decree No. 152/2006 and subsequent amendments (Environmental Code), as well as by regional legislation. Since 2000, many regional and local authorities in Italy have introduced SEA procedures—originally on a voluntary basis and then in implementing the Environment Code—as part of the approval process of plans or territorial programs (ANCE—National Association of Building Constructors—Report, 2013). The Campania region introduced Regulation No. 5/2011—in compliance with the Regional Law No. 16/2004, then detailed in a “technical handbook” (2012)—as a support for the public authorities in their work. Any plan or program that may have a significant impact on the environment and on cultural heritage is subject to an SEA. This includes plans or programs that: (a) are developed to evaluate and manage air quality (for agriculture, forestry, fisheries, energy, industry, transport, waste management, water management, telecommunications, tourism, town planning, or land use sectors under article 6, paragraph 2, letter (a) of the Environmental Code; (b) are intended to provide special protection areas for the conservation of wild birds or areas classified as sites of community importance for the protection of natural habitats and of wild flora and fauna (article 6, paragraph 2, letter (b)); and any other plans and programs that (c) are likely to have a significant environmental impact (article 6, paragraph 3, letter (a)). Therefore, the SEA is a tool to evaluate, manage, and monitor plans, policies, and programs. It is divided into an operating process that includes: (a) the development of an environmental report; (b) public consultations; (c) an assessment of the environmental report and the outcome of the consultations; (d) the decision; (e) information on the decision; and (f) monitoring (article 11 of the Environmental Code). Currently, the SEA takes into consideration the overall effects of management choices and territorial development using a multidimensional approach [6]. The SEA, particularly innovative compared to the traditional planning process, includes a participatory decision-making process to protect legitimate interests and the creation of the conditions for consensus among stakeholders on actions to be implemented in a territory. In fact, the participation of all the stakeholders is considered in each phase of the decision-making process, with particular emphasis on the involvement of the local population.
A review of the effectiveness of SEA in Ireland [7] and other European countries revealed the weaknesses and strengths of the procedure, looking at many case studies concluded in the last year. The majority of the cases demonstrate that the generation of reasonable alternatives is one of the biggest challenges for SEA. Nevertheless, the extent and quality of how alternatives are developed and considered is limited—planners often consider that there are no reasonable arguments against their plan and that consultants’ alternatives are not reasonable. Best practice examples highlight the fact that public consultation can stimulate creative thinking and that the integration of SEA procedures into the planning process can improve the capacity to identify and resolve issues at a very early stage, helping to eliminate the need for changes later in the process.
The final recommendation highlights the need for integrated approaches that take into consideration technical and multidimensional tools that promote dialogue and interaction between different knowledge bases, as well as between technical evaluations and evaluations of a political nature [8,9]. Practice has demonstrated that the SEA procedure is focused not only on technical in-depth analysis, but also on the understanding of complex values. Therefore, in assessing the impacts of policies, plans, and programs, sufficient attention should be given to the values of affected communities and to the planned communication mechanisms—whether they are available or need to be put in place [10].
In this context, the evaluation plays an important role both in the definition of alternatives and in the impact assessment phase [8,11]. As argued by Partidario, there are no really specific SEA methods or techniques—each case normally adopts a different approach, encompassing a sequence of several activities through stages in a rather systematic phasing, independent of, or integrated into, the decision-making process. In fact, it was found that SEA borrows methods and techniques from diverse sources ranging from policy-making and evaluation, to planning, to project assessment, etc. [12,13].
In the present paper, the integration of different approaches is proposed in coordination with the specific peculiarity of the case study under analysis. Due to complex problems of a multidimensional nature that change over time and within the spatial dimension, a Multi-criteria Spatial Decision Aid (MSDA) [14,15] is proposed, which is based on the integration of Multi-criteria Decision Analysis and Geographic Information System (GIS).
Spatial Multi-criteria Decision Analysis refers to the application of multi-criteria analysis in a spatial context where alternative, different criteria and other elements of the decision problem have an explicit spatial dimension [16].
The methodology will be integrated in the first stage of the analysis with a consultative tool—namely, interviews with the local population—with the aim of understanding the perceptions of the community in terms of criticism and perceived opportunities of their territory in order to identify priorities for future strategic development.
This paper begins by focusing on the use of MSDA in the context of SEA, more specifically describing the role of MSDA as a decision support system during the SEA process, paying specific attention to the Environmental Report (ER). An Integrated Multi-criteria Spatial Decision Support System (ISMDSS) is then proposed, based on the integration of the multi-criteria method (regime analysis), a consultative tool used to direct structured interviews with a local population, with the Geographic Information System (GIS), designed in the ArcGIS environment. The model is developed in accordance with the following stages [17,18]:
- -
- The identification of the decision problem.
- -
- The definition of alternative predictive scenarios.
- -
- The evaluation of the alternative scenario through the regime analysis [19] and the definition of a rank order of the alternative actions plan.
- -
- The definition of a GIS database and a sensitivity analysis.
This ISMDSS is then applied to a case study in the Campania Region, and more specifically to the SEA of the Municipal Urban Plan (MUP) of Marzano di Nola, in the province of Naples. The paper concludes by reporting the main results achieved in the case of the SEA of Marzano di Nola and discussing future research perspectives.
2. Spatial Multi-Criteria Decision Support System
The Spatial Multi-criteria Decision Support System (SMDSS) was introduced in the literature in the late 1980s [14,15,20,21,22,23]. In recent years, there have many examples of the use of the Spatial Decision Support System in combination with multi-criteria analysis, especially in the field of land-use planning, sustainability assessment, and environmental decision-making [16,24,25,26,27,28]. The SMDSS refers to the application of multi-criteria analysis in a spatial context where alternatives, criteria, and other elements of the decision problem have a spatial dimension. The SMDSS is thus a procedure for identifying and comparing solutions to a spatial decision problem, based on the combination of multiple factors that can be at least partially represented by maps [27]. A spatial decision alternative consists of at least two elements that include an “action”, indicating what to do, and a “location”, representing the spatial context and where to implement the action. Evaluation criteria, in a spatial context, are associated with geographical entities and reflect the preference of decision-makers concerning different complex aspects of reality and can be represented by a “criterion map” that represents subjective preferential information. In fact, in all multi-criteria problems, the criteria are associated with a set of weights that reflect the scale of preferences of different groups of stakeholders involved. The output of an SMDSS model consists of one or more maps of the same area, which indicates the extent to which criteria are met or not in different contexts, and thereby supports planning or decision-making [28].
In the case study under analysis, the integration of a multi-criteria method—named regime analysis—with the GIS system was proposed with the aim of developing alternative strategic scenarios for urban planning transformation and evaluating its environmental and socioeconomic impact.
The fundamental framework of this multi-criteria method is based upon two standard kinds of input data: an evaluation matrix and a set of political weights. The evaluation matrix is composed of elements that measure the effect of each alternative, considered in relation to each relevant criterion. The set of weights provides information about the relative importance of the criteria to be considered. Regime analysis in its qualitative version is an ordinal generalization of pair-wise comparison methods that can examine quantitative as well as qualitative data.
In regime analysis, like in concordance analysis, we compare all alternatives in a pairwise way for all criteria in order to define and calculate the concordance index.
Let us consider, for example, the comparison between alternatives i and j for all criteria. The concordance index will be the sum of the weights related to the criteria for which alternative i is better than j. We will call this sum cij. Then we may calculate the concordance index for the same two alternatives by considering the criteria for which j is better than i, i.e., cji. After having calculated this sum, we subtract the two values to obtain the index wij = cij − cji. When we have only ordinal information about the weights, our interest is in the sign of the index wij.
If the sign is positive, this will indicate that alternative i is more attractive than alternative j; if negative, it will imply the reverse. We will thus be able to make a ranking of our alternatives. This ranking is possible due to the ordinal nature of the information. In the indicator wij, no attention is given to the numerical size of the difference between the alternatives.
We may encounter another complication in this framework, in that we may not manage to determine an unambiguous result, i.e., a unique rank order of alternatives. This is because we may face the problem of ambiguity in the sign of the index wij. In order to solve such a problem, we introduce a certain probability pij for the dominance of criterion i with respect to criterion j.
Here, we assume a specific probability distribution for the set of feasible weights. This assumption is based on the criterion of Laplace in the case of decision-making under uncertainty. In the case of a probability distribution of qualitative information, it is sufficient to mention that—in principle—the use of stochastic analysis, which is consistent with an originally ordinal data set, may help to overcome the methodological problem we encounter by conducting a numerical operation on qualitative data.
The regime method can identify the feasible area into which values of feasible weights must fall in order to be compatible with the condition implied by the probability value. By means of a random generator, numerous values of weights can be calculated. In the end, this allows us to calculate the performance score (or success score) p for each alternative i. We can then determine an unambiguous solution and rank order of alternatives.
In the next Section 3, the case study will be discussed and the main results reported.
3. Material and Methods
3.1. Introduction to the Case Study
The municipality of Marzano di Nola is a city of Etruscan origin. Located in the province of Avellino in the eastern part of the Campania region—in the “area nolana” plains area, crossed by the Regi Lagni network of artificial canals—the municipality, with a population of 1734 inhabitants [29] and covering an area of 4.62 km2, has a population density of 377 inhabitants per square kilometer. The Regi Lagni divides the territory into two main areas—a hilly area to the north and a flat part to the south. In the hilly area, wild boars, foxes, and hawks can be found, among other refuge-endangered wildlife. Agricultural areas account for 42% of this region and the majority of local economic activity is concentrated in the agricultural sector, especially very small family farms. The main crops in the area are hazelnuts, chestnuts, walnuts, and olives. The Partenio Regional Park in the north, the Monti Picentini mountain range to the south, and Vesuvius National Park to the southwest border Marzano di Nola. The “Pietra Maula”—a site of community importance (SIC)—is located in the northern part of the urban area, whereas the focal point of the southeast is the Lauro Mountain. Because of their high natural value, these areas are key elements in conserving the scenic natural heritage of the area. Starting from the strategic preliminary document of urban planning, the SEA process in the preliminary analysis has highlighted the territory’s potentiality and critical issues in order to build a framework upon which to construct possible future actions. The following section discusses some of the main results obtained.
3.2. Framework for Model Development
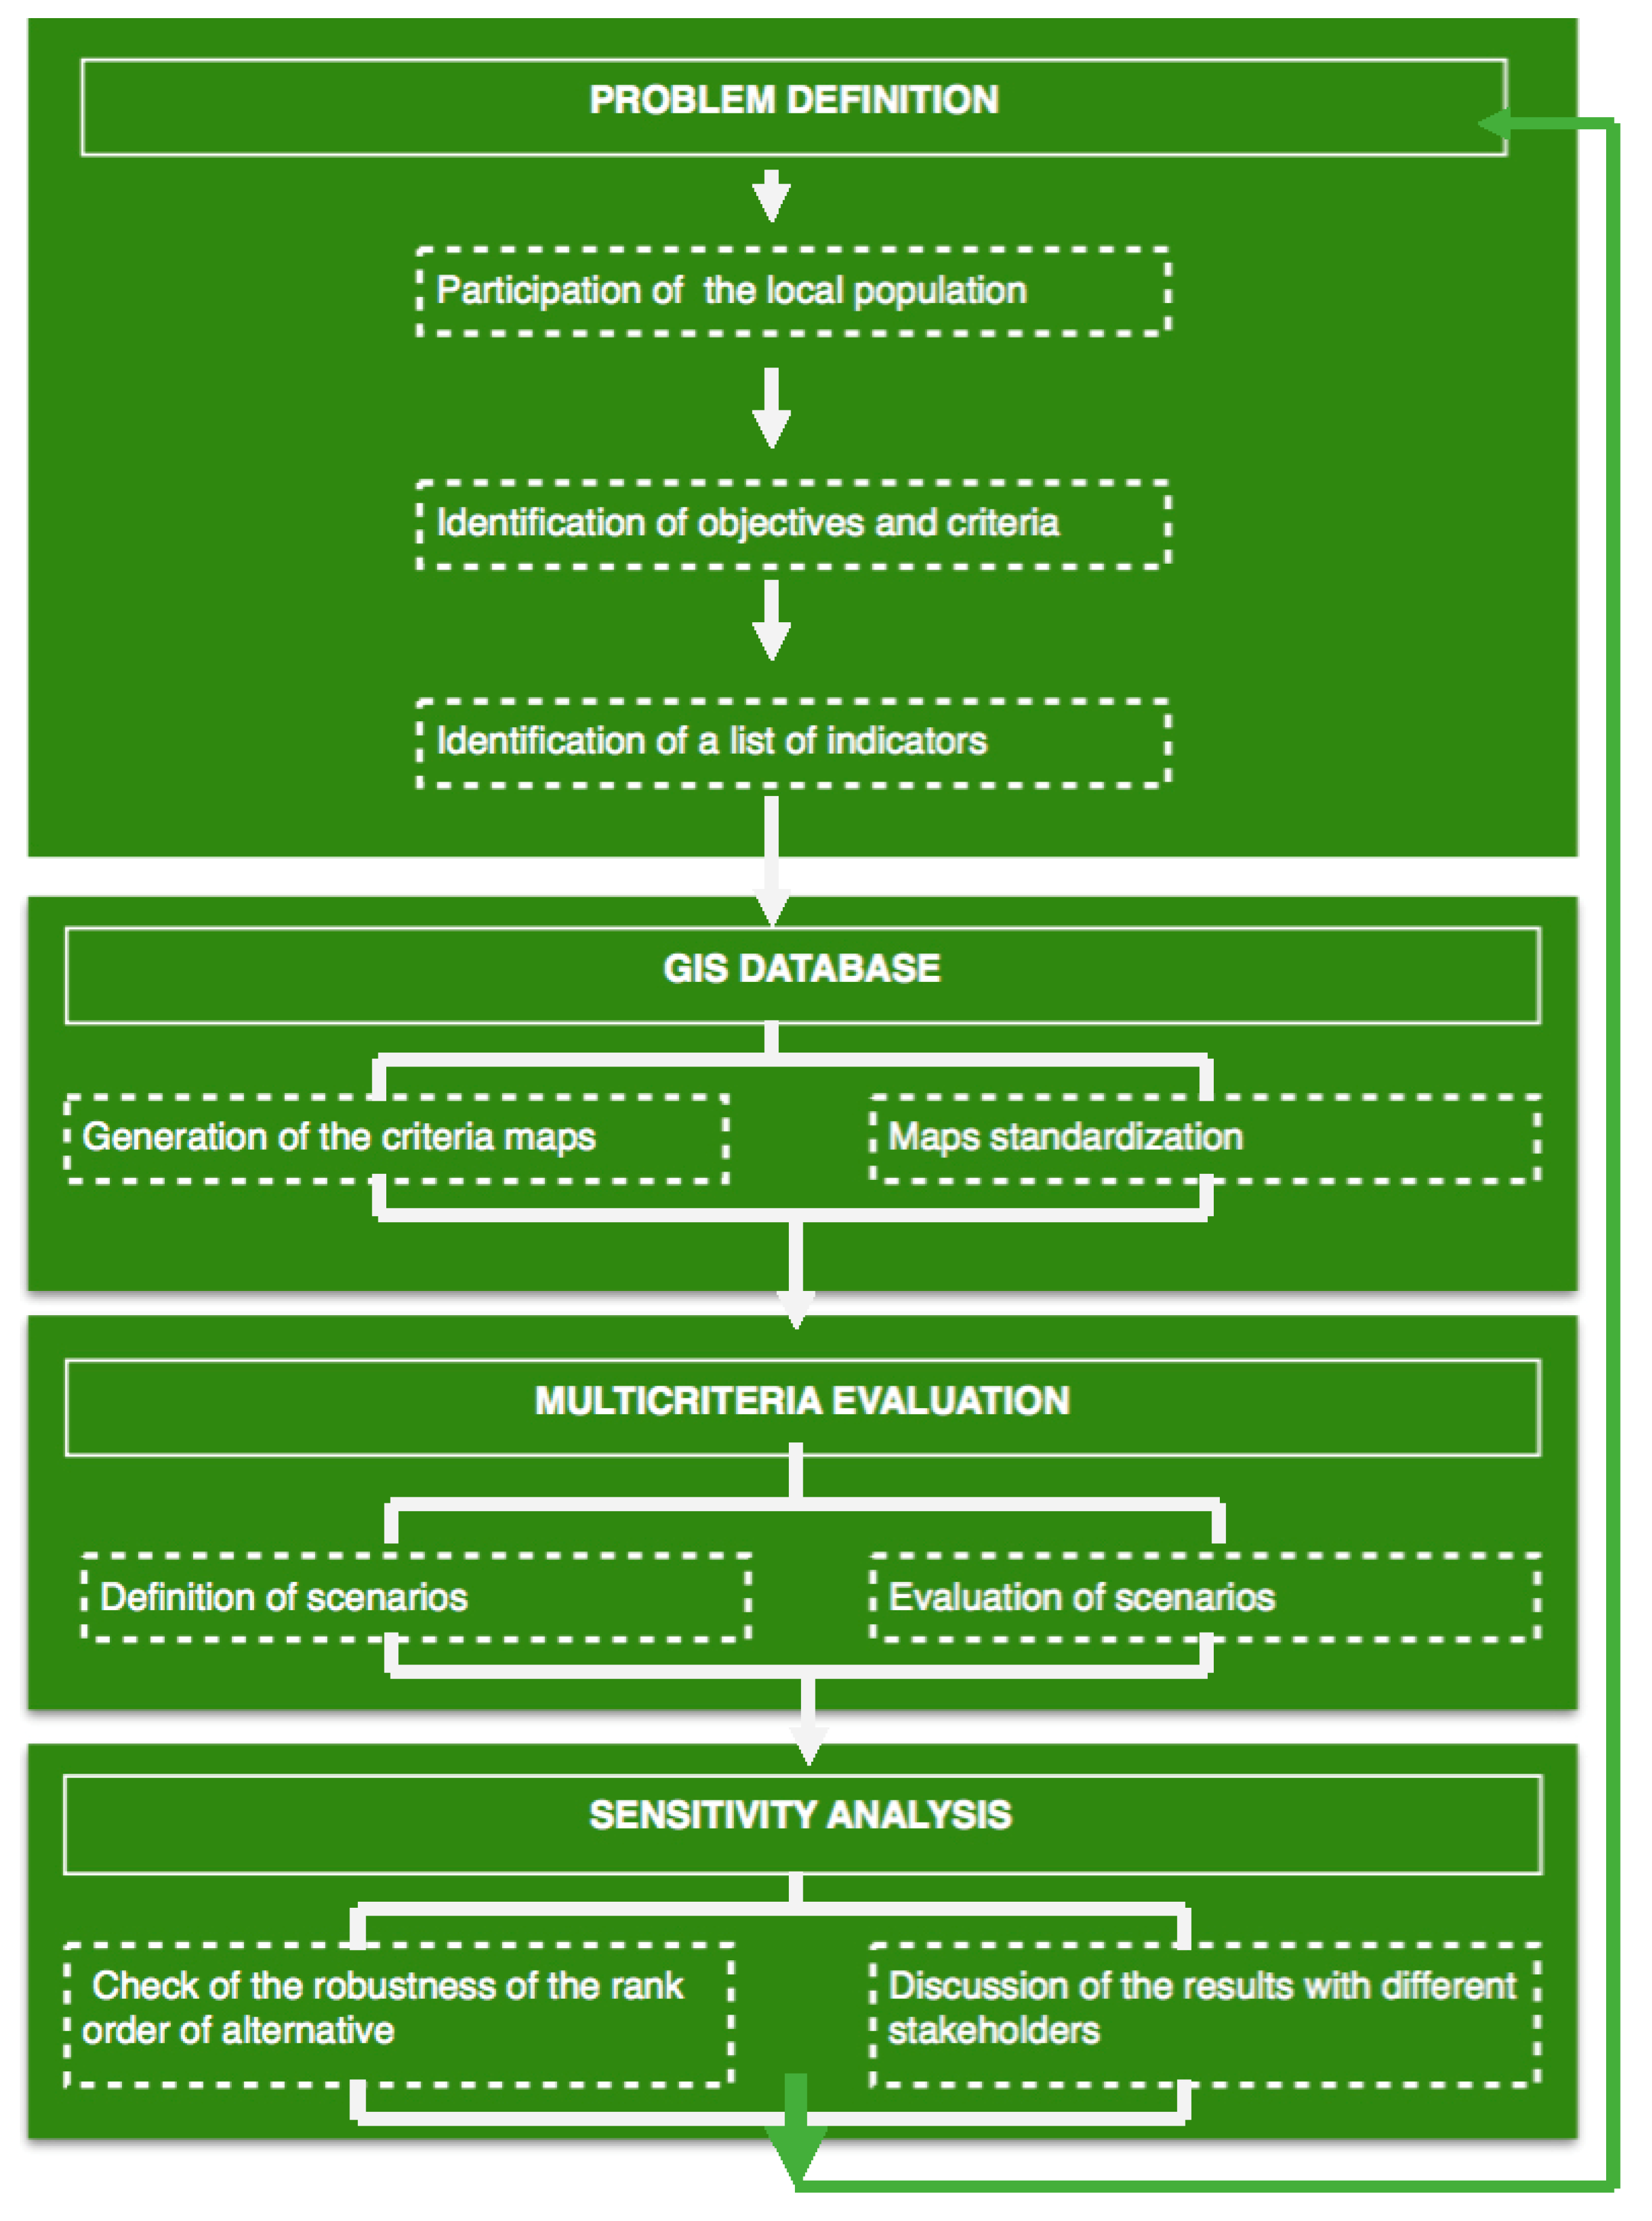
The framework for the model development is reported in Figure 1. As the figure shows, the model is structured following the general approach to decision problems [17] and in accordance with Steinitz’s geodesign approach [18]. Geodesign is an iterative design method that uses stakeholder input, geospatial modeling, impact simulation, and real-time impacts to facilitate holistic design and smart decision-making [30].
The first step of the model involves the phase of decision problem structuring. In this phase, the main critical issues and potentiality of the territory under analysis are underlined by the involvement of the local population and the experts. This phase allows the development of strategic alternative scenarios, the collection of all the information on the state of the environment, and the structuring of a list of criteria and indicators to evaluate the impacts of future development scenarios for the municipal urban plan.
In the second phase of the model, a GIS database is set using the ArcGIS software. The database contains all the information collected in the first phase related to each criterion. All the criteria selected along with the related information are then represented in different “criterion maps” and organized in a standardized impact matrix.
In the third phase, different scenarios of future development of the municipal area are selected on the basis of the previous analysis, and the impacts are evaluated using the regime analysis. In the last phase, a sensitivity analysis of the results is reported and discussed with the main stakeholders involved [31].
In the next paragraph, each phase of the model will be discussed in detail.
3.2.1. Problem Definition
The analysis of the SEA process was structured in two parallel moments, the results of which have allowed for the construction of the framework of “expert knowledge” (Annex VI letter (f) of Legislative Decree No. 152/06, as subsequently amended) and “common knowledge” from which the territory’s potentiality and critical issues were derived. The “expert knowledge” framework was defined on the basis of the environmental technical analysis with the aim of defining a list of indicators, objectives, and criteria. The environmental and spatial data considered in the environmental report took into consideration the following macro themes: agriculture, industry, forestry, tourism, atmosphere, hydrosphere, landscape, waste, noise, and natural and anthropogenic risks.
Each thematic area was divided into environmental “issues” to which some specific indicators have been associated, grouped into “classes”. The classes of indicators were organized based on the Driving Forces, Pressures, States, Impacts, and Responses (DPSIR) framework. The DPSIR framework is a causal framework to describe the interactions between society and the environment developed by the European Environment Agency as an extension of the pressure-state-response model developed by the Organization for Economic Cooperation and Development (OECD) in 1999. This framework includes only those indicators relevant to the province and to the environmental report. The indicators were supplemented with performance indicators identified by the Regional Council of Campania Resolution No. 834, 11 May 2007.
Table 1 lists the indicators numbered by the Italian National Institute for Environmental Protection and Research (ISPRA) Environmental Data Yearbook 2014–2015 and those used in the case study to describe the current status and to predict future developments.
The environmental analysis was then combined with a social analysis [32,33] aimed at investigating the territory’s potentiality and criticisms [34,35]. In this phase, citizen participation took a leading role, allowing for the analysis of local perception of the area’s potentiality and critical issues.
The spatial dimension is useful for understanding the dynamics that characterize each environmental topic in a specific area, by considering not only the components of the natural and developed environment, but also the interactions with social and economic components.
A survey was distributed to 10% of the population—145 residents. The survey sample was random and the survey was submitted by mail. Of these residents, 28 were students, 31 were unemployed, 23 were businessmen/professionals, 34 were office workers, 14 worked in the public administration, and 15 were retirees. Table 2 presents the survey results.
Based on the survey, a map was defined based on the critical issues and potentiality of the area. Subsequently, strategies, objectives, and actions for the Municipal Urban Plan (PUC) for Marzano di Nola were defined, with a focus on strengthening and enhancing local production, social structure, and the protection of the landscape and environment (Figure 2 and Figure 3).
Four objectives, 12 strategies, and 21 actions were identified and organized according to the hierarchical structure shown in Table 3.
The result of this analysis is the knowledge base of the environmental status of the territory covered by the PUC.
3.2.2. GIS Database
Through the use of GIS, it was possible to spatialize and measure the indicators in order to assess the impacts of the identified actions.
The criterion maps were generated using the collected data and basic raster GIS operations (maps overlay, buffering, distance mapping, etc.). The Municipality and the Regional Administrations’ environmental database supplied the data. The list of maps defined is reported in Table 4.
For the agriculture in particular, we refer to the percentage of territory measured in hectares from the 3D cartography of the municipality of Marzano di Nola. Then, we analyzed the use of fertilizer and planned protection used for the cultivation of the main crops in the area—such as hazelnuts, chestnuts, and walnuts—in order to make recommendations in the preliminary environmental report on the use of specific sustainable products as indicated by Directive 91/676/CEE and the EU COM (2006) 372.
For forestry, we considered wood production as it represents one of the main economic activities of the territory to be safeguarded.
The criterion related to tourism infrastructures considered the surface measured in square meters of tourist infrastructures localized in the territory at the status quo and the variation in each alternative scenario proposed.
For industry, we measured the distance in the status quo from sensible activities (school, hospital, etc.) to the different factories located in the territory, as one of the main problems of the municipality is the environmental and acoustic pollution produced by the industry located near to residential areas.
All other themes are related to the problem of hydrogeological risk, with some areas classified as high risk. Nowadays, many activities and residential buildings are located in this risk area near the river. Therefore, one of the main objectives of the urban plan was to delocalize these activities to a safer site.
The spatial dimensions of the criterion can be 0, 1, 2. In the case of a dimension 0, a criterion is measured without any spatial indication, for example the amount of fertilizer and plan protection product, while in a spatial dimension 1, the criteria are measured along a line, such as distances along a road. Lastly, spatial dimension 2 implies that the criteria are measured at the level of individual cells. In our case, a grid cell size of 25 m × 25 m was adopted for the analysis.
Given the different nature and measurement units of the criteria, a normalization rule was introduced with the aim of converting all the values into a 0–1 range.
It is suggested that the analysis of the probability density functions for each of the criteria with a value of 1 use a min-max normalization rule. Two versions of the same formula have been used according to the criteria effects on territorial vulnerability. More specifically, for those criteria following the logic of ‘the highest the value, the highest territorial impact’, Equation (1) was used:
Instead, for those criteria following the logic of ‘the highest the value, the lowest territorial impact’, Equation (2) was introduced:
The results are reported in Table 5.
3.2.3. Multi-Criteria Evaluation
Starting from the hierarchical structure shown in Table 3, three scenarios of the plan were identified and are reported in Table 6. The scenarios are then evaluated compared to the system of indicators identified and reported, by way of example, in Table 1, in order to assess the impacts of various actions of the plan. The spatial table of effects is reported in Table 7.
The first scenario provides a series of interventions aimed at stimulating the economy by favoring local products (e.g., hazelnuts and walnuts) and through the use of incentives for, and promotion of, alternative forms of agriculture (such as organic farming). An important role is played by the sustainable management of urban areas, so that a series of potential actions are provided:
- The relocation of activities of processing typical agricultural products to a special area is defined as an “industrial area Productive Plan (PIP)”. This action—by removing the storage, processing, and passing loads of hazelnuts and walnuts from the city center—would continue to promote the economic development of the territory while aiming to reduce the current levels of urban acoustic and air pollution. This intervention would also reduce heavy vehicle traffic near the urban center.
- Restriction of construction in risk areas to avoid illegal building.
- Rezoning of green areas for alternative use to support economic growth, and development of social housing areas and local infrastructure.
- Redevelopment of part of the urban areas and expansion of the existing road network.
The second scenario includes a series of interventions aimed at the residential development of the town to meet growing demand in light of the positive demographic trend observed over recent years. The building expansion foreseen in this alternative plan is also the answer to the expectation of further population growth. The redevelopment of urban and suburban street systems is also included in the plan, as well as the renovation of existing architecture and the creation of recreational green areas and facilities.
The third scenario is of a predominantly naturalistic-tourist nature, seeking above all the conservation of the natural qualities of the landscape through the protection of natural resources.
Actions in this case are provided with a view to the conservation of the SICs identified in the hilly part of the area while simultaneously observing the restriction in green areas located in the vicinity of the urban center.
Actions aimed at increasing tourism as well as facilitating tourists’ stays are defined as:
- Encouragement of agro tourism accommodations.
- Redevelopment of the city center and the outskirts, fostering links between the urban and suburban area to foster internal and external links.
The spatial table of effects (Table 7) was assessed using the GIS database and analyzed by way of a multi-criteria decision support system, using DEFINITE software [36], which contains a set of multi-criteria methods to transform the effect table—in combination with policy weights—into a ranking of alternatives. The system is able to support all decision processes from problem definition to report generation. The hierarchical regime method [19], designed to handle both quantitative and qualitative effects, was used to evaluate the three scenarios.
The hierarchical regime method considers the performance of each scenario with respect to each criterion reported in Table 7, corresponding to the standardization function reported in Table 5. In accordance with the methodology described in Section 2, we also defined an ordinal weight vector that reflects the priority associated with the criterion. The weight vector was defined by interviewing the technicians working in the municipality urban sectors.
The regime method is based on the pairwise comparison of the alternatives, and the analysis is centered on the sign eij –ei’j, where eij and ei’j represent the performance of each alternative (i) in respect to each criterion (j). For each alternative and for each criterion, a sii’j element is calculated in order to assess a regime vector as the sum to j of all sij elements. The siij is positive (+1) if eij > ei’j; it is negative (–1) if eij < ei’j; and it is equal to 0 if eij = ei’j. The DEFINITE program generates a random number of cardinal weights consistent with the ordinal weights defined a priori to assess the ranking of the alternative. In some cases, a unique solution does not exist, as different cardinal weight vectors—all consistent with the ordinal weight vector—can lead to different rank orders. In this case, a probabilistic analysis was performed in order to assess a Pi index of the success of each alternative [34].
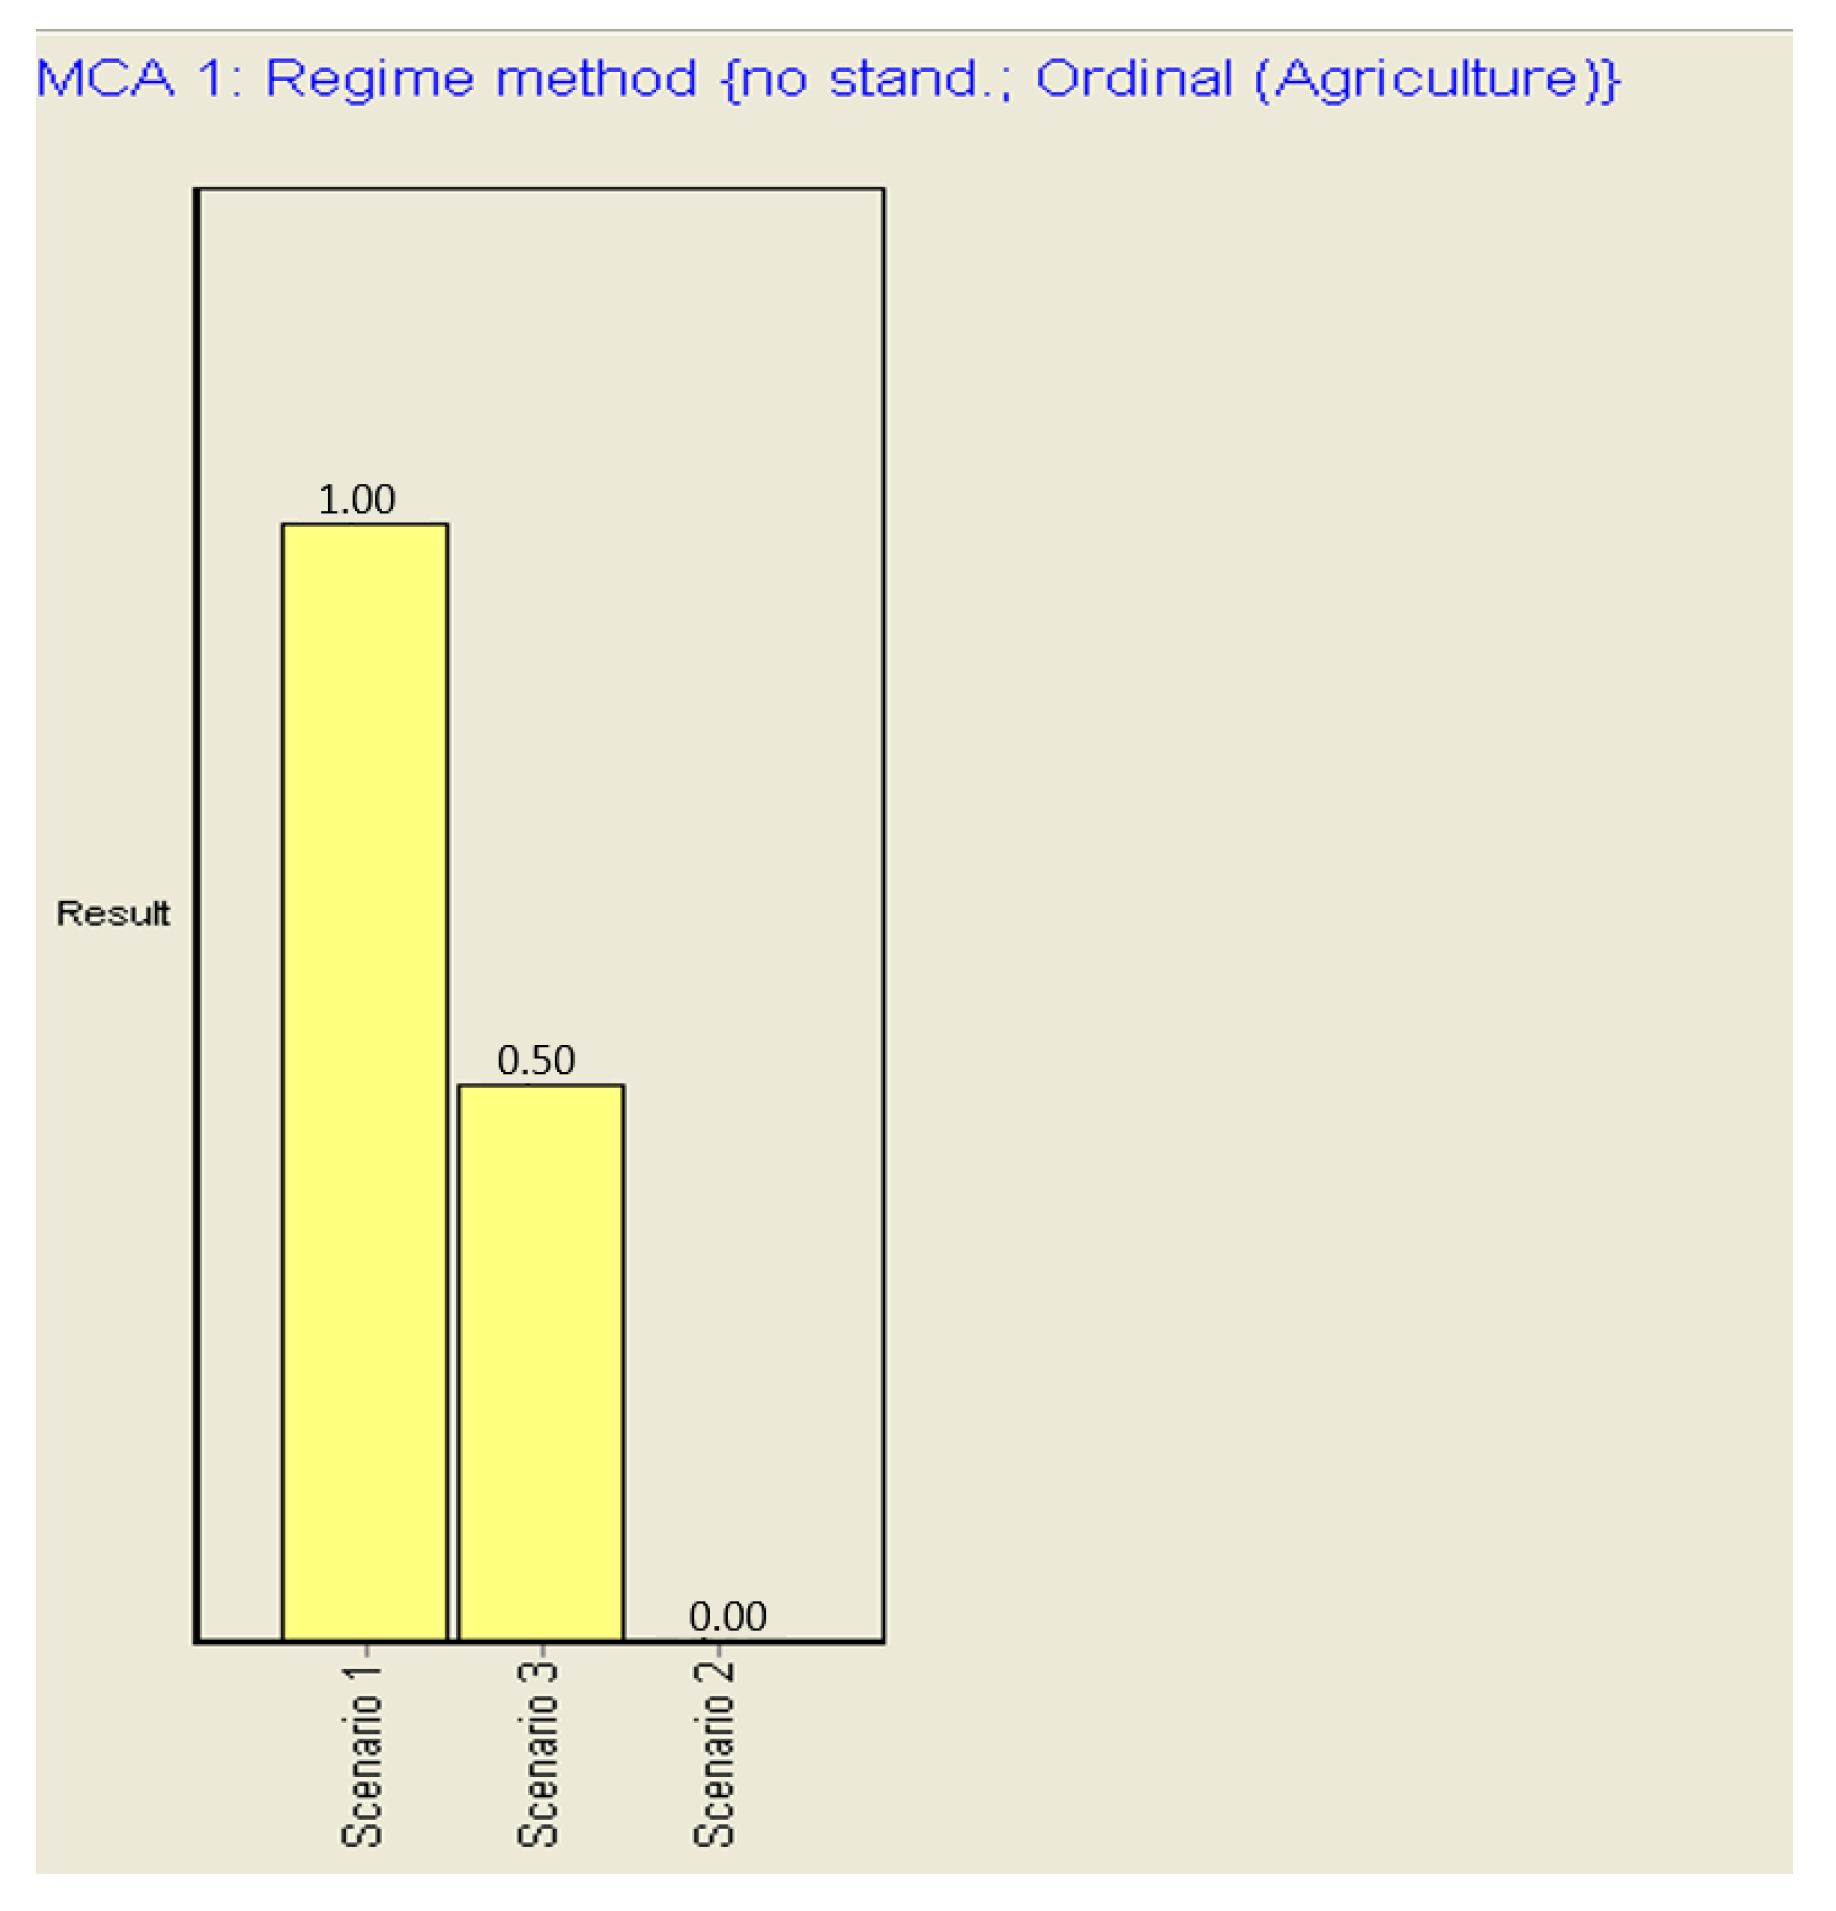
In Figure 4, the results of the hierarchical regime analysis are shown.
As Figure 4 demonstrates, the first scenario—the one that provides a series of interventions aimed at stimulating the economy by favoring local products—is the most preferred, followed by the third scenario—the one of a predominantly naturalistic-tourist nature that seeks above all the conservation of the natural qualities of the landscape through the protection of natural resources. The results obtained were in line with the expectations of the local population and the urban planners that were working on the municipal urban plan.
3.2.4. Sensitivity Analysis
Once the most plausible scenario is identified, we need to test the design and the evaluation of the various scenarios through a series of sensitivity analyses. In general, sensitivity analysis can be conducted at two levels:
- Varying the critical factors of the problem (e.g., policy weights, criterion score).
- Verifying whether using different assessments and evaluation methods leads to different results.
This allows the pinpointing of the critical elements that characterize the alternative policy scenarios selected. It may also be possible to develop new scenarios that are able to reduce conflicts according to the cyclical logic approach proposed here.
In this paper, we use the DEFINITE program to test the sensitivity of the ranking by considering the influence of uncertainty in scores on the ranking of the alternative scenarios (criterion score uncertainty) and by comparing the solution found with the regime method as well as by applying the well-known weighted summation method (also included in the DEFINITE program).
In fact, the DEFINITE program contains a specific module for sensitivity analysis. The sensitivity of solutions to overall uncertainty in scores is analyzed here by using a Monte Carlo approach. The decision-maker is asked to estimate the maximum percentage of the actual values, which may differ from the values included in the elements of the effect table or the set of weights. This contributes to the participation of the decision-maker in the decision process and to a reduction of conflicts generated by different views on certain scores or priorities. A random generator is used to translate this information into a large number of effect tables set around the original effect table.
To analyze the sensitivity of the ranking to uncertainty in criterion scores, the decision-maker specifies that the score for a criterion may be 20% higher or lower than the score included in the effect table—it is also possible to specify a different percentage for each criterion. Then, a random generator is used to produce random values from a normal distribution. For each set of values, a ranking is calculated. In our case study, the number of drawings considered for the Monte Carlo analysis was 1000.
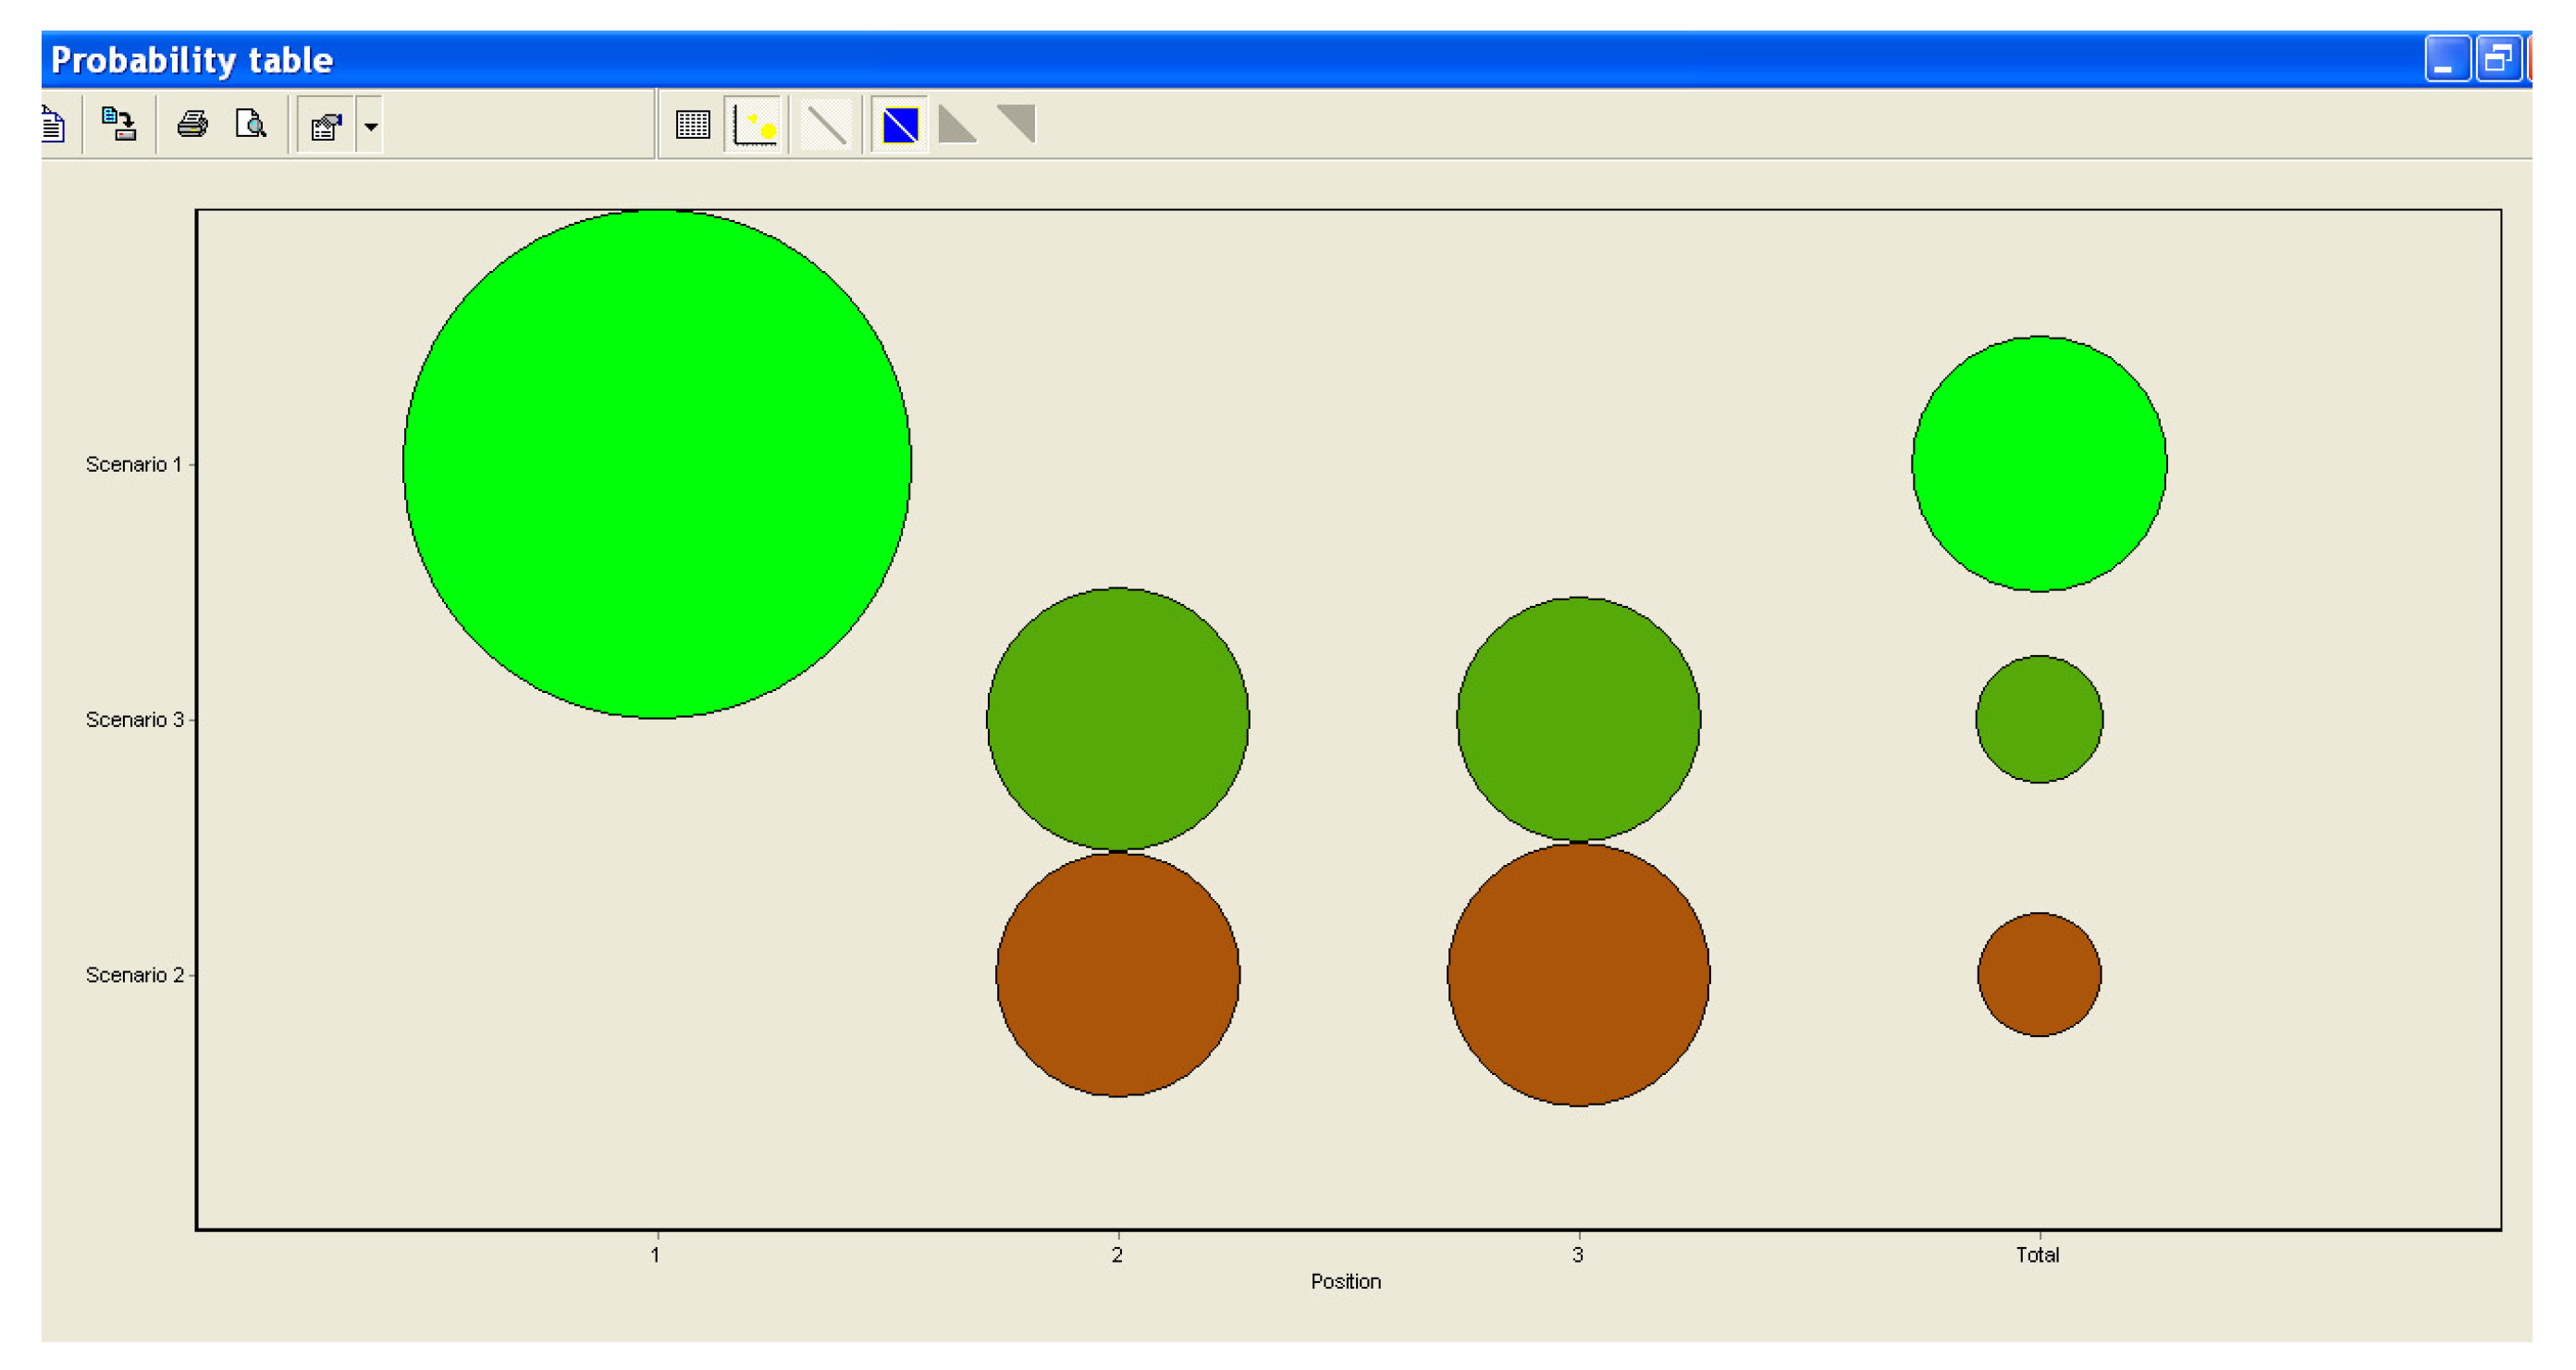
Figure 5 presents the results based on a Monte Carlo simulation, considering an ordinal distribution of the criterion score and a variation of the input score (–30% and +30%). Here, the probability that each alternative is in a certain position is illustrated. As shown in Figure 5, Scenario 1 (green circle) is always dominant in the ranking, and in the last column of the figure, the most probable ranking is reported. On the basis of this analysis, we can say that the ranking obtained is robust for the uncertainty associated with the criterion scores.
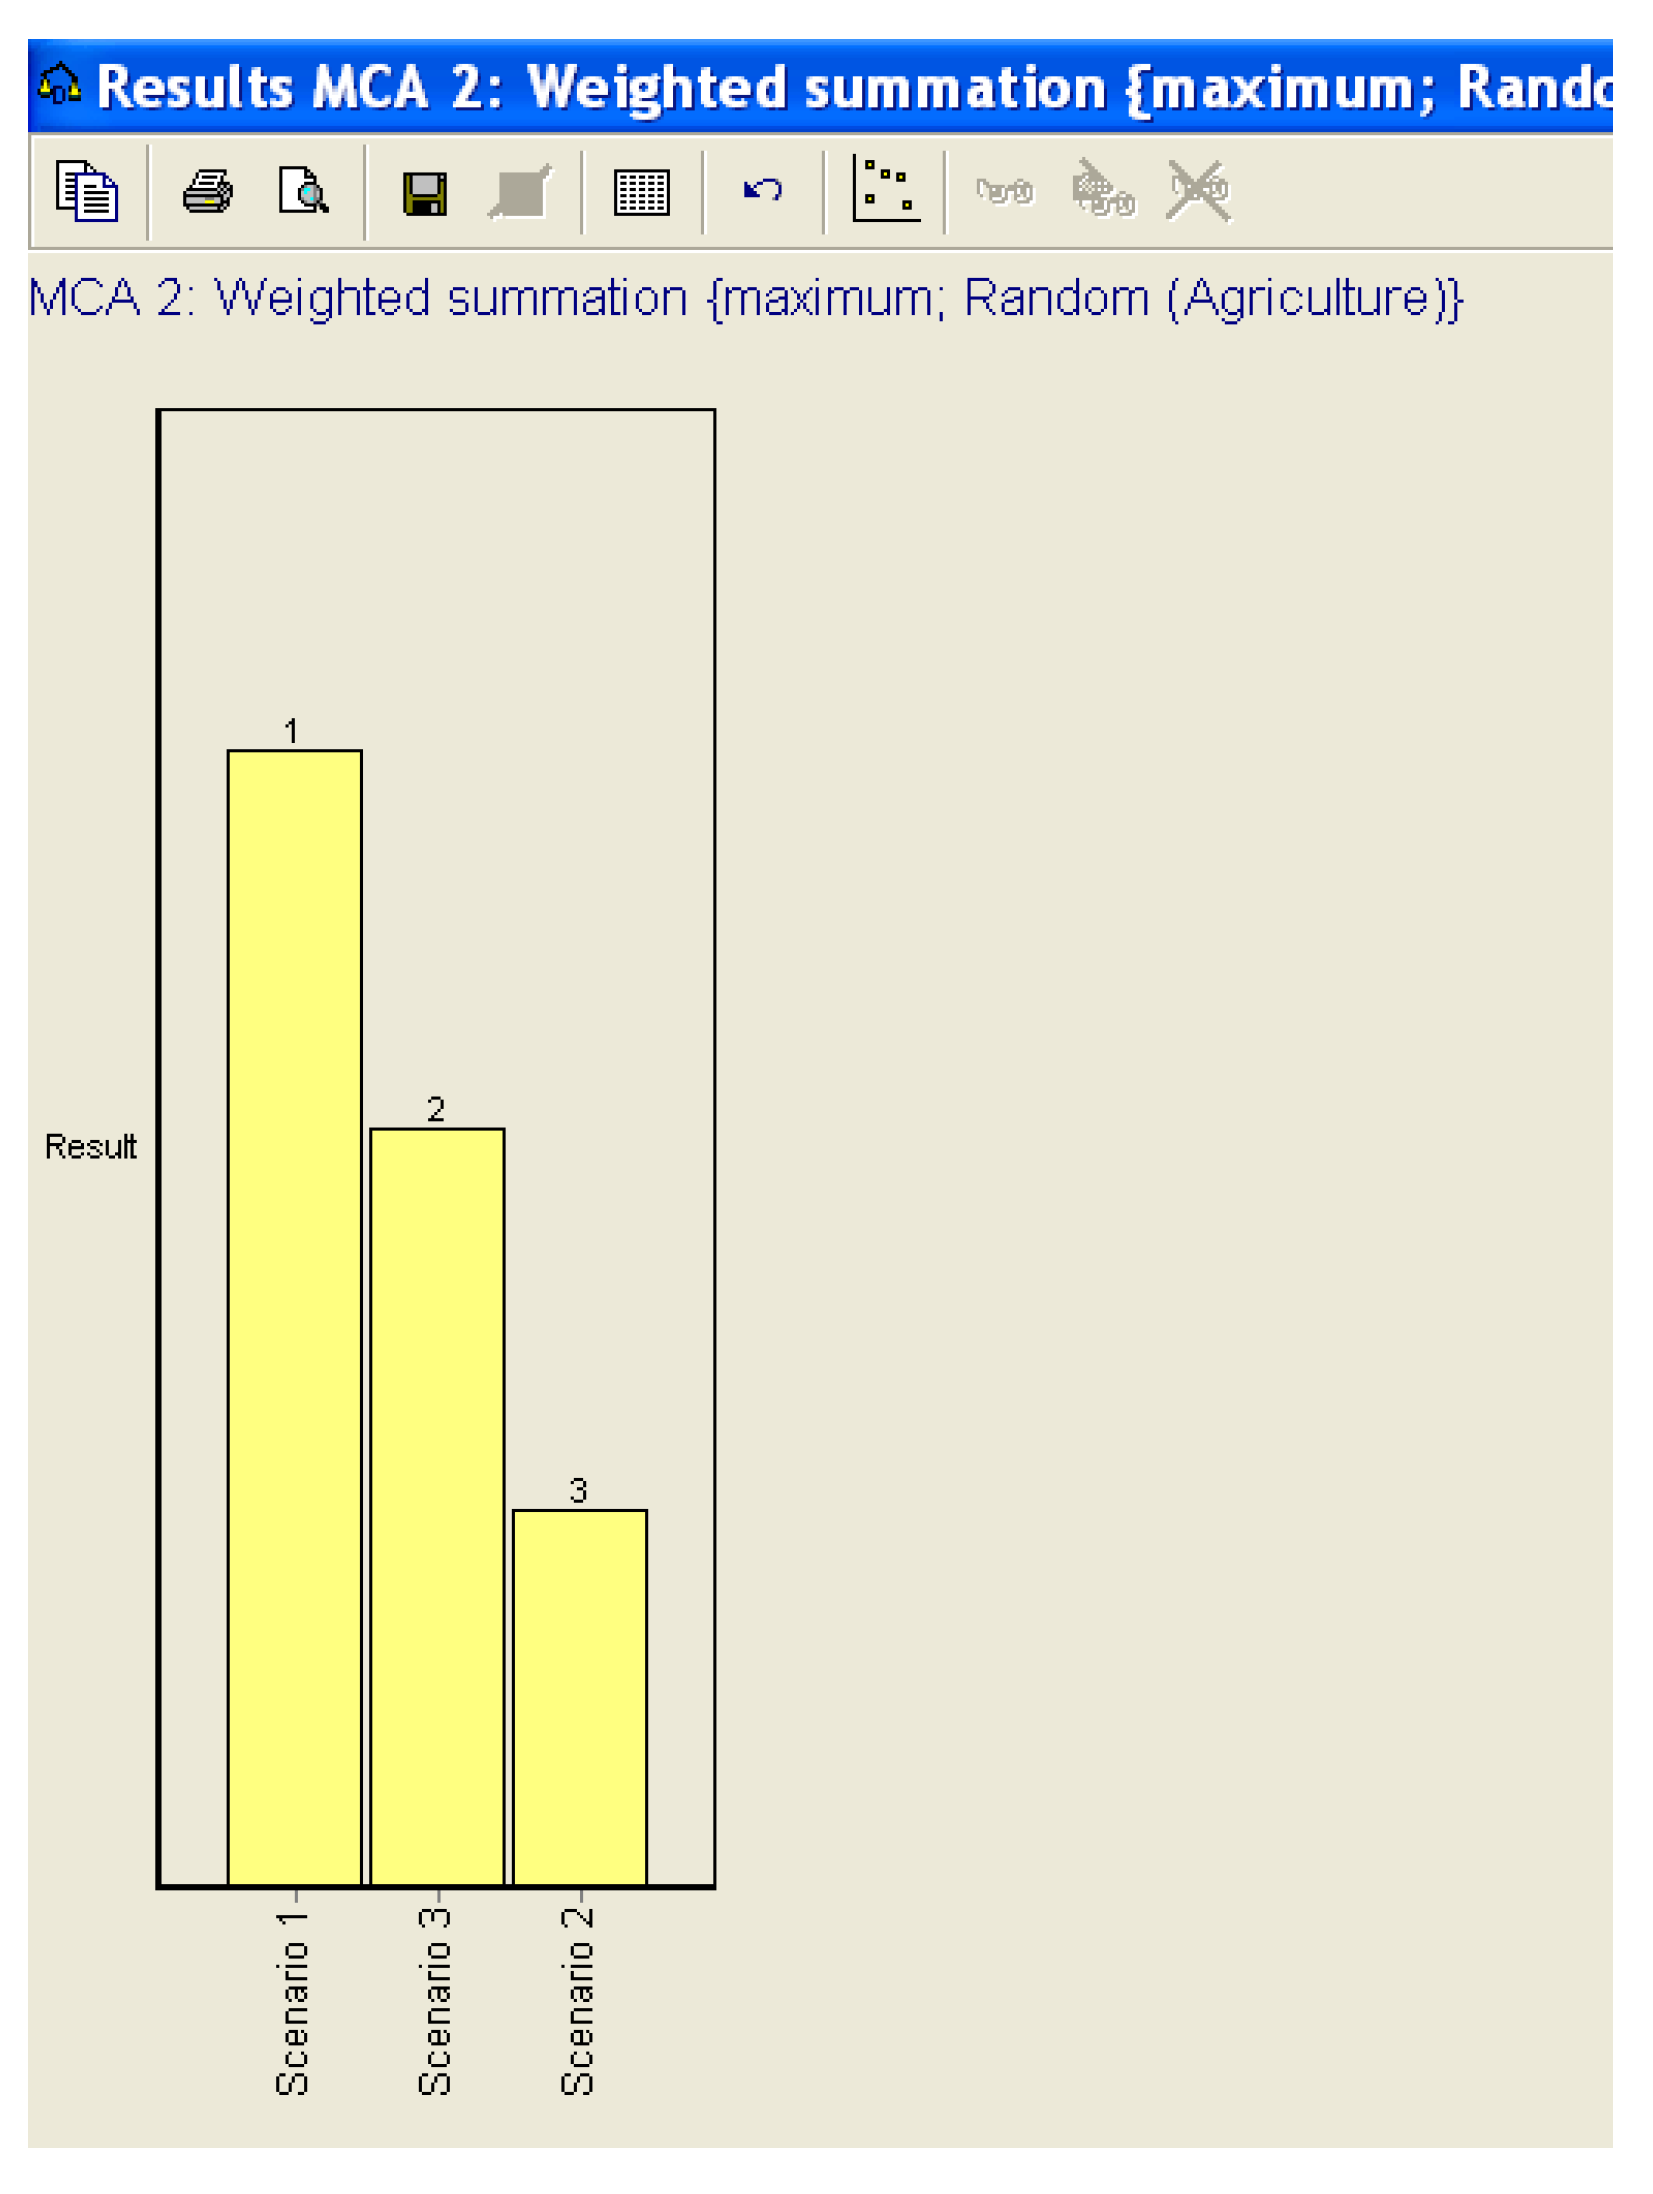
On the other hand, we tested the robustness of the ranking using another method—the Weighted Summation Method (WSM). In WSM, an appraisal score is calculated for each alternative by first multiplying each value by its appropriate weight followed by summing the weight score for all criteria. The best alternative is the one that maximizes the scores.
In Figure 6, the rank order was obtained, and also in this case the solution did not change.
These results are useful for the discussion implemented in the participation phase.
At this stage of the analysis, the aim is to select the preferable alternative actions, while in the next stage the most suitable location for each action will be analyzed.
4. Discussion and Future Research
The paper proposed and integrated Spatial Multi-criteria Decision Support Systems (ISMDSS) applicable to SEA.
The methodology proposed appears to be a useful decision support tool for a complex environment, that is able to control the decision process on different levels (political, social, technical etc.) and to contribute to the communicative process that involves experts, politicians, and the local community in a future scenario planning process, taking into account the spatial dimension. The model is able to provide a rank order of the alternative scenarios from a multidimensional perspective, taking into consideration and controlling the sustainability of the future scenarios proposed in a direct and quantitative way. Clearly, this study is a first exploration. More insight is needed, as follows:
- To identify policy impacts from a wide area perspective to ensure that local improvement does not lead to a regional decline in sustainability—in other words, to test the model sensitivity from other complementary aspects. Our first research results are encouraging in confirming the policy’s validity, even though perhaps large regional effects may affect the robustness of our scenario rankings.
- To experiment with greater participation of the different stakeholders to ensure that relevant political and social interests are included in the evaluation model and to check if the general notion of sustainability as proposed in the literature can be realized at the local level.
Author Contributions
The paper was written by the two authors. Francesca Torrieri conceived the experimental work and performed it.
Conflicts of Interest
The authors declare no conflict of interest.
References
- Funtowicz, S.O.; Ravetz, J.R. Science for post normal age. Futures 1993, 25, 739–755. [Google Scholar] [CrossRef]
- Fusco Girard, L.; Nijkamp, P. Le Valutazioni per lo Sviluppo Sostenibile Della Città e del Territorio; Franco Angeli Editore: Milano, Italy, 1997. [Google Scholar]
- Alexander, E.R. Evaluation in Planning. Evolution and Prospects; Ashgate: Aldershot, UK, 2006. [Google Scholar]
- Fisher, T.B. Theory and Practice of Strategic Environmental Assessment: Towards a More Systematic Approach; Earthscan: London, UK, 2007. [Google Scholar]
- Munda, G. Social Multi-Criteria Evaluation for a Sustainable Economy; Springer: New York, NY, USA, 2008. [Google Scholar]
- Partidario, M.R. Elements of a SEA framework. Improving the added value of SEA. Environ. Impact Assess. Rev. 1993, 20, 647–663. [Google Scholar] [CrossRef]
- EPA. Review of Effectiveness of SEA in Ireland. Key Findings & Recommendation. Available online: http://www.epa.ie/whatwedo/advise/sea (accessed on 1 July 2017).
- Therivel, R. Strategic Environmental Assessment in Action, 2nd ed.; Earthscan: London, UK, 2013. [Google Scholar]
- Cannavacciuolo, L.; Iandoli, L.; Ponsiglione, C.; Zollo, G. Knowledge elicitation and mapping in the design of a decision support system for the evaluation of supplier’s competencies. VINE 2015, 45, 530–550. [Google Scholar] [CrossRef]
- Zoppi, C.; Lai, S. Problematiche partecipative e conflitti nell’attuazione del Piano Paesaggistico della Sardegna. In Proceedings of the CD ROM 29th A.I.S.Re (Italian Association of Regional Science) Annual Scientific Conference, Bari, Italy, 24–26 September 2008. [Google Scholar]
- UNEP. Integrated Assessment for Mainstreaming Sustainability Into Policymaking: A Guidance Manual. Available online: http://www.unep.ch//etb (accessed on 1 August 2017).
- Cerreta, M.; De Toro, P. Integrated Spatial Assessment for Creative Decision-making process: A Combined Methodological Approach to Strategic Environmental Assessment. Int. J. Sustain. Dev. 2010, 13, 17–30. [Google Scholar] [CrossRef]
- Partidario, M. Strategic Environmental Assessment-Better Practice Guide—Methodological Guidance for Strategic Thinking in SEA; Portuguese Environment Agency: Lisbon, Portugal, 2012.
- Malcezewski, J. GIS and Multicriteria Decision Analysis; John Wiley: New York, NY, USA, 1999. [Google Scholar]
- Malcezewski, J. GIS based land-use suitability analysis: A critical overview. Progress Plan. 2004, 62, 3–65. [Google Scholar] [CrossRef]
- Chakhar, S.; Mousseau, V. Spatial Multi-criteria Decision-making. In Encyclopedia of GIS; Springer: Cham, Switzerland, 2008; pp. 747–753. [Google Scholar]
- Simon, H.A. The New Science of Management Decision, 3rd ed.; Prentice-Hall: Englewood Cliffs, NJ, USA, 1977. [Google Scholar]
- Steinitz, C. A Framework for Geodesign; Esri Press: Redlands, CA, USA, 2012. [Google Scholar]
- Nijkamp, P.; Rietveld, P.; Voogd, H. Multicriteria Evaluation for Physical Planning; Elsevier Science: Amsterdam, The Netherlands, 1990. [Google Scholar]
- Ravetz, J. Integrated assessment for sustainability appraisal in cities and regions. Environ. Impact Assess. Rev. 2000, 20, 31–34. [Google Scholar] [CrossRef]
- Jankowsky, P. Integrating geographical information system and multiple criteria decision-making methods. Int. J. Geogr. Inf. Syst. 1995, 9, 251–273. [Google Scholar] [CrossRef]
- Malcezewski, J. GIS based land-use suitability analysis: A survey of the literature. Int. J. Geogr. Inf. Sci. 2006, 20, 703–726. [Google Scholar] [CrossRef]
- Rahman, M.R.; Saha, S.K. Remote sensing, spatial multi criteria evaluation (SMCE) and analytical hierarchy process (AHP) in optimal cropping pattern planning for a flood prone area. J. Spat. Sci. 2008, 53, 161–177. [Google Scholar] [CrossRef]
- Gigović, L.; Pamučar, D.; Božanić, D.; Ljubojević, S. Application of the GIS-DANP-MABAC multi-criteria model for selecting the location of wind farms: A case study of Vojvodina, Serbia. Renew. Energy 2017, 103, 501–521. [Google Scholar] [CrossRef]
- Kazak, J.; van Hoof, J.; Szewranski, S. Challenges in the wind turbines location process in Central Europe—The use of spatial decision support systems. Renew. Sustain. Energy Rev. 2017, 76, 425–433. [Google Scholar] [CrossRef]
- Baležentis, T.; Streimikiene, D. Multi-criteria ranking of energy generation scenarios with Monte Carlo simulation. Appl. Energy 2017, 185, 862–871. [Google Scholar] [CrossRef]
- Bottero, M.; Comino, E.; Durivig, C.; Ferretti, V.; Pomarico, S. The application of Multi-criteria Spatial Decision Support System (MCSDSS) for the assessment of biodiversity conservation in the Province of Varese. Land Use Policy 2013, 30, 730–738. [Google Scholar] [CrossRef]
- Comino, E.; Bottero, M.; Pomarico, S.; Rosso, M. The combined use of Spatial Multi-criteria Evaluation and stakeholder analysis for supporting the ecological planning of river basin. Land Use Policy 2016, 58, 183–195. [Google Scholar] [CrossRef]
- The National Institute for Statistics (Istat). Available online: http://www.istat.it (accessed on 1 July 2017).
- Miller, R.W. Introducing Geodesign: The Concept; ESRI: Redlands, CA, USA, 2012. [Google Scholar]
- Del Giudice, V.D.; De Paola, P.; Torrieri, F. An Integrated choice model for the evaluation of urban sustainable renewal scenarios. Adv. Mater. Res. 2014, 1030, 2399–2406. [Google Scholar] [CrossRef]
- Dente, B. Understanding Policy Decisions; Springer: Berlin, Germany, 2014. [Google Scholar]
- The World Bank. Social Analysis in the Urban Sector: A Guidance Note; The Social Development Department, in Partnership with Finance, Economic and Urban Department, The World Bank: Washington DC, USA, 2008. [Google Scholar]
- Arciniegas, G.; Janssen, R. Spatial decision support for collaborative land use planning workshops. Landsc. Urban Plan. 2012, 117, 332–342. [Google Scholar] [CrossRef]
- Fusco Girard, L.; Cerreta, M.; De Toro, P. Integrated Assessment for sustainable choices. SR Sci. Reg. 2014, 13, 111–141. [Google Scholar]
- Janssen, R.; Van Herwijnen, M.; Beinat, E. DEFINITE 3.0 Case Studies and User Manual; Institute for Environmental Studies, Vrije Universiteit Amsterdam: Amsterdam, The Netherlands, 2003. [Google Scholar]
- EU Commission. EU Commission COM 433, GDP and beyond. In Proceedings of the Measuring Progress in a Changing World, Brussels, Belgium, 20 August 2009. [Google Scholar]
- Organization for Economic Cooperation and Development (OECD). Applying SEA: Good Practice Guidance for Development Co-Operation. Available online: http://www.seataskteam.net/guidance.php, (accessed on 1 July 2017).
Figure 1.
Framework for the model development.

Figure 2.
Potentiality.
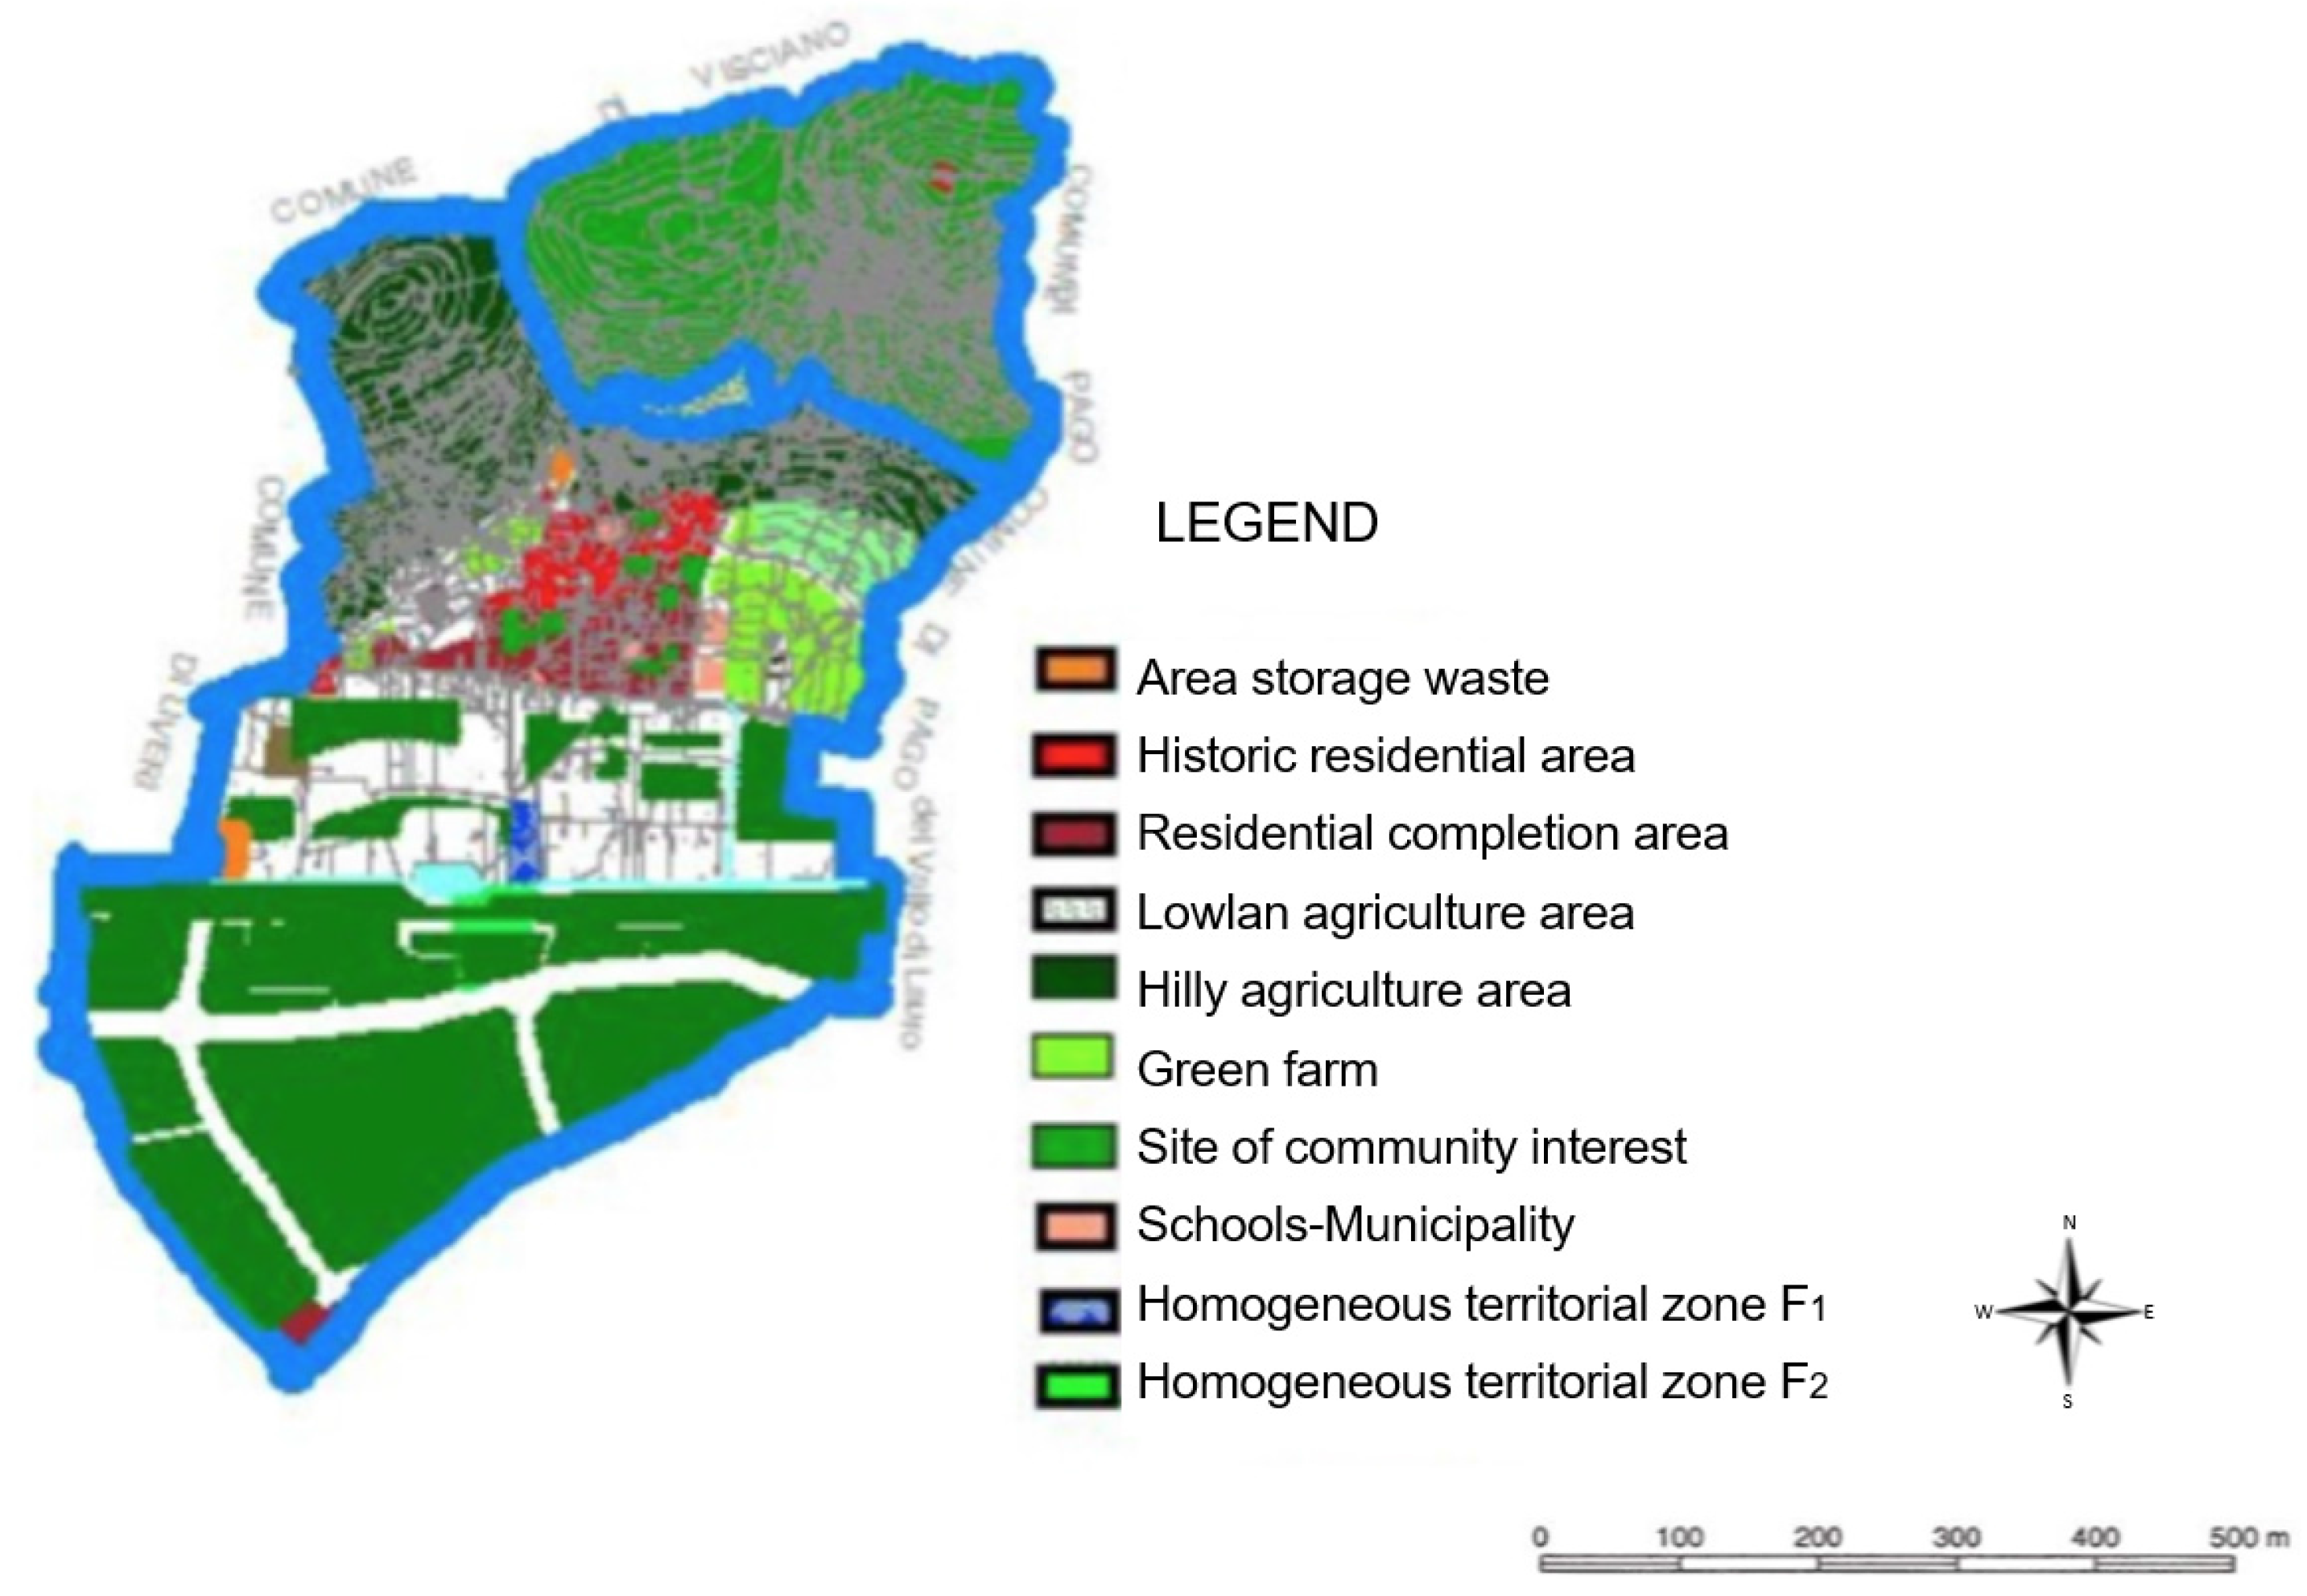
Figure 3.
Critical issues.
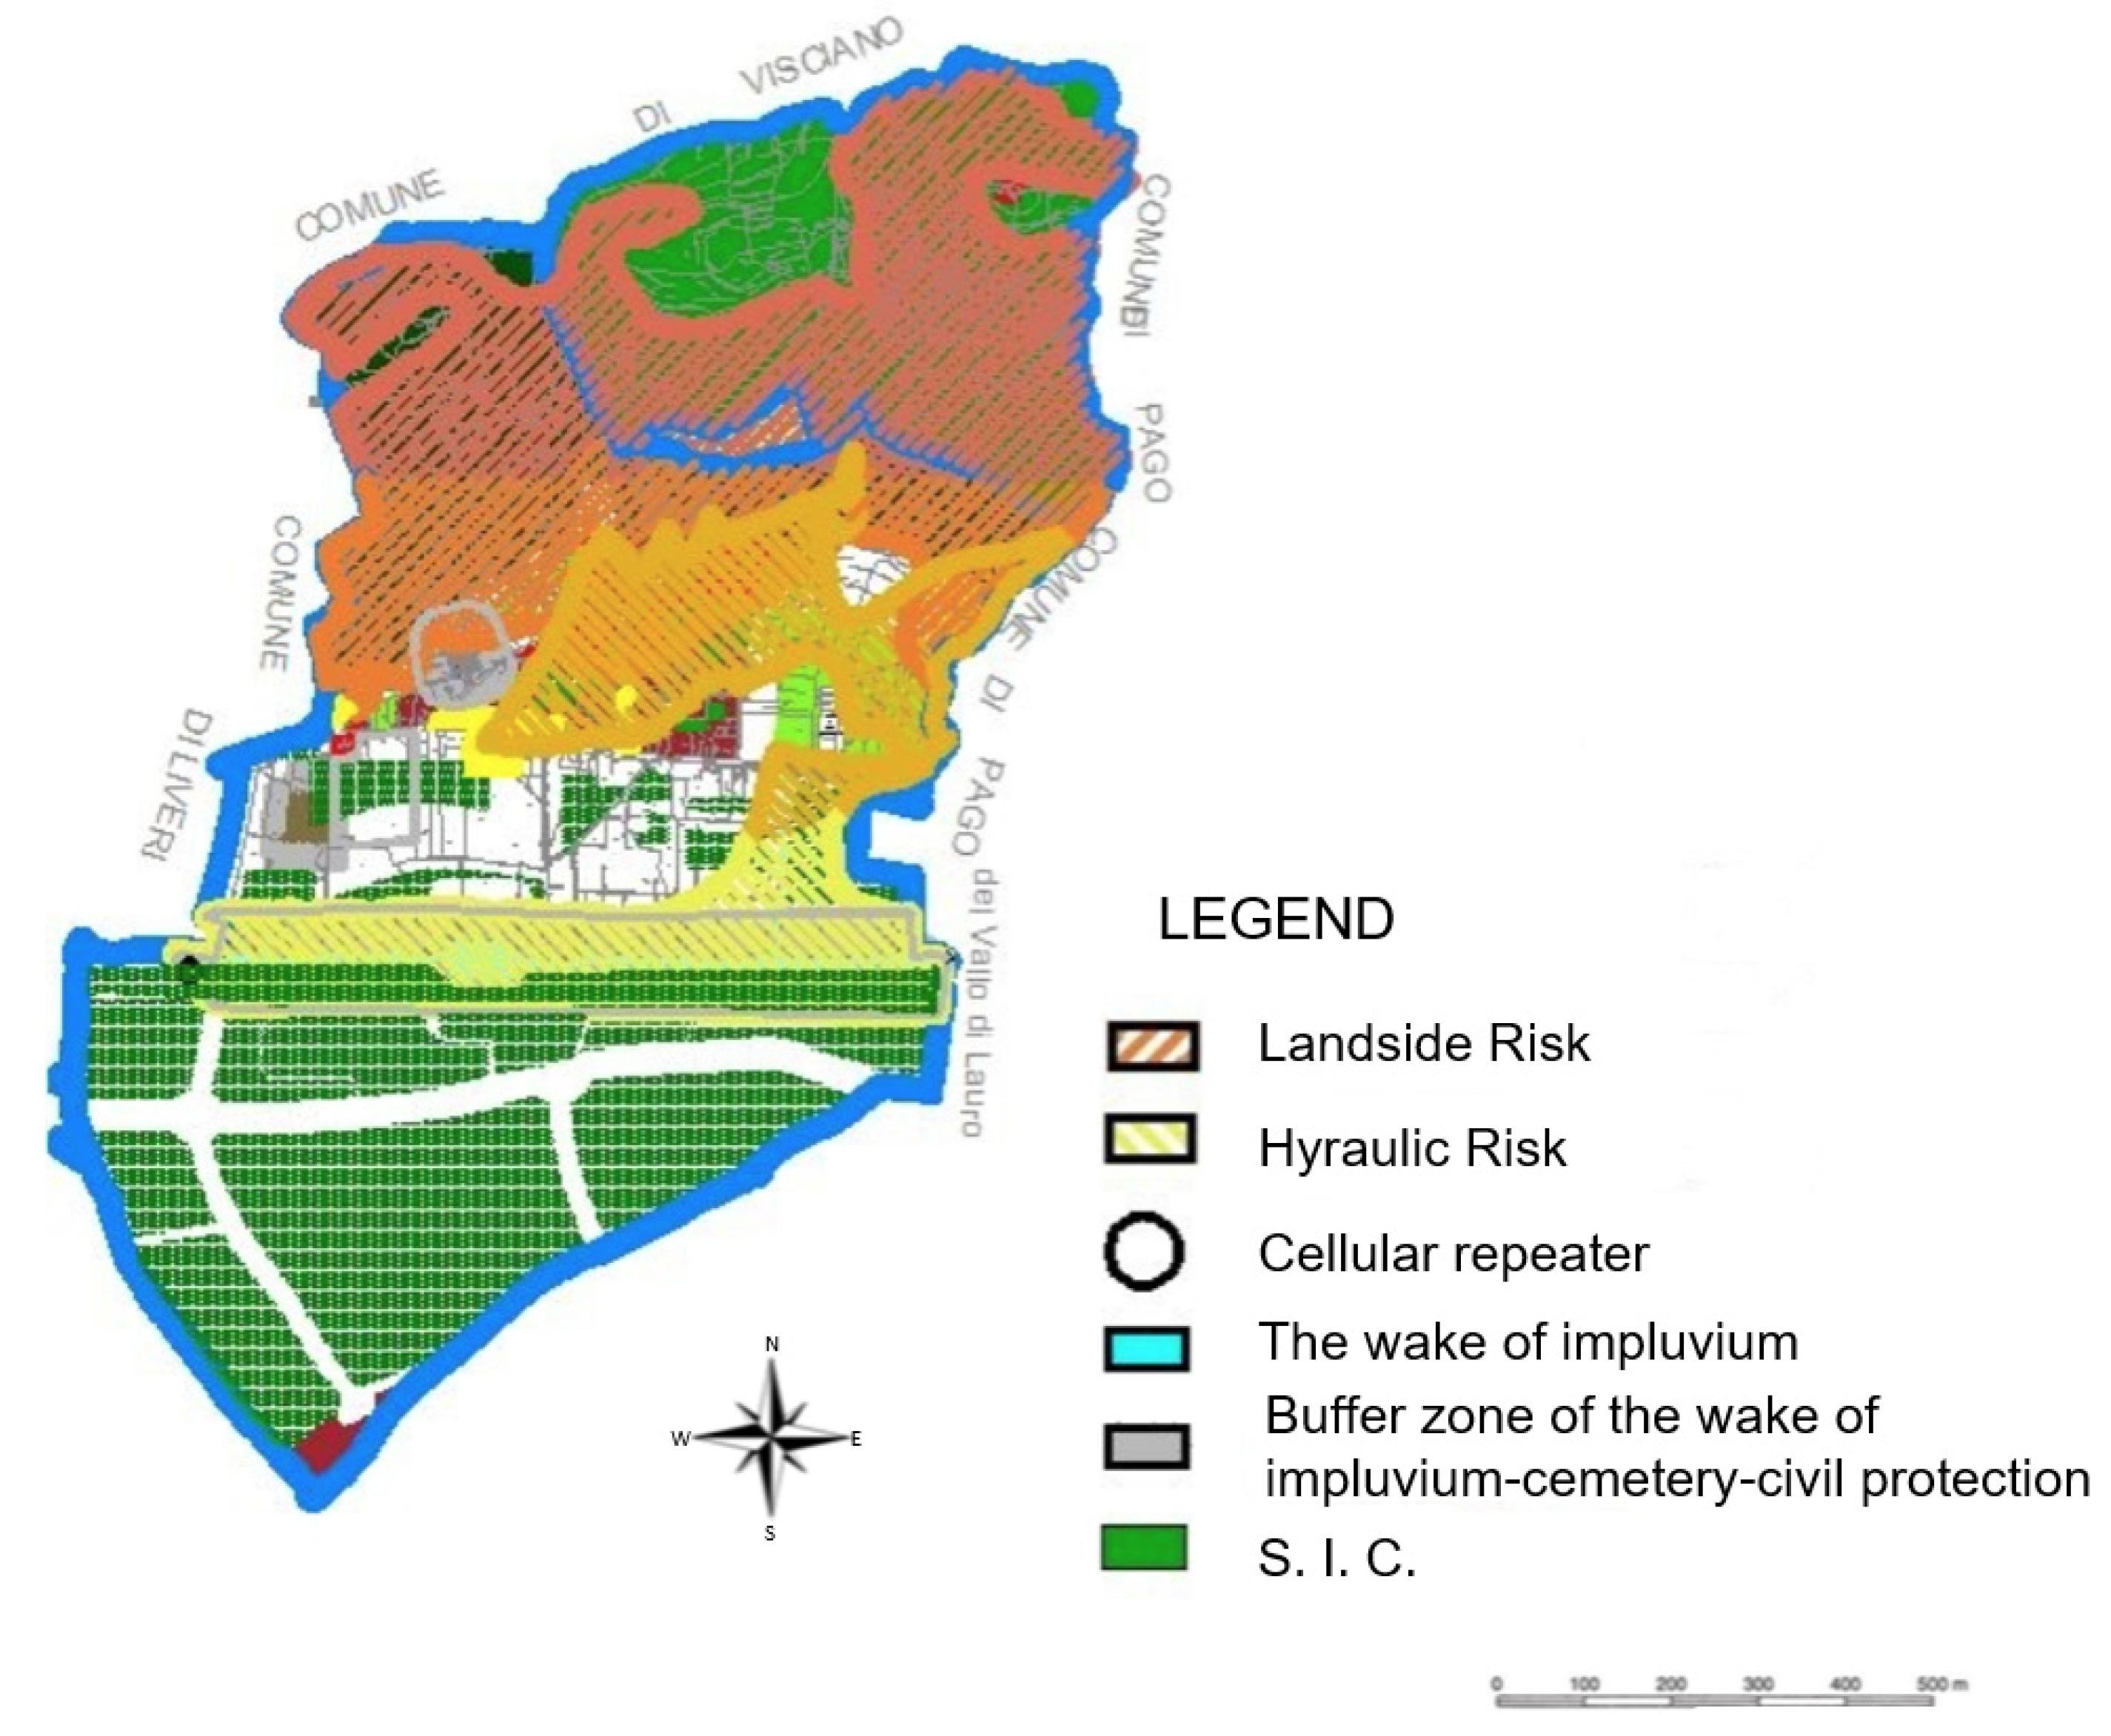
Figure 4.
Rank order of the scenarios.

Figure 5.
Sensitivity analysis: score uncertainty of 30%.

Figure 6.
Rank order of the scenarios: Weighted Summation Method (WSM).


Table 1.
List of indicators.
| Classes of Indicators | List of Indicators | Selected Indicators |
|---|---|---|
| AGRICULTURE | Agricultural area | X |
| Use of fertilizers | X | |
| Use of plant protection products | X | |
| Use of pesticides on plants | ||
| Agricultural land management | ||
| Water quality | ||
| FORESTRY | Wood production | X |
| Sustainable forest management | ||
| TOURISM | Tourist Flows | X |
| Impact of tourism on waste | X | |
| Tourism infrastructures | X | |
| INDUSTRY | Index of industrial production | |
| Distance of industrial companies from sensible sites | X | |
| Emission in the atmosphere | ||
| Emission in water | ||
| NOISE | Population exposed to noise | X |
| Regional law observatory | ||
| ATMOSPHERE | Inventories on local air emission | |
| Particulates | ||
| Tropospheric ozone O2 | ||
| Neighborhood to sensitive receptors | X | |
| Average Temperature | ||
| WASTE | Production of urban waste | X |
| Quantity of urban waste recycled | X | |
| NATURAL HAZARDS (Geological–hydrological) | Area at geological and hydrogeological risk | |
| Population exposed to flood | ||
| NATUARL HAZARDS (Seismic–volcanic) | Areas at seismic and volcanic risk |
Table 2.
Potentiality and critical issues.
| Potentiality | Critical Issues |
|---|---|
| Quality of environment | Urban sprawl |
| Uniqueness of agricultural landscape | Lack of green spaces for leisure |
| Presence of areas and pedestrian paths | Decrease of suitable areas for local wildlife (trees, fences, corridors, vegetation) |
| Presence of a historically and culturally rich city center | Pollution of the Regi Lagni and surrounding areas |
| Presence of sites of community importance (SICs) | Fragmentary nature of commercial activities |
| Efficient school system | Pollution by dust raised during the hazelnut harvest |
| Efficient management of waste | Pollution caused by spraying walnut groves with pesticides |
| Productive activity based on local resources | Presence of illegal dumps |
| Absence of strategies to boost the economy | |
| Areas at risk of hydrogeological instability | |
| Poor level of preservation of historical and architectural heritage | |
| Lack of public services and cultural activities |
Table 3.
Objectives, strategies, and actions.
| Objective | Strategy | Action |
|---|---|---|
| 1. Sustainable economic development based on cultivating local resources | S.1.1 Promotion of local agricultural production | A.1.1.1 Incentives to create walnut and chestnut groves |
| S.1.2 Fostering of development of local microenterprises | A.1.2.1 Promotion of organic farming | |
| A.1.2.2 Creation of a DOP brand for local production | ||
| 2. Improvement of town’s attractiveness to bring it into line with that of the region/in regard to the regional territorial reality | S.2.1 Improvement of labor supply | A.2.1.1 Development of an industrial area |
| S.2.2 Improvement of hotel facilities for tourists | A.2.2.1 Inclusion of new types of accommodations (e.g., farm houses) | |
| S.2.3 Revival of local traditions | A.2.3.1 Enhancement of local crafts | |
| A.2.3.2 Conservation of historical and architectural values | ||
| 3. Development of construction and infrastructure compatible with landscape protection and enhancement of the territory’s characteristics | S.3.1 Redevelopment of existing residential area | A.3.1.1 Renovation and development of residential historical and contemporary buildings |
| A.3.1.2 Enhancement of public spaces | ||
| A.3.1.3 Redesign of the existing road system | ||
| S.3.2 Relocation of residences in areas at hydrogeological risk | A.3.2.1 Fiscal and financial incentives for relocation | |
| S.3.3 Housing development concentrated around the existing core | A.3.3.1 Creation of new residential areas around the existing core | |
| A.3.3.2 Inclusion of new public spaces | ||
| A.3.3.3 Expansion of the existing road system | ||
| S.3.4 Promotion of functional mix | A.3.4.1 Inclusion of new public spaces | |
| A.3.4.2 Inclusion of neighborhood services | ||
| 4. Territorial and agricultural landscape protection | S.4.1 Protection of natural resources | A.4.1.1 Restriction of construction in areas of naturalistic value |
| S.4.2 Ecological enhancement of valleys | A.4.2.1 Creation of green areas for recreational activities | |
| A.4.2.2 Creation of an ecological reserve and regional park | ||
| S.4.3 Recovery of the Regi Lagni area | A.4.3.1 Upgrading and securing of river courses |
Note: DOP is an italian acronym for Denominazione di origine protetta and is used for specific products.
Table 4.
Thematic criteria.
| Thematic Criterion Maps | Indicators | Source |
|---|---|---|
| Agriculture | Agricultural area | ISTAT 2014/Municipality |
| Use of fertilizer | Municipality | |
| Use of plant protection products | Municipality | |
| Forestry | Wood production | ISTAT 2014 |
| Tourism | Tourist infrastructure | Campania region and Municipality |
| Industry | Distance of industrial companies from sensible sites | Our elaboration |
| Noise | Population exposed to noise | Our elaboration |
| Waste | Production of urban waste | ISTAT 2014 |
| Quantity of waste recycled | ISTAT 2014 | |
| Atmosphere | Distance sources of emission from sensible sites | Our elaboration |
| Water | Distance sources of emission from river and flood | Our elaboration |
| Hydrological risk | Interference with areas at hydrological risk | Our elaboration |
| Geological risk | Interference with areas at landslide risk | Our elaboration |
Table 5.
Standardization of the criteria.
| Indicators | C/B | Unit | Standardization Method | Minimun Range | Maximum Range |
|---|---|---|---|---|---|
| Agriculture | |||||
| Agricultural area | + | ha | ↑ Maximum | 0 | 297 |
| Use of fertilizer | - | q/ha | ↓ Maximum | 0 | 1.8 |
| Use of plant protection products | q | ↓ Maximum | 0 | 31 | |
| Forestry | - | ||||
| Wood production | + | q | ↑ Maximum | 0 | 292 |
| Tourism | |||||
| Tourism infrastructure | + | mq | ↑ Maximum | 0 | 302 |
| Industry | |||||
| Distance of industrial companies from sensible sites | + | mL | ↑ Maximum | 0 | 1200 |
| Noise | |||||
| Population exposed to noise | - | ab | ↓ Maximum | 0 | 1387 |
| Waste | |||||
| Production of urban waste | - | kg | ↓ Maximum | 0 | 785 |
| Quantity of waste riclycled | + | kg | ↑ Maximum | 0 | 628 |
| Atmosphere | |||||
| Distance sources of emission from sensible sites | + | mL | ↑ Maximum | 0 | 1200 |
| Water | |||||
| Distance sources of emission from river and flood sites | + | mL | ↑ Maximum | 0 | 1200 |
Table 6.
Future scenarios for Marzano di Nola.
| Actions | Scenario 1 | Scenario 2 | Scenario 3 |
|---|---|---|---|
| A.1.1.1 Incentives to create walnut and chestnut groves | X | ||
| A.1.2.1 Promotion of organic farming | |||
| A.1.2.2 Creation of a DOP brand for local production | X | ||
| A.2.1.1 Development of an industrial area | X | ||
| A.2.2.1 Inclusion of new types of accommodations (e.g., farm houses) | X | X | |
| A.2.3.1 Enhancement of local crafts | X | X | |
| A.2.3.2 Conservation of historical and architectural values | X | X | |
| A.3.1.1 Renovation and development of residential historic and contemporary buildings | X | X | |
| A.3.1.2 Enhancement of public spaces | X | X | |
| A.3.1.3 Redesign of the existing road system | X | X | |
| A.3.2.1 Fiscal and financial incentives for relocation | X | ||
| A.3.3.1 Creation of new residential areas around the existing area | X | ||
| A.3.3.2 Inclusion of new public spaces | X | X | |
| A.3.3.3 Expansion of the existing road system | X | X | X |
| A.3.4.1 Inclusion of new public spaces | X | X | |
| A.3.4.2 Inclusion of neighborhood services | X | ||
| A.4.1.1 Restriction of construction in areas of naturalistic value | X | ||
| A.4.2.1 Creation of green areas for recreational activities | X | X | |
| A.4.2.2 Creation of an ecological reserve and regional park | X | ||
| A.4.3.1 Upgrading and securing of river courses | X | X | X |
Table 7.
Table of effects.
| Thematic Area | Indicators | MU | Status Quo | Scenario 1 | Scenario 2 | Scenario 3 |
|---|---|---|---|---|---|---|
| Agriculture | Agricultural area | Ha | 264 | 290 | 251 | 297 |
| Use of fertilizer | q/ha | 1583 | 1741 | 1503 | 1782 | |
| Use of plant protection products | Q | 28 | 30 | 26 | 31 | |
| Forestry | Wood production | Ha | 260 | 286 | 247 | 292 |
| Tourism | Tourist infrastructure | m2 | 287 | 287 | 287 | 302 |
| Industry | Distance of industrial companies from sensible sites | mL | 480 | 1200 | 480 | 480 |
| Noise | Population exposed to noise | Ab | 1387 | 1287 | 1387 | 1387 |
| Waste | Production of urban waste | kg | 569 | 569 | 785 | 569 |
| Quantity of waste recycled | kg | 455 | 455 | 628 | 455,017 | |
| Atmosphere | Distance sources of emission from sensible sites | mL | 480 | 1200 | 480 | 480 |
| Water | Distance sources of emission from river and flood | mL | 480 | 1200 | 480 | 480 |
Note: MU means unit of measure.
© 2017 by the authors. Licensee MDPI, Basel, Switzerland. This article is an open access article distributed under the terms and conditions of the Creative Commons Attribution (CC BY) license (http://creativecommons.org/licenses/by/4.0/).
Share and Cite
MDPI and ACS Style
Torrieri, F.; Batà, A. Spatial Multi-Criteria Decision Support System and Strategic Environmental Assessment: A Case Study. Buildings 2017, 7, 96. https://doi.org/10.3390/buildings7040096
AMA Style
Torrieri F, Batà A. Spatial Multi-Criteria Decision Support System and Strategic Environmental Assessment: A Case Study. Buildings. 2017; 7(4):96. https://doi.org/10.3390/buildings7040096
Chicago/Turabian StyleTorrieri, Francesca, and Antonella Batà. 2017. "Spatial Multi-Criteria Decision Support System and Strategic Environmental Assessment: A Case Study" Buildings 7, no. 4: 96. https://doi.org/10.3390/buildings7040096
Note that from the first issue of 2016, this journal uses article numbers instead of page numbers. See further details here.