Article

Application of a CFD Validated Model to Plan Fan Heater Position within Flour Mills during a Heat Treatment for Insect Pest Control

Department of Agriculture, Food and Environment, University of Catania, via S. Sofia 100, 95123 Catania, Italy
*
Author to whom correspondence should be addressed.
Buildings 2018, 8(10), 132; https://doi.org/10.3390/buildings8100132
Submission received: 1 August 2018 / Revised: 13 September 2018 / Accepted: 19 September 2018 / Published: 22 September 2018

Abstract

:
The development of environmentally-friendly methods as alternatives to chemical fumigation for controlling insect pests has attracted public attention. Among these methods, heat treatment is based on the use of fan heaters that are positioned by operators who typically establish their number and position within buildings to be treated. The aim of this research was to improve heat treatment effectiveness by applying a validated computational fluid dynamics (CFD) model for planning fan heater positions within the building environment. Based on a CFD model, which was built and validated according to experimental data acquired during heat treatment of a flour mill, simulations were carried out by changing the position and/or rotation of fan heaters with the aim of enhancing temperature distribution inside the building. The results showed that in some simulations the percentage of internal wall surfaces having a temperature value lower than that required for heat treatment efficacy was considerably reduced, by up to 56.7%. Therefore, the CFD approach proposed in this study could be used as a decision support system for improving heat treatment efficacy.

1. Introduction

In recent years, the topic of food safety has attracted increasing attention due to its relevance among the research trajectories promoted at the European level by the Horizon 2020 program. In detail, this research trajectory aims to combine tradition with product and process innovation by ensuring both high safety and quality standards for a wide range of products. In this context, cereal production has been profoundly renewed over the last few years, through: specific genetic improvement activities that have helped to select different species characterized by better production yields; improved mechanization ability; improved response to fertilization; and, better quality standards from product milling.
Within the mill, the quality of semolina or flour production could be strongly affected by an increase of rodents and insect pests at different life stages, from eggs and larva until the adult form [1]. It is well known that flour mill products constitute an ideal substrate to enhance growth of these pests, and that their presence could be, in turn, a detriment of the quality of the milling industry products with negative consequences on their marketing [2].
To avoid these negative consequences, pest control is urgently needed. Pest control can be achieved by using different approaches, ranging from the use of chemical protectants, such as gaseous fumigants, to physical treatments [3].
For several years, before its use was banned by the Montreal Protocol in 1987 due to its role in reducing the ozone layer, methyl bromide was widely used because of its efficiency of disinfestation of grain storage and flour milling processing rooms. In recent years, integrated pest management (IPM) strategies, as alternative techniques to methyl bromide for insect pest control, have been developed. Among the strategies suitable for cultivation and continuous crop monitoring to control pests and reduce pesticide use [4], heat treatment of the processing environment is an environmentally-friendly method for insect pest control in flour mills since it does not require the use of toxic substances [4,5,6,7,8,9].
Heat treatment consists of increasing air temperatures inside the building environment to unusually high values. Since lethal effects for the efficacy of insect pest control depend on both high temperatures and exposure time interval, a number of parameters that could affect the level of air temperatures inside the building environment, such as the building location, external climatic conditions, and the characteristics of the building components, should be considered.
Furthermore, heat treatment operators define the number and the position of fan heaters empirically, without a specific planning phase. This is an important issue for the management of the treatment, and which could be overcome using computational fluid dynamics (CFD) models [10,11,12,13,14,15,16,17]. Recently, in a research study published by Valenti et al. [18], a method to build a CFD model for simulating thermal behaviour of a flour mill during heat treatment was defined.
Since the identification of the most appropriate strategy for optimisation of the treatment and minimisation of energy costs, which economically affect the strategy’s execution and sustainability, is of utmost importance, the objective of this research study was to apply a CFD model to carry out simulations for defining the optimal position of fan heaters during heat treatment. Firstly, the CFD model, previously built and validated by Valenti et al. [18] according to experimental data acquired during heat treatment, was used to obtain surface temperatures of the flour mill walls. Then, surfaces having temperatures below 45 °C, which prevents heat treatment from being effective, were identified by carrying out simulations by changing position and/or rotation of the fan heaters. Finally, by calculating the percentage decrease of surfaces having a temperature lower than 45 °C, an improved configuration of fan heaters was identified without necessitating an increase in their number. The study proposed in this paper is novel because the results of the simulations could be useful to define decision support systems for operators, who typically define the number and the position of the fan heaters empirically. Furthermore, more effective planning of fan heater positions could avoid damage to machines, such as the plansifters, and ensure adequate levels of temperatures in some building components that could become refuges for insects during the treatment.

2. Materials and Methods
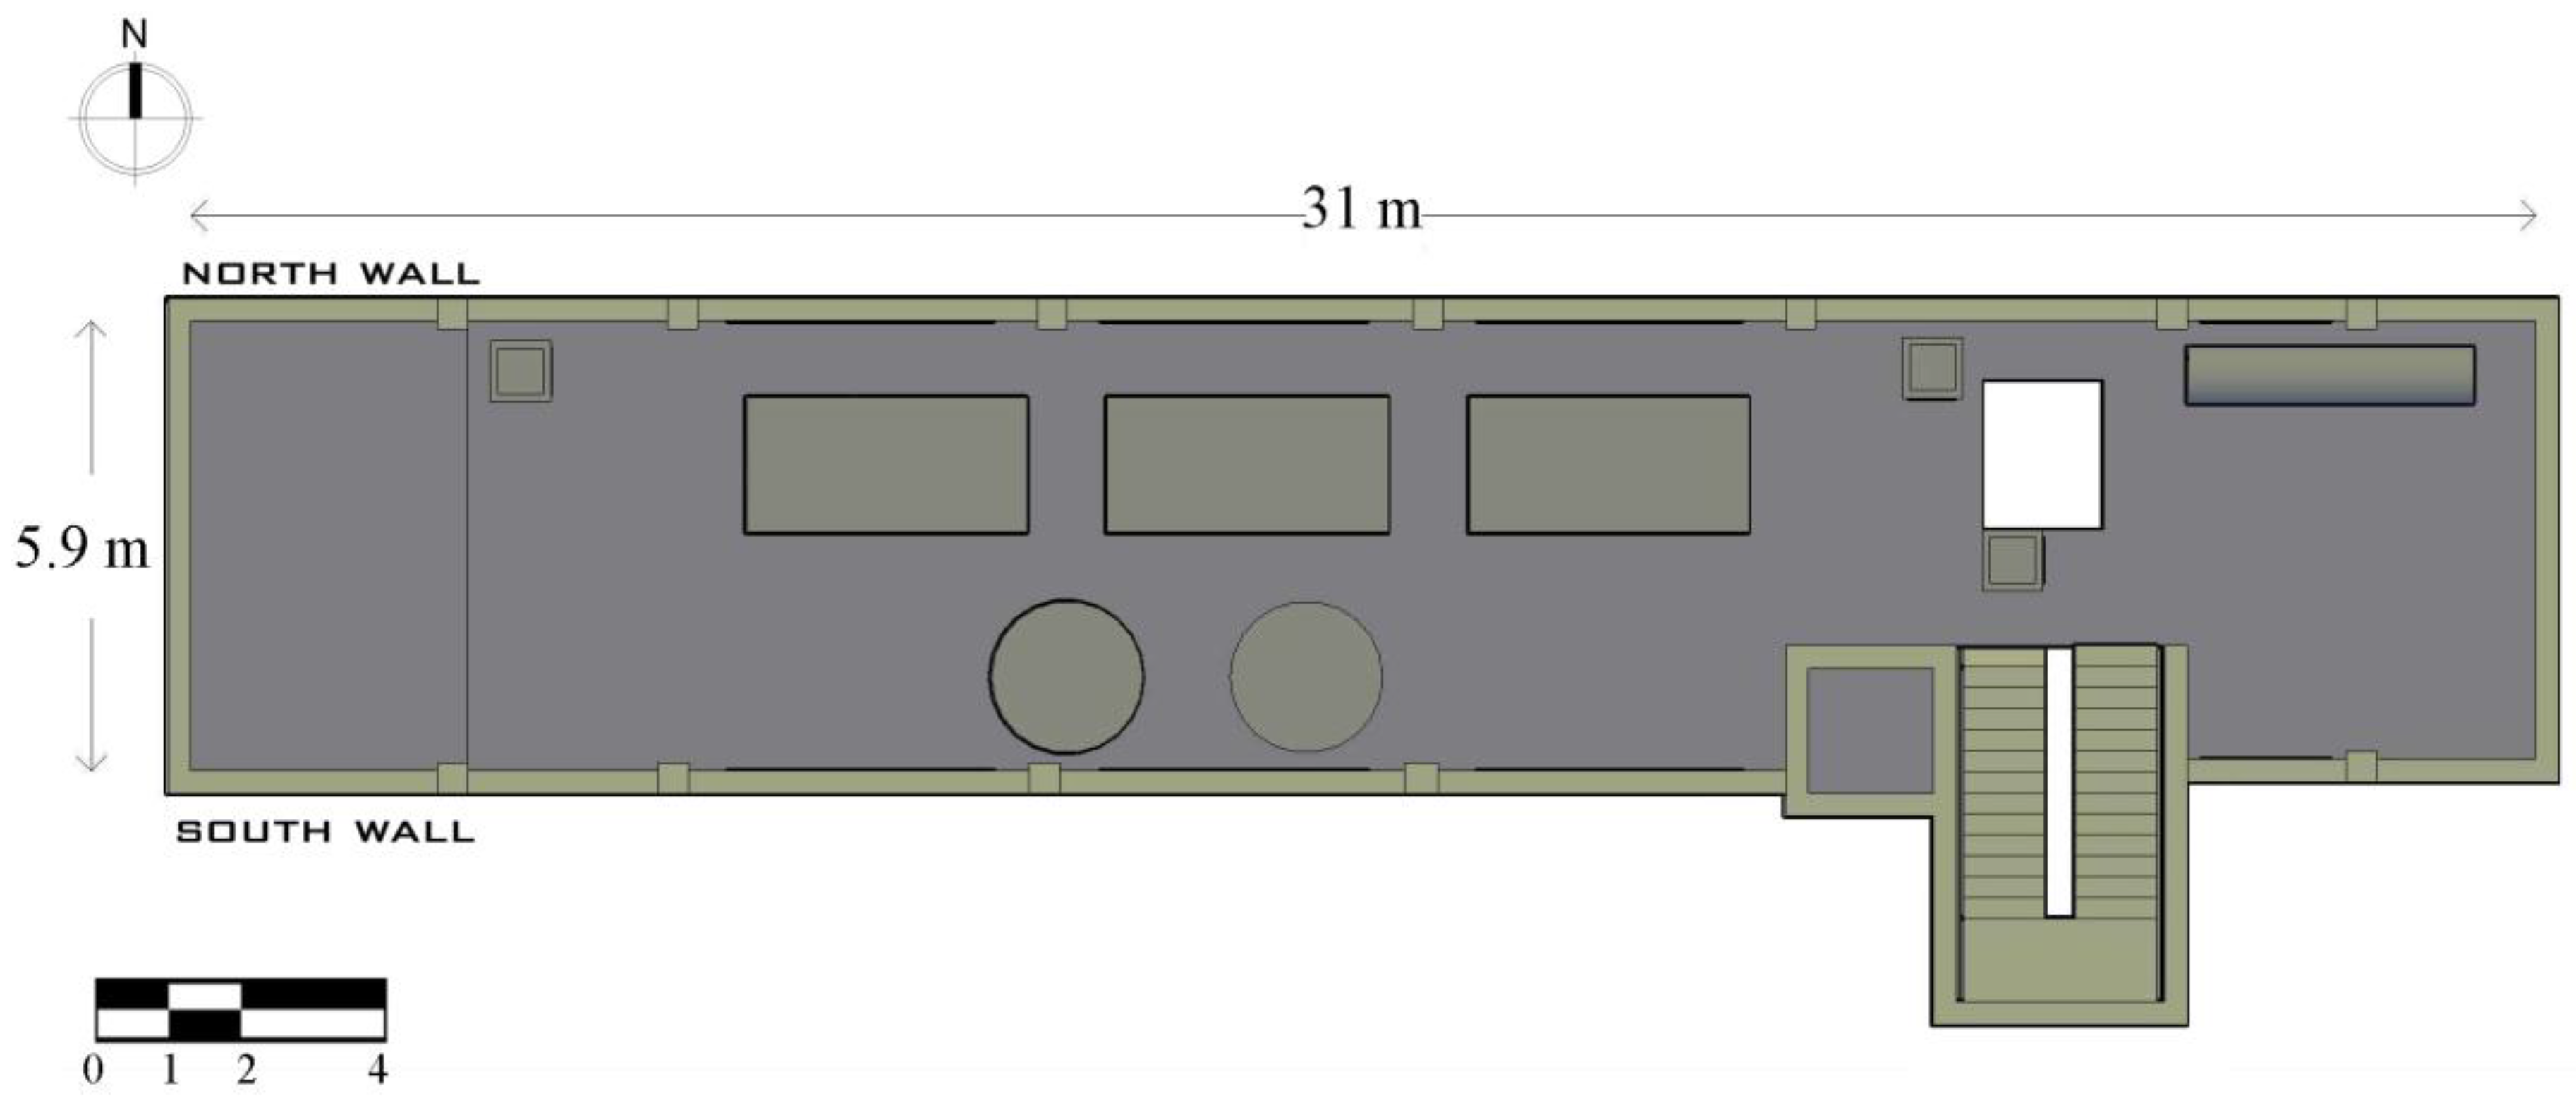
2.1. Case Study

The flour mill analysed in this study is located in the province of Syracuse, in eastern Sicily (36°59′56.8″ N, 15°13′59.5″ E). As reported by Valenti et al. [18], the mill has five floors, for a total height of 26.1 m, and the plan of the mill is approximately rectangular, with a longitudinal axis oriented in the east-west direction (Figure 1).
The five floors are connected by a reinforced concrete staircase and an elevator cage. The rooms used for grain processing have a reinforced concrete frame and insulated brick walls. The floors have cavities that allow the passage of the product from one floor to another, as is often done in buildings with the same intended use [19].
The heat treatment, which consists of increasing the air temperature of the treated environment until it reaches 45–55 °C, and maintaining it at that level for 36–48 h [8,20,21,22], was carried out by a specialised company on April 2014 and lasted 48 h; i.e., from 4:00 p.m. of 24 April 2014 to 4:00 p.m. of 26 April 2014. The monitoring was carried out at the second floor, where the presence of plansifters, which are sensitive to high temperatures, would make heat treatment more problematic [23]. Although the effect of heat treatment on the machinery was not a direct objective of this study, the risk of damaging machinery would be reduced by optimising temperature distribution inside the building.
In this study, the increase in temperature was generated by fan heaters, which allowed heat distribution in the treated environment [8]. Typically, desired temperatures are not easily reached near floor level and at wall-to-wall and floor-to-floor intersections [1,8], which are considered ‘weak points’ of the treatment [23]. In the second floor of the analyzed mill, three fan heaters were placed by the operators of the specialist company. During the treatment, the fan heaters were set to produce an output temperature of 70 °C and a volumetric flow rate of 2500 m3 h−1.

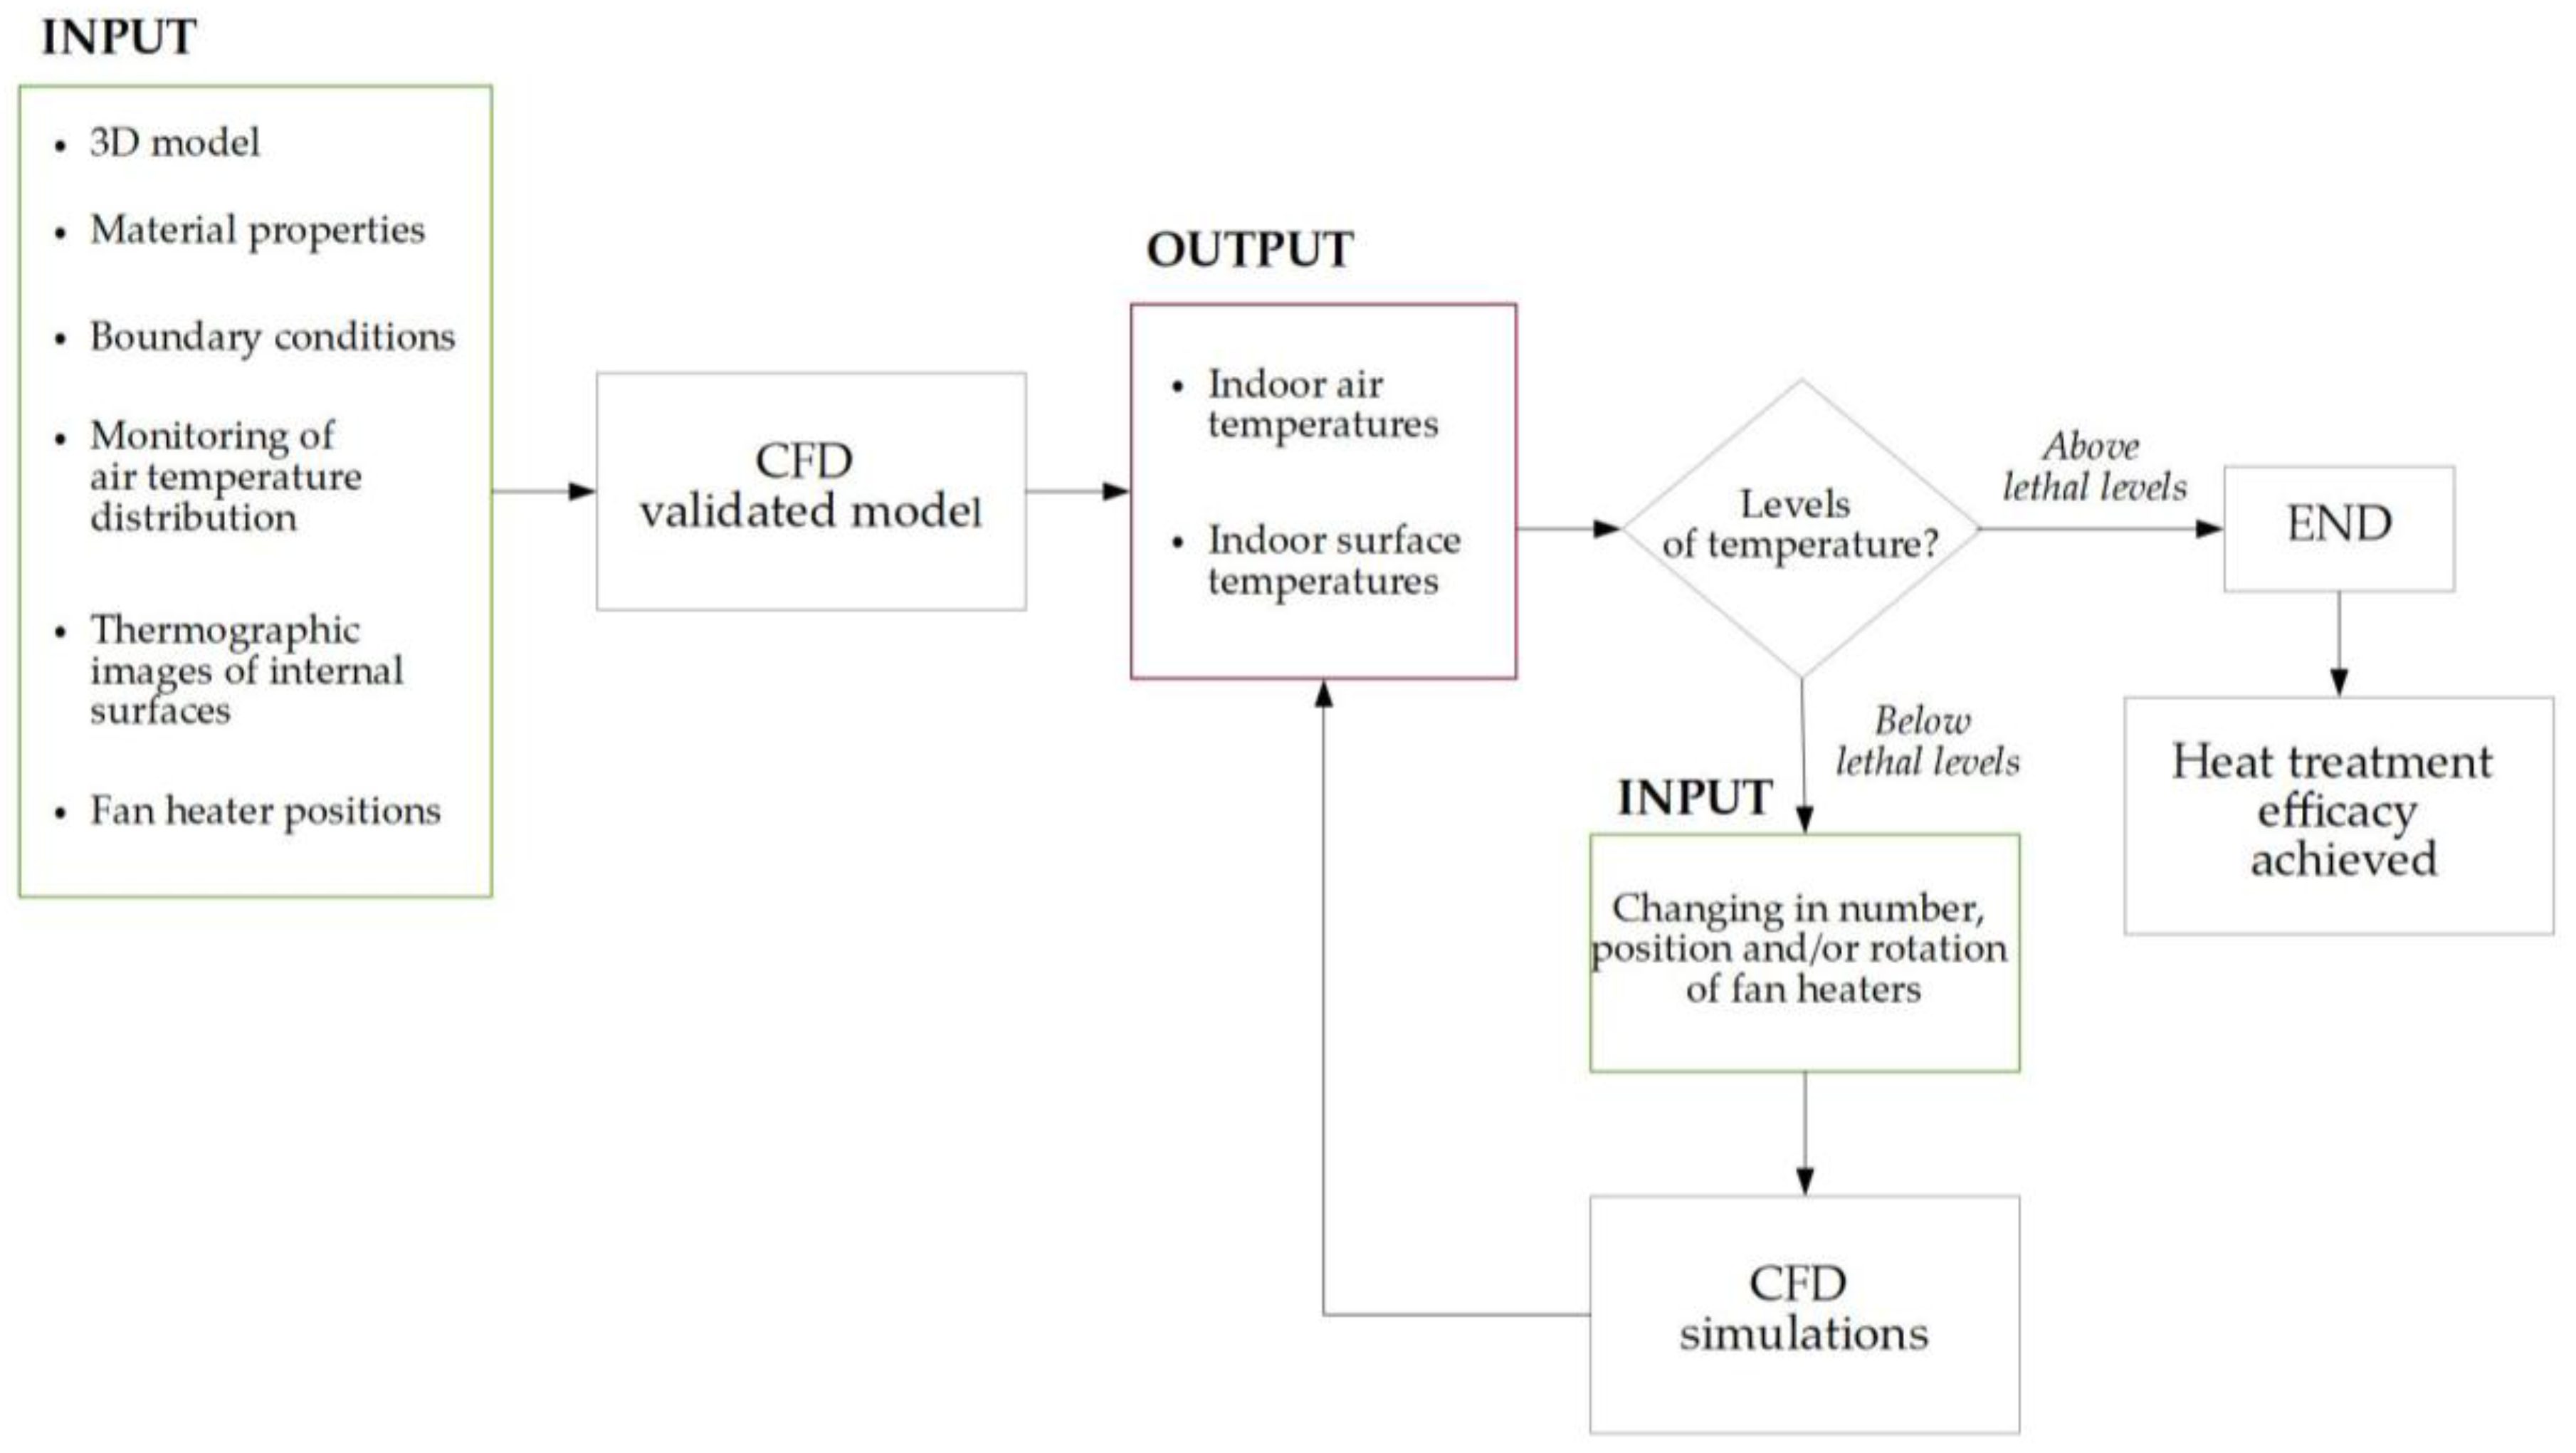
2.2. The CFD Validated Model

A shown in Figure 2, firstly, the three-dimensional model of the analyzed flour mill, where the thermal conditions were monitored, was built using Autodesk® Autocad 2016 software (2016 Autodesk Inc., San Rafael, CA, USA), in order to be imported into Autodesk® CFD 2016 (2016 Autodesk Inc., San Rafael, CA, USA).
Air temperature data in the reference floor were detected before and during the whole heat treatment by using 8 Grillobee data-loggers (Tecnoel, Milan, Italy) connected to temperature transducers (Rotronic Italia s.r.l., Milan, Italy) and placed in different points of the floor in order to obtain a uniform field of temperatures.
The CFD model was then validated by comparing the temperatures obtained in the simulation, at the same points within the model created with Autodesk® CFD 2016, with the average air temperatures recorded by the data-loggers [18]. The output of the validated model was the indoor air and surface temperatures within the mill.
The results obtained by Valenti et al. [18] show that although the recorded average indoor air temperatures were above 47 °C, images detected by the thermal camera at the thermal bridges indicated that surface temperatures were much lower than 45 °C, which is the threshold value for the success of the heat treatment [6,22,24]. Therefore, building interventions or changing the number, position or rotation of fan heaters, are crucial to achieve efficient pest control, as was suggested in previous studies [18,23,24] (Figure 2).
Since the validated model by Valenti et al. [18] made it possible to obtain a temperature distribution that accurately fitted the real distribution, it was used to improve the efficiency of the heating system as described in the following section.

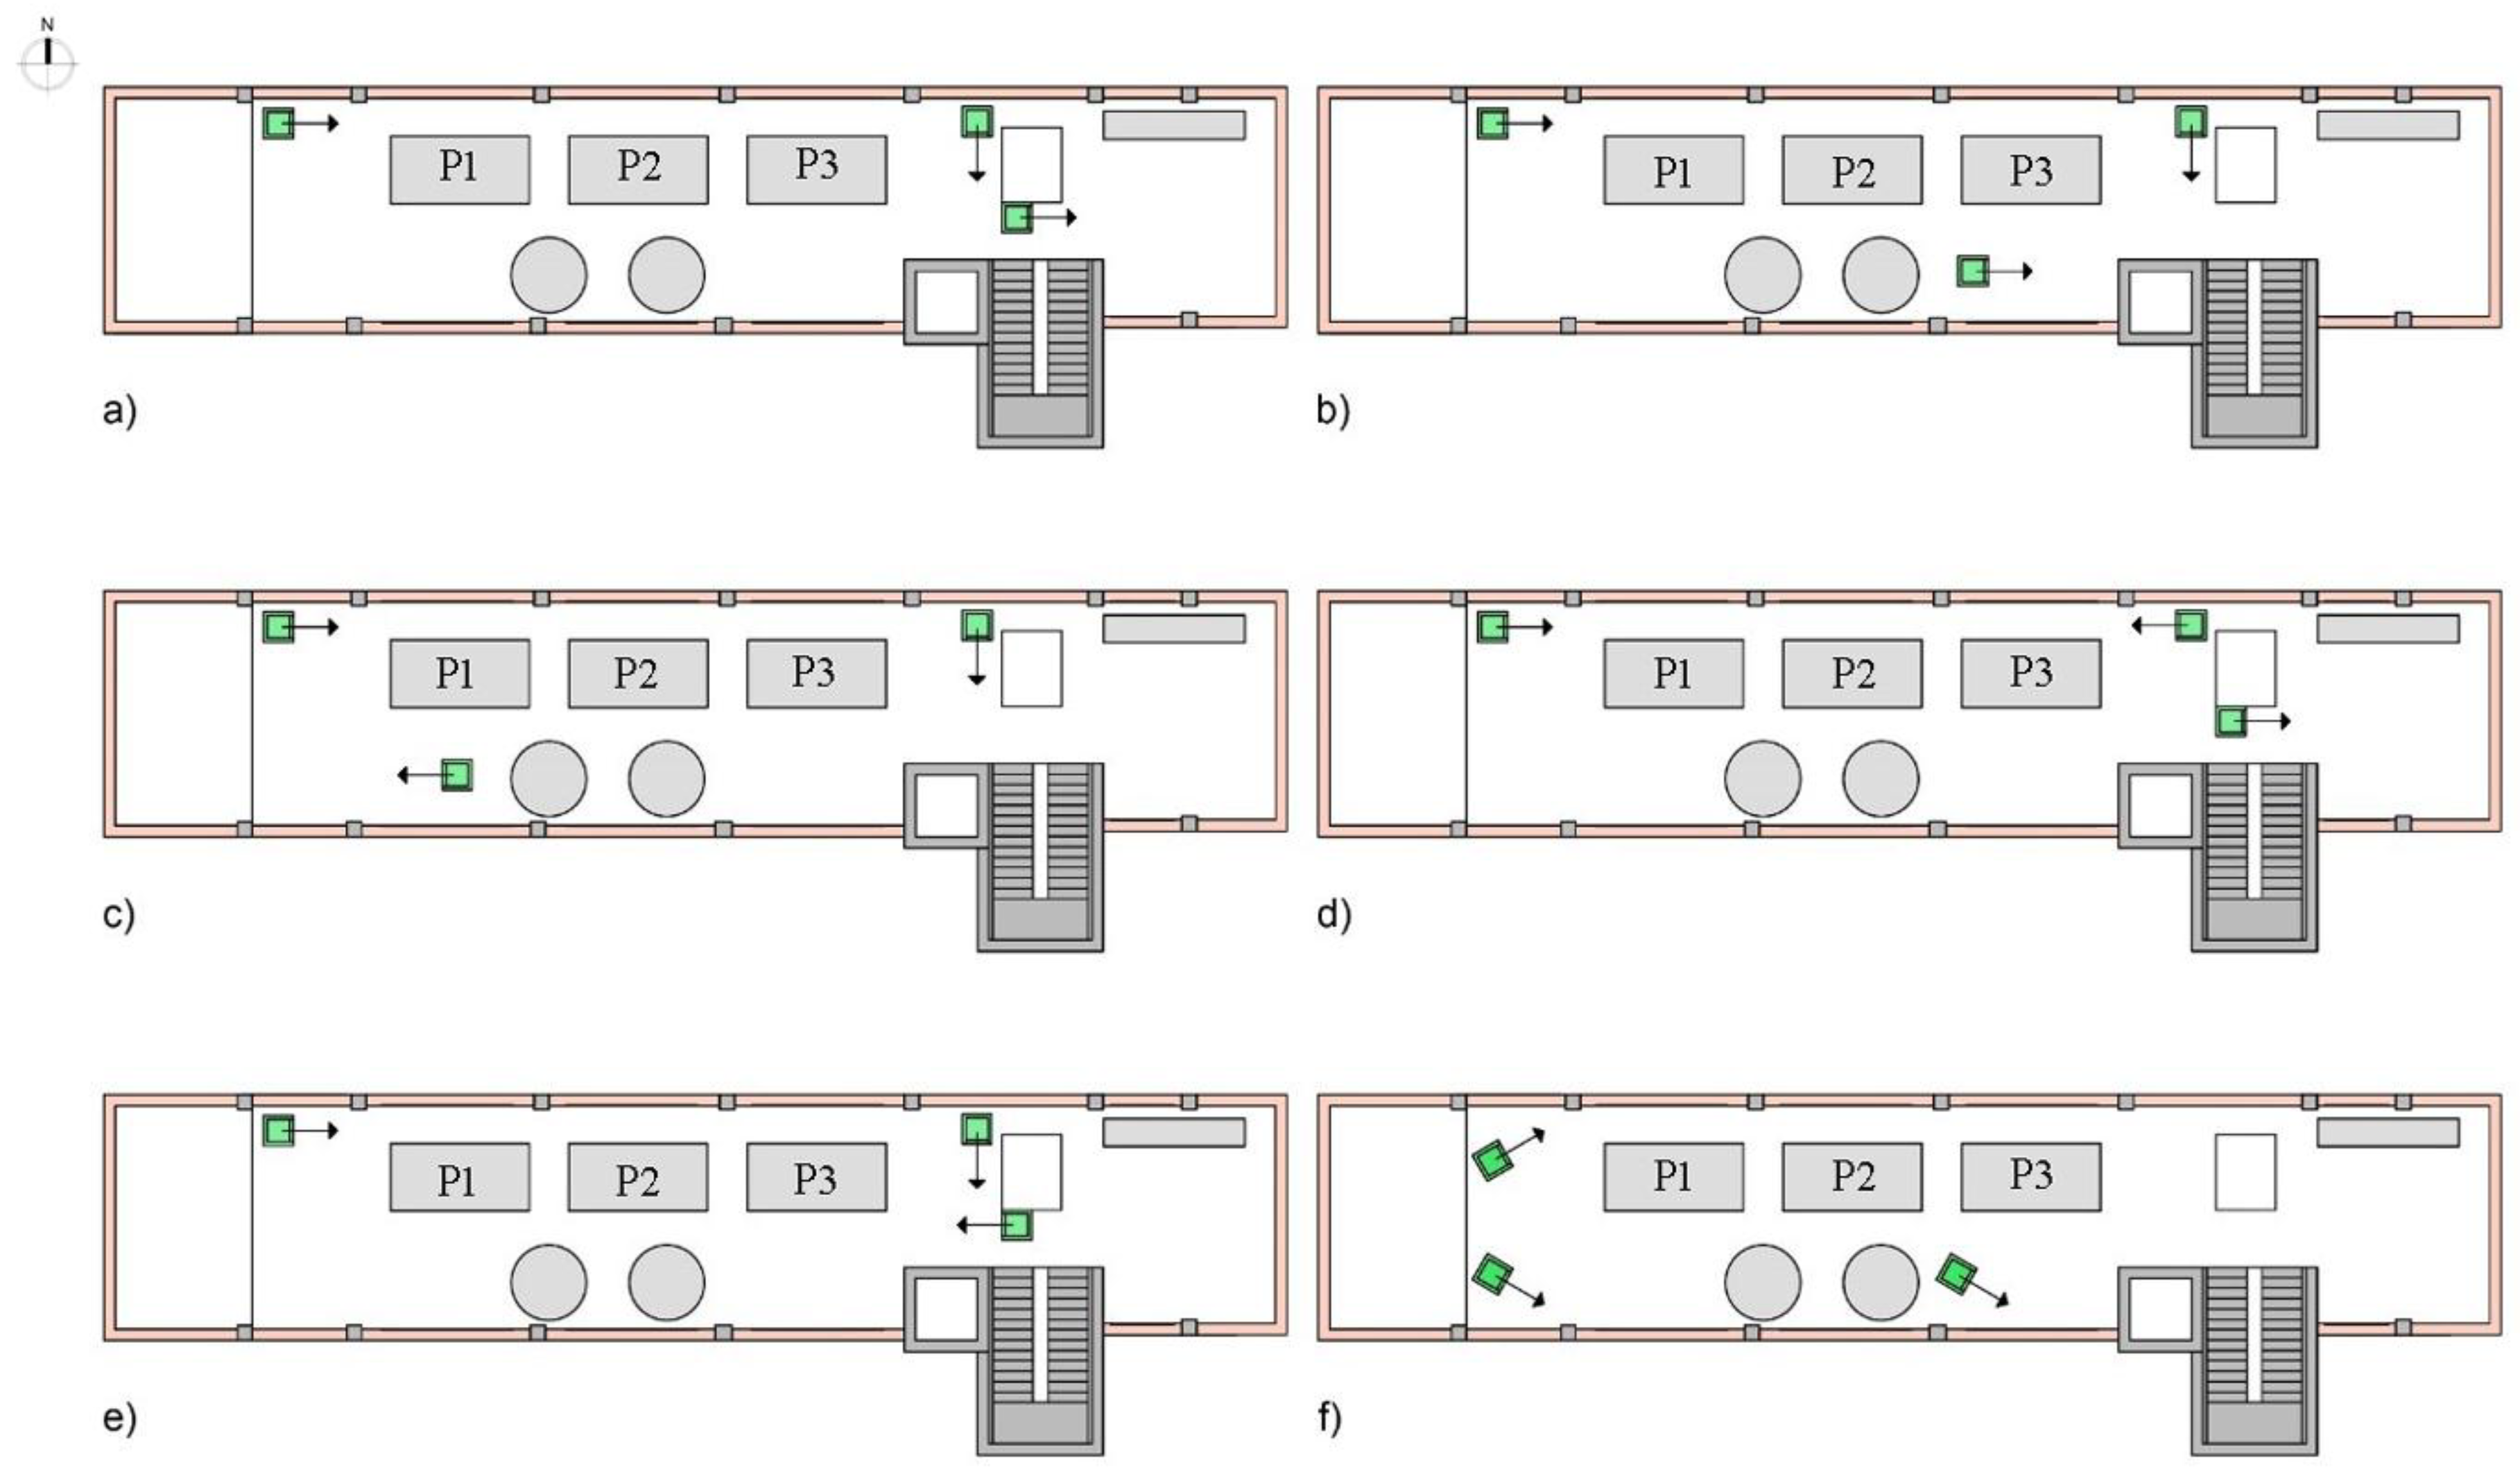
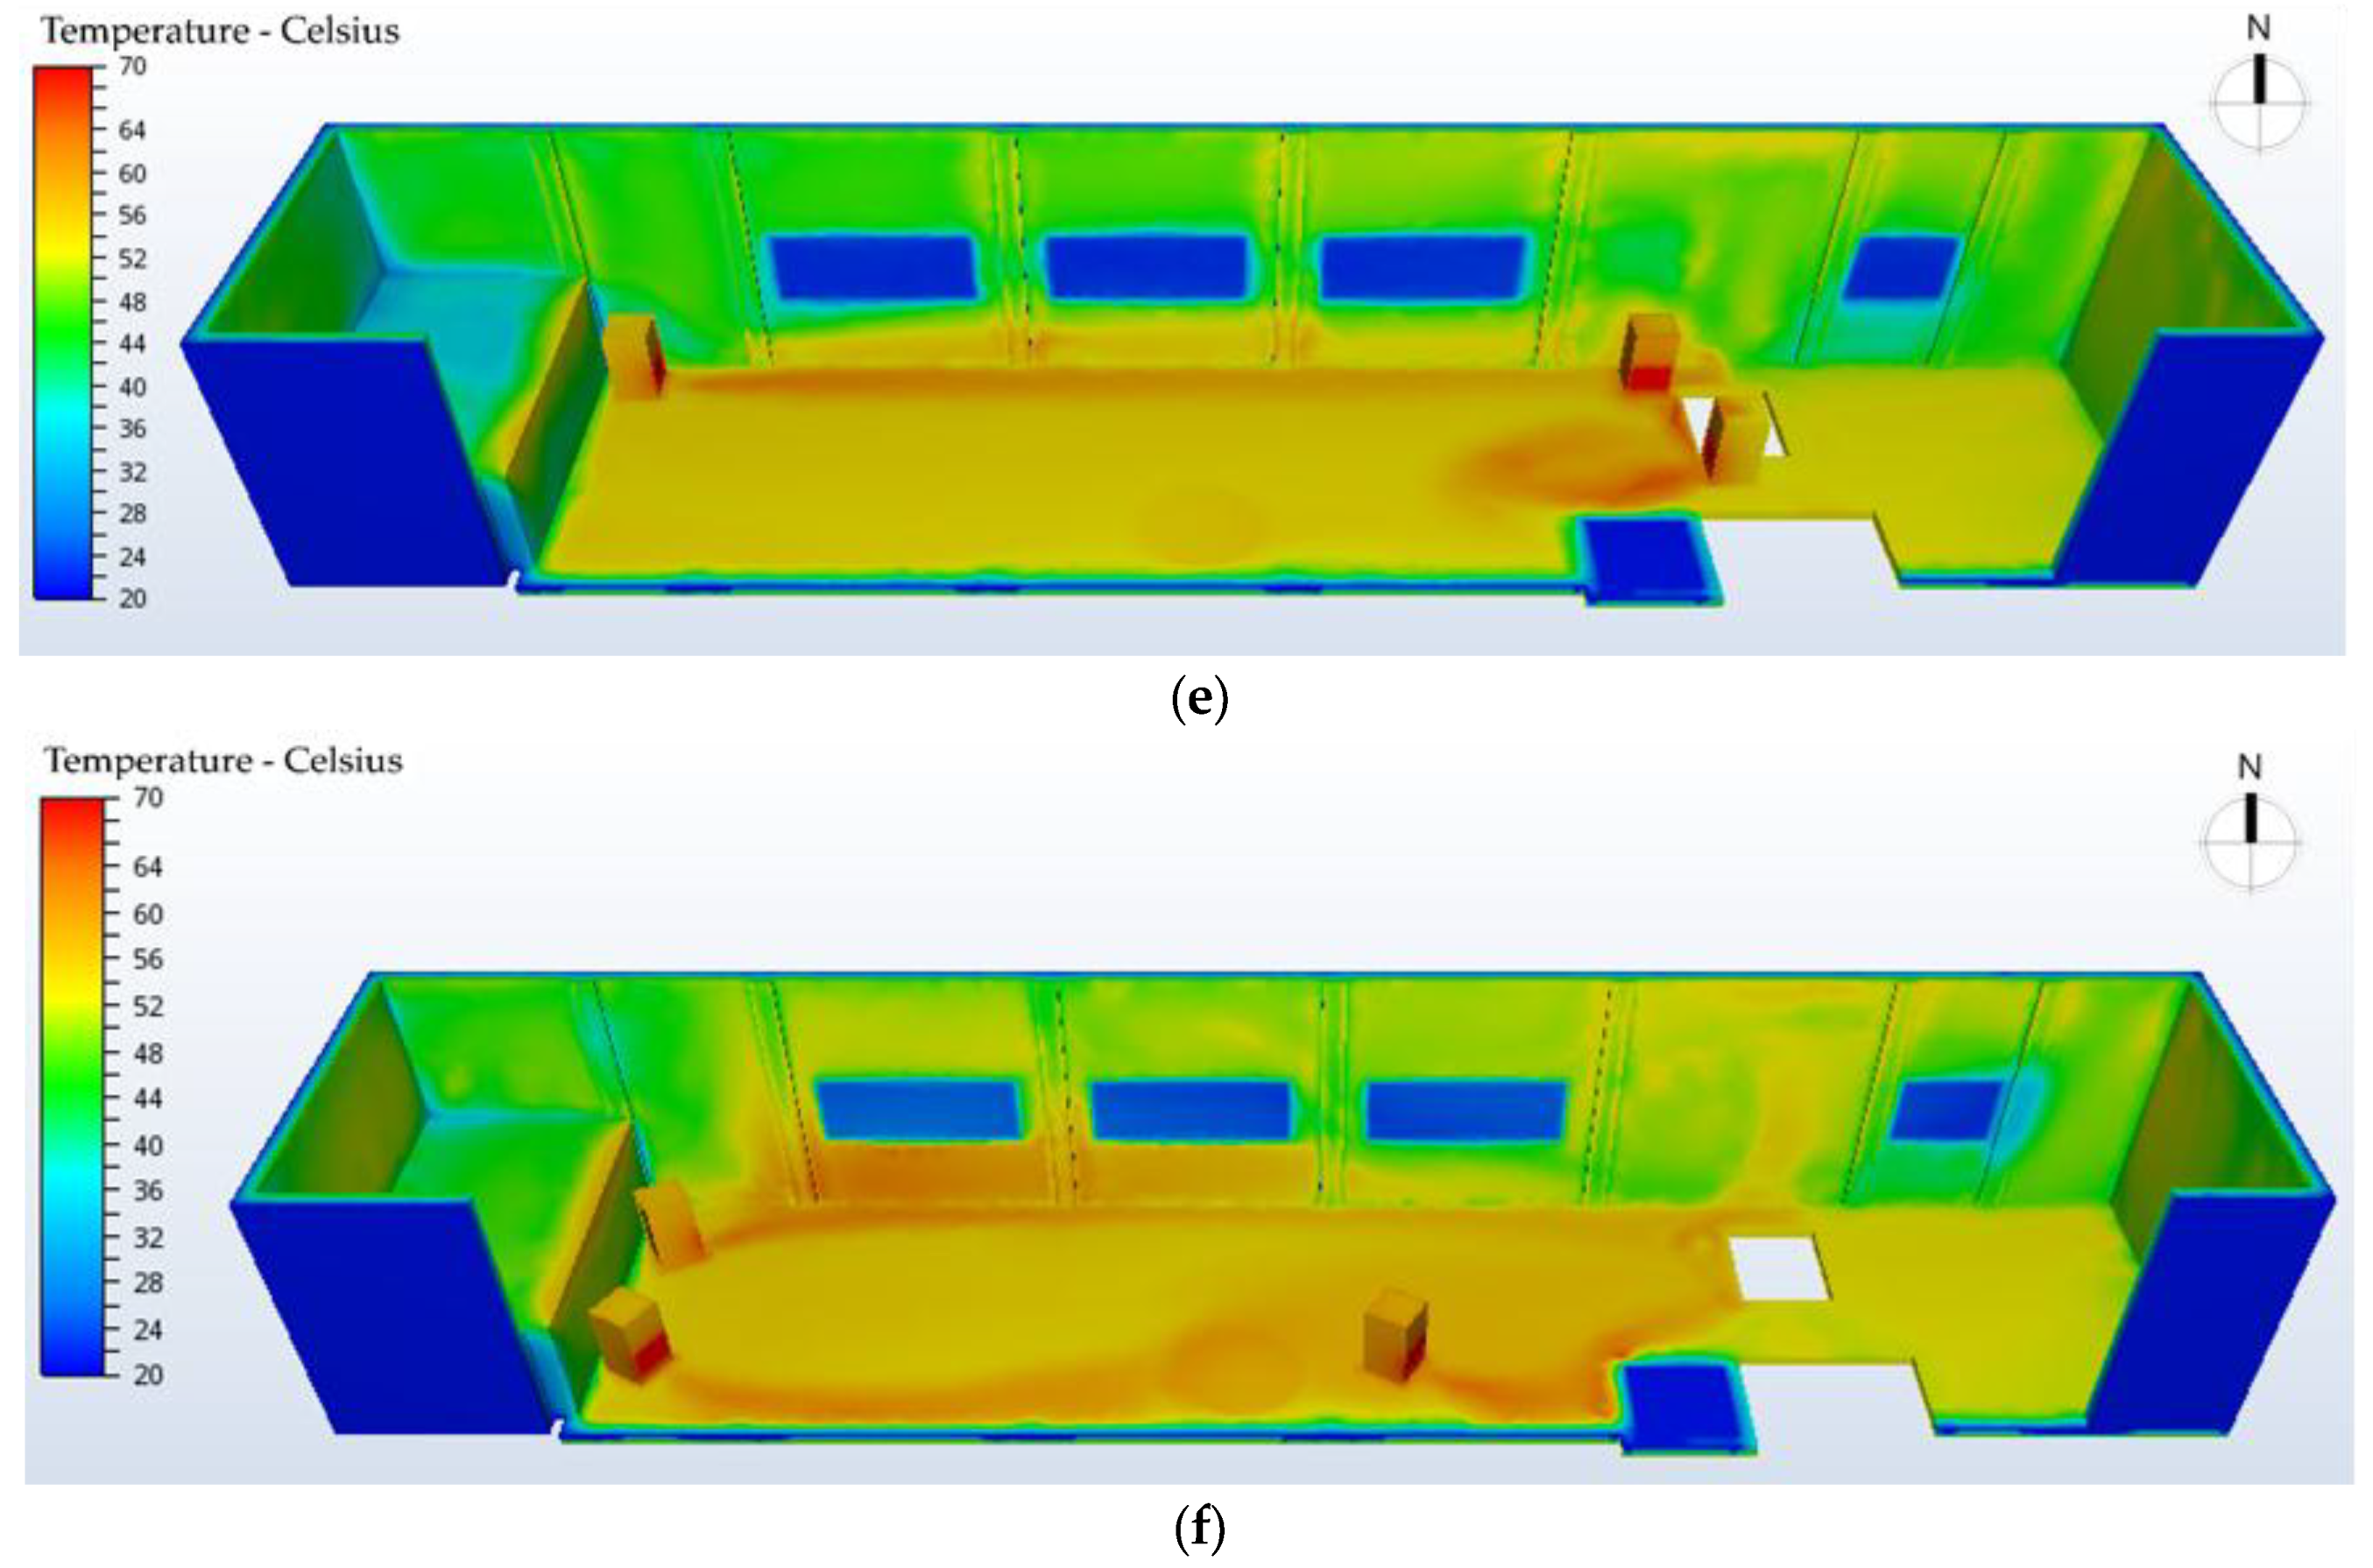
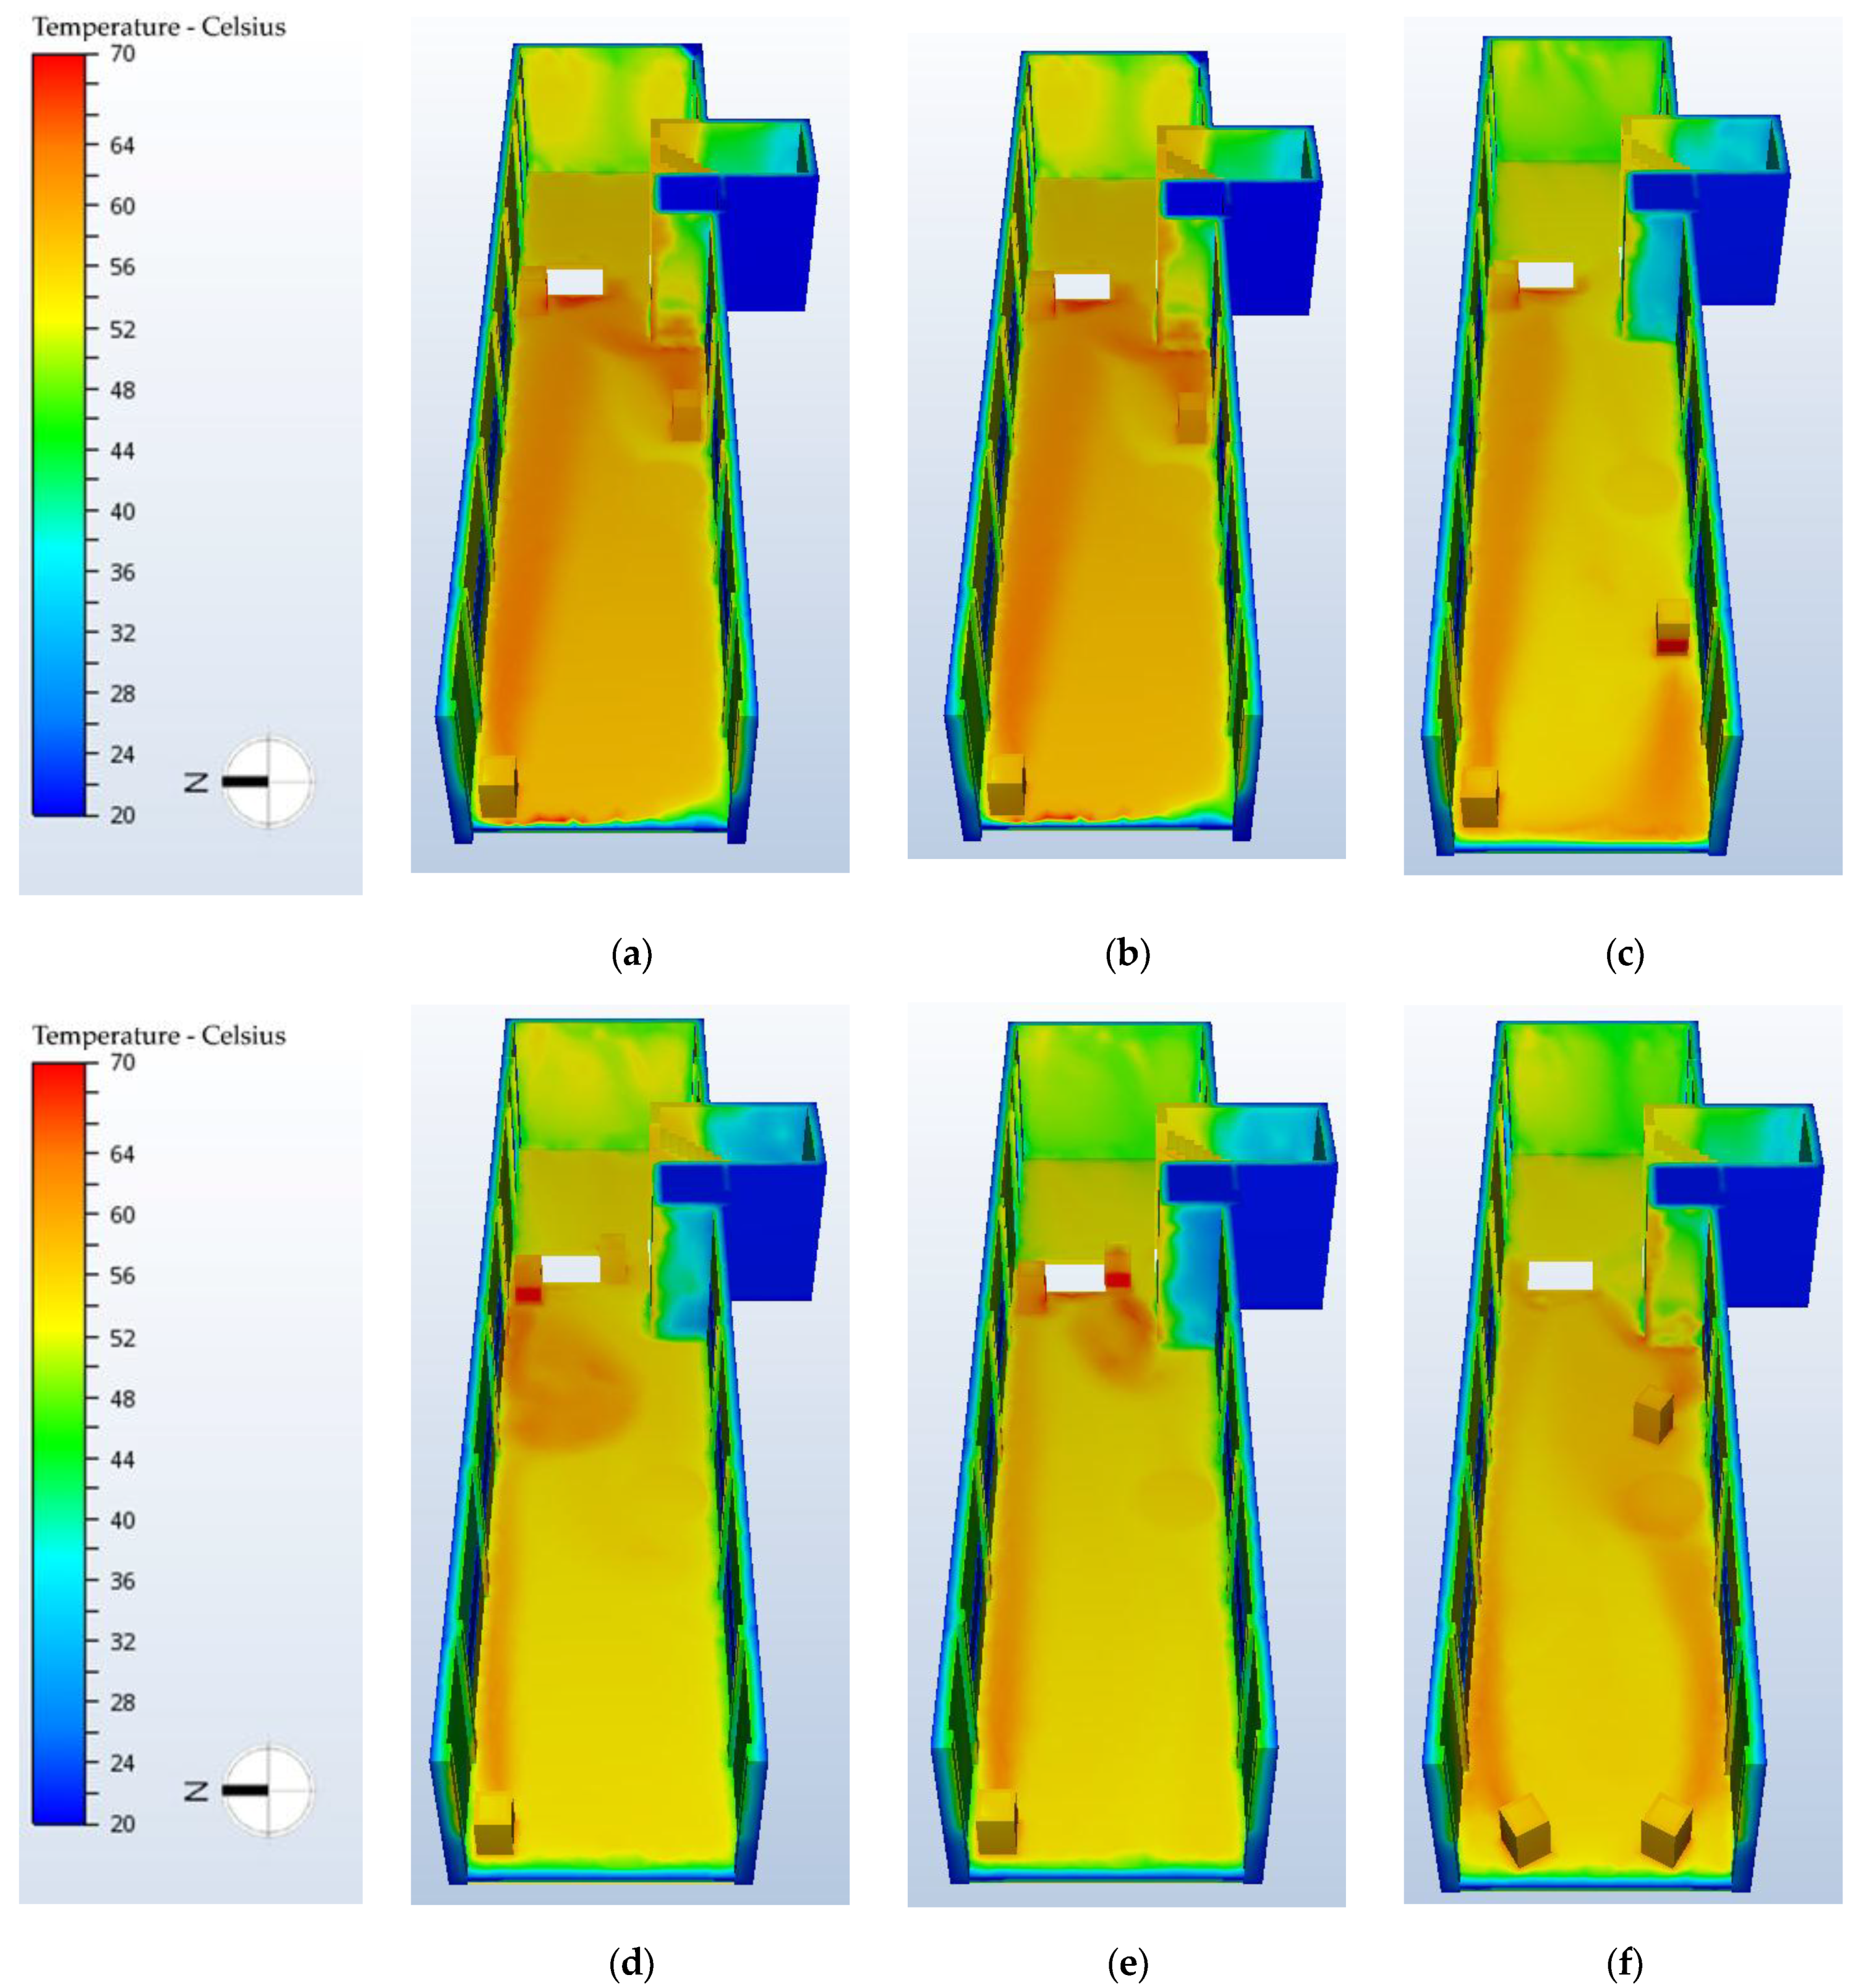
2.3. Interventions Aimed at Improving the Treatment Effectiveness

CFD simulations aimed at improving heat treatment efficacy were performed by modifying the number, power, and position of fan heaters, which typically are empirically chosen by heat treatment operators without specific planning. In this context, the new configurations of the fan heaters were planned within the monitored floor, with the aim of increasing air and surface temperatures of the building components, which were initially below the temperature values lethal to insects. Furthermore, possible fan heaters positions were influenced by space free from equipment sensitive to high temperatures (i.e., it was not possible to locate the fan heaters along the south wall due to the presence of plansifters).
Therefore, the case studies analyzed included the following conditions:
-
a change in the orientation of the fan heaters;
-
a change in the position of the fan heaters; or
-
a combined change in the position and orientation of the fan heaters.
In this study, an increase in the number of fan heaters was not considered, as this would result in increased cost and energy expenditure; changes were thus made considering only the existing fan heaters.
The CFD validated model showed that the coldest surface temperatures (less than 45 °C) were detected at the south and north walls (Table 1 and Table 2), referred to as surfaces C, E, G, I, and M (Figure 3) and 6, 8, 10, 12, 14, and 16 (Figure 4), respectively. The east wall, where it was not possible to introduce corrective actions due to the presence of a mezzanine, was not considered during this study phase.
In order to heat the colder surfaces, five case studies were analysed by applying the changes shown in Figure 5.
Compared to the initial configuration, the fan heaters were translated without rotation in front of some of the coldest walls (configuration (b)), translated in front of some of the coldest walls and rotated by 180° (configuration (c)), rotated by 90° (configuration (d)), rotated by 180° (configuration (e)) or translated in front of some of the coldest walls and rotated by about 30° (configuration (f)).

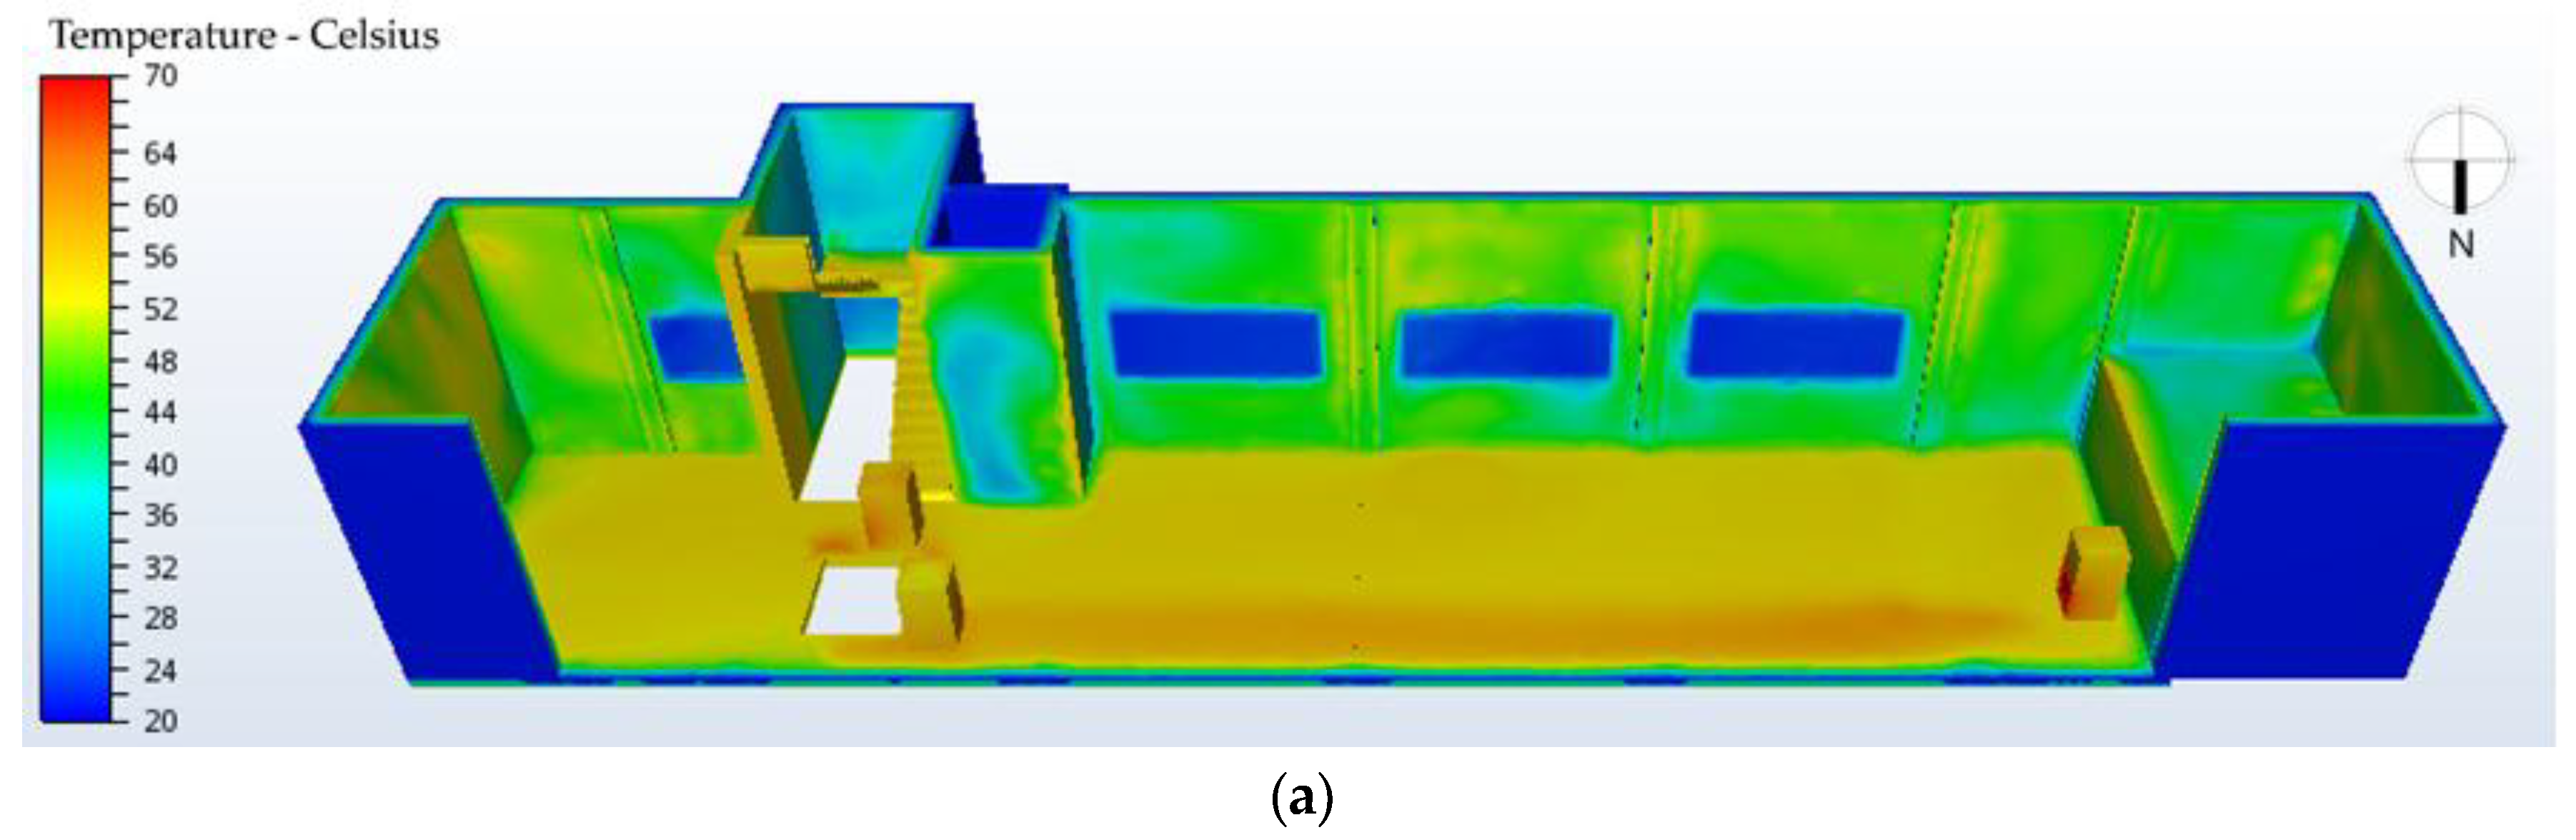
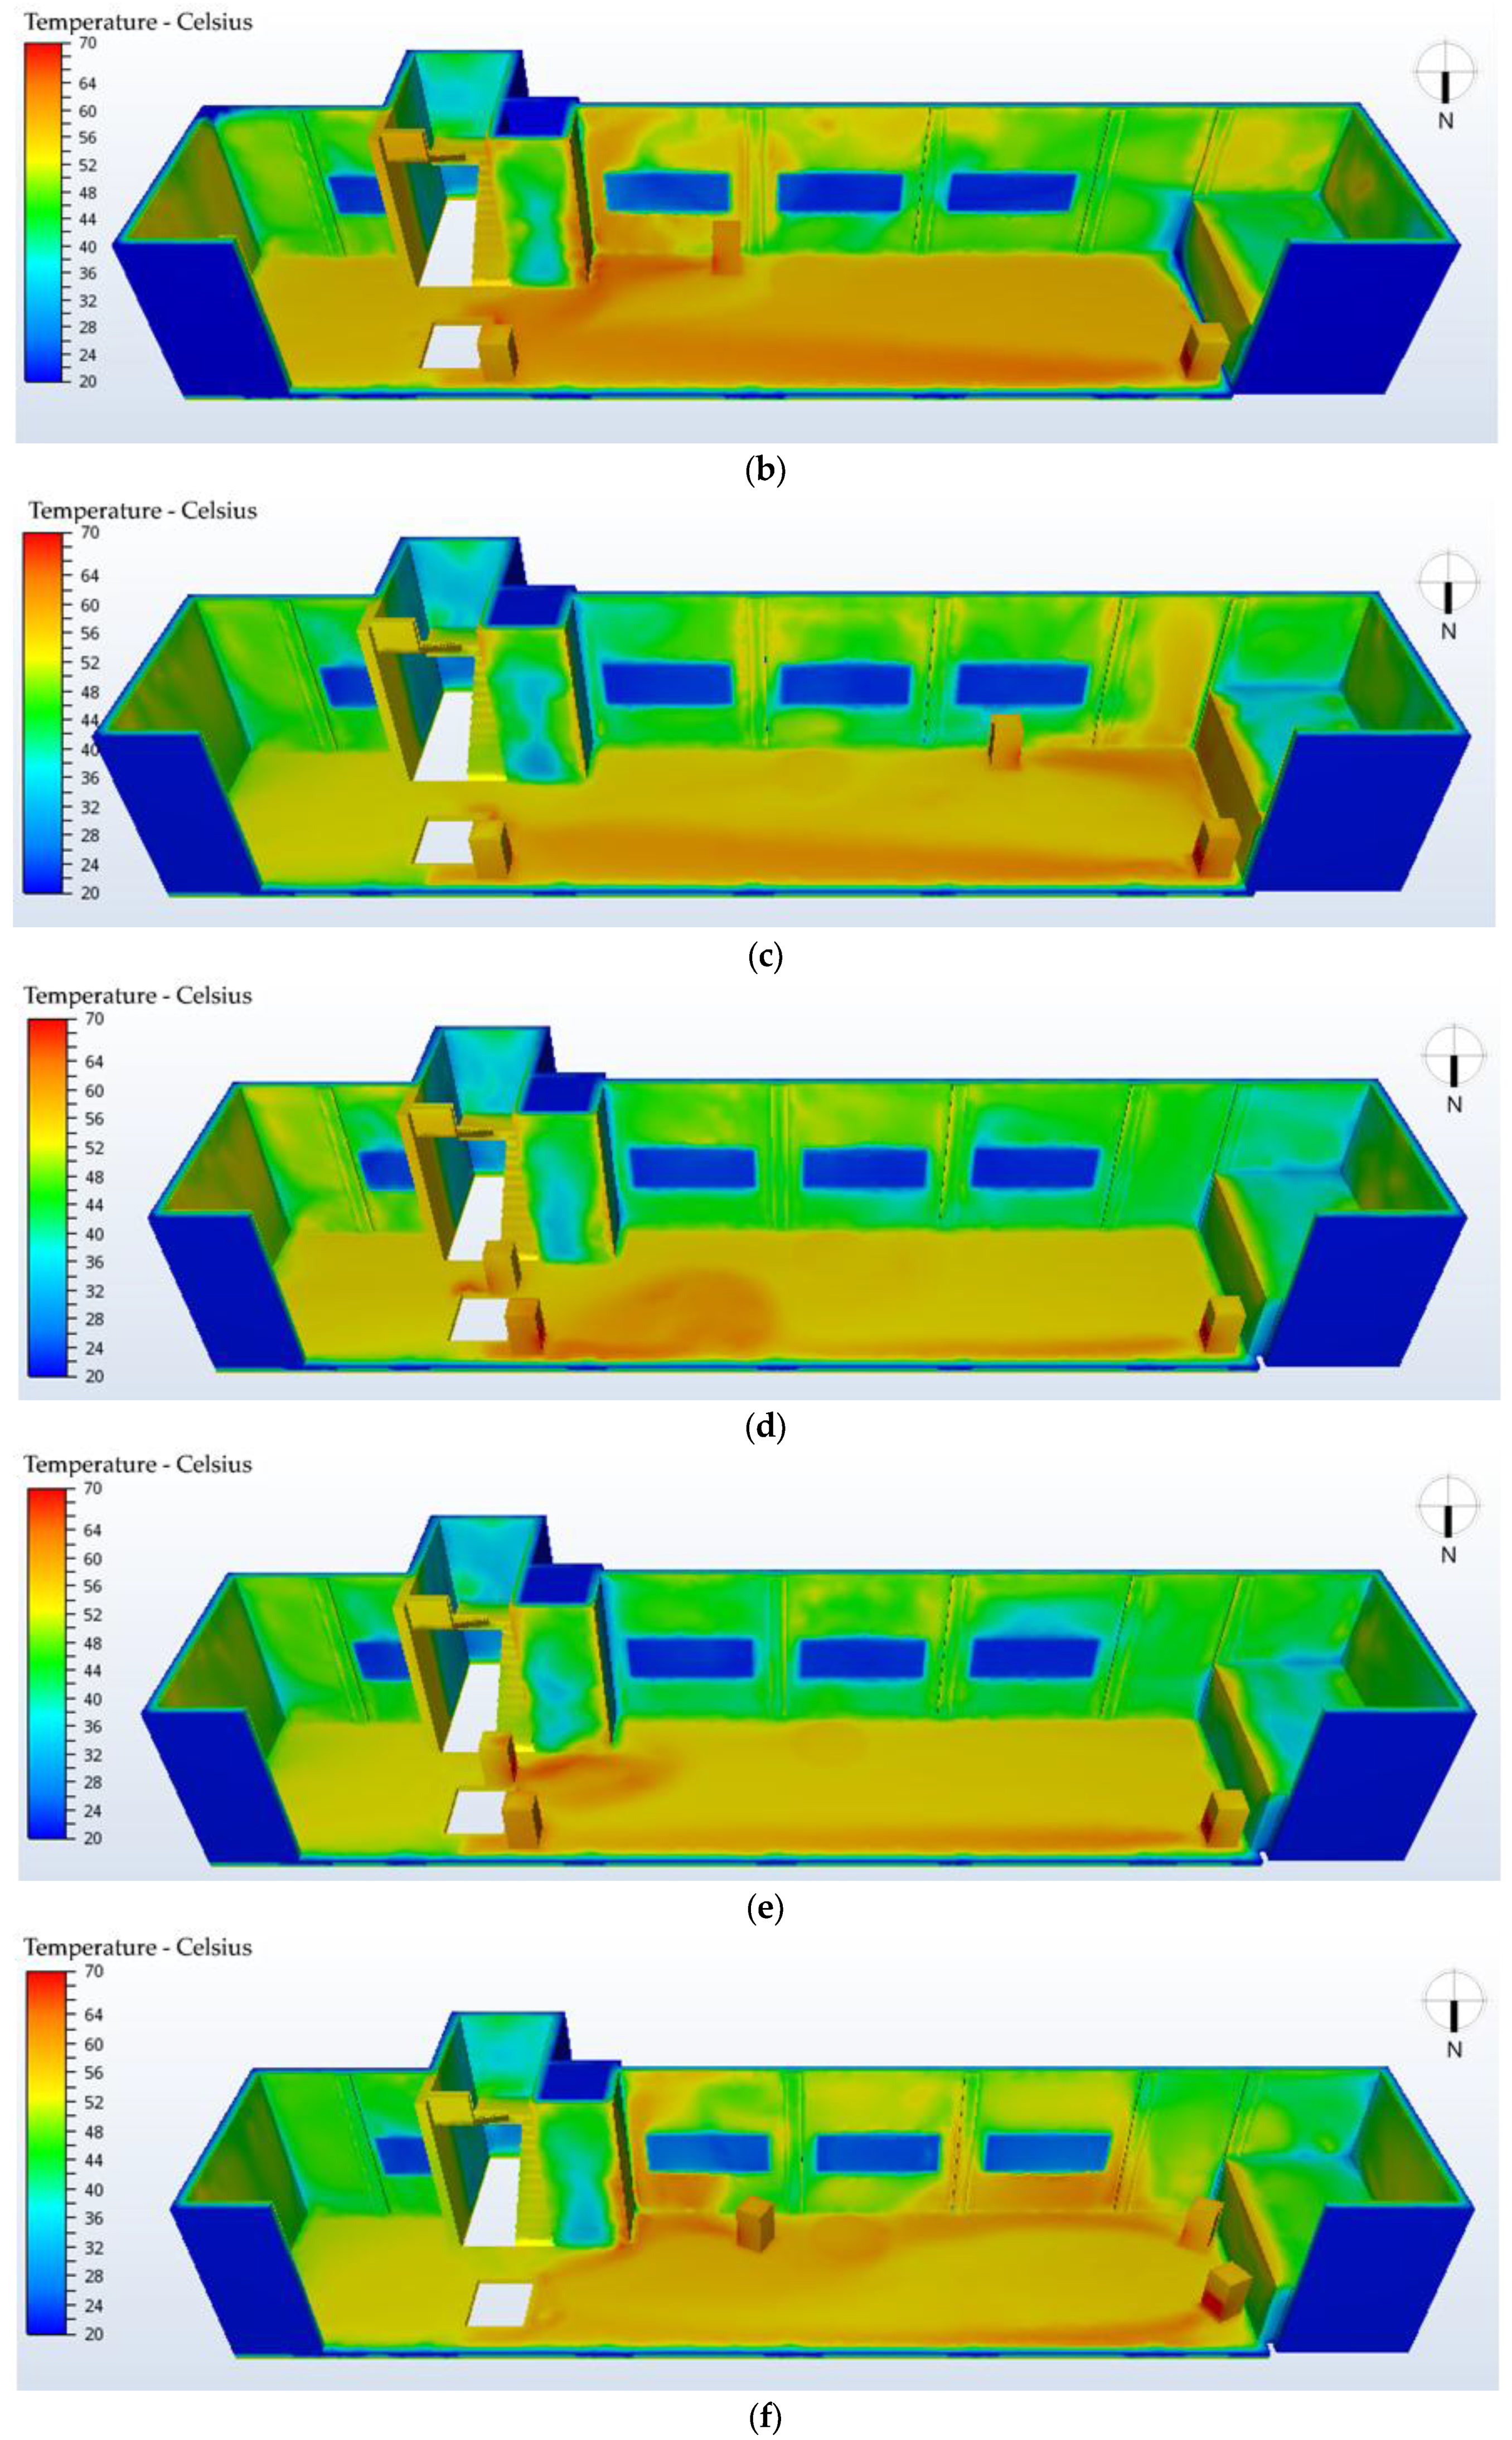
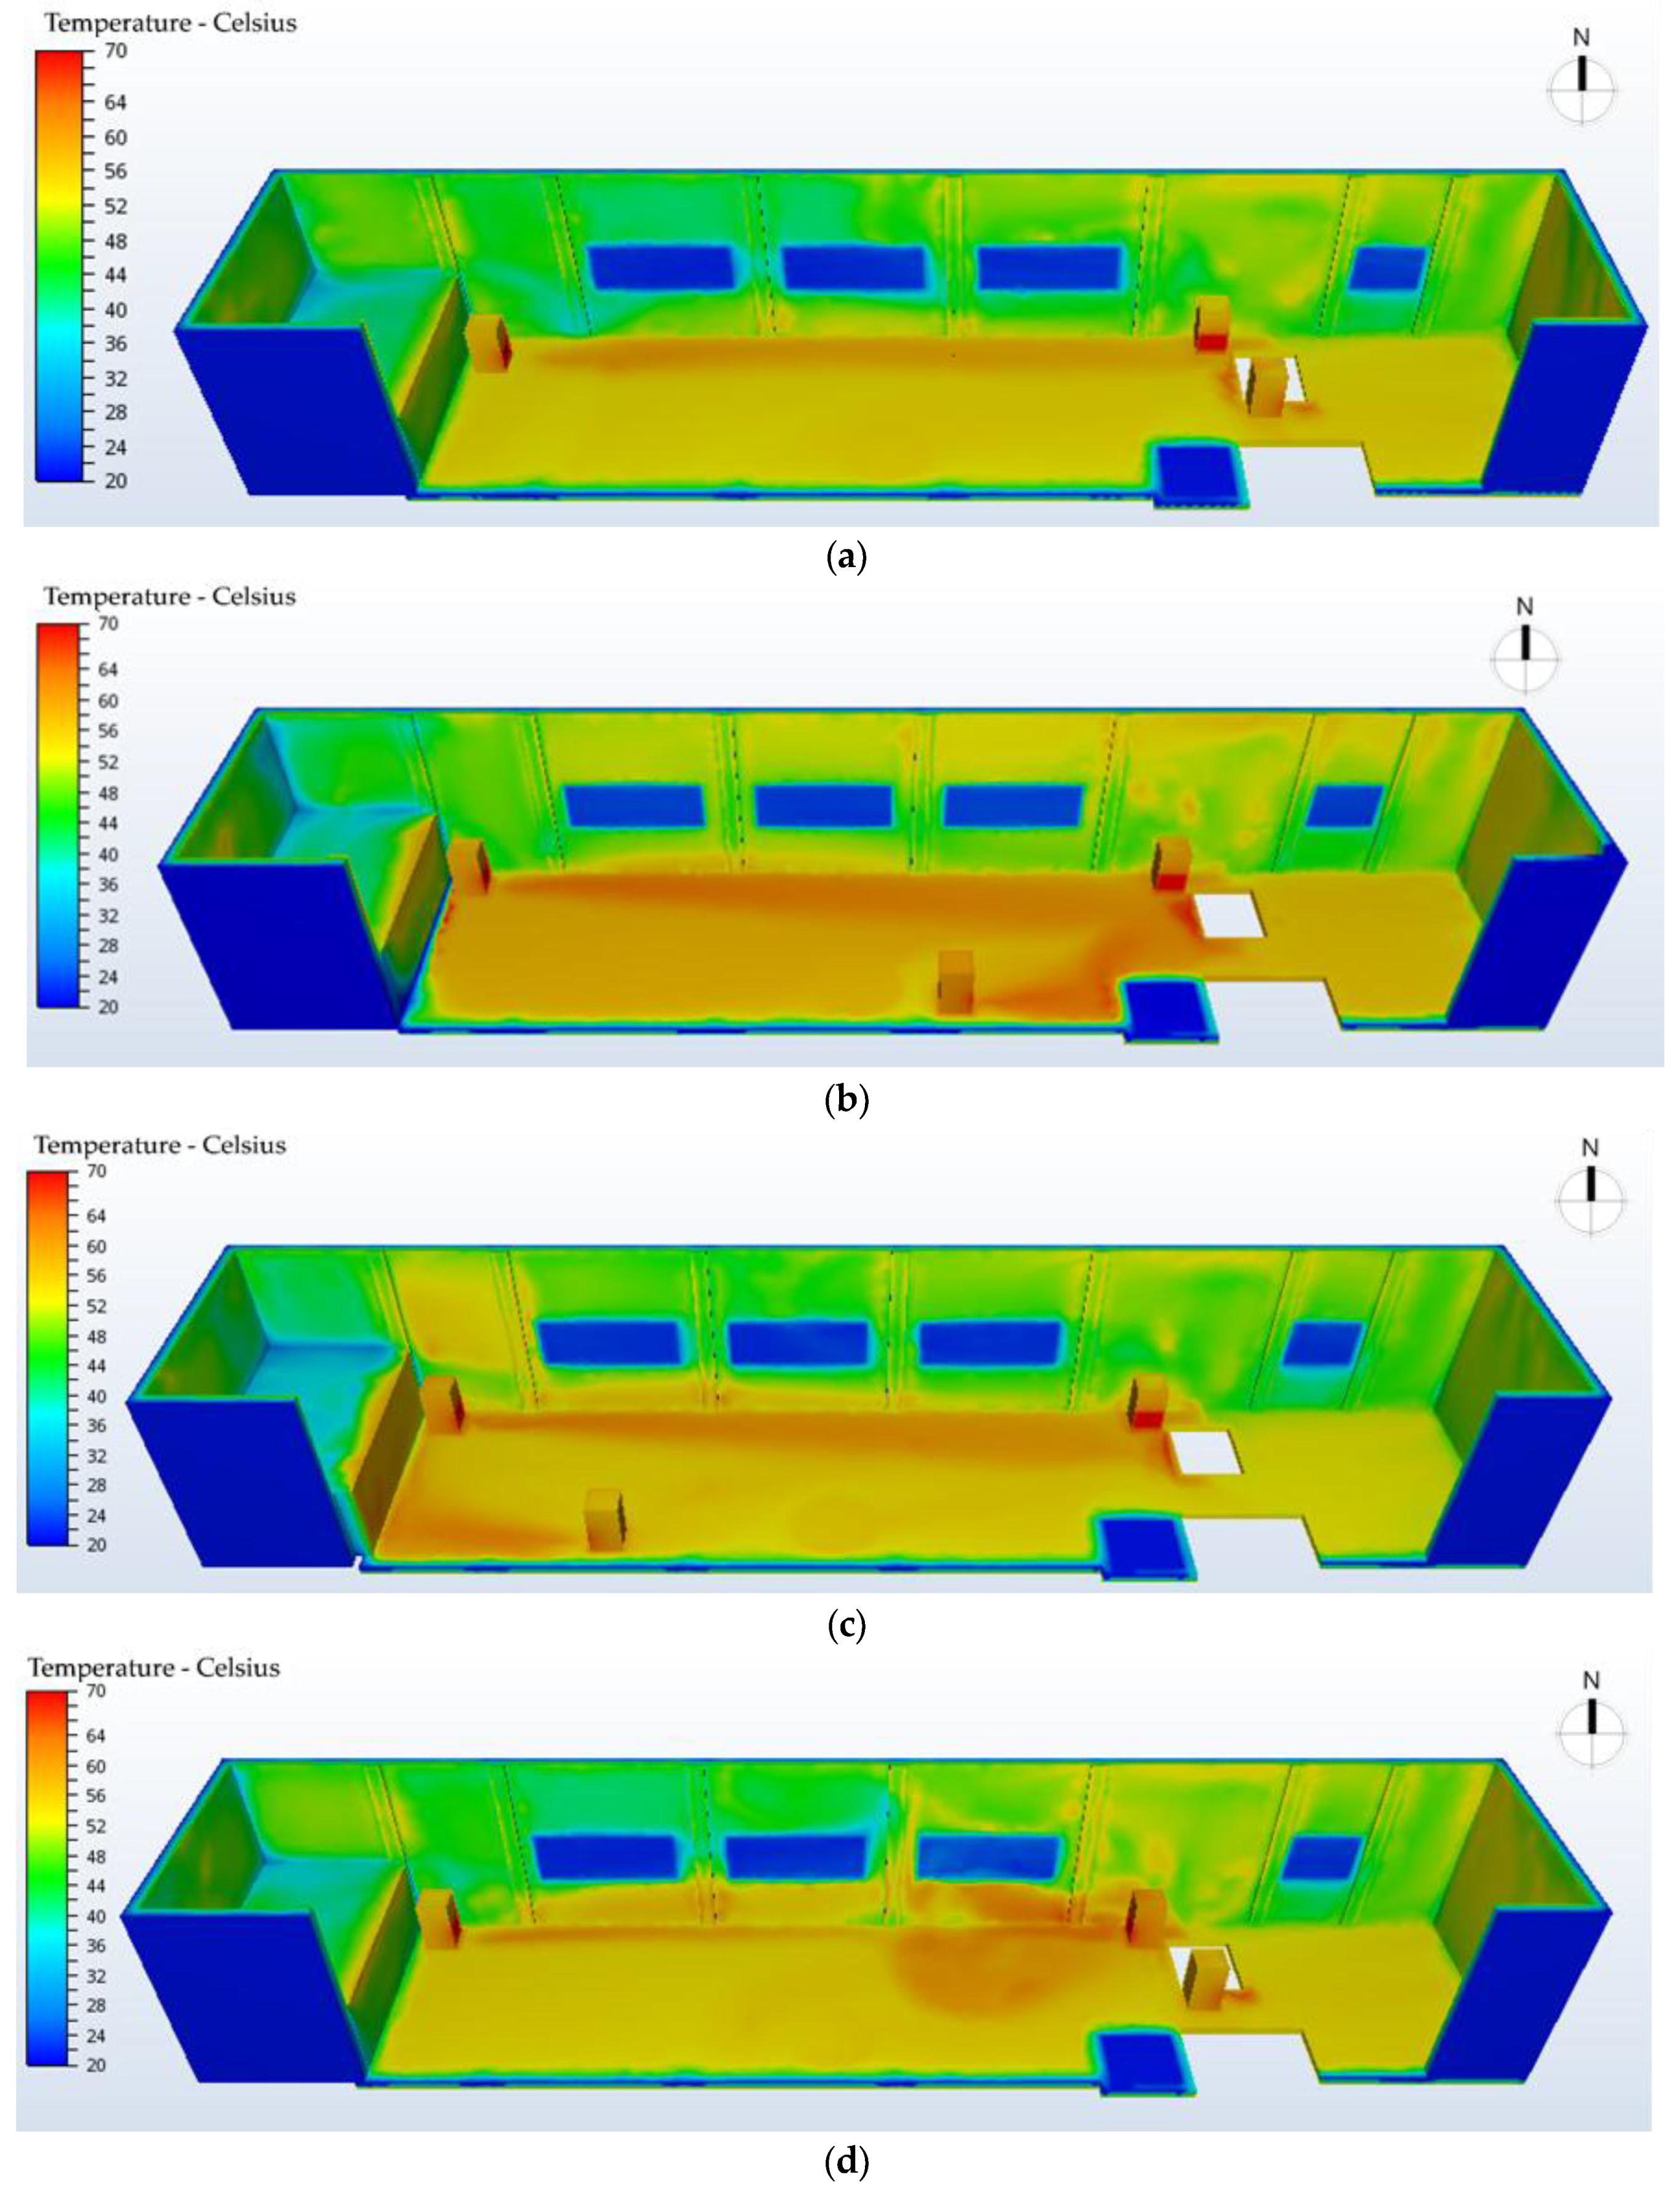
3. Results and Discussion

The results of the simulations obtained by changing positon and/or orientation of the fan heaters compared to the initial configuration are reported in Figure 6 and Figure 7.
By analysing the simulation results, the average surface temperatures—grouped according to material and component—are reported for the five case studies in Table 1 and Table 2.
The values of the west wall surface temperature derived from the CFD model simulations (Figure 8) are reported in Table 3.
In order to find a solution that avoided damage to the machinery, the average surface temperature of the three plansifters—i.e., P1, P2, P3 (Figure 5)—was also simulated for different configurations. The results are reported in Table 4.
The results reported in Table 1, Table 2 and Table 3 make it possible to investigate the effectiveness of the proposed interventions in each wall of the mill.
For the initial configuration of the south wall (a), the average surface temperature reached a value of 45.10 °C, although 57.8% of the walls were at a temperature below 45 °C. Configurations (b) and (c) (which involved the change of position of a fan heater and, in the second case, a rotation by 180°) saw percentage decreases of approximately 33.9% and 41.3%, respectively, of surfaces having temperatures lower than 45 °C. Configurations (d) and (e) (which involved the rotation of a fan heater by 90° and 180°, respectively) saw percentage decreases of approximately 33.9% and 41.1%, respectively, of surfaces having temperatures lower than 45 °C. Configuration (f) (which involved both rotation by about 30° and the change of position of the three fan heaters) saw a percentage decrease of approximately 7.9% of surfaces having temperatures lower than 45 °C.
For the initial configuration of the north wall, the mean surface temperature reached approximately 43.56 °C, although 70% of the walls were at a temperature below 45 °C. Configurations (b) and (c) showed percentage decreases of 60.1% and 69.0%, respectively, of surfaces having temperatures lower than 45 °C. Configurations (d) and (e), in contrast, did not lead to improvements; the percentages of surfaces having temperatures lower than 45 °C were 70.9% and 70%, respectively. Finally, configuration (f) showed a percentage decrease of surfaces having a temperature lower than 45 °C of 13.3%.
Finally, for the west wall, both the initial configuration and those involving rotations or changes of the position of the fan heaters allowed surfaces to reach temperatures higher than 45 °C in all cases.
Moreover, for the analysed walls with windows, the averages of the surface temperature values were strongly influenced by window surface temperatures as shown in Table 1 and Table 2 (columns w). The averages of the surface temperature values obtained in walls that were not affected by the position and location of fan heaters have been compared in order to estimate the influence of windows. Thus, for the initial configuration, the average surface temperatures of the surfaces M and O (located in the south wall) and the surfaces 1 and 3 (located in the North wall) were compared. The windows reduced the average surface temperature of the walls by 5.0 °C and 4.1 °C, respectively.
In the initial configuration, the average surface temperature of the windows was approximately 23.59 °C. Therefore, a possible suitable solution for improving the heat treatment could be a thermal shielding of openings to reduce heat loss through windows.
The analysis and comparison of the average surface temperatures of the plansifters in configurations (b) to (f) with those of the initial configuration (Table 4), showed that the temperature values were mostly similar for all configurations except for plansifter 3; thus, the interventions carried out to improve the heat treatment generally did not affect plansifter thermal conditions. The maximum variations of the average temperatures of the surfaces of the plansifters were:
-
2.69 ° C (corresponding to configuration (d)) in the case of the plansifter 1;
-
1.50 ° C (corresponding to configuration (c)) in the case of the plansifter 2;
-
6.29 ° C (corresponding to configuration (d)) in the case of the plansifter 3.
The significant increase in surface temperatures detected for plansifter 3 in configuration (d) led us to conclude that configuration (d) is not recommended.
Interventions concerning the building envelope may involve:
-
changes in the wall structure—e.g., by changing layers of the external wall—paying particular attention to the selection of appropriate insulation and its related thickness [2,25,26,27];
-
window shields by using thermal sheets to reflect thermal radiation produced by fan heaters.
The study of these interventions to improve thermal performance during heat treatment is the object of further studies, which are currently in development.

4. Conclusions

During thermal treatment carried out in a flour mill located in eastern Sicily (Italy) for insect pest control, air temperatures and air velocities in the indoor environment were recorded using data-loggers and portable anemometers, and integrated with respect to values related to the external environment. Then, a CFD model, which provided a realistic representation of the inner conditions of the mill and the thermal behaviour of the building, was validated. The model validation showed that surface and air temperatures were much lower than the lethal level required for effective heat treatment of insect pests. Therefore, the aim of this study was the optimisation of the heat treatment procedure, by changing the configuration of fan heaters to obtain a more efficient distribution of indoor temperature values, or by improving the thermal performance of the building envelope through suitable building interventions.
The aim of this research study was fulfilled by performing CFD simulations of changes in the position and/or the rotation of the fan heaters used for the heat treatment, in order to obtain a better configuration without increasing their number. These simulations showed that the percentage of wall surfaces that have temperature values lower than those required for the efficacy of heat treatment could be considerably reduced—by up to 56.7%—by changing the configuration of the fan heaters.
This result is of significant importance in view of optimising the heat treatment procedure and producing guidelines and suitable decision support systems for specialised operators of the sector.
In this study, the optimization of the heat treatment effectiveness was evaluated in terms of insects’ mortality. In new research work, heat treatment optimization from the technical and economic points of view could be investigated.

Author Contributions

Data curation, F.V. and N.T.; Funding acquisition, S.M.C.P.; Methodology, F.V.; Supervision, S.M.C.P.; Visualization, P.L.; Writing—original draft, N.T.; Writing—review & editing, F.V. and S.M.C.P.

Funding

This research was funded by University of Catania: UPB: 5A722192121 (Piano per la ricerca 2016-2018—progr. n.5 “Innovazioni attraverso applicazioni ICT nel settore delle Costruzioni Rurali, della Pianificazione del Territorio Agro-forestale e della Meccanizzazione della Difesa Fitosanitaria”).

Conflicts of Interest

The authors declare no conflict of interest.

References

  1. Campolo, O.; Verdone, M.; Laudani, F.; Malacrinò, A.; Chiera, E.; Palmeri, V. Response of fours stored products insects to a structural heat treatment in a flour mill. J. Stored Prod. Res. 2013, 54, 54–58. [Google Scholar] [CrossRef]
  2. Porto, S.M.C.; Valenti, F.; Bella, S.; Russo, A.; Cascone, G.; Arcidiacono, C. Improving the effectiveness of heat treatment for insect pest control in flour mills by thermal simulations. Biosyst. Eng. 2017, 164, 189–199. [Google Scholar] [CrossRef]
  3. Fleurat-Lessard, F. Stored-Grain Pest Management. In Encyclopedia of Food Grain, 2nd ed.; Wrigley, C., Corke, H., Seetharaman, K., Faubion, J., Eds.; National Center for Appropriate Technology: Butte, MT, USA, 2016; Volume 4, pp. 126–139. ISBN 9780123947864. [Google Scholar]
  4. Tilley, D.R.; Mark, E.C.; Arthur, F.H. Heat treatment for disinfestation of empty grain storage bins. J. Stored Prod. Res. 2007, 43, 221–228. [Google Scholar] [CrossRef]
  5. Evans, D.E.; Dermott, T. Dosage-mortality relationships for Rhyzopertha Dominica (F.) (Coleoptera: Bostrychidae) exposed to heat in a fluidized bed. J. Stored Prod. Res. 1981, 17, 53–64. [Google Scholar] [CrossRef]
  6. Fields, P.G. The control of stored-product insects and mites with extreme temperatures. J. Stored Prod. Res. 1992, 28, 89–118. [Google Scholar] [CrossRef]
  7. Denlinger, D.L.; Yocum, G.D. Physiology of heat sensitivity. In Insects and Application in Integrated Pest Management; Hallman, G.J., Denlinger, D.L., Eds.; Springer: Boulder, CO, USA, 1998; pp. 7–54. ISBN 0813389909. [Google Scholar]
  8. Mahroof, R.; Subramanyam, B.; Eustace, D. Temperature and relative humidity profiles during heat treatment of mills and its efficacy against Tribolium castaneum (Herbst) life stages. J. Stored Prod. Res. 2003, 39, 555–569. [Google Scholar] [CrossRef]
  9. Belda, C.; Ribes-Dasi, M.; Riudavets, J. Improving pest management in pet food mills using accurate monitoring and spatial analysis. J. Stored Prod. Res. 2011, 47, 385–392. [Google Scholar] [CrossRef]
  10. Blocken, B.; Stathopoulos, T.; Carmeliet, J.; Hensen, J.L.M. Application of computational fluid dynamics in building performance simulation for the outdoor environment: An overview. J. Build. Perform. Simul. 2011, 4, 157–184. [Google Scholar] [CrossRef]
  11. Gilham, S.; Deaves, D.M.; Woodburn, P. Mitigation of dense gas releases within buildings: Validation of CFD modelling. J. Hazard. Mater. 2000, 71, 193–218. [Google Scholar] [CrossRef]
  12. Cheong, K.W.D.; Djunaedy, E.; Poh, T.K.; Tham, K.W.; Sekhar, S.C.; Wong, N.H.; Ullah, M.B. Measurements and computations of contaminant’s distribution in an office environment. Build. Environ. 2003, 38, 135–145. [Google Scholar] [CrossRef]
  13. Sekhar, S.; Willem, H. Impact of airflow profile on indoor air quality—A tropical study. Build. Environ. 2004, 39, 255–266. [Google Scholar] [CrossRef]
  14. Chayaprasert, W.; Maier, D.E.; Ileleji, K.E.; Murthy, J.Y. Development and validation of Computational Fluid Dynamics models for precision structural fumigation. J. Stored Prod. Res. 2008, 44, 11–20. [Google Scholar] [CrossRef]
  15. Chayaprasert, W.; Maier, D.E.; Ileleji, K.E.; Murthy, J.Y. Effects of weather conditions on sulfuryl fluoride and methyl bromide leakage during structural fumigation in a flour mill. J. Stored Prod. Res. 2009, 45, 1–9. [Google Scholar] [CrossRef]
  16. Chayaprasert, W.; Maier, D.E.; Subramanyam, B.; Hartzer, M. Gas leakage and distribution characteristics of methyl bromide and sulfuryl fluoride during fumigations in a pilot flour mill. J. Stored Prod. Res. 2012, 50, 1–7. [Google Scholar] [CrossRef] [Green Version]
  17. Mistriotis, A.; Castellano, S. Airflow through net covered tunnel structures at high wind speeds. Biosyst. Eng. 2012, 113, 308–317. [Google Scholar] [CrossRef]
  18. Valenti, F.; Porto, S.M.C.; Tomasello, N.; Arcidiacono, C. Enhancing heat Treatment Efficacy for Insect Pest Control: A Case Study of a CFD Application to Improve the Design and Structure of a Flour Mill. Buildings 2018, 8, 48. [Google Scholar] [CrossRef]
  19. Chinnici, G.; Pecorino, B. Le attività di trasformazione nella filiera del grano duro in Sicilia. In Consorzio Gian Pietro Ballatore per la Ricerca su Specifici Settori della Filiera Cerealicola, Osservatorio della Filiera Cerealicola Siciliana—Terzo Rapporto—La Filiera del Grano duro in Sicilia; CORERAS: Palermo, Italy, 2007; pp. 63–95. [Google Scholar]
  20. Dowdy, A.K.; Fields, P.G.; Marcotte, M. Structural Pest Control: The Use of an Enhanced Diatomaceous Earth Product Combined with Heat Treatment for the Control of Insect Pests in Food Processing Facilities. Leadership in the Development of Methyl Bromide Alternatives, (Agriculture and Agri-Food Canada and the United States Department of Agriculture: Environmental Bureau). 1997. Available online: http://home.cc.umanitoba.ca/fieldspg/fields/heatde.htm (accessed on 13 March 2017).
  21. Dowdy, A.K. Mortality of red flour beetle, Tribolium castaneum (Coleoptera: Tenebrionidae) exposed to high temperature and diatomaceous earth combinations. J. Stored Prod. Res. 1999, 35, 175–182. [Google Scholar] [CrossRef]
  22. Dowdy, A.K.; Fields, P.G. Heat combined with diatomaceous earth to control the confused flour beetle (Coleoptera: Tenebrionidae) in a flour mill. J. Stored Prod. Res. 2002, 38, 11–22. [Google Scholar] [CrossRef]
  23. Porto, S.M.C.; Valenti, F.; Cascone, G.; Arcidiacono, C. Thermal insulation of a flour mill to improve effectiveness of the heat treatment for insect pest control. Agric. Eng. Int. CIGR J. 2015, 2015, 94–104. [Google Scholar]
  24. Norton, T.; Sun, D.; Grant, J.; Fallon, R.; Dodd, V. Applications of computational fluid dynamics (CFD) in the modelling and design of ventilation systems in the agricultural industry: A review. Bioresour. Technol. 2007, 98, 2386–2414. [Google Scholar] [CrossRef] [PubMed]
  25. Barreca, F.; Fichera, C.R. Wall panels of Arundo donax L. for environmentally sustainable agriculture buildings: Thermal performance evaluation. J. Food Agric. Environ. 2013, 11, 1353–1357. [Google Scholar]
  26. Barreca, F.; Fichera, C.R. Thermal insulating characteristics of cork agglomerate panels in sustainable food buildings. In Proceedings of the 7th International Conference on Information and Communication Technologies in Agriculture, Food, and Environment (HAICTA 2015), Kavala, Greece, 17–20 September 2015; Volume 1498, pp. 358–366. [Google Scholar]
  27. Conti, L.; Barbari, M.; Monti, M. Steady-state thermal properties of rectangular straw-bales (RSB) for building. Buildings 2016, 6, 1–13. [Google Scholar] [CrossRef]
Figure 1. Floor plan of the monitored second floor during the heat treatment.
Buildings 08 00132 g001
Figure 2. Flow diagram of the proposed method.
Buildings 08 00132 g002
Figure 3. South wall surfaces identification within the CFD validated model.
Buildings 08 00132 g003
Figure 4. North wall surfaces identification within the CFD validated model.
Buildings 08 00132 g004
Figure 5. (a) Initial configuration, (bf) changes in the position/orientation of the fan heaters. P1, P2 and P3 are plansifters.
Buildings 08 00132 g005
Figure 6. Perspective view (without showing machinery) of the south wall. (a) Initial configuration, (bf) changes in the position/orientation of the fan heaters.
Buildings 08 00132 g006aBuildings 08 00132 g006b
Figure 7. Perspective view (without showing machinery) of the north wall. (a) Initial configuration, (bf) changes in the position/orientation of the fan heaters.
Buildings 08 00132 g007aBuildings 08 00132 g007b
Figure 8. Perspective view (without showing machinery) of the west wall. (a) Initial configuration, (bf) case studies where positions/orientations of the fan heaters were changed.
Buildings 08 00132 g008
Table 1. Simulated temperatures of the south wall for the initial configuration (a) and for the five case studies where positions/orientations of the fan heaters were changed (b–f).
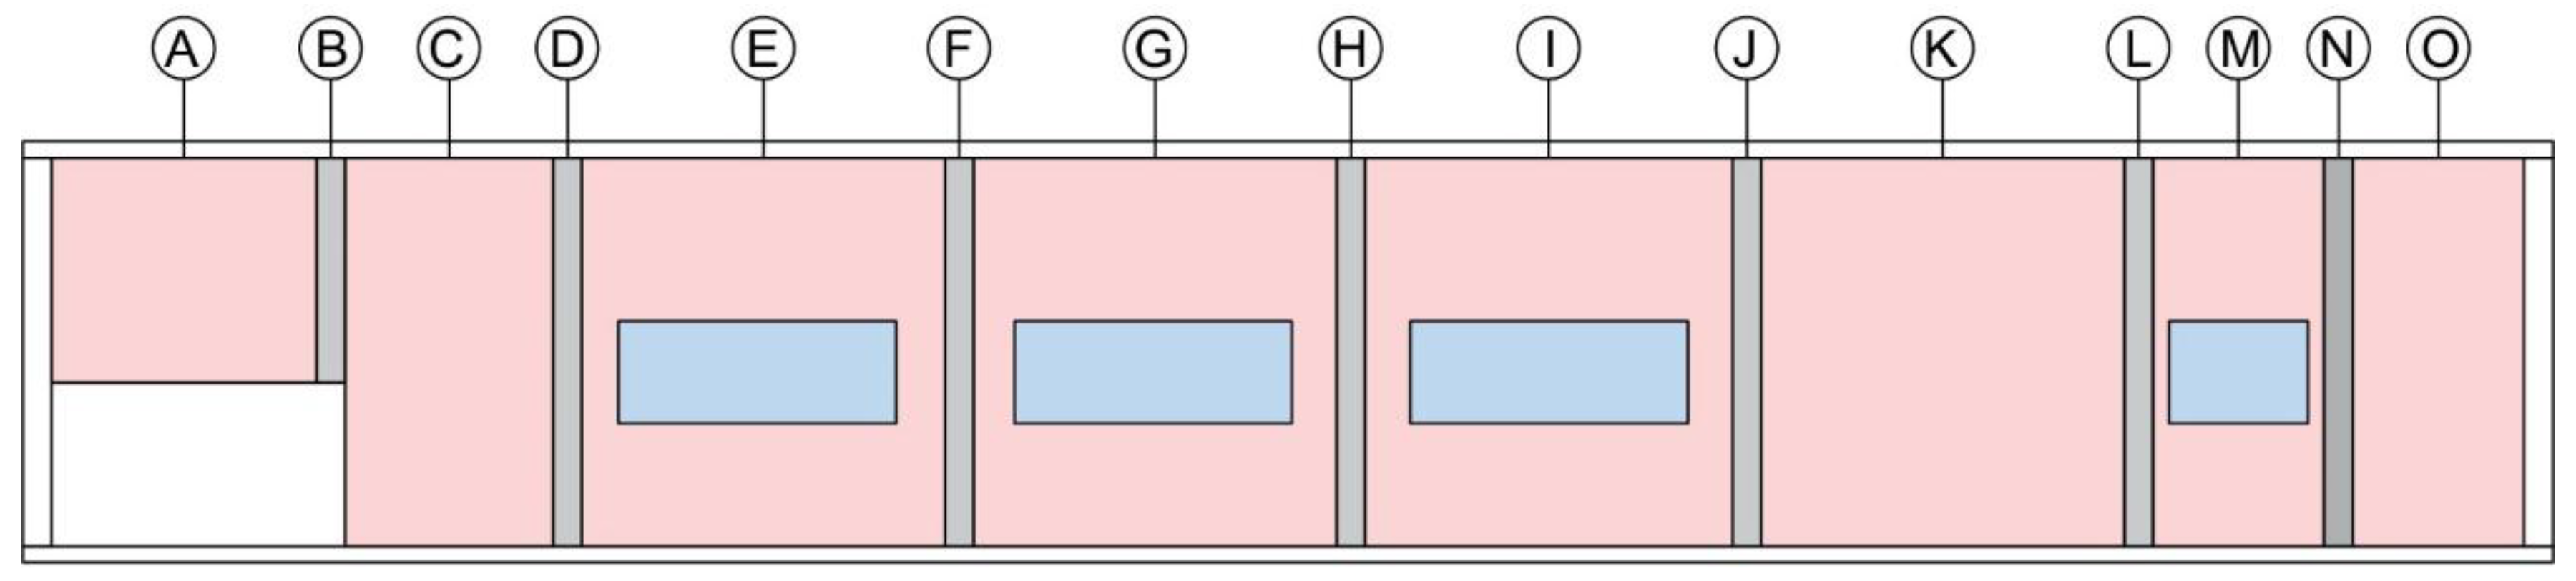
South Wall—Brick Walls
Area (m2)Surface(a) (°C)(w) *
(°C)
(b) (°C)(w) * (°C)(c) (°C)(w) * (°C)(d) (°C)(w) * (°C)(e) (°C)(w) * (°C)(f) (°C)(w) * (°C)
9.11A45.59-45.82-41.77-45.34-42.47-45.01-
12.67C44.30-45.13-51.33-45.60-45.21-49.28-
17.30E40.8222.6644.2724.4145.3223.4843.0022.6843.8922.9249.4426.65
17.65G42.2623.1244.9824.4943.5123.1143.7623.3644.6423.1147.5125.24
17.54I44.1123.4745.0324.9844.7923.3448.7125.3645.3923.3846.0625.17
21.60K48.97-48.39-48.72-51.51-48.74-50.41-
8.04M43.4124.1341.5924.5742.6323.6943.2923.5741.5522.9940.7823.69
10.08O48.41-46.78-47.64-48.61-47.15-46.36-
Average temperature44.73 45.25 45.71 46.23 44.88 46.86
South Wall—Concrete Frame
Area (m2)Surface(a) (°C) (b) (°C) (c) (°C) (d) (°C) (e) (°C) (f) (°C)
1.12B48.78 48.13 49.44 49.37 47.14 45.03
1.92D45.47 48.42 53.26 48.96 47.50 54.46
1.92F47.80 49.38 50.73 49.93 51.37 53.58
1.92H49.92 49.74 51.00 50.75 52.00 50.82
1.92J50.10 49.67 50.60 55.48 51.48 51.44
1.92L49.35 46.75 48.06 49.78 47.35 49.37
1.92N48.72 45.85 47.58 48.55 46.91 42.14
Average temperature48.59 48.28 50.10 50.40 49.11 49.55
* Average surface temperatures of the window.
Table 2. Simulated temperatures of the north wall for the initial configuration (a) and for the five case studies where positions/orientations of the fan heaters were changed (b–f).
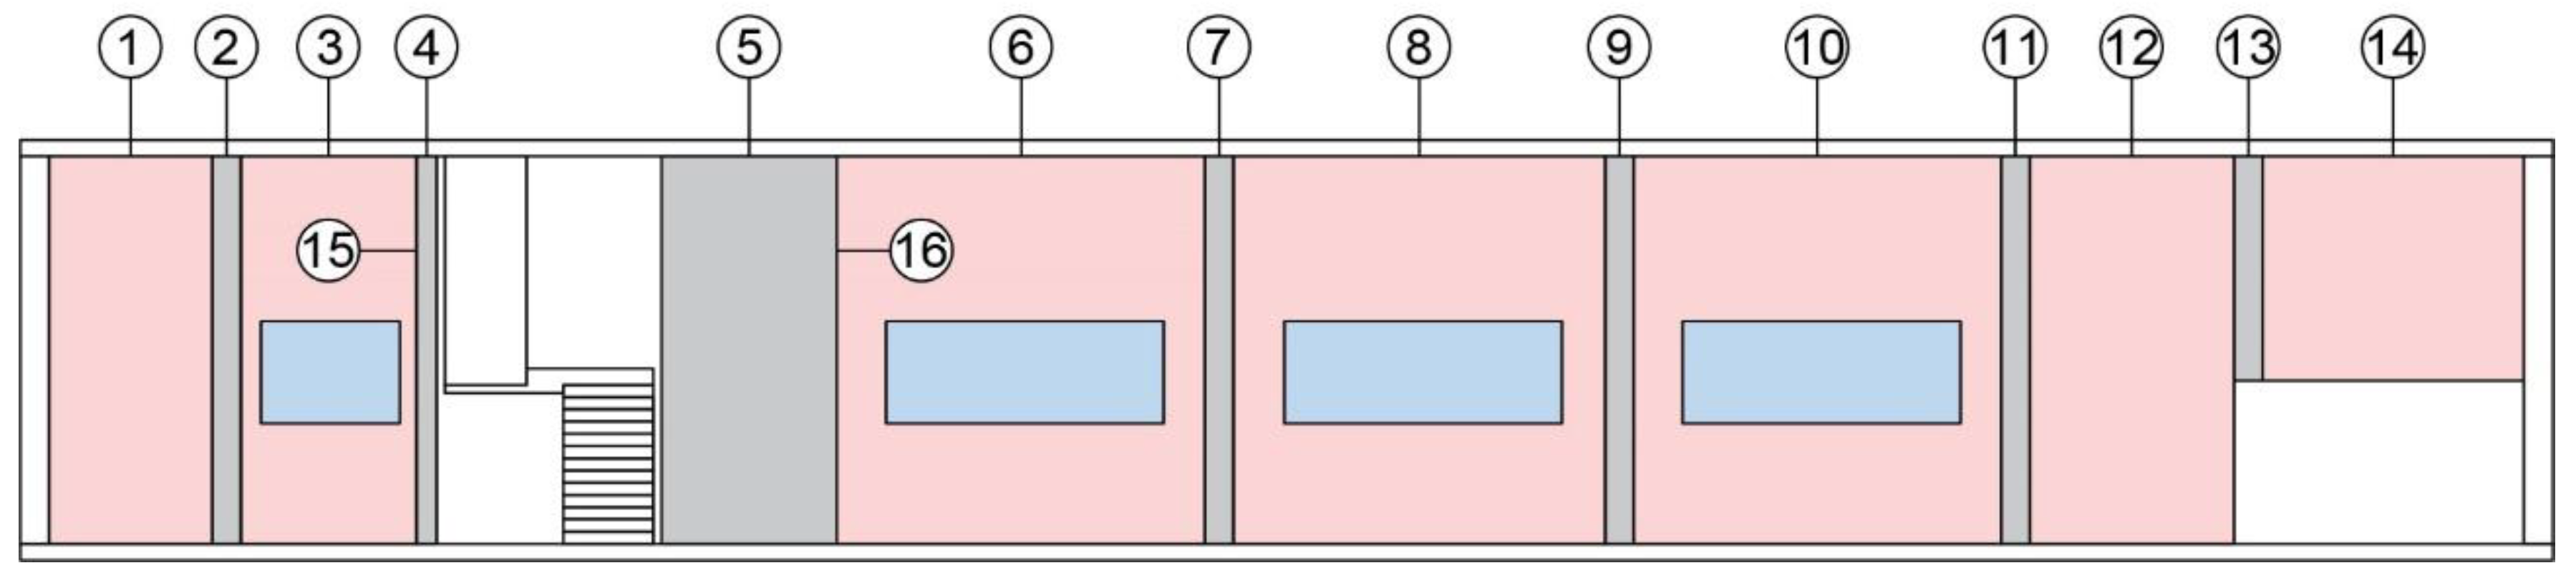
North Wall—Brick Walls
Area (m2)Surface(a) (°C)(w) * (°C)(b) (°C)(w) * (°C)(c) (°C)(w) * (°C)(d) (°C)(w) * (°C)(e) (°C)(w) * (°C)(f) (°C)(w) * (°C)
10.08147.88-43.55-46.29-48.52-46.04-45.02-
8.04343.8125.0840.8424.5342.2624.4543.9924.8242.1424.2840.6524.40
17.88640.0823.2946.2226.0641.0723.4841.0323.4738.6922.6148.0726.84
17.54843.1323.9741.9123.9943.5223.7343.0223.7542.5123.4145.6125.02
17.401041.3322.9840.7723.1543.0023.4640.4122.6540.0922.6048.9026.52
12.101241.15-43.37-52.13-43.90-44.72-48.39-
9.111442.56-42.05-42.87-39.66-43.02-42.85-
Average temperature42.85 42.67 44.45 42.93 42.46 45.64
North Wall—Concrete Frame
Area (m2)Surface(a) (°C) (b) (°C) (c) (°C) (d) (°C) (e) (°C) (f) (°C)
1.92249.13 44.53 47.52 49.99 47.56 45.37
1.44455.15 52.40 52.87 55.60 53.09 51.49
10.8545.08 47.51 44.84 45.79 47.12 46.62
2.16749.02 47.00 50.31 48.28 45.82 48.22
1.92947.17 46.87 46.93 47.43 48.02 52.95
1.921147.31 45.12 51.35 46.51 46.92 52.94
1.121345.84 43.51 46.26 42.70 46.88 47.26
7.201552.65 49.43 50.54 53.01 50.80 48.66
7.921638.95 48.70 39.41 40.00 38.03 49.78
Average temperature47.81 47.23 47.78 47.70 47.14 49.25
* Average surface temperatures of the window.
Table 3. Measured temperatures of the west wall for the initial configuration (a) and for the five case studies where positions/orientations of the fan heaters were changed (b–f).
West Wall—Brick Wall
Area (m2)(a) (°C)(b) (°C)(c) (°C)(d) (°C)(e) (°C)(f) (°C)
27.8449.6347.2748.0449.8647.6847.60
Table 4. Simulated average temperatures at the plansifters for the initial configuration (a) and for the case studies including changes in the position/orientation of the fan heaters (b–f).
Plansifter(a) (°C)(b) (°C)(c) (°C)(d) (°C)(e) (°C)(f) (°C)
P157.8955.9157.8155.2056.6856.61
P256.4756.0057.9756.0356.7757.64
P356.1256.2657.6862.4157.2657.82

