Post-Occupancy Evaluation and IEQ Measurements from 64 Office Buildings: Critical Factors and Thresholds for User Satisfaction on Thermal Quality


Abstract
:1. Introduction
2. Method
- Type of organization: federal offices (n = 33), private sector financial, sales, and marketing companies (n = 31)
- Size of office: small- and medium-sized office (less than 500 m2)
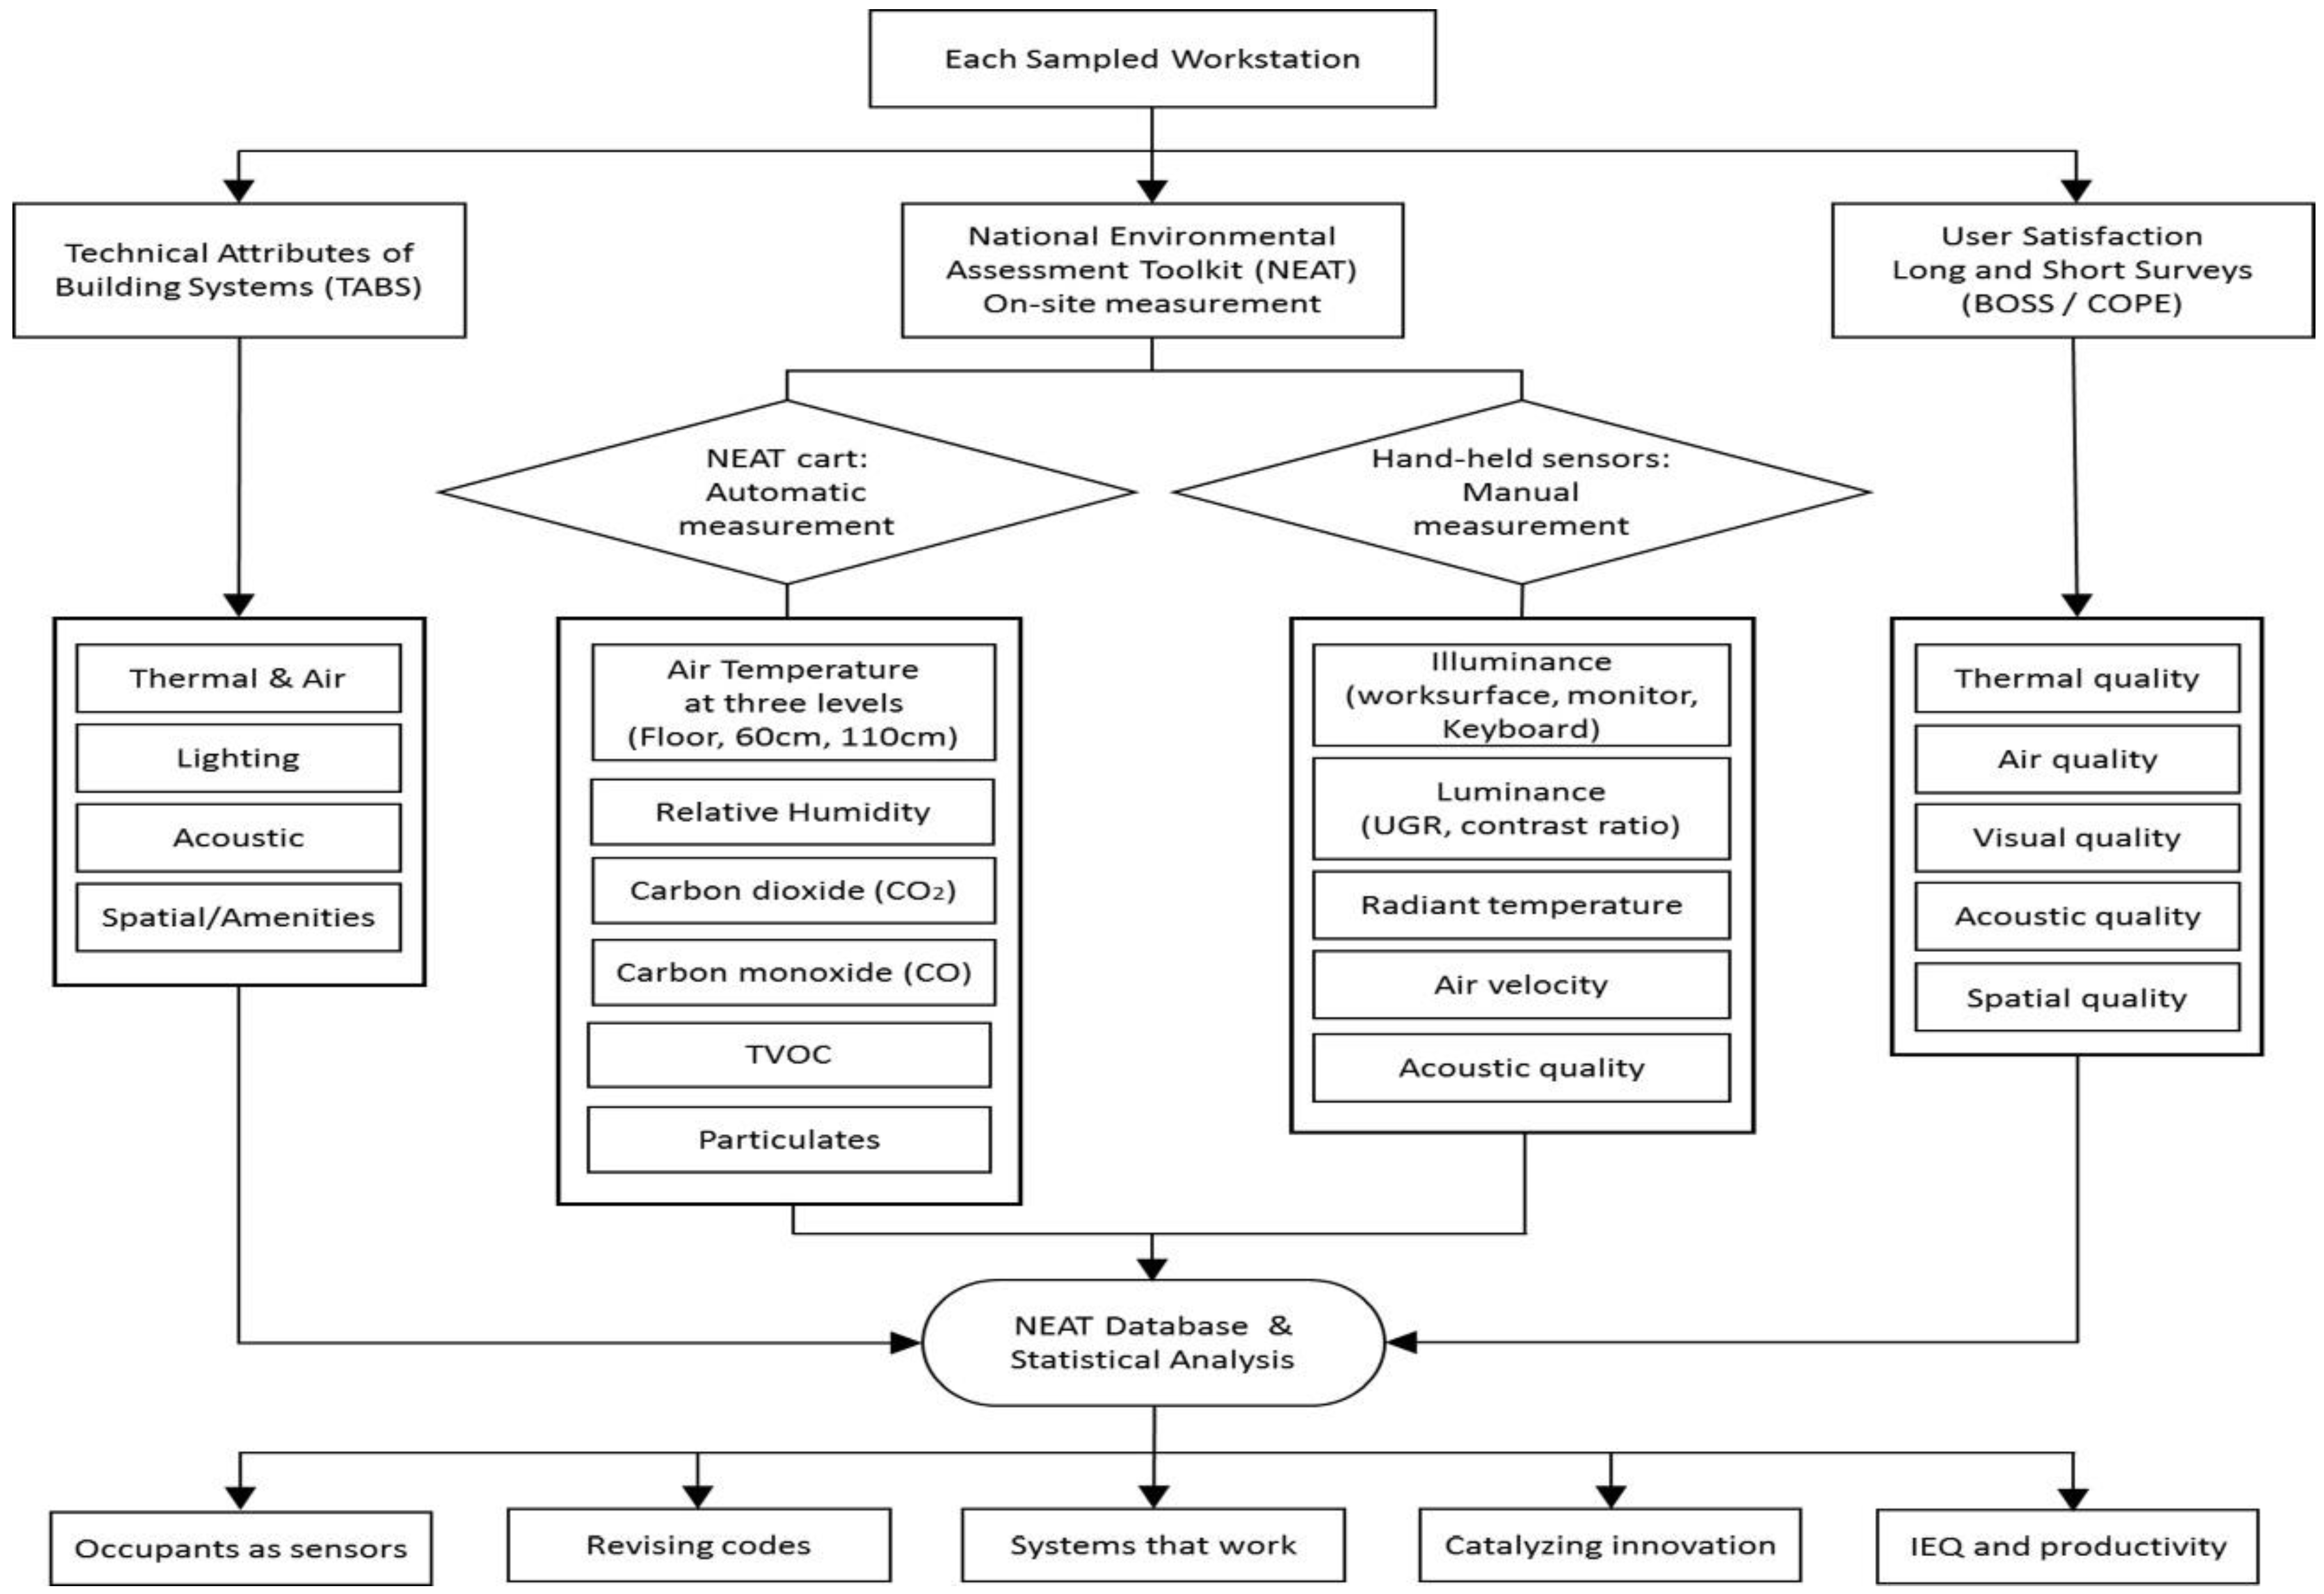
2.1. User Satisfaction Survey
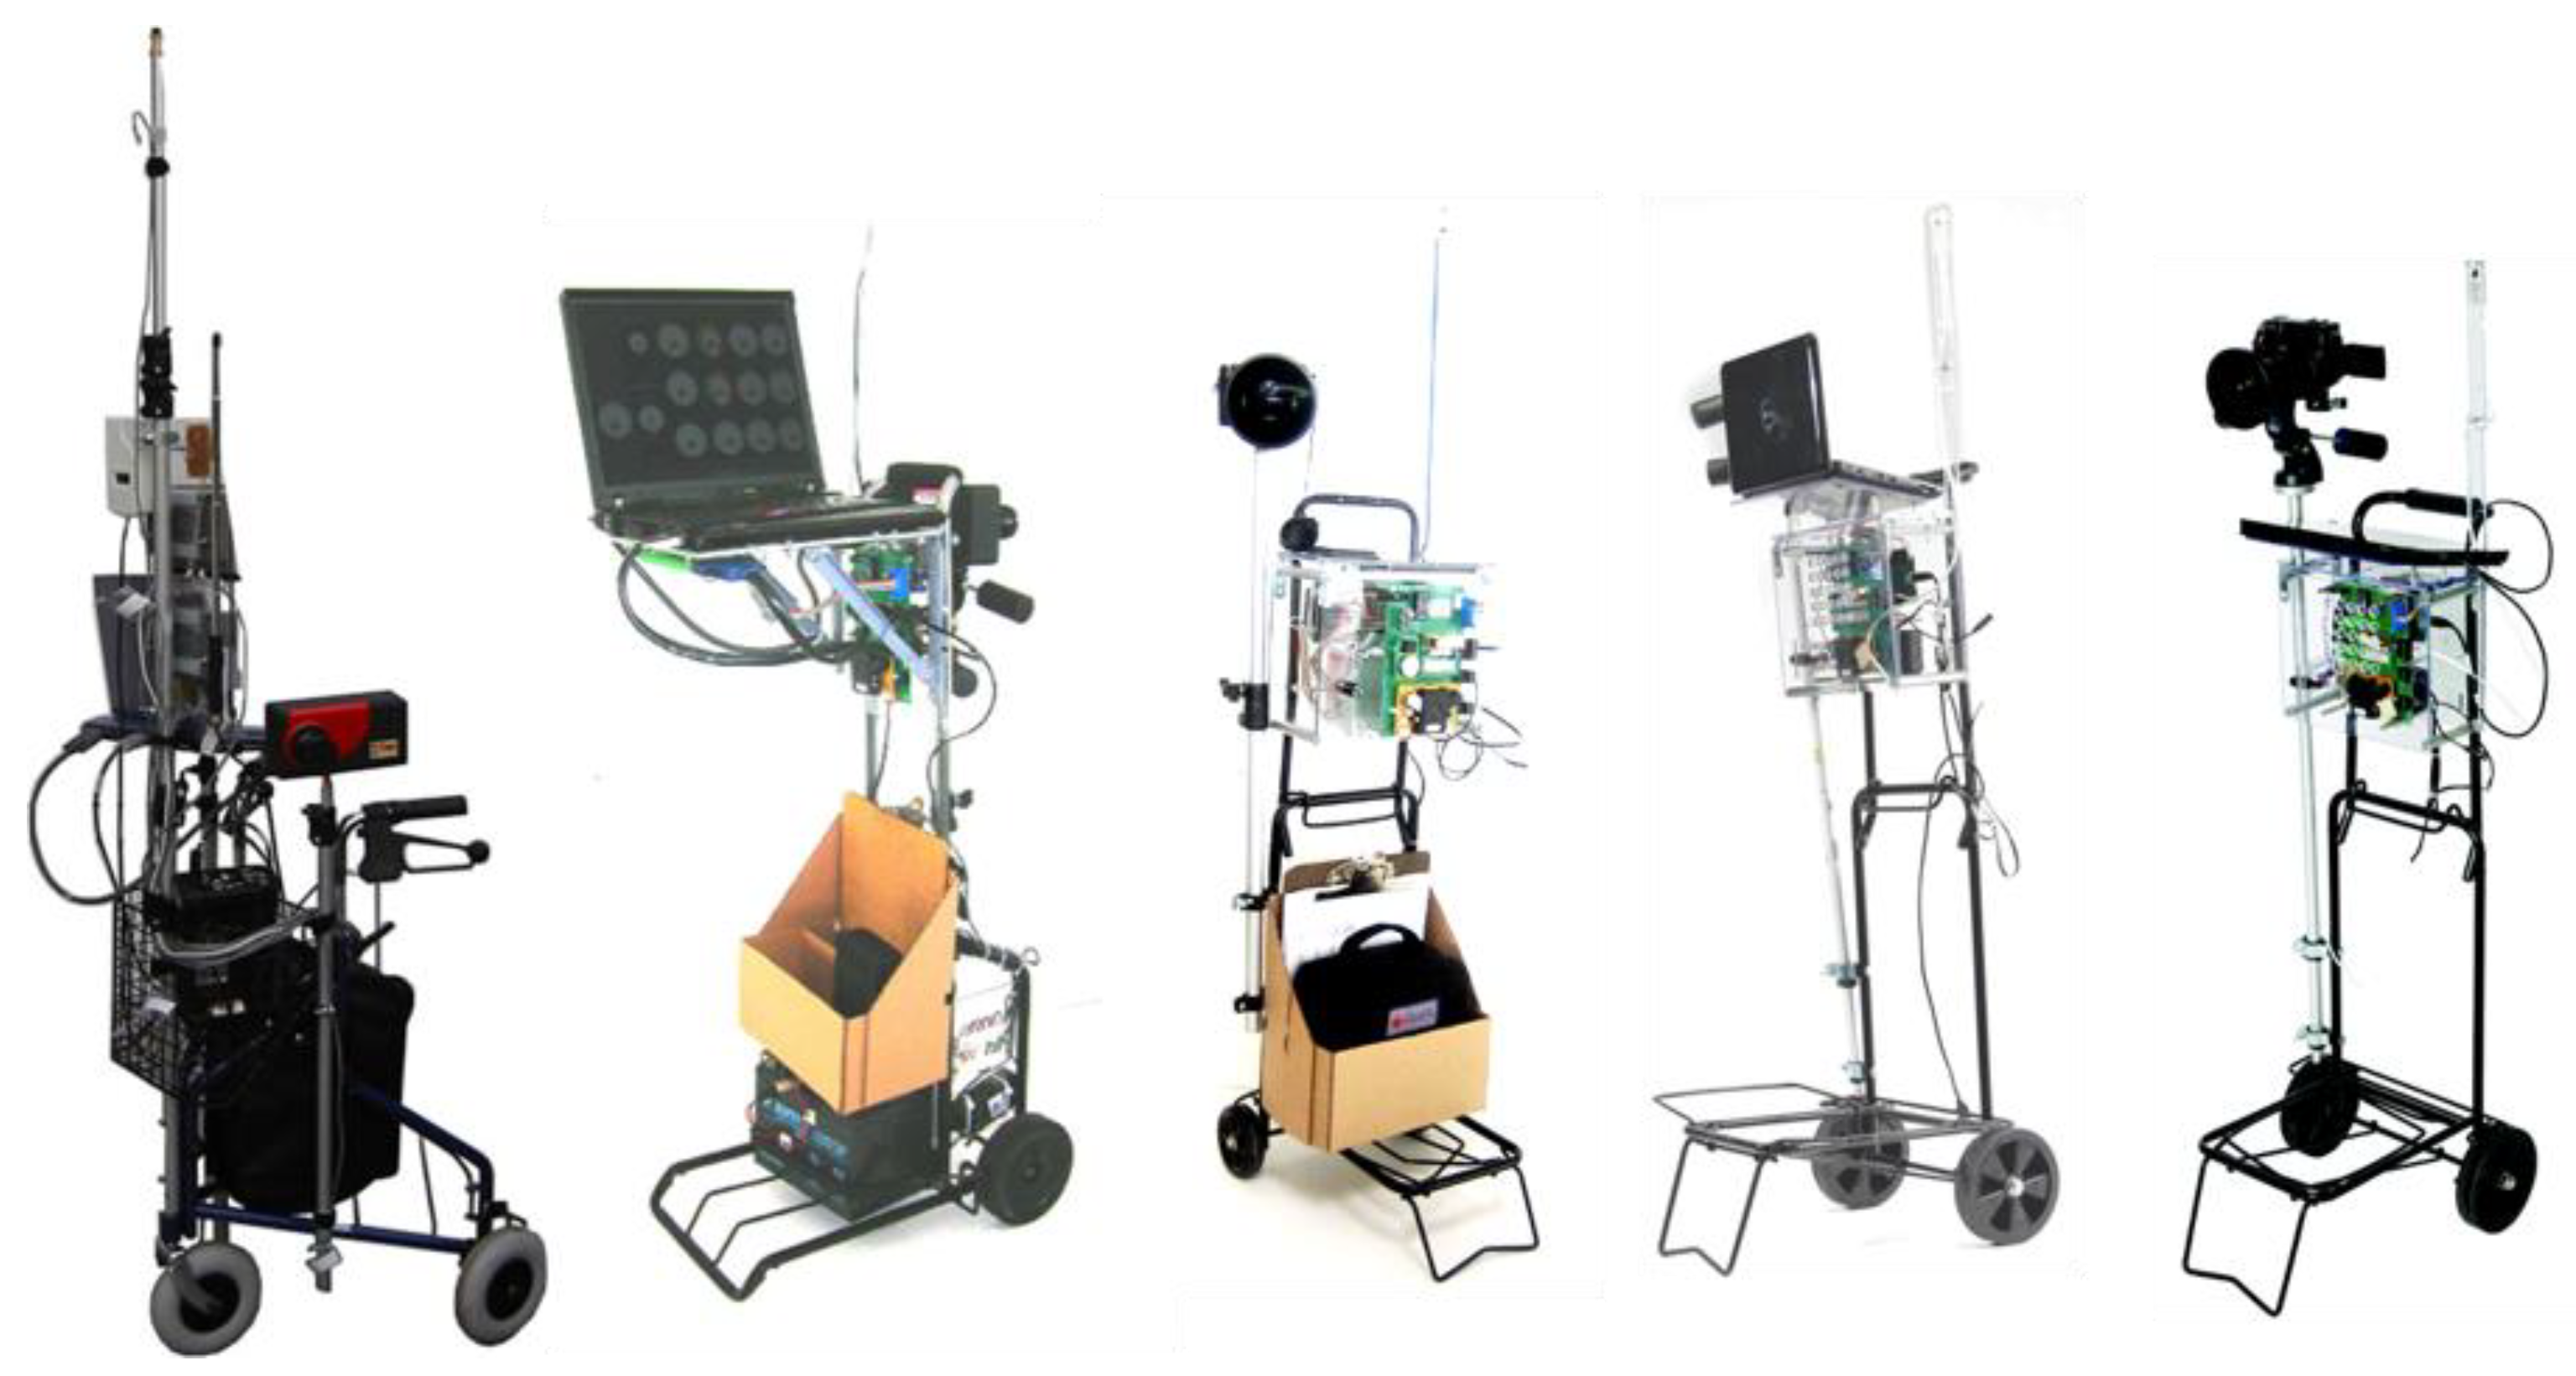
2.2. IEQ Field Measurements
2.3. Technical Attributes of Building Systems
2.4. Statistical Analysis
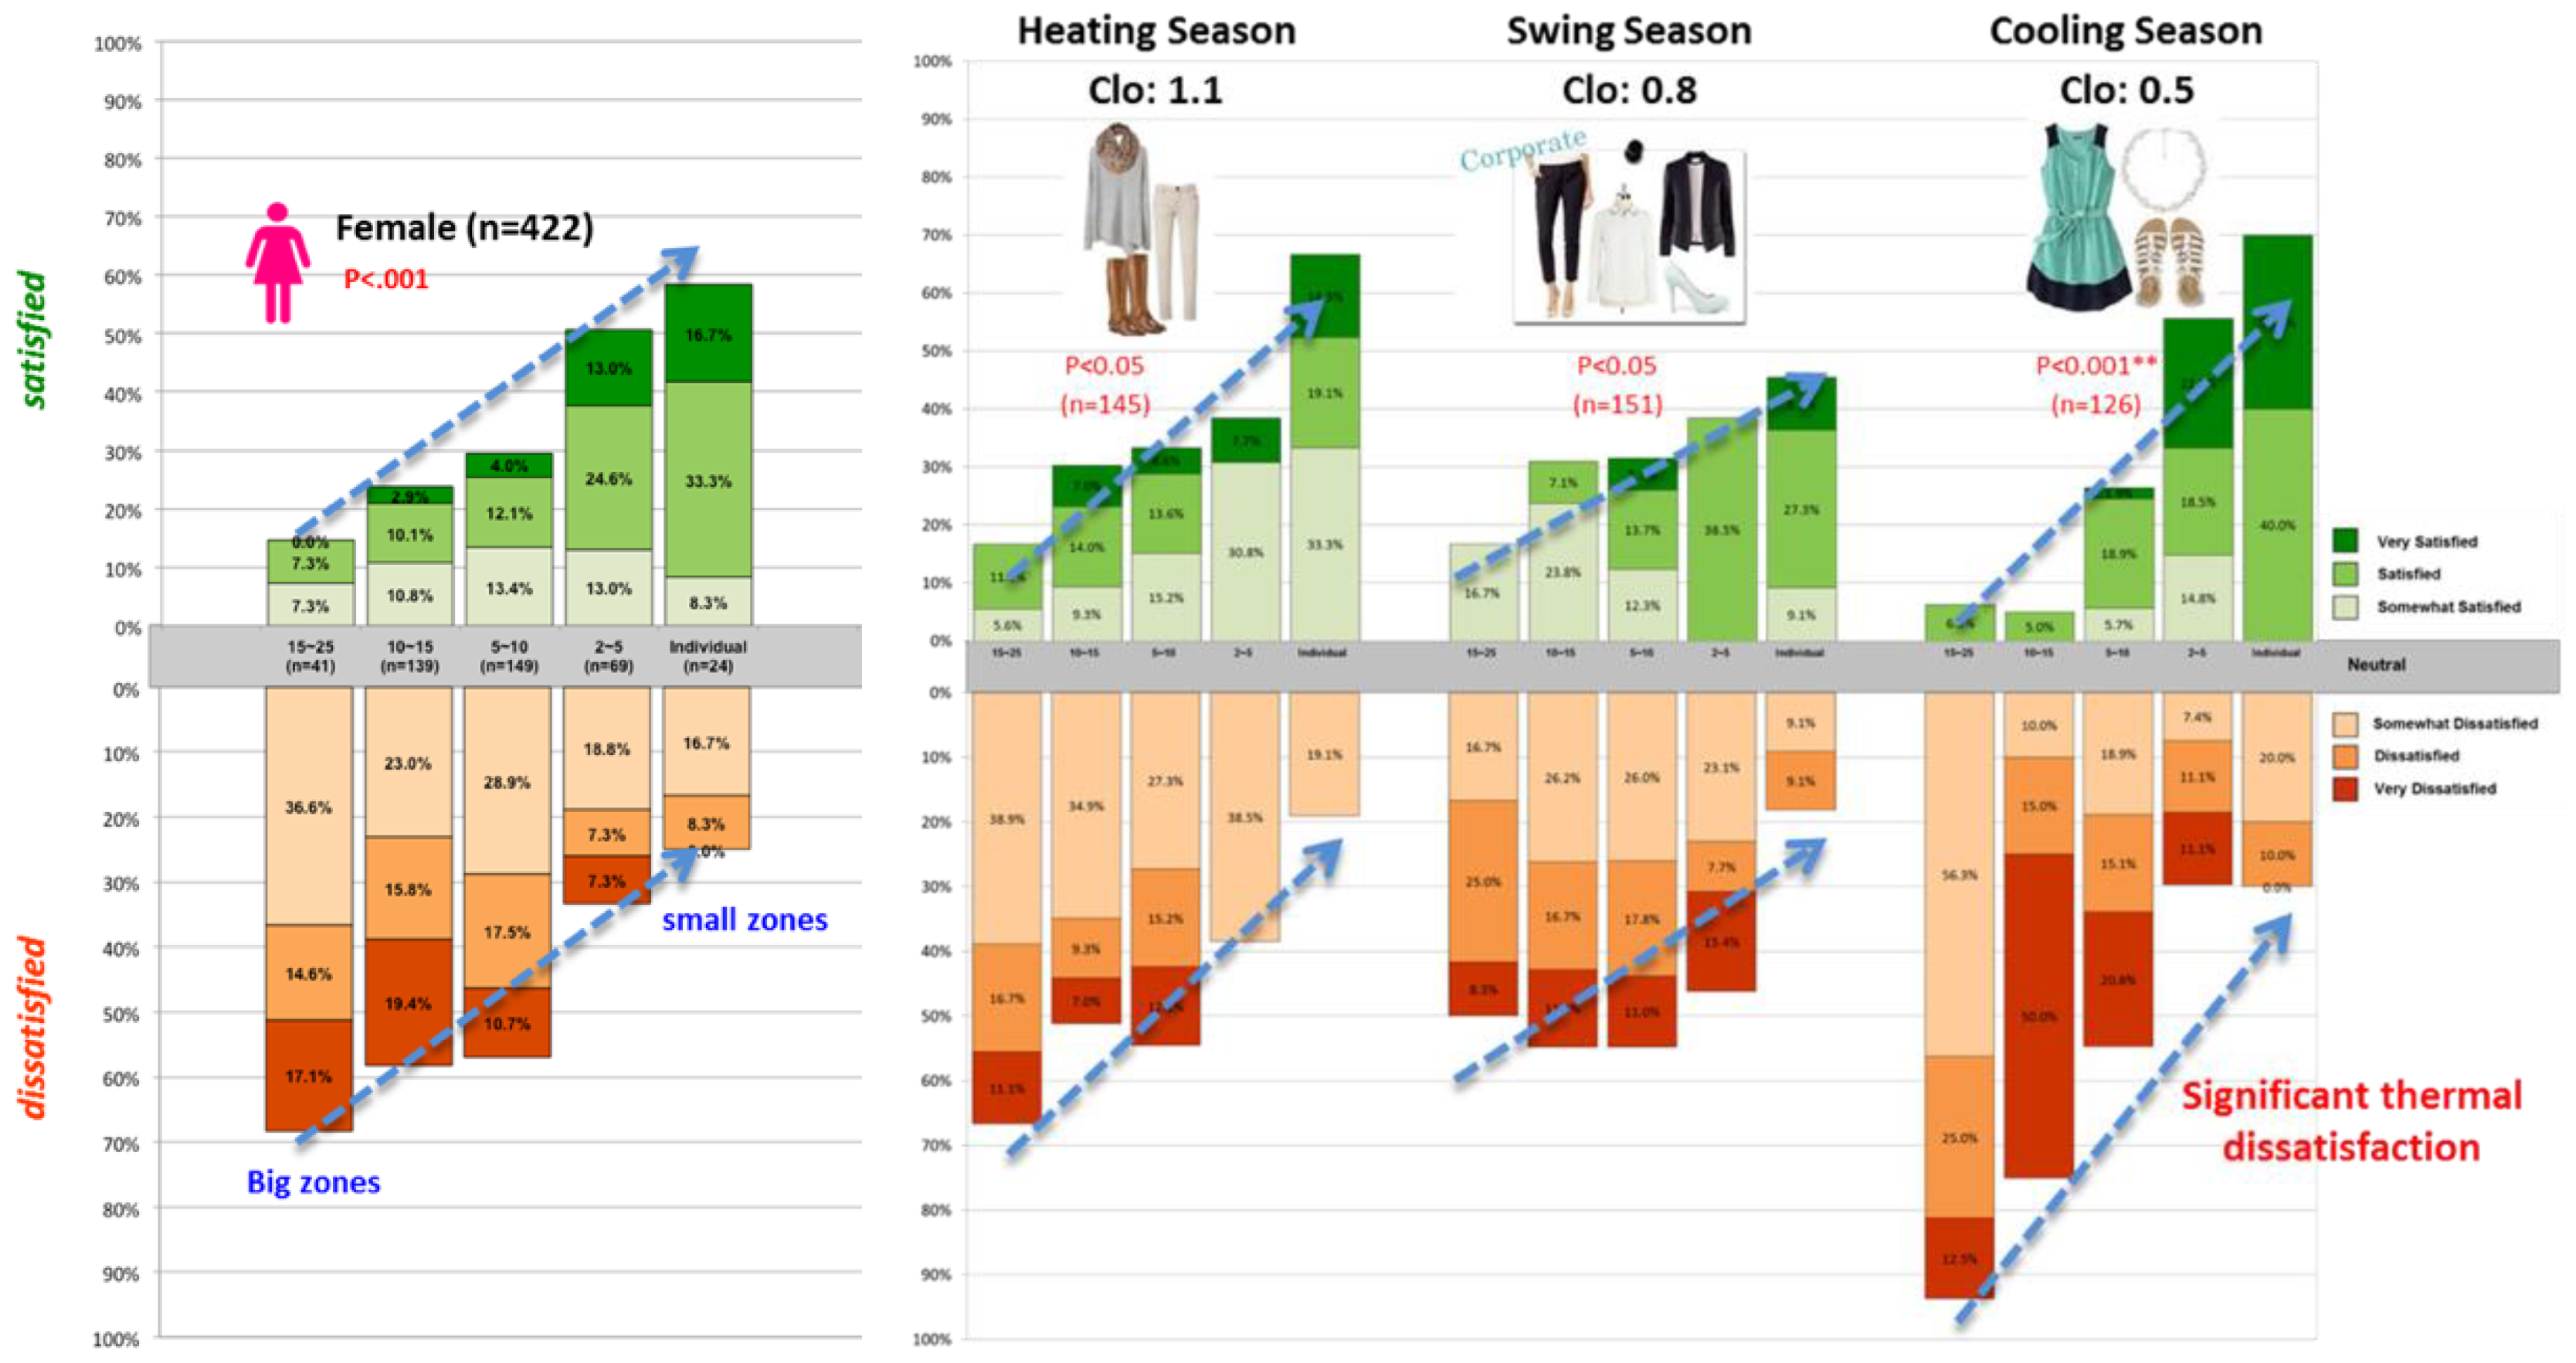
- Season (i.e., heating, cooling, and swing season): Depending on the season, buildings run different Heating, Ventilation, and Air Conditioning (HVAC) systems (heating or cooling) and people wear different types of clothing. According to Fanger’s comfort equation, clothing is a critical factor in thermal comfort [84,85]. It is expected that the season needs to be considered to assess perceived thermal satisfaction.
- Perimeter vs. Core workstations: Occupants working in perimeter offices have shown higher user satisfaction than those working in the core. The location of the workstation needs to be considered for perceived user satisfaction. Since the environmental variables such as view, thermal control, and air movement, and so on, are quite different between perimeter and core workstations, it is expected that the location of the workstations needs to be considered for perceived user satisfaction [75,78,89].
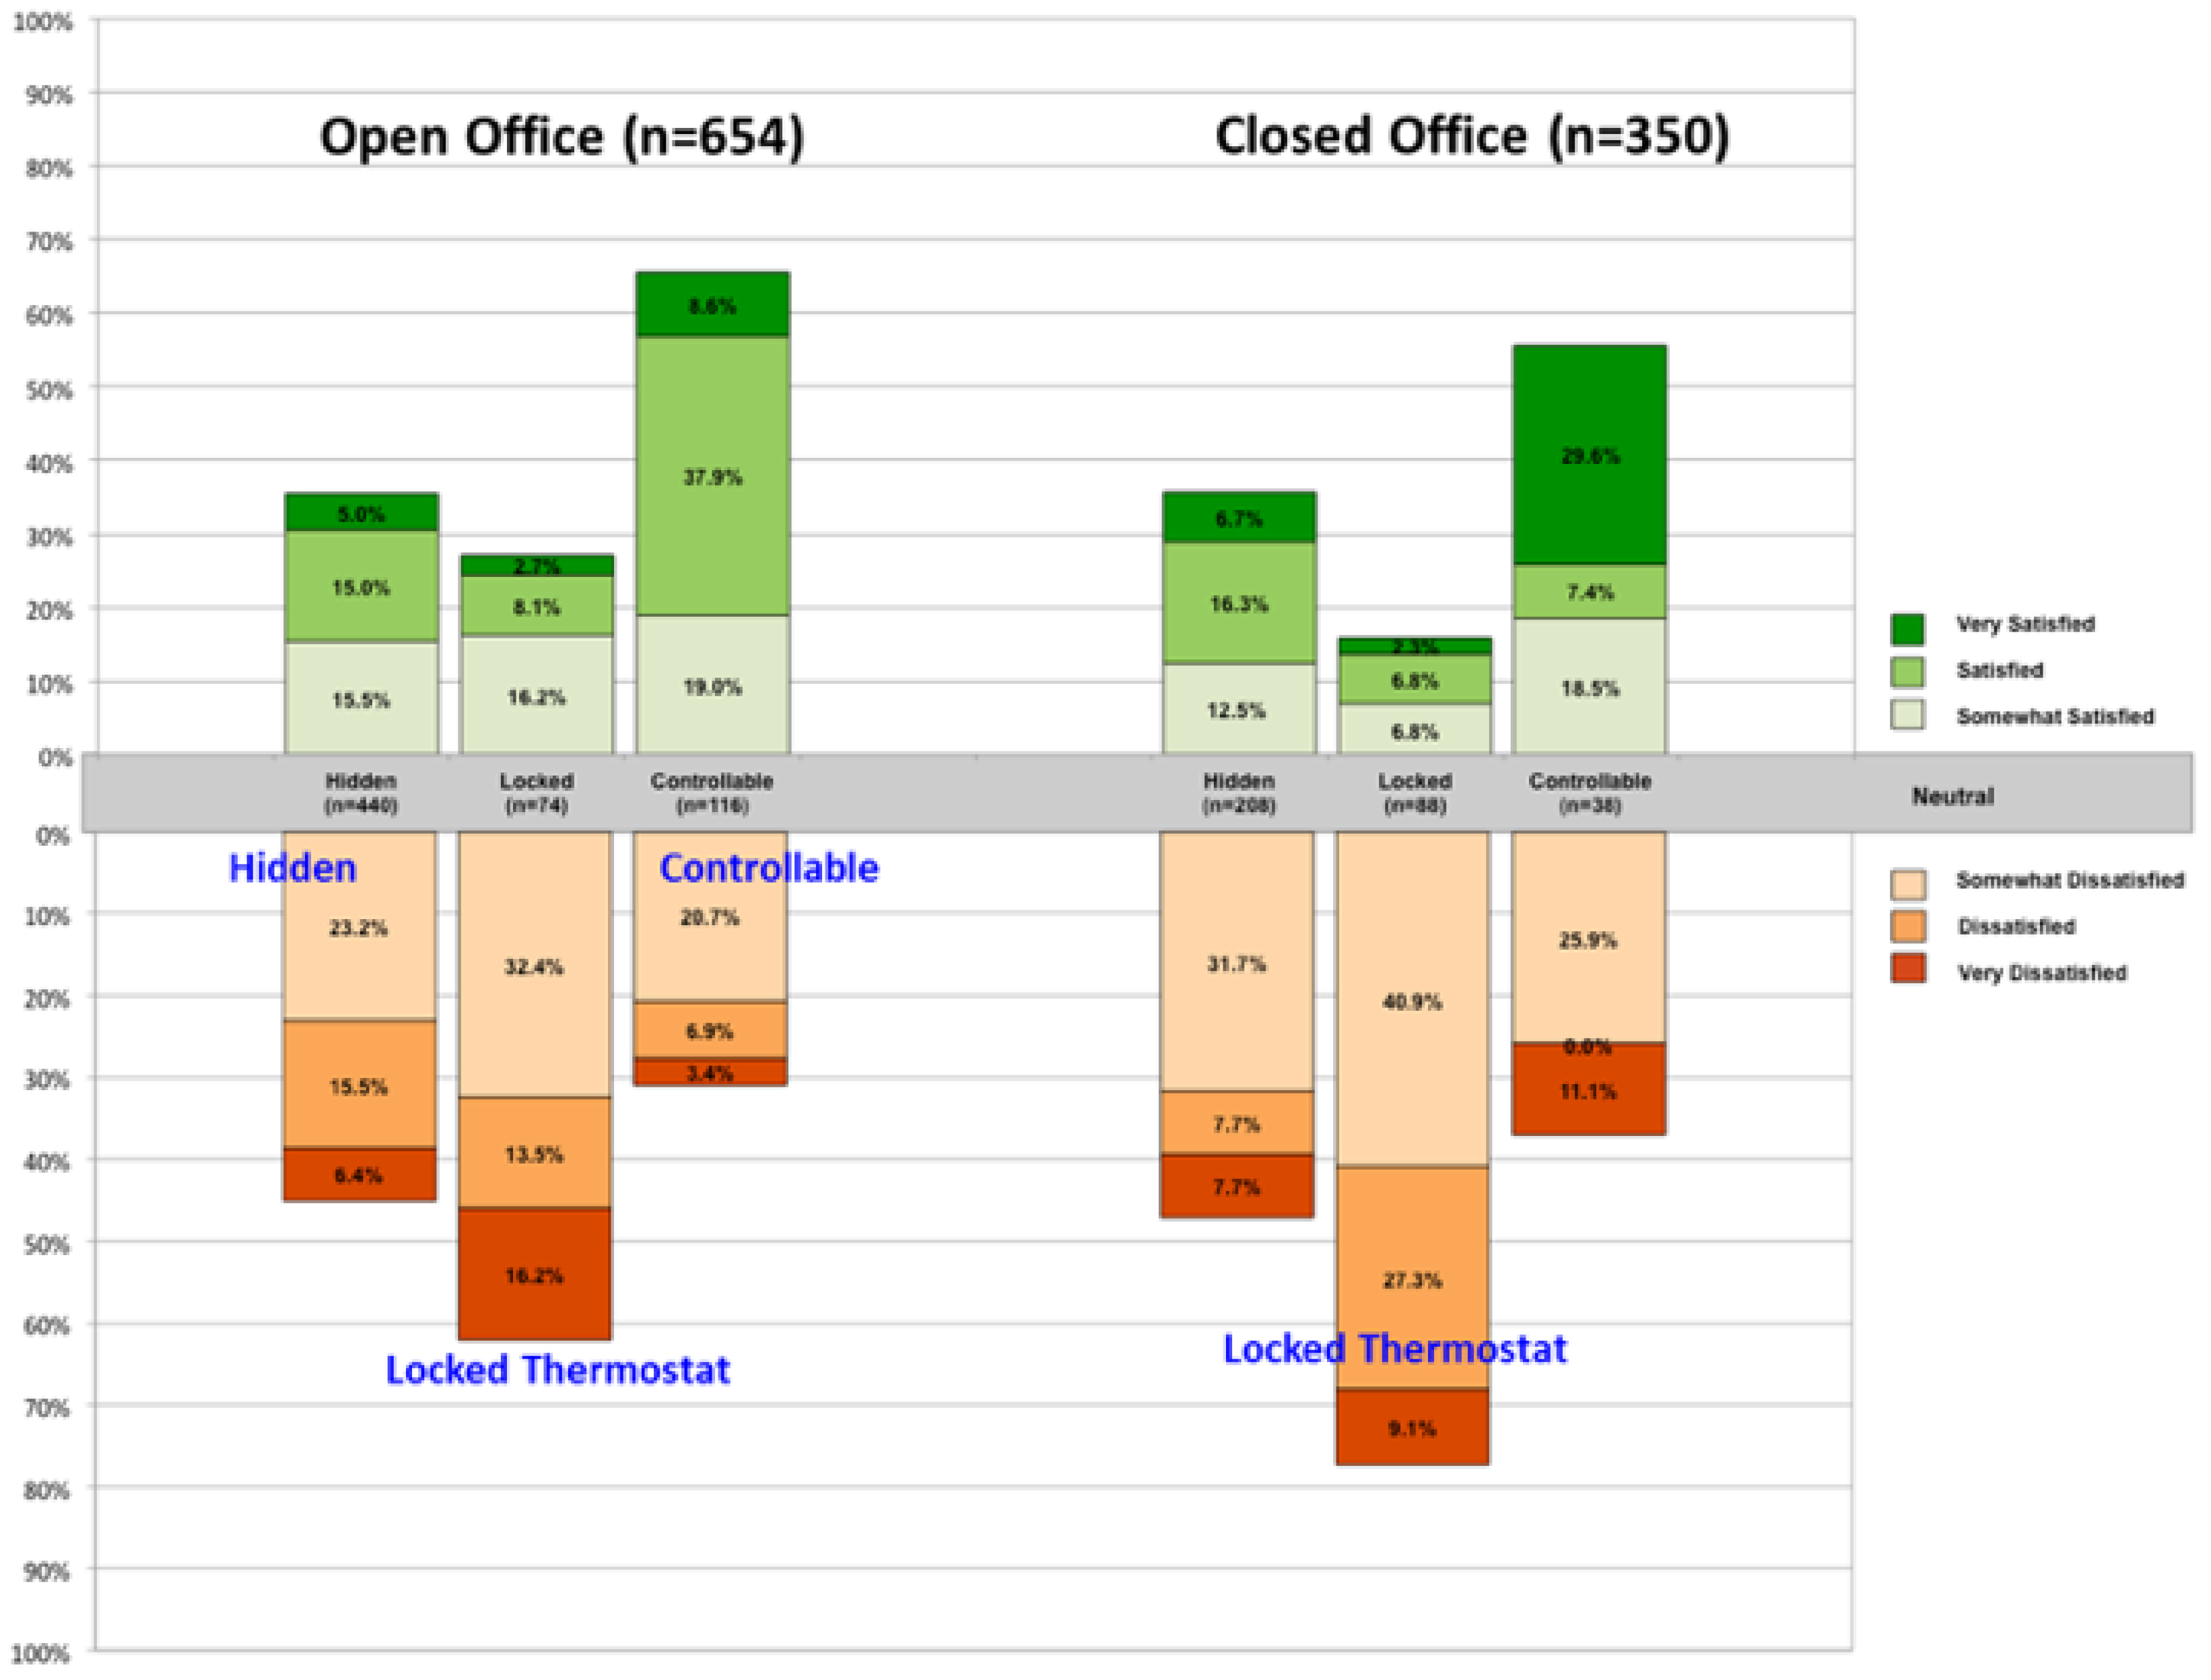
- Open-plan and closed offices: It has been shown that open-plan office occupants are more satisfied with their environments than closed-office occupants [14]. It is expected that occupant satisfaction may be related to privacy and control issues in the office, so the office types were considered in the analysis [12].
2.4.1. Model 1
2.4.2. Model 2
2.4.3. Model 3
2.4.4. Model 4
2.4.5. Model 5
3. Results
- Occupants in closed offices showed higher satisfaction than occupants in an open-plan office location (p = 0.01).
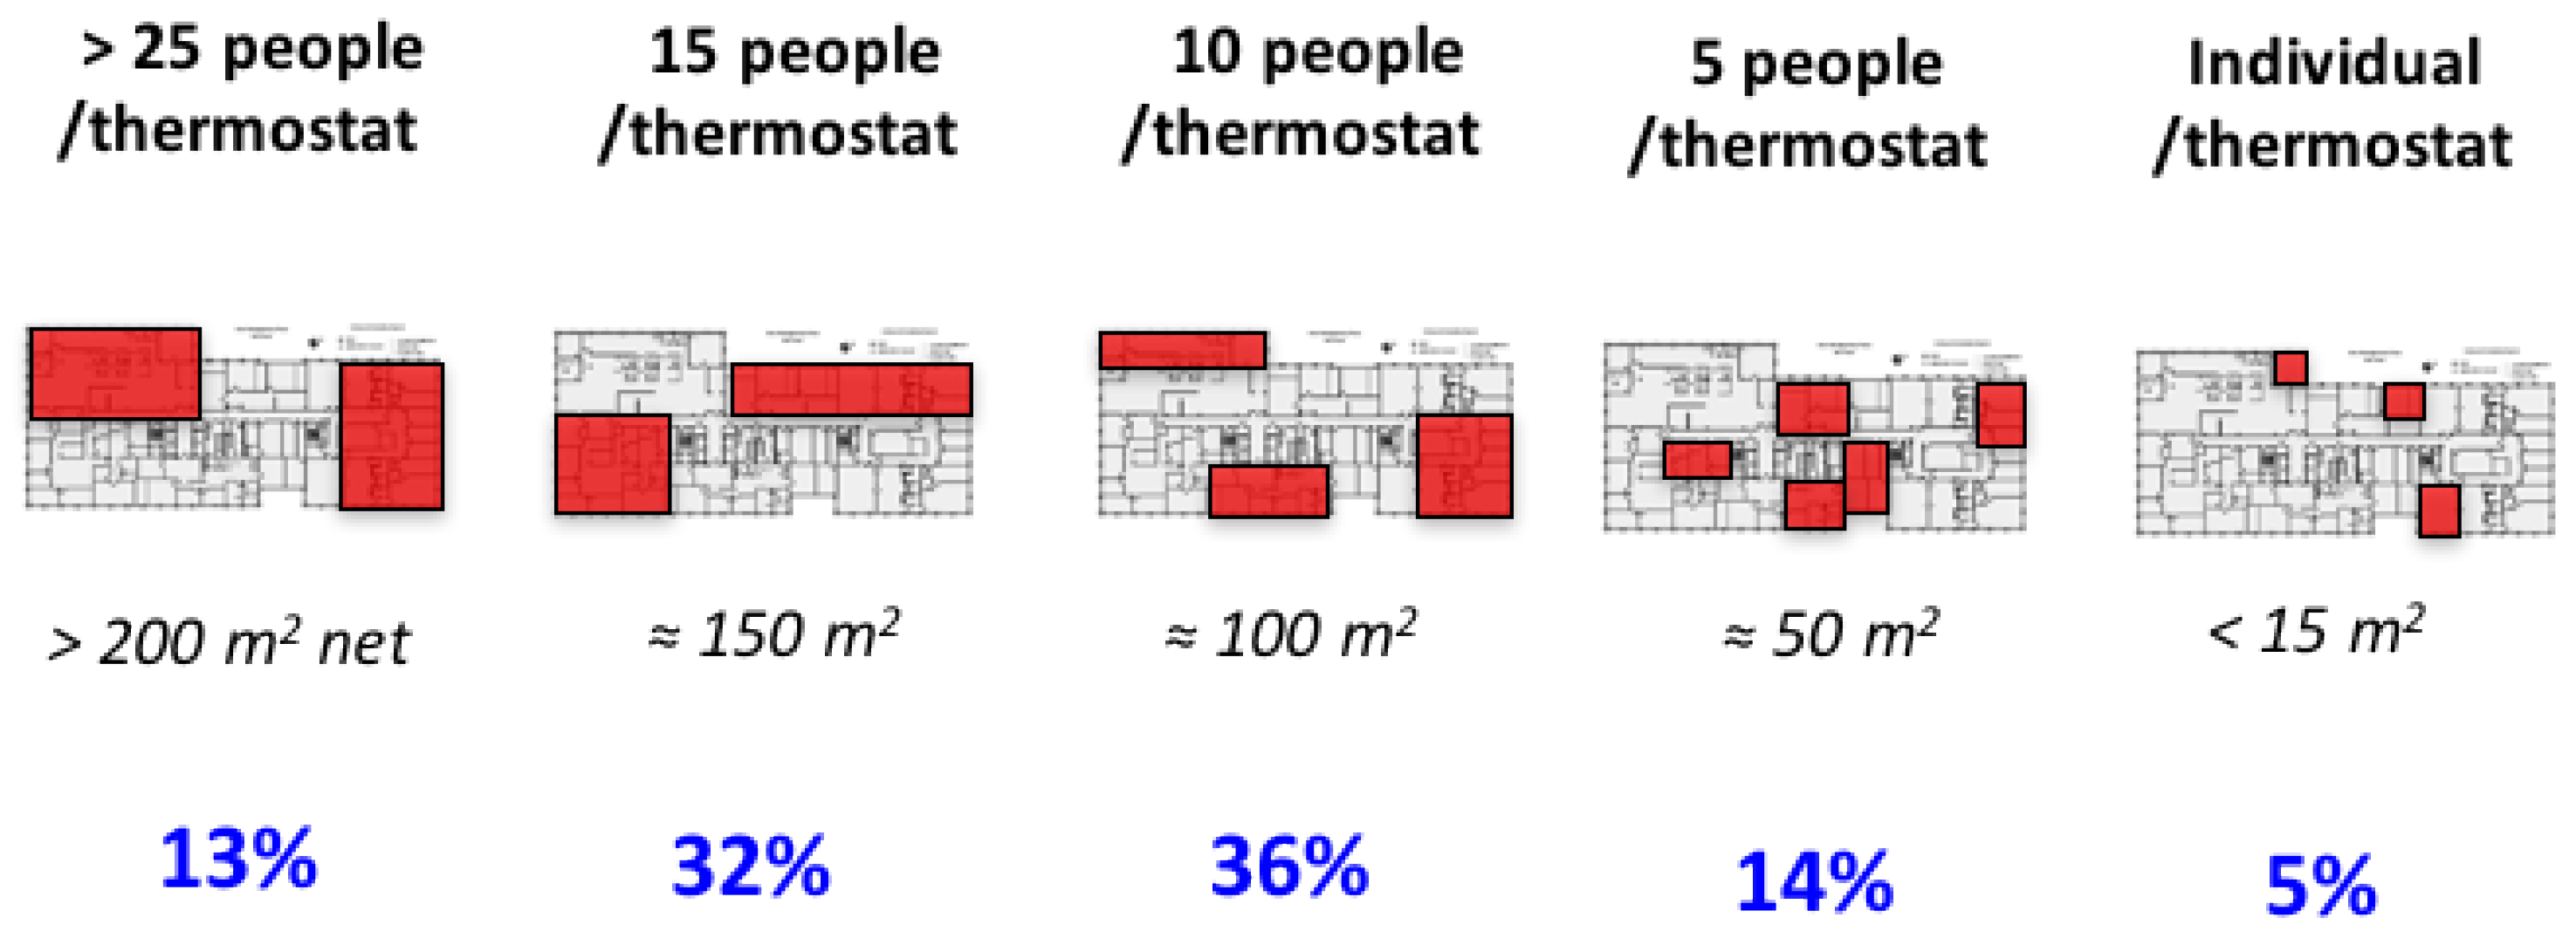
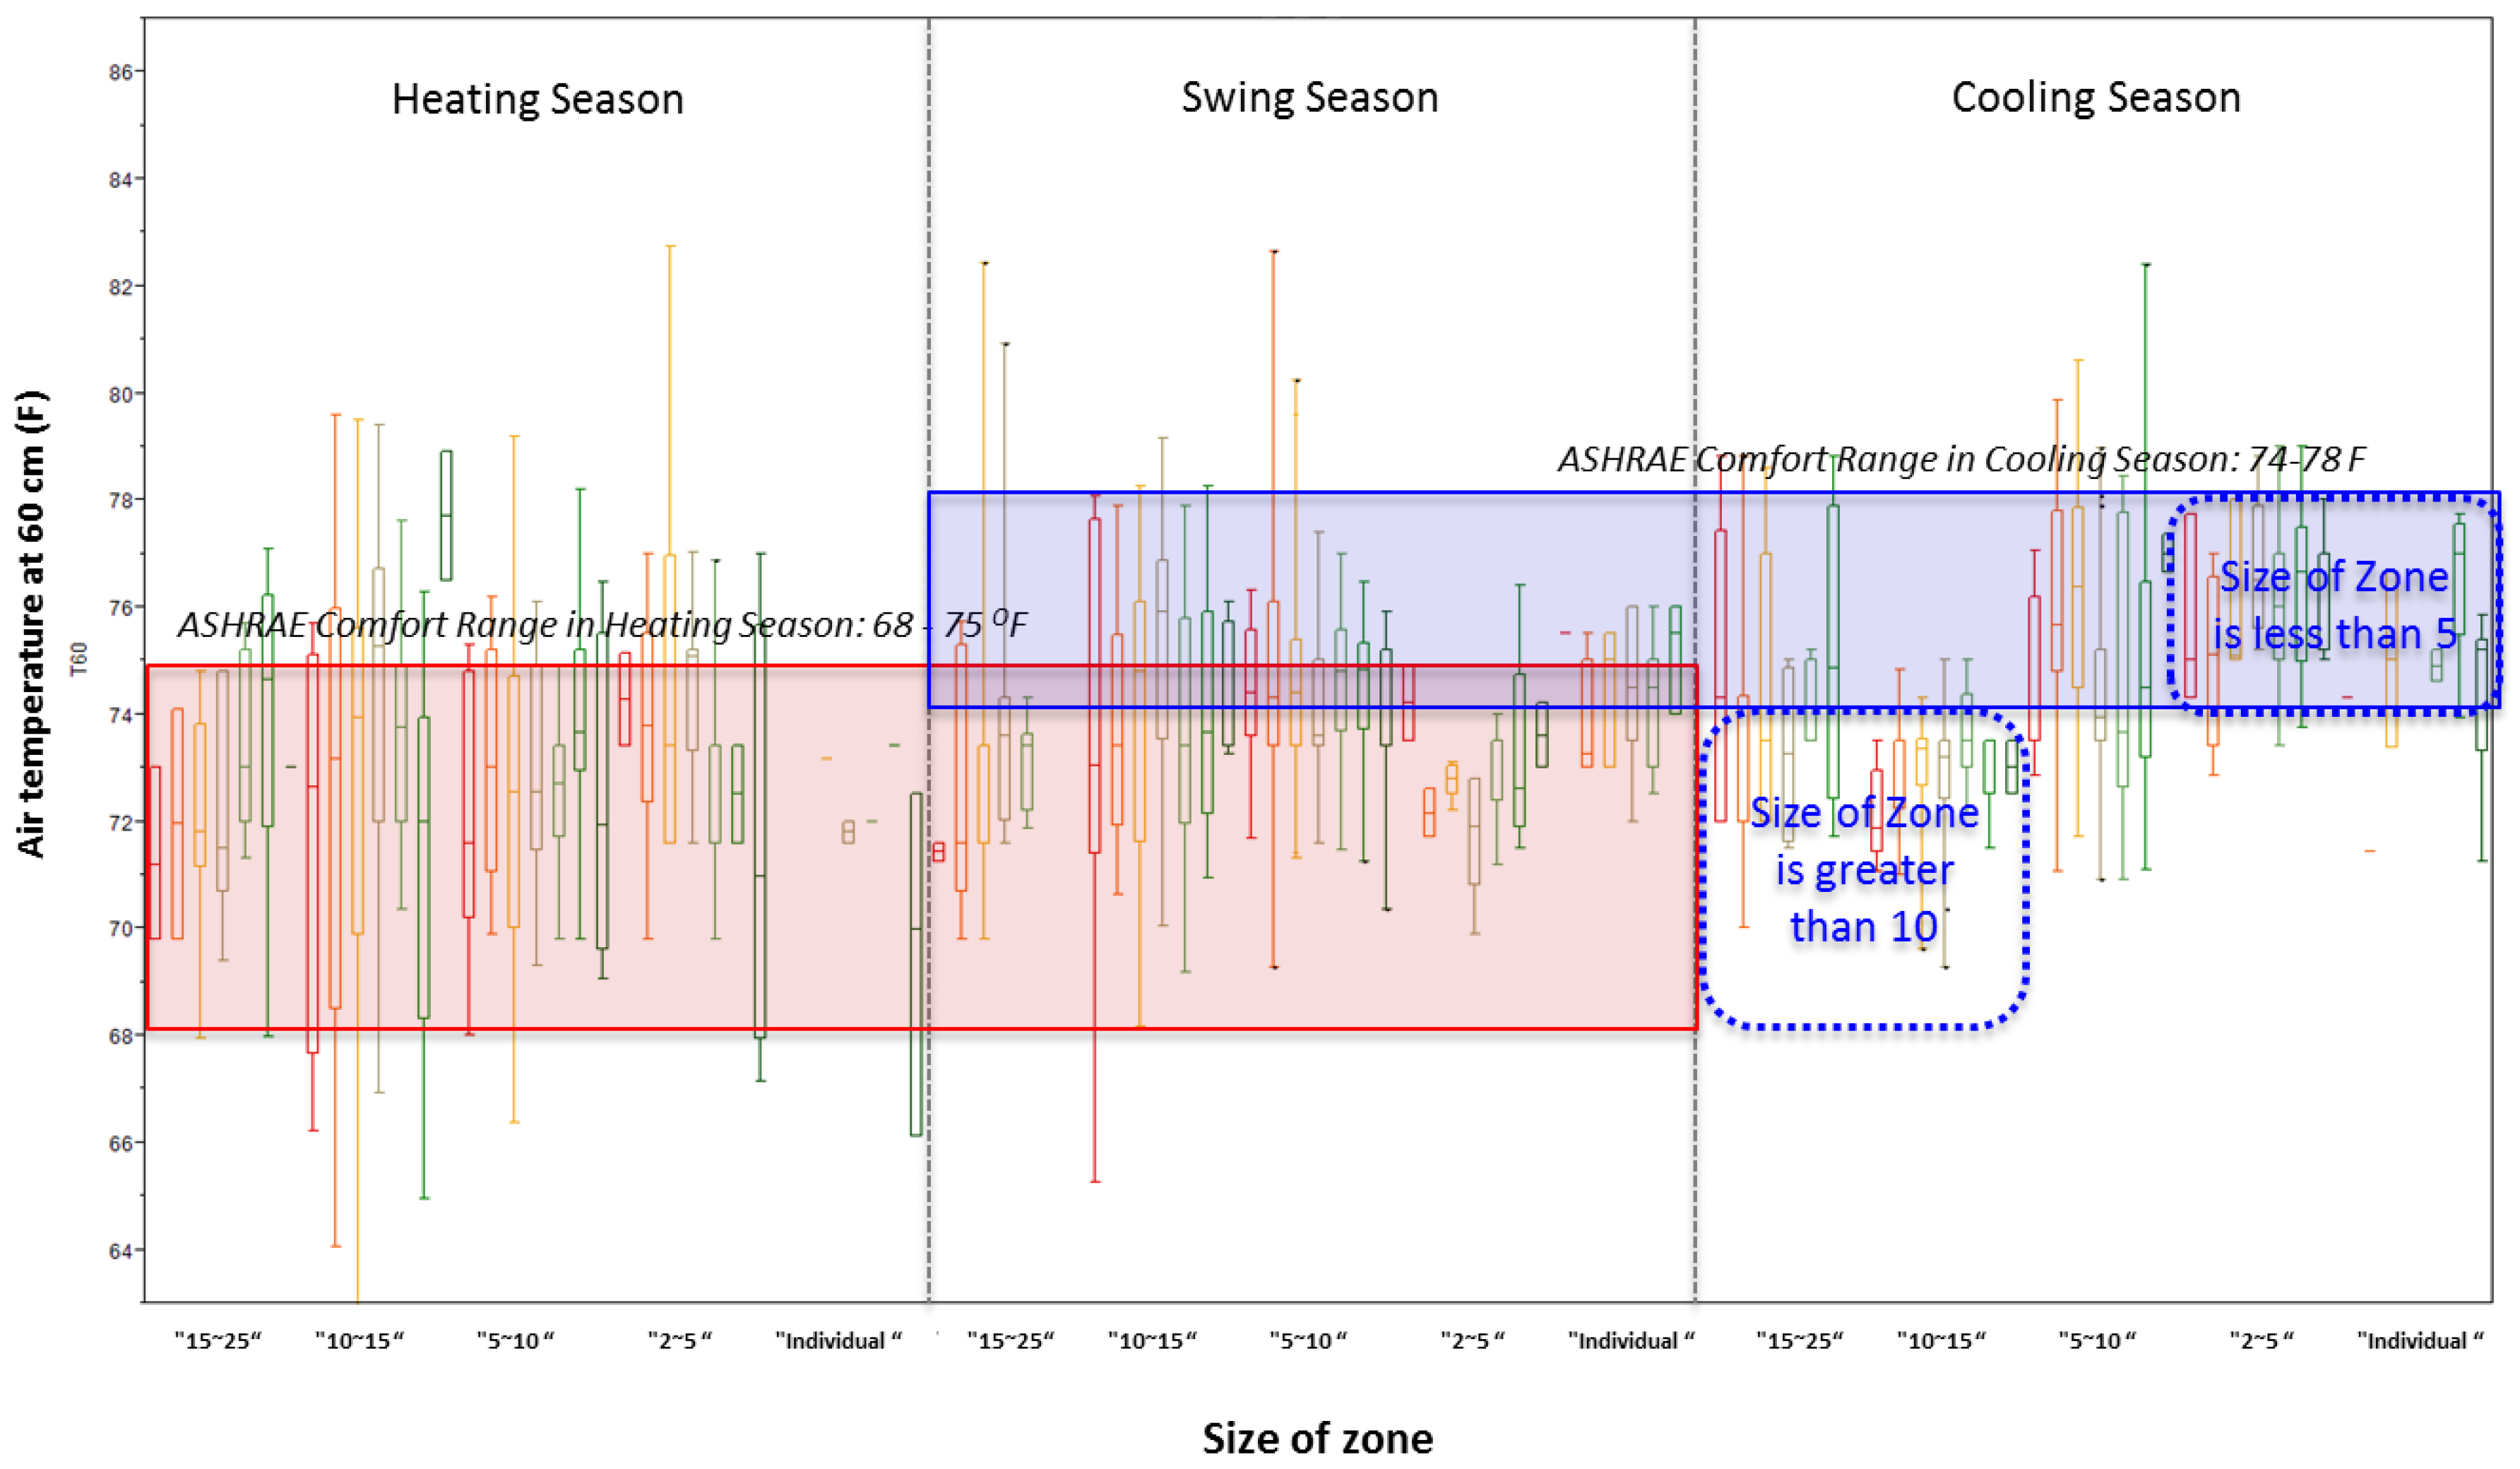
- A smaller “size of zone” could increase user satisfaction (p = 0.01).
- Individual control of the thermostat could increase user satisfaction (p = 0.001).
- Better “window quality (enclosure)” could increase user satisfaction (p = 0.03).
- The air temperature at 60 cm from the floor and radiant temperature asymmetry between the exterior and interior walls significantly affected user satisfaction (p < 0.05).
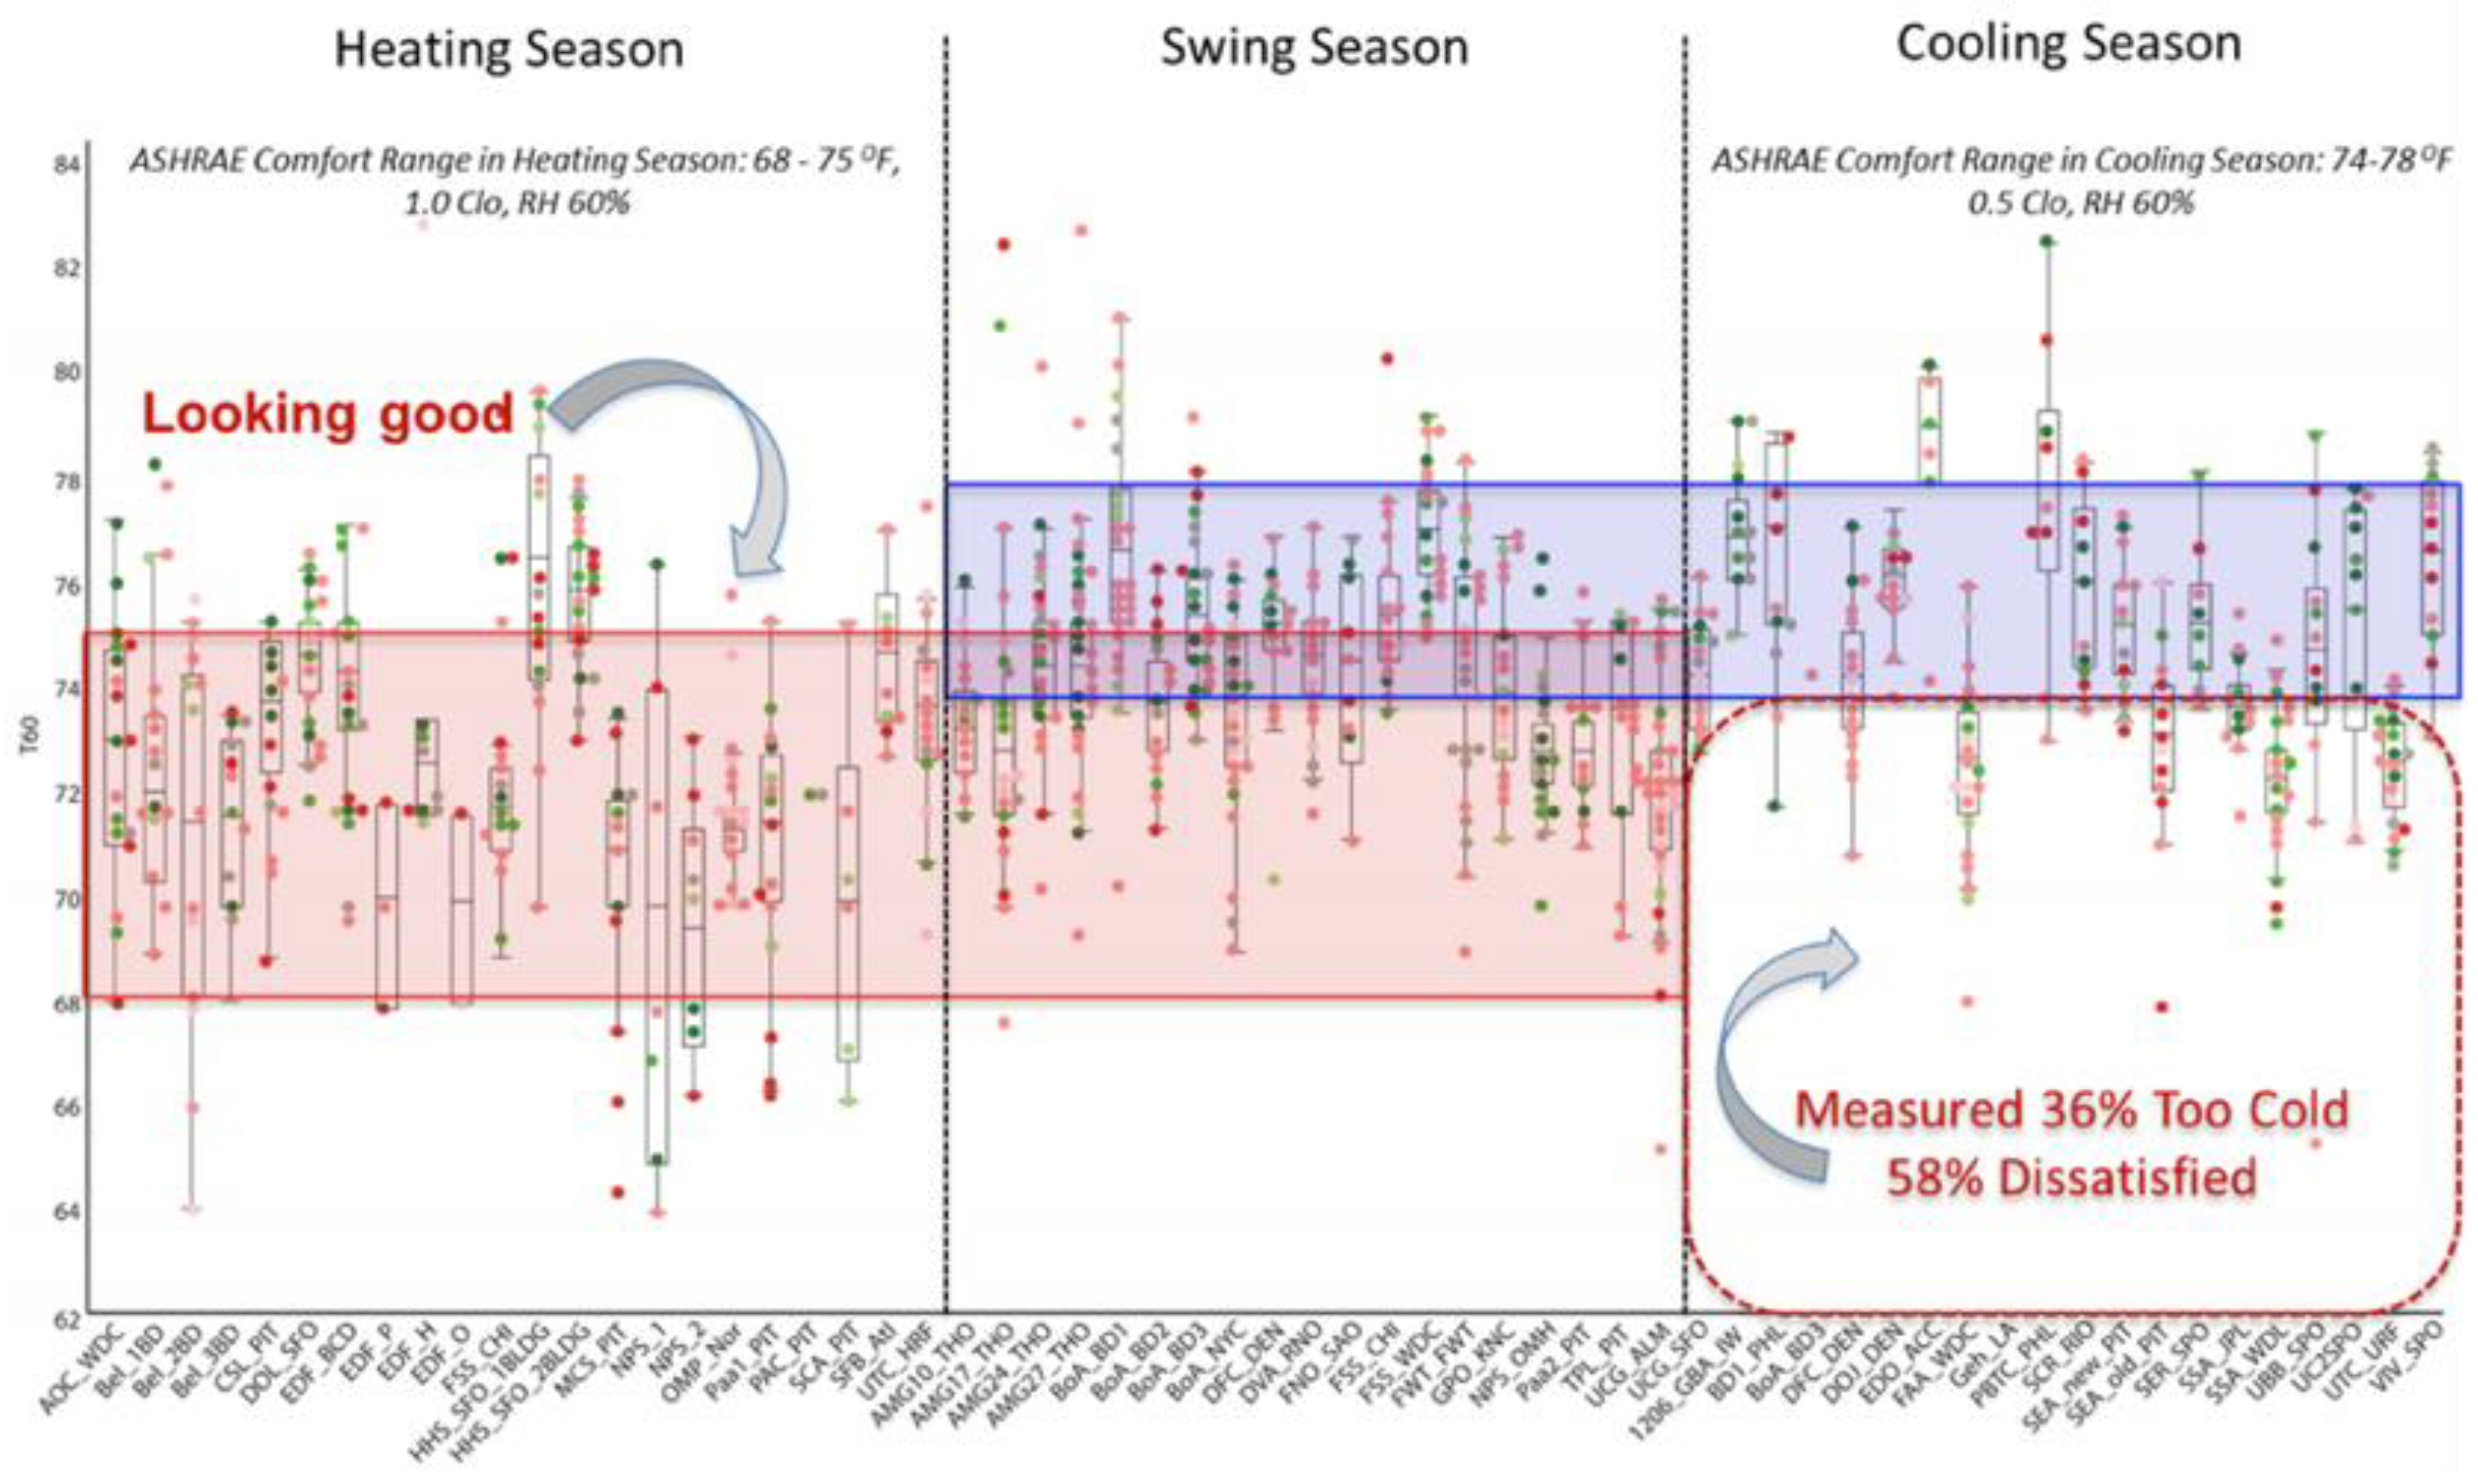
3.1. Air Temperature
3.2. Size of Themral Zone
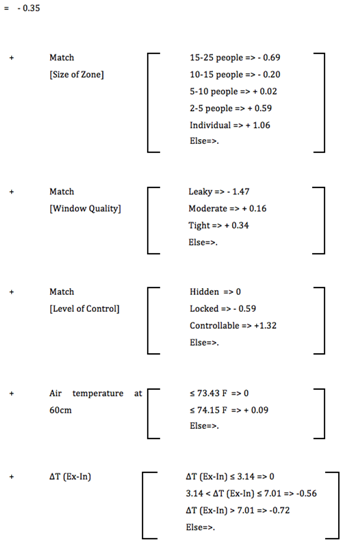
3.3. Level of Temperature Control
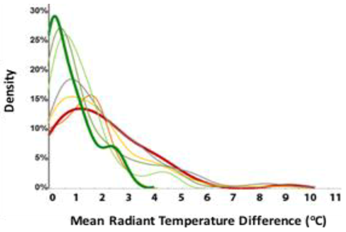
3.4. Radiant Temperature Asymmetry with Façade
4. Discussion
4.1. Prediction of User Satistacion for Future Studies
4.2. Research Limitations
5. Summary and Conclusions
- To identify critical IEQ and physical factors for user satisfaction on thermal quality.
- To identify correlations between building systems, measured IEQ, and user satisfaction in concurrent time frames.
- To define thresholds for highest user satisfaction in the field.
Author Contributions
Acknowledgments
Conflicts of Interest
Appendix A. User Satisfaction Survey Questionnaire


Appendix B. Technical Attributes of Building Systems

References
- Bureau of Labor Statistics (BLS). American Time Use Survey—2011 Results; US Department of Labor, Bureau of Labor Statistics: Washington, DC, USA, 2011.
- Fisk, W.J. How IEQ affects health, productivity. ASHRAE J. Am. Soc. Heat. Refrig. Air Cond. Eng. 2002, 44, 56–60. [Google Scholar]
- Hedge, A. Where are we in understanding the effects of where we are? Ergonomics 2000, 43, 1019–1029. [Google Scholar] [CrossRef] [PubMed]
- Meir, I.; Garb, Y.; Jiao, D.; Cicelsky, A. Post-occupancy evaluation: An inevitable step toward sustainability. Adv. Build. Energy Res. 2009, 3, 189–219. [Google Scholar] [CrossRef]
- Wargocki, P.; Wyon, D.P.; Sundell, J.A.N.; Clausen, G.E.O.; Fanger, P.O. The Effects of Outdoor Air Supply Rate in an Office on Perceived Air Quality, Sick Building Syndrome (SBS) Symptoms and Productivity. Indoor Air 2000, 10, 222–236. [Google Scholar] [CrossRef] [PubMed] [Green Version]
- Fang, L.; Clausen, G.; Fanger, P.O. Impact of temperature and humidity on the perception of indoor air quality. Indoor Air 2004, 8, 80–90. [Google Scholar] [CrossRef]
- Loftness, V.; Hartkopf, V.; Aziz, A.; Choi, J.-H.; Park, J. Critical Frameworks for Building Evaluation: User Satisfaction, Environmental Measurements and the Technical Attributes of Building Systems (POE + M). In Building Performance Evaluation; Preiser, W.F.E., Hardy, A.E., Schramm, U., Eds.; Springer International Publishing: Cham, Switzerland, 2018; pp. 29–48. [Google Scholar]
- Choi, J.-H.; Moon, J. Impacts of human and spatial factors on user satisfaction in office environments. Build. Environ. 2017, 114, 23–35. [Google Scholar] [CrossRef]
- De Dear, R.; Brager, G.S. The adaptive model of thermal comfort and energy conservation in the built environment. Int. J. Biometeorol. 2001, 45, 100–108. [Google Scholar] [CrossRef] [PubMed] [Green Version]
- Cooper, I. Post-occupancy evaluation—Where are you? Build. Res. Inf. 1999, 27, 321. [Google Scholar] [CrossRef]
- Bluyssen, P.M.; Aries, M.; van Dommelen, P. Comfort of workers in office buildings: The European HOPE project. Build. Environ. 2011, 46, 280–288. [Google Scholar] [CrossRef]
- Loftness, V.; Aziz, A.; Choi, J.; Kampschroer, K.; Powell, K.; Atkinson, M.; Heerwagen, J. The value of post-occupancy evaluation for building occupants and facility managers. Intell. Build. Int. 2009, 1, 249–268. [Google Scholar] [CrossRef]
- Newsham, G.; Brand, J.; Donnelly, C.; Veitch, J.; Aries, M.; Charles, K. Linking indoor environment conditions to job satisfaction: A field study. Build. Res. Inf. 2009, 37, 129–147. [Google Scholar] [CrossRef]
- Veitch, J.A.; Charles, K.E.; Farley, K.M.; Newsham, G.R. A model of satisfaction with open-plan office conditions: COPE field findings. J. Environ. Psychol. 2007, 27, 177–189. [Google Scholar] [CrossRef] [Green Version]
- Park, J. Post-occupancy evaluation for energy conservation, superior IEQ & increased occupant satisfaction. In Proceedings of the IFMA’s World Workplace 2013, Philadelphia, PA, USA, 2–4 October 2013. [Google Scholar]
- Wang, S.K.; Wang, S.K. Handbook of Air Conditioning and Refrigeration; McGraw-Hill: New York, NY, USA, 2000; Volume 49. [Google Scholar]
- Wang, T.; Park, J.; Witt, A. Integrated Indoor Environmental Quality Assessment Methods for Occupant Comfort and Productivity. In Proceedings of the International Conference on Cleantech for Smart Cities & Buildings—From Nano to Urban Scale, Lausanne, Switzerland, 4–6 September 2013. [Google Scholar]
- Center for Building Performance and Diagnostics (CBPD). NEAT Manual; School of Architecture, Carnegie Mellon University: Pittsburgh, PA, USA, 2013. [Google Scholar]
- Newsham, G.; Veitch, J.; National Research Council (NRC). Cost-Effective Open-Plan Environments Project (COPE); NRCC-45681; NRC: Ottawa, ON, Canada, 2009. [Google Scholar]
- Brager, G.; Heerwagen, J.; Bauman, F.; Huizenga, C.; Powell, K.; Ruland, A.; Ring, E. Team Spaces and Collaboration: Links to the Physical Environment; Center for the Built Environment, University of California: Berkeley, CA, USA, 2000. [Google Scholar]
- Moschandreas, D.J.; Sofuoglu, S.C. The indoor environmental index and its relationship with symptoms of office building occupants. J. Air Waste Manag. Assoc. 2004, 54, 1440–1451. [Google Scholar] [CrossRef] [PubMed]
- Fang, L.; Wyon, D.; Clausen, G.; Fanger, P.O. Impact of indoor air temperature and humidity in an office on perceived air quality, SBS symptoms and performance. Indoor Air 2004, 14, 74–81. [Google Scholar] [CrossRef] [PubMed]
- Atmaca, I.; Kaynakli, O.; Yigit, A. Effects of radiant temperature on thermal comfort. Build. Environ. 2007, 42, 3210–3220. [Google Scholar] [CrossRef]
- Seppanen, O.; Fisk, W.J.; Faulkner, D. Control of Temperature for Health and Productivity in Offices; Lawrence Berkeley National Laboratory: Berkeley, CA, USA, 2004.
- Niemelä, R.; Hannula, M.; Rautio, S.; Reijula, K.; Railio, J. The effect of air temperature on labour productivity in call centres—A case study. Energy Build. 2002, 34, 759–764. [Google Scholar] [CrossRef]
- De Dear, R. Thermal comfort in practice. Indoor Air 2004, 14, 32–39. [Google Scholar] [CrossRef] [PubMed]
- Schiller, G.; Arens, E.A.; Bauman, F.; Benton, C.; Fountain, M.; Doherty, T. A Field Study of Thermal Environments and Comfort in Office Buildings. ASHRAE Trans. 1988, 94, Pt-2. [Google Scholar]
- Busch, J.F. A tale of two populations: Thermal comfort in air-conditioned and naturally ventilated offices in Thailand. Energy Build. 1992, 18, 235–249. [Google Scholar] [CrossRef]
- Fan, J.; Tsang, H.W. Effect of clothing thermal properties on the thermal comfort sensation during active sports. Text. Res. J. 2008, 78, 111–118. [Google Scholar]
- Oseland, N.A. Predicted and reported thermal sensation in climate chambers, offices and homes. Energy Build. 1995, 23, 105–115. [Google Scholar] [CrossRef]
- Ealiwa, M.; Taki, A.; Howarth, A.; Seden, M. An investigation into thermal comfort in the summer season of Ghadames, Libya. Build. Environ. 2001, 36, 231–237. [Google Scholar] [CrossRef]
- Nicol, F.; Humphreys, M.; Roaf, S. Adaptive Thermal Comfort, Principles and Practice; Routledge: Abingdon, UK, 2012. [Google Scholar]
- Van der Linden, A.; Boerstra, A.C.; Raue, A.K.; Kurvers, S.R.; De Dear, R. Adaptive temperature limits: A new guideline in The Netherlands: A new approach for the assessment of building performance with respect to thermal indoor climate. Energy Build. 2006, 38, 8–17. [Google Scholar] [CrossRef]
- Heidari, S.; Sharples, S. A comparative analysis of short-term and long-term thermal comfort surveys in Iran. Energy Build. 2002, 34, 607–614. [Google Scholar] [CrossRef]
- Feriadi, H.; Wong, N.H. Thermal comfort for naturally ventilated houses in Indonesia. Energy Build. 2004, 36, 614–626. [Google Scholar] [CrossRef]
- Fato, I.; Martellotta, F.; Chiancarella, C. Thermal comfort in the climatic conditions of Southern Italy. Trans. Am. Soc. Heat. Refrig. Air Cond. Eng. 2004, 110, 578–593. [Google Scholar]
- Yamtraipat, N.; Khedari, J.; Hirunlabh, J. Thermal comfort standards for air conditioned buildings in hot and humid Thailand considering additional factors of acclimatization and education level. Sol. Energy 2005, 78, 504–517. [Google Scholar] [CrossRef]
- Paciuk, M. The Role of Personal Control of the Environment in Thermal Comfort and Satisfaction at the Workplace. Ph.D. Thesis, University of Wisconsin, Milwaukee, WI, USA, 1990. [Google Scholar]
- Becker, R.; Paciuk, M. Thermal comfort in residential buildings–failure to predict by standard model. Build. Environ. 2009, 44, 948–960. [Google Scholar] [CrossRef]
- de Dear, R.J.; Akimoto, T.; Arens, E.A.; Brager, G.; Candido, C.; Cheong, K.W.; Zhu, Y. Progress in thermal comfort research over the last twenty years. Indoor Air 2013, 23, 442–461. [Google Scholar] [CrossRef] [PubMed]
- Calvino, F.; La Gennusa, M.; Rizzo, G.; Scaccianoce, G. The control of indoor thermal comfort conditions: Introducing a fuzzy adaptive controller. Energy Build. 2004, 36, 97–102. [Google Scholar] [CrossRef]
- Choi, J.-H.; Loftness, V.; Lee, D.-W. Investigation of the possibility of the use of heart rate as a human factor for thermal sensation models. Build. Environ. 2012, 50, 165–175. [Google Scholar] [CrossRef]
- Kitagawa, K.; Komoda, N.; Hayano, H.; Tanabe, S.-I. Effect of humidity and small air movement on thermal comfort under a radiant cooling ceiling by subjective experiments. Energy Build. 1999, 30, 185–193. [Google Scholar] [CrossRef]
- Bauman, F.; Carter, T.; Baughman, A. Field Study of the Impact of a Desktop Task/Ambient Conditioning System in Office Buildings. ASHRAE Trans. 1998, 104, 1–19. [Google Scholar]
- Wyon, D.P. The effects of moderate heat stress on typewriting performance. Ergonomics 1974, 17, 309–318. [Google Scholar] [CrossRef] [PubMed]
- Wyon, D.P. Indoor environmental effects on productivity. In Proceedings of the IAQ, Baltimore, MD, USA, 6–8 October 1996. [Google Scholar]
- Walikewitz, N.; Jänicke, B.; Langner, M.; Meier, F.; Endlicher, W. The difference between the mean radiant temperature and the air temperature within indoor environments: A case study during summer conditions. Build. Environ. 2015, 84, 151–161. [Google Scholar] [CrossRef]
- Murakami, S.; Kato, S.; Zeng, J. Combined simulation of airflow, radiation and moisture transport for heat release from a human body. Build. Environ. 2000, 35, 489–500. [Google Scholar] [CrossRef]
- Tanabe, S.; Arens, E.A.; Bauman, F.; Zhang, H.; Madsen, T. Evaluating Thermal Environments by Using a Thermal Manikin with Controlled Skin Surface Temperature. ASHRAE Trans. 1994, 3739, 39–48. [Google Scholar]
- Malmqvist, T. Environmental rating methods: Selecting indoor environmental quality (IEQ) aspects and indicators. Build. Res. Inf. 2008, 36, 466–485. [Google Scholar] [CrossRef]
- Fowler, K.M.; Rauch, E.M.; Henderson, J.W.; Kora, A.R. Re-Assessing Green Building Performance: A Post Occupancy Evaluation of 22 GSA Buildings; Pacific Northwest National Lab (PNNL): Richland, WA, USA, 2010.
- Tsutsumi, H.; Tanabe, S.I.; Harigaya, J.; Iguchi, Y.; Nakamura, G. Effect of humidity on human comfort and productivity after step changes from warm and humid environment. Build. Environ. 2007, 42, 4034–4042. [Google Scholar] [CrossRef]
- Tanabe, S.; Kimura, K. Effects of Air Temperature, Humidity, and Air Movement on Thermal Comfort under Hot and Humid Conditions; American Society of Heating, Refrigerating and Air-Conditioning Engineers, Inc.: Atlanta, GA, USA, 1994. [Google Scholar]
- Rose, R.J.; Dozier, J. EPA program impacts office zoning. ASHRAE J. Am. Soc. Heat. Refrig. Air Cond. Eng. 1997, 39, 37–42. [Google Scholar]
- Witterseh, T. Environment Perception, SBS Symptoms and the Performance of Office Work under Combined Exposures to Temperature, Noise and Air Pollution. Ph.D. Thesis, Department of Mechanical Engineering, Technical University of Denmark, Lyngby, Denmark, 2001. [Google Scholar]
- Pilcher, J.J.; Nadler, E.; Busch, C. Effects of hot and cold temperature exposure on performance: A meta-analytic review. Ergonomics 2002, 45, 682–698. [Google Scholar] [CrossRef] [PubMed]
- Mendell, M.J.; Fisk, W.J.; Kreiss, K.; Levin, H.; Alexander, D.; Cain, W.S.; Milton, D.K. Improving the health of workers in indoor environments: Priority research needs for a national occupational research agenda. J. Inf. 2002, 92, 1430–1440. [Google Scholar] [CrossRef]
- Niemelä, R.; Rautio, S.; Hannula, M.; Reijula, K. Work environment effects on labor productivity: An intervention study in a storage building. Am. J. Ind. Med. 2002, 42, 328–335. [Google Scholar] [CrossRef] [PubMed]
- Tham, K.; Willem, H. Economic Returns of Improving Thermal Environment and Fresh Air Provision in the Tropics. In Proceedings of the IAQ Conference, Copenhagen, Denmark, 17–22 August 2008. [Google Scholar]
- Korhonen, I.; Parkka, J.; van Gils, M. Health monitoring in the home of the future. IEEE Eng. Med. Boil. Mag. 2003, 22, 66–73. [Google Scholar] [CrossRef]
- Jaakkola, J.J.K.; Heinonen, O.P.; Seppänen, O. Sick building syndrome, sensation of dryness and thermal comfort in relation to room temperature in an office building: need for individual control of temperature. Environ. Int. 1989, 15, 163–168. [Google Scholar] [CrossRef]
- Akimoto, T.; Tanabe, S.-I.; Yanai, T.; Sasaki, M. Thermal comfort and productivity-Evaluation of workplace environment in a task conditioned office. Build. Environ. 2010, 45, 45–50. [Google Scholar] [CrossRef]
- Federspiel, C.C.; Asada, H. Adaptable Control of HVAC Systems. U.S. Patent 5,170,935, 15 December 1992. [Google Scholar]
- Tse, W.L.; Chan, W.L. A distributed sensor network for measurement of human thermal comfort feelings. Sens. Actuators A Phys. 2008, 144, 394–402. [Google Scholar] [CrossRef]
- Wargocki, P.; Wyon, D.P.; Fanger, P.O. Pollution source control and ventilation improve health, comfort and productivity. DKV Tagungsbericht 2000, 27, 47–54. [Google Scholar]
- Frontczak, M.; Wargocki, P. Literature survey on how different factors influence human comfort in indoor environments. Build. Environ. 2011, 46, 922–937. [Google Scholar] [CrossRef]
- Lan, L.; Lian, Z.; Pan, L. The effects of air temperature on office workers’ well-being, workload and productivity-evaluated with subjective ratings. Appl. Ergon. 2010, 42, 29–36. [Google Scholar] [CrossRef] [PubMed]
- Kosonen, R.; Tan, F. Assessment of productivity loss in air-conditioned buildings using PMV index. Energy Build. 2004, 36, 987–993. [Google Scholar] [CrossRef]
- Tham, K.W.; Willem, H.C. Room air temperature affects occupants’ physiology, perceptions and mental alertness. Build. Environ. 2010, 45, 40–44. [Google Scholar] [CrossRef]
- Ngarmpornprasert, S.; Koetsinchai, W. The effect of air-conditioning on worker productivity in office buildings: A case study in Thailand. In Building Simulation; Springer: Berlin, Germany, 2010. [Google Scholar]
- Nakano, J.; Tanabe, S.; Kimura, K. Differences in perception of indoor environment between Japanese and non-Japanese workers. Energy and Build. 2002, 34, 615. [Google Scholar] [CrossRef]
- Reinikainen, L.M.; Jaakkola, J.J. Effects of temperature and humidification in the office environment. Arch. Environ. Health Int. J. 2001, 56, 365–368. [Google Scholar] [CrossRef] [PubMed]
- Gong, N.; Tham, K.W.; Melikov, A.K.; Wyon, D.P.; Sekhar, S.C.; Cheong, K.W. The Acceptable Air Velocity Range for Local Air Movement in The Tropics. HVAC R Res. 2006, 12, 1065–1076. [Google Scholar] [CrossRef]
- Newsham, G.; Mancini, S.; Veitch, J.; Marchand, R.; Lei, W.; Charles, K.; Arsenault, C. Control strategies for lighting and ventilation in offices: Effects on energy and occupants. Intell. Build. Int. 2009, 1, 101–121. [Google Scholar] [CrossRef]
- Loftness, V.; Aziz, A.; Park, J.; Cochran, E. Case Study for the David L. Lawrence Convention Center: Post Occupancy Evaluation 2011; Green Building Alliance: Pittsburgh, PA, USA, 2011. [Google Scholar]
- Park, J. Are Humans Good Sensors?: Using Occupants as Sensors for Indoor Environmental Quality Assessment and for Developing Thresholds that Matter; Carnegie Mellon University: Pittsburgh, PA, USA, 2015. [Google Scholar]
- Preiser, W. Learning from Our Buildings: A State-of-the-Practice Summary of Post-Occupancy Evaluation; National Academies Press: Washington, DC, USA, 2002; Volume 145. [Google Scholar]
- Choi, J.-H.; Loftness, V.; Aziz, A. Post-occupancy evaluation of 20 office buildings as basis for future IEQ standards and guidelines. Energy Build. 2012, 46, 167–175. [Google Scholar] [CrossRef]
- Loftness, V.; Aziz, A.; Hua, Y.; Srivastava, V.; Yang, X. GSA WP 20•20 Environmental Quality Report: Kluczynski Federal Building; US General Services Administration: Chicago, IL, USA, 2007.
- Park, J.; Wang, T.H.; Witt, A.; Loftness, V. Data Acquisition and Visualisation for IEQ Assessment. In Proceedings of the PLEA, Munich, Germany, 10–12 September 2013. [Google Scholar]
- American Society of Heating, Refrigerating and Air Conditioning Engineers (ASHRAE). Performance Measurement Protocols for Commercial Buildings; American Society of Heating, Refrigerating and Air Conditioning Engineers: New York, NY, USA, 2010. [Google Scholar]
- American Society of Heating, Refrigerating and Air Conditioning Engineers (ASHRAE). ANSI/ASHRAE Standard 55, Thermal Environmental Conditions for Human Occupancy; American Society of Heating, Refrigerating and Air Conditioning Engineers: New York, NY, USA, 2010. [Google Scholar]
- EPA. Testing for Indoor Air Quality; EPA: Washington, DC, USA, 2007.
- Fanger, P.O. Thermal Comfort; Danish Technical Press: Copenhagen, Denmark, 1970. [Google Scholar]
- Hedge, A.; Erickson, W. A study of indoor environment and sick building syndrome complaints in air conditioned offices: Benchmarks for facility performance. Int. J. Facil. Manag. 1997, 1, 185–192. [Google Scholar]
- Choi, J.; Aziz, A.; Loftness, V. Investigation on the impacts of different genders and ages on satisfaction with thermal environments in office buildings. Build. Environ. 2010, 45, 1529–1535. [Google Scholar] [CrossRef]
- Kim, J.; de Dear, R.; Candido, C.; Zhang, H.; Arens, E. Gender differences in office occupant perception of indoor environmental quality (IEQ). Build. Environ. 2013, 70, 245–256. [Google Scholar] [CrossRef] [Green Version]
- Karjalainen, S. Gender differences in thermal comfort and use of thermostats in everyday thermal environments. Build. Environ. 2007, 42, 1594–1603. [Google Scholar] [CrossRef]
- Hartkopf, V.; Loftness, V.; Aziz, A.; Park, J. Environmental Quality Report: Électricité de France, Clamart; Center for Building Performance and Diagnostics, Carnegie Mellon University: Pittsburgh, PA, USA, 2011. [Google Scholar]
- Baron, R.M.; Kenny, D.A. The moderator–mediator variable distinction in social psychological research: Conceptual, strategic, and statistical considerations. J. Pers. Soc. Psychol. 1986, 51, 1173. [Google Scholar] [CrossRef] [PubMed]
- Allison, P.D. Logistic Regression Using SAS: Theory and Application; SAS Institute: Cary, NC, USA, 2012. [Google Scholar]


| Thermal Quality | Goal | Indicator | Sources |
|---|---|---|---|
| Air Temperature (°C) | Adequate air temperature by season | Temperature management for occupant comfort | [9,26,27,28,29,30,31,32,33,34,35,36,37] |
| Thermal comfort does not only occur around thermal neutrality | [27,28,38,39,40] | ||
| Radiant Temperature (°C) | Radiant temperature management through quality windows and walls | Radiant temperature for user comfort | [41,42,43,44,45,46,47,48,49] |
| Relative Humidity (%) | Adequate humidity management | Managing relative humidity | [50,51,52,53] |
| Air Velocity (ft/min) | Avoid drafts from air diffusers or windows | Most sensitive to draught at the head region | [25] |
| Personal Control | Support individual productivity, health and user satisfaction | Temperature control | [6,20,24,25,45,46,48,52,54,55,56,57,58,59,60,61,62,63,64,65,66,67,68,69,70] |
| Humidity control | [52,59,71,72,73,74] |
| Classification | User Satisfaction Survey | Technical Attributes of Building Systems | IEQ Field Measurements |
|---|---|---|---|
| Thermal Quality | Q. Temperature in your work area: Very Dissatisfied–Dissatisfied–Somewhat Dissatisfied–Neutral–Somewhat Satisfied–Satisfied–Very Satisfied (7-point scale user satisfaction) a. Temperature during Winter: b. Temperature during Spring: c. Temperature during Summer: d. Temperature during Fall: Cold–Cool–Slightly Cold–Neutral–Slightly Warm–Warm–Hot Q. Air movement in your work area: Very Dissatisfied–Dissatisfied–Somewhat Dissatisfied–Neutral–Somewhat Satisfied–Satisfied–Very Satisfied (7-point scale user satisfaction) a. If dissatisfied with the air movement, what are the conditions: Stuffy–Drafty–Both–N/A | Size of Zone Core System Type Level of control Diffuser Density Diffuser Alignment Seasonal switchover IAQ/QA management Dedicated exhausts Level of HVAC maintenance Window Quality Window Tightness Window Controls | Air Temperature
Radiant Temperature
Radiant Temperature Asymmetry
Relative Humidity (%)
|
| General Information | Q. Age 20~29, 30~39, 40~49, 50~59, 60+ Q. Gender Female–Male Q. Job category Administrative–Technical–Professional–Managerial Q. Highest education level High School–Community College–Some University–Bachelor Degree–Graduate Degree–Doctorate Q. My department is a good place to work Q. I am satisfied with my job Strongly Disagree–Disagree–Somewhat Disagree–Neutral–Somewhat Agree–Agree–Strongly Agree | Year Built Construction type Floor-to-floor height Floor-to-ceiling height Year of last building renovation Building shape and depth | - |
| Thermal Quality | Measurement Range | Accuracy |
|---|---|---|
| Air temperature at 110 cm | −55° to +150 °C | ±0.5 °C |
| Air temperature at 60 cm | −55° to +150 °C | ±0.5 °C |
| Air temperature at 10 cm | −55° to +150 °C | ±0.5 °C |
| Air speed | Velocity: 0 to 2000 fpm (10 m/s) CFM: 0 to 99,990 CFM (99,990 m3/h) | ±5% |
| Handheld IR Temperature | −20 °C to 260 °C | ±5 °C (at 23 °C, <70% RH) |
| Relative humidity | 0 to 100% RH | ±2% RH < 80% RH (±3% RH > 80% RH) |
| General | Category | People | % |
|---|---|---|---|
| Age | 20–29 | 248 | 23.6% |
| 30–39 | 294 | 28.0% | |
| 40–49 | 244 | 23.1% | |
| 50–59 | 205 | 19.5% | |
| 60+ | 8 | 0.8% | |
| Gender | Female | 531 | 50.7% |
| Male | 519 | 49.3% | |
| Education level | High School | 10 | 0.9% |
| Community College | 166 | 15.8% | |
| Some University | 458 | 43.6% | |
| Bachelor Degree | 180 | 17.2% | |
| Graduate Degree | 237 | 22.5% | |
| Job Category | Administrative | 206 | 19.6% |
| Technical | 139 | 13.2% | |
| Professional | 390 | 37.1% | |
| Managerial | 316 | 30.1% |
| Model | Objective | Model Diagram | Statistical Method |
|---|---|---|---|
| MODEL 1 | Correlation between user satisfaction and workstation IEQ measurements |  | Ordinary Least Squares Ordered Logistic Fit Density Analysis One-way ANOVA, T-Test |
| MODEL 2 | Correlation between user satisfaction and technical attributes of building systems |  | Ordinary Least Squares Ordered Logistic Fit Contingency Analysis Pearson Correlation |
| MODEL 3 | Correlation between workstation’s IEQ measurements and technical attributes of building systems |  | Ordinary Least Squares Ordered Logistic Fit One-way ANOVA |
| MODEL 4 | Correlation of user satisfaction with the combination of building attributes and workstation IEQ measurements |  | Ordinary Least Squares Ordered Logistic Fit |
| MODEL 5 | Correlation of user satisfaction with interaction of building attributes and workstation IEQ measurements |  | Ordinary Least Squares Ordered Logistic Fit Effect Wald Test Effect Likelihood Ratio |
| Thermal Quality | Variables | Coefficient | p-Value |
|---|---|---|---|
| General | Gender | 0.22 | 0.21 |
| Location | Perimeter–Core | −0.16 | 0.44 |
| Office type | Open plan office–Closed office | 0.51 | 0.01 ** |
| Season | Winter–Spring | −0.30 | 0.32 |
| Winter–Summer | −0.49 | 0.11 | |
| Winter–Fall | −0.30 | 0.32 | |
| Size of thermal zone | More than 25 vs. 10~15 | 0.28 | 0.44 |
| More than 25 vs. 5~10 | 0.46 | 0.17 | |
| More than 25 vs. 2~5 | 1.25 | 0.01 ** | |
| More than 25 vs. Individual control | 1.49 | 0.001 *** | |
| Main System | Constant volume | 0.75 | 0.16 |
| Variable air volume/terminal reheat | −0.37 | 0.66 | |
| Separate thermal and ventilation | −0.95 | 0.57 | |
| Level of Control | Locked vs. Locked but visible thermostat | −0.12 | 0.05 * |
| Locked vs. Controllable thermostat | 2.13 | 0.93 | |
| Window Quality | Leaky, single pane vs. Moderate tight, two panes | 1.09 | 0.05 * |
| Leaky, single pane vs. Tight, three panes | 1.49 | 0.03 * | |
| NEAT Measurements | Air temperature at 110 cm | 0.10 | 0.05 * |
| Air temperature at 60 cm | 0.11 | 0.05 * | |
| Air temperature at 10 cm | 0.03 | 0.85 | |
| Relative humidity | −0.05 | 0.16 | |
| Radiant temperature of interior wall | −0.03 | 0.52 | |
| Radiant temperature of ceiling | 0.05 | 0.41 | |
| Radiant temperature of floor | 0.01 | 0.10 | |
| Radiant temperature of exterior wall | −0.03 | 0.44 | |
| Horizontal radiant temperature asymmetry | −0.13 | 0.05 * | |
| Vertical radiant temperature asymmetry | −0.10 | 0.07 |

| Thermal Quality | DF | Sum of Squares | Mean Square | F Ratio | Prob > F |
| Temperature | 6 | 23.86 | 3.98 | 2.69 | 0.0148 |
| Satisfaction Level | n | Mean | StdError | Lower | Upper |
| 95% | 25% | ||||
| Very Dissatisfied | 45 | 22.17 | 0.18 | 21.7 | 23.53 |
| Dissatisfied | 43 | 22.67 | 0.19 | 22.04 | 23.88 |
| Somewhat Dissatisfied | 54 | 22.94 | 0.17 | 22.25 | 23.96 |
| Neutral | 60 | 23.44 | 0.16 | 22.39 | 23.56 |
| Somewhat Satisfied | 41 | 23.67 | 0.19 | 23.2 | 23.95 |
| Satisfied | 47 | 24.50 | 0.18 | 23.58 | 24.95 |
| Very Satisfied | 19 | 24.83 | 0.27 | 23.5 | 25.33 |
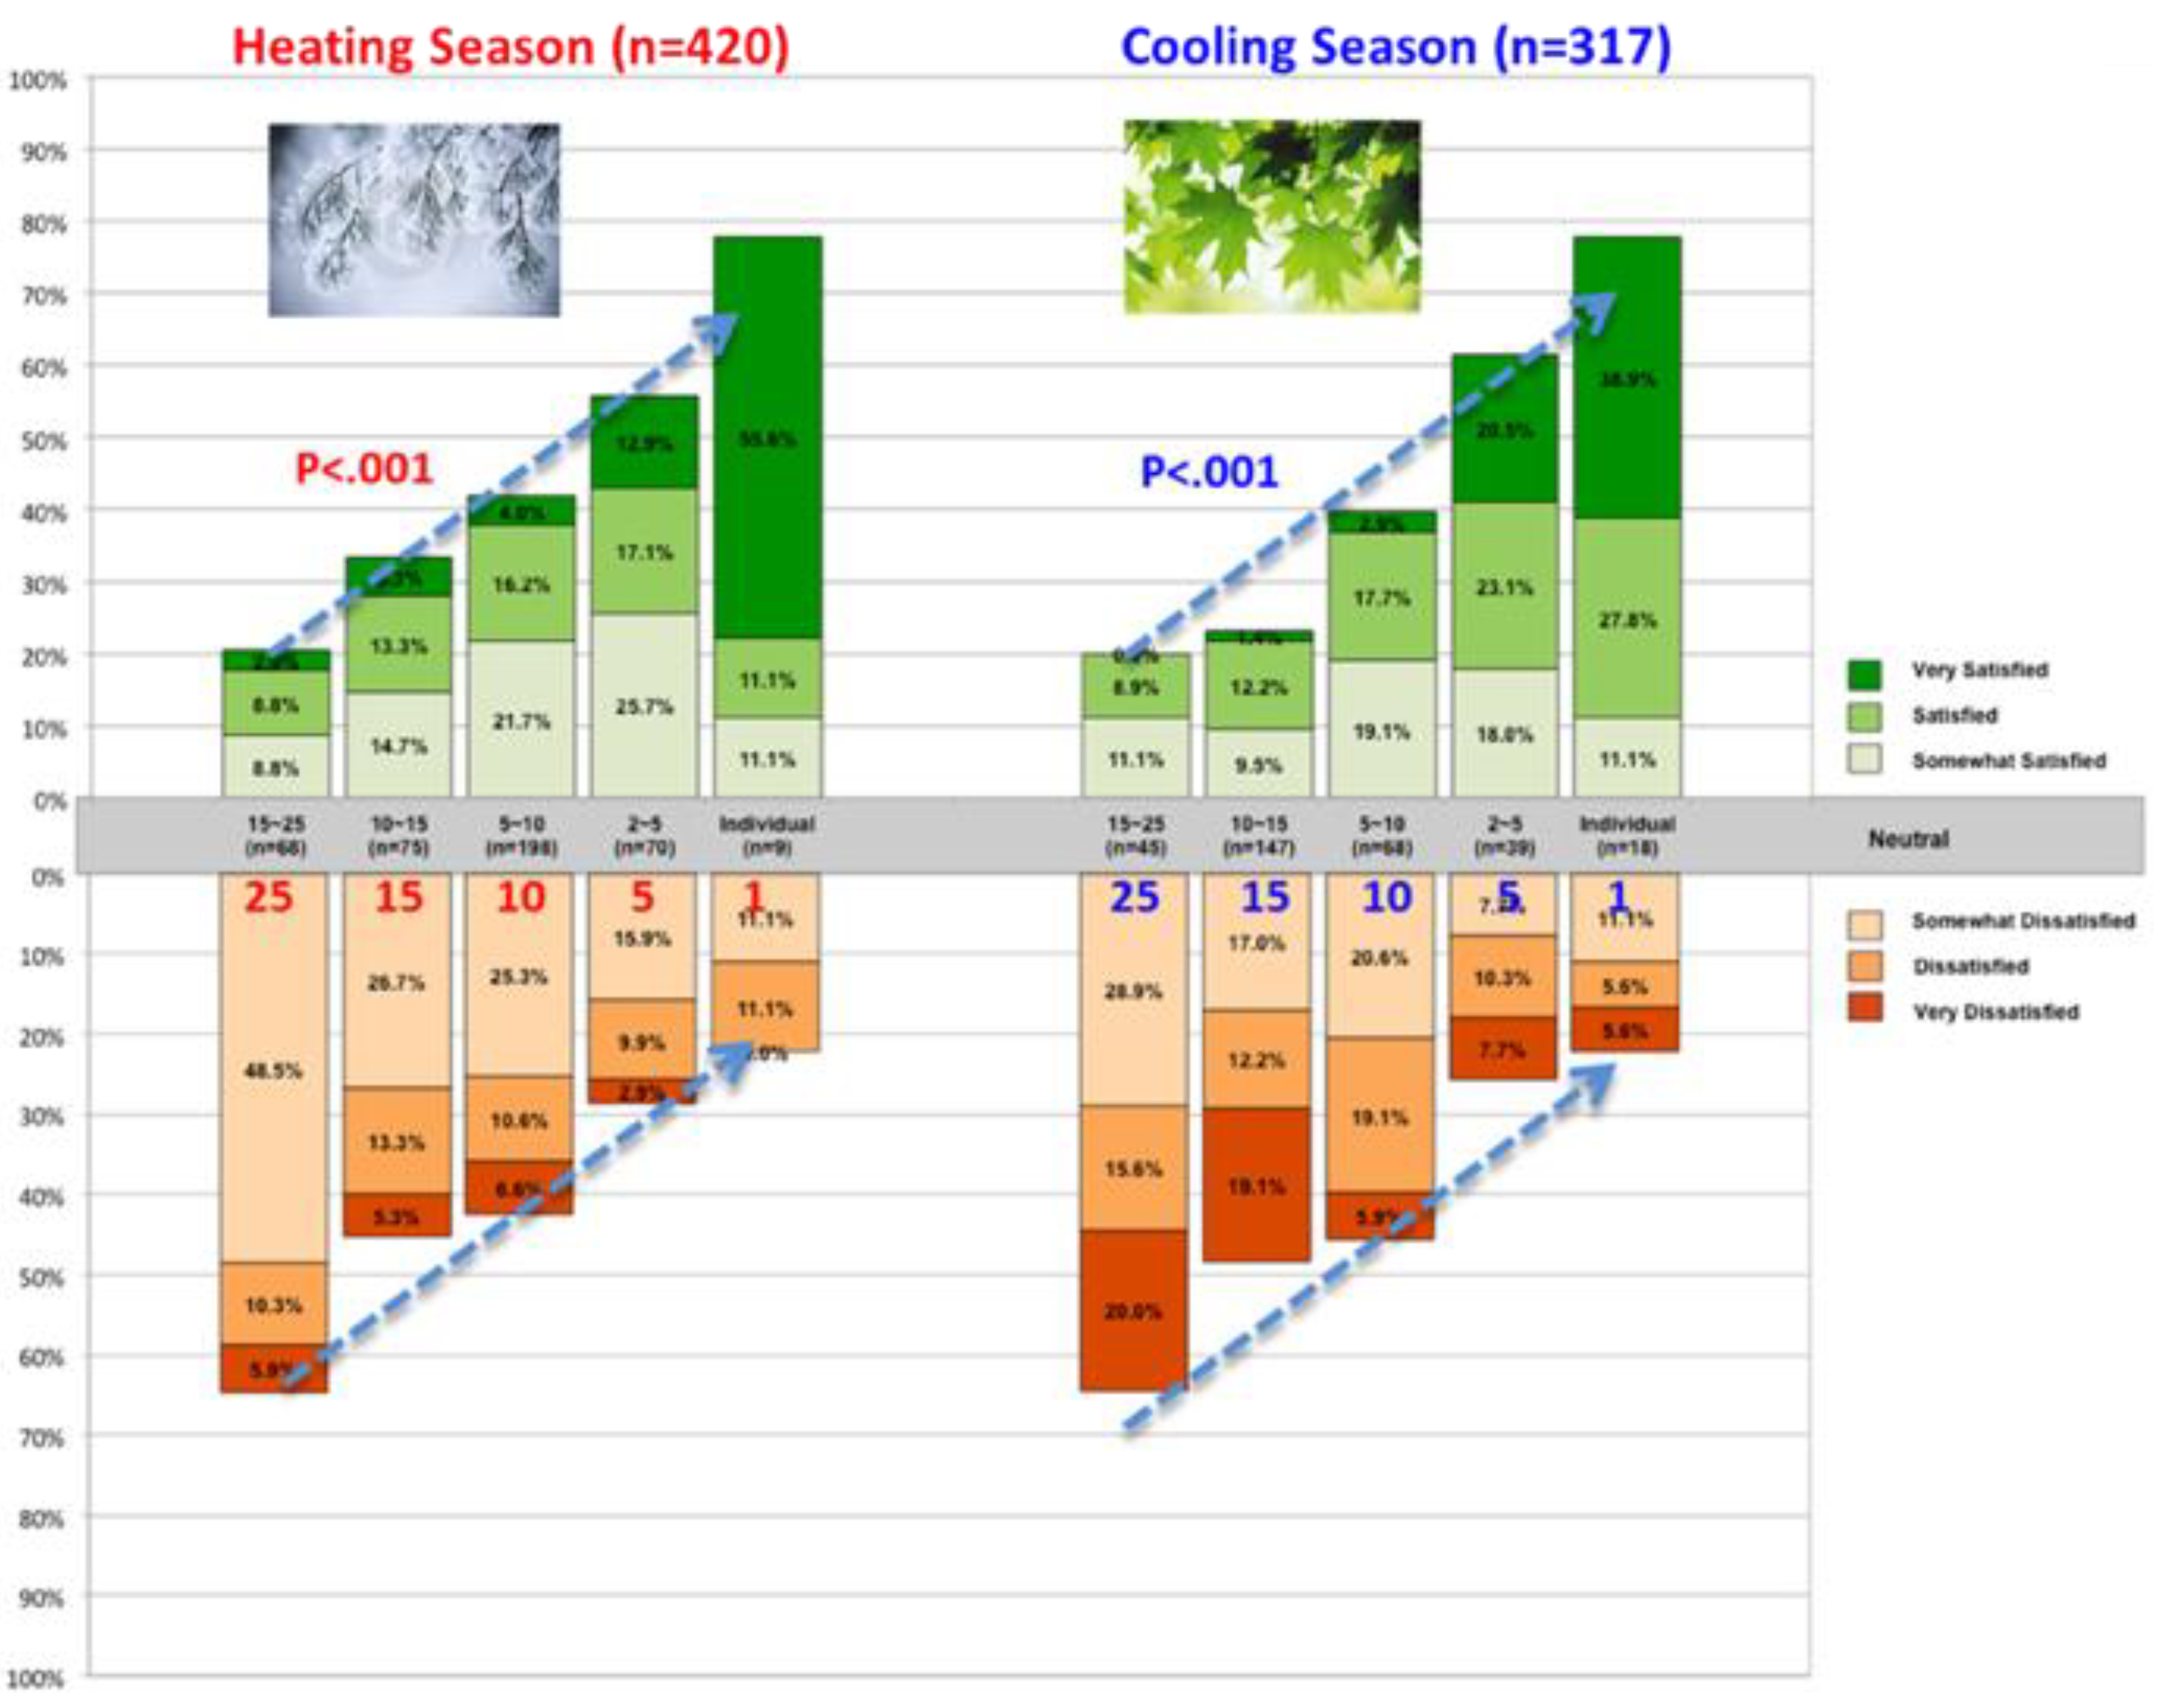
| Season | Size of Zone | n | Very Dissatisfied | Dissatisfied | Somewhat Dissatisfied | Neutral | Somewhat Satisfied | Satisfied | Very Satisfied |
|---|---|---|---|---|---|---|---|---|---|
| Heating (n = 420) | 15~25 | 68 | 5.88% | 10.29% | 48.53% | 14.71% | 8.82% | 8.82% | 2.94% |
| 10~15 | 75 | 5.33% | 13.33% | 26.67% | 21.33% | 14.67% | 13.33% | 5.33% | |
| 5~10 | 198 | 6.57% | 10.61% | 25.25% | 15.66% | 21.72% | 16.16% | 4.04% | |
| 2~5 | 70 | 2.86% | 12.86% | 22.86% | 15.71% | 25.71% | 17.14% | 2.86% | |
| Individual | 9 | 0% | 11.11% | 11.11% | 0% | 11.11% | 11.11% | 55.56% | |
| Cooling (n = 317) | 15~25 | 45 | 20% | 15.56% | 28.89% | 15.56% | 11.11% | 8.89% | 0% |
| 10~15 | 147 | 19.05% | 12.24% | 17.01% | 28.57% | 9.52% | 12.24% | 1.36% | |
| 5~10 | 68 | 5.88% | 19.12% | 20.59% | 14.71% | 19.12% | 17.65% | 2.94% | |
| 2~5 | 39 | 7.69% | 10.26% | 7.69% | 12.82% | 17.95% | 23.08% | 20.51% | |
| Individual | 18 | 5.56% | 5.56% | 11.11% | 0% | 11.11% | 27.78% | 38.89% |
| Season | n | Test Statistics | Chi-Square | Prob > ChiSq |
|---|---|---|---|---|
| Heating Season | 420 | Likelihood Ratio | 50.304 | 0.0013 ** |
| - | - | Pearson | 43.420 | 0.0089 ** |
| Cooling Season | 317 | Likelihood Ratio | 67.022 | <0.0001 *** |
| - | - | Pearson | 77.380 | <0.0001 *** |
| Season | n | Test Statistics | ChiSquare | Prob > ChiSq |
|---|---|---|---|---|
| Heating Season | 145 | Likelihood Ratio | 34.542 | 0.0755 |
| Female (clo: 1.1) | - | Pearson | 40.889 | 0.0171 * |
| Swing Season | 151 | Likelihood Ratio | 44.235 | 0.0072 * |
| Female (clo: 0.8) | - | Pearson | 45.237 | 0.0055 * |
| Cooling Season | 126 | Likelihood Ratio | 67.775 | <0.0001 *** |
| Female (clo: 0.5) | - | Pearson | 62.828 | <0.0001 *** |
| Level of Thermal Control (n = 1004) | |||
|---|---|---|---|
| Type | Hidden Thermostat | Locked But Visible Thermostat | Controllable Thermostat |
| N, Ratio (%) | n = 656 (65%) | n = 170 (17%) | n = 178 (18%) |
| Office type | 484 open offices 172 closed offices | 110 open offices 60 closed offices | 60 open offices 118 closed offices |
| Office Type | Thermal Control | n | Very Dissatisfied | Dissatisfied | Somewhat Dissatisfied | Neutral | Somewhat Satisfied | Satisfied | Very Satisfied |
|---|---|---|---|---|---|---|---|---|---|
| Open-plan (n = 654) | Hidden | 440 | 6.4% | 15.5% | 23.2% | 19.5% | 15.5% | 15.0% | 5.0% |
| Locked | 74 | 16.2% | 13.5% | 32.4% | 10.8% | 16.2% | 8.1% | 2.7% | |
| Controllable | 116 | 3.4% | 6.9% | 20.7% | 3.4% | 19.0% | 37.9% | 8.6% | |
| Closed (n = 350) | Hidden | 208 | 7.7% | 7.7% | 31.7% | 17.3% | 12.5% | 16.3% | 6.7% |
| Locked | 88 | 9.1% | 27.3% | 40.9% | 6.8% | 6.8% | 6.8% | 2.3% | |
| Controllable | 38 | 11.1% | 0.0% | 25.9% | 11.1% | 18.5% | 7.4% | 25.9% |
| Level of Control | n | Test Statistics | Chi Square | Prob > ChiSq |
|---|---|---|---|---|
| Open-plan Office | 654 | Likelihood Ratio | 47.242 | 0.0002 ** |
| - | - | Pearson | 42.202 | 0.0010 ** |
| Closed Office | 350 | Likelihood Ratio | 32.951 | 0.0169 * |
| - | - | Pearson | 33.022 | 0.0166 * |
| Thermal | DF | Sum of Squares | Mean Square | F Ratio | Prob > F |
| Temperature | 6 | 135.8 | 13.74 | 1.58 | <0.001 |
| User Satisfaction | n | Mean | Std. Error | Lower 95% | Upper 25% |
| Very Dissatisfied | 29 | 2.04 | 0.3 | 1.56 | 2.52 |
| Dissatisfied | 40 | 2.24 | 0.26 | 1.75 | 2.73 |
| Somewhat Dissatisfied | 95 | 2.03 | 0.17 | 1.71 | 2.36 |
| Neutral | 65 | 1.87 | 0.2 | 1.48 | 2.26 |
| Somewhat Satisfied | 69 | 1.27 | 0.2 | 0.88 | 1.63 |
| Satisfied | 62 | 1.19 | 0.21 | 0.8 | 1.59 |
| Very Satisfied | 31 | 0.88 | 0.29 | 0.32 | 1.45 |
| Thermal Quality Satisfaction Prediction |
|---|
 |
| Variables | Contrast | t-Ratio | p-Value |
|---|---|---|---|
| Size of Zone | 0.627 | 4.804 | 0.002 ** |
| Perimeter vs. Core office × Temperature asymmetry between the exterior and interior walls | 0.375 | 2.872 | 0.007 ** |
| Size of Zone × (Air temperature at 60 cm)2 | −i.307 | −3.353 | 0.022 * |
| Window quality | 0.291 | 2.230 | 0.030 * |
| Temperature asymmetry between the exterior and interior walls × (Air temperature at 60 cm)2 | −i.274 | −2.097 | 0.041 * |
| Open workstation vs. Closed office | 0.270 | 2.071 | 0.044 * |
| Open workstation vs. Closed office × Perimeter vs. Core office × (Air temperature at 60 cm)2 | 0.264 | 2.020 | 0.048 * |
| Perimeter vs. Core office × Air temperature at 60 cm × Temperature asymmetry between the exterior and interior walls | 0.222 | 1.699 | 0.095 |
| Measured IEQ (NEAT) | Technical Attributes of Building Systems (TABS) | User Satisfaction Questions (COPE) |
|---|---|---|
|
|
|
| IEQ Measurements | Thresholds for Highest Satisfaction (Given 64 Office Buildings) | Recommended Level (Standards) | |
|---|---|---|---|
| Air temp at 60 cm in heating season | 22.6–23.2 °C (Female) | 22.2–22.8 °C (Male) | 20–27 °C (ASHRAE 55-2013) |
| Air temp at 60 cm in cooling season | 24.5–25.0 °C (Female) | 24.3–24.7 °C (Male) | 23–28 °C (ASHRAE 55-2013) |
| Horizontal radiant temperature asymmetry (cool wall) | <1.77 °C (Female) | <2.23 °C (Male) | <10 °C (ASHRAE 55-2013) |
| <2.16 °C (Overall) | <10 °C (ASHRAE 55-2013) | ||
© 2018 by the authors. Licensee MDPI, Basel, Switzerland. This article is an open access article distributed under the terms and conditions of the Creative Commons Attribution (CC BY) license (http://creativecommons.org/licenses/by/4.0/).
Share and Cite
Park, J.; Loftness, V.; Aziz, A. Post-Occupancy Evaluation and IEQ Measurements from 64 Office Buildings: Critical Factors and Thresholds for User Satisfaction on Thermal Quality. Buildings 2018, 8, 156. https://doi.org/10.3390/buildings8110156
Park J, Loftness V, Aziz A. Post-Occupancy Evaluation and IEQ Measurements from 64 Office Buildings: Critical Factors and Thresholds for User Satisfaction on Thermal Quality. Buildings. 2018; 8(11):156. https://doi.org/10.3390/buildings8110156
Chicago/Turabian StylePark, Jihyun, Vivian Loftness, and Azizan Aziz. 2018. "Post-Occupancy Evaluation and IEQ Measurements from 64 Office Buildings: Critical Factors and Thresholds for User Satisfaction on Thermal Quality" Buildings 8, no. 11: 156. https://doi.org/10.3390/buildings8110156