Article

The Impact of Insulation and HVAC Degradation on Overall Building Energy Performance: A Case Study

by
Georgios Eleftheriadis
1,2,* and
Mohamed Hamdy
2,3
1
Department of Process Sciences, Technische Universität Berlin, Straße des 17. Juni 135, 10623 Berlin, Germany
2
ECOGLOBE GmbH, Bismarckstraße 10-12, 10625 Berlin, Germany
3
NTNU Norwegian University of Science and Technology, Department of Civil and Environmental Engineering, Høgskoleringen 1, 7491 Trondheim, Norway
*
Author to whom correspondence should be addressed.
Buildings 2018, 8(2), 23; https://doi.org/10.3390/buildings8020023
Submission received: 30 December 2017 / Revised: 24 January 2018 / Accepted: 29 January 2018 / Published: 2 February 2018

Abstract

:
Through monitoring of buildings, it can be proven that the performance of envelope elements and energy supply systems deteriorates with time. The results of this degradation are higher energy consumption and life cycle costs than projected in the building design phase. This paper considers the impacts of this deterioration on the whole building energy performance with the goal of improving the accuracy of long term performance calculations. To achieve that, simplified degradation equations found in literature are applied on selected envelope elements and heating system components of a single-family house in Germany. The energy performance of the building over 20 years is determined through simulations by EnergyPlus and MATLAB. The simulation results show that, depending on maintenance and primary heating system, the building can consume between 18.4% and 47.1% more primary energy over 20 years compared to a scenario in which no degradation were to occur. Thus, it can be concluded that considering performance drop with time is key in order to improve the decision-making process when designing future-proof buildings.

1. Introduction

The building sector is responsible for approximately 40% of the total energy consumption in the European Union (EU) [1]. Due to this fact, improving the energy performance of buildings is key in reaching the EU target of 20-20-20 (20% CO2 emissions reduction, 20% increase in energy efficiency and 20% more energy from renewable sources until the year 2020 compared to the levels of 1990) [2]. As a means of achieving this goal, the Energy Performance of Building Directive 2010/31/EU, (EPBD) recast [3] obliges EU member states to evaluate their national requirements on the energy performance of buildings following the so-called “cost optimal methodology”. The methodology framework was published as EU supplementary EBPD recast in 2012 [4] and, subsequently, the member states assessed their national requirements as of 30 June 2012 and submitted the respective reports [5].
In Germany, the energy consultancy Ecofys evaluated the requirements of the German Energy Saving Ordinance that was active at that time (EnEV 2009) on behalf of the Federal Ministry of Transport, Building and Urban Development by applying the aforementioned methodology to various standard building types [6]. Additionally, since the energy efficiency of buildings can be increased either by improving envelope thermal properties or by upgrading the technical equipment, different energy efficiency measures and measure packages were compared as part of this study.
However, the calculations according to EnEV do not completely depict reality. For that reason, applying building energy simulations can be a first step toward achieving higher accuracy. Nonetheless, there are various uncertainty sources that can influence the building performance assessment process. Some of these sources, such as the impact of climate change on future considerations [7,8] have already been examined to a satisfactory level. Still, there are others that are yet to be put under thorough examination, one of them being the ageing of buildings and their components.
The performance of both building envelope elements and energy supply systems deteriorates with time as a result of natural ageing, mismanagement and poor maintenance [9]. This decline can best be defined as “performance degradation”. It leads to lower energy efficiency and higher life cycle costs than projected, since its effects are generally not being taken into consideration, neither by energy calculation norms nor by conventional simulation models or existing optimization concepts [2,10,11].
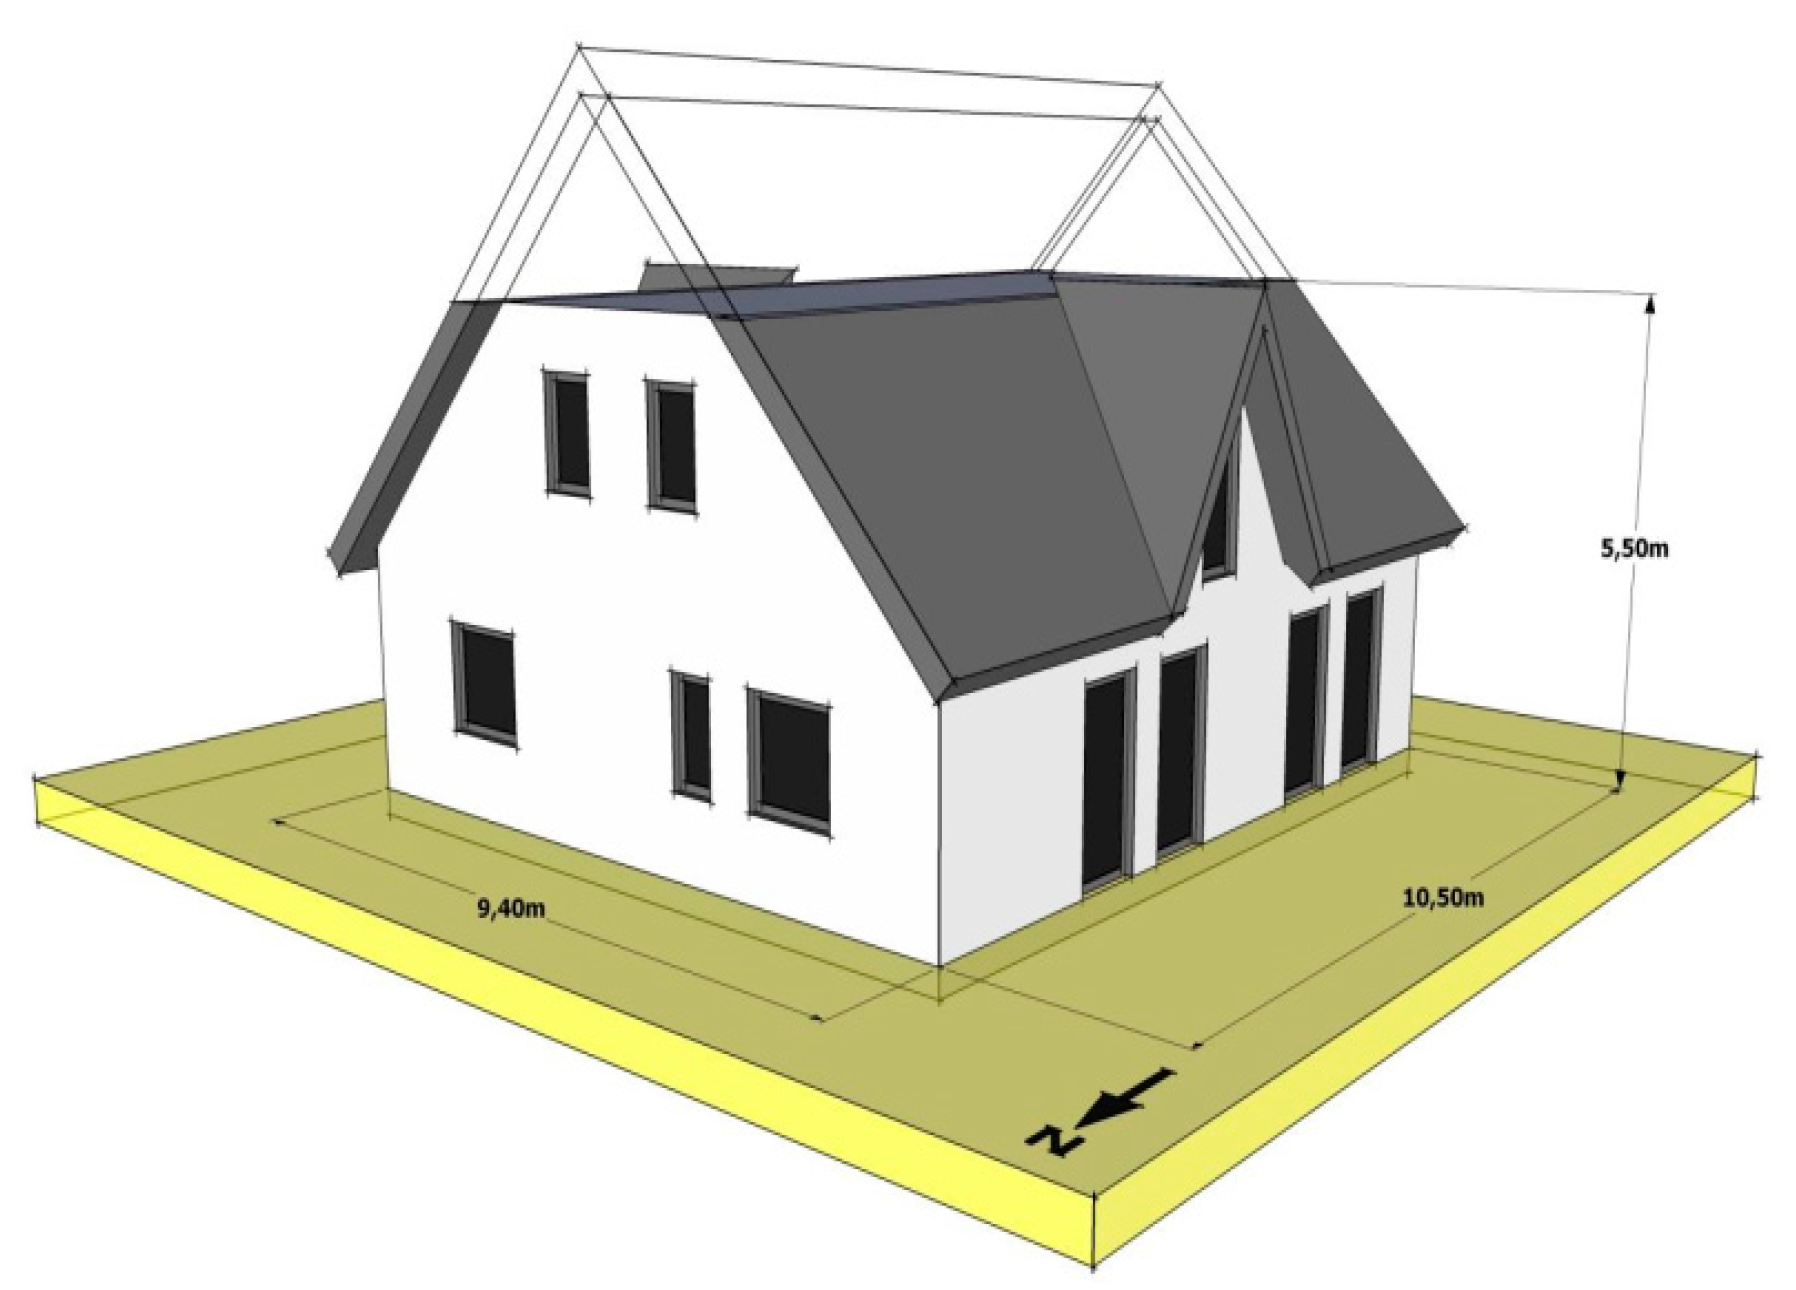
The purpose of this paper is the simplified examination of the impact of performance degradation of selected components on the overall building energy performance. First, a short review on building performance degradation is carried out. Subsequently, the building considered for the case study (a single-family house in Germany) and the model used for simulating its energy performance are introduced. Finally, the way in which degradation is considered in the simulations is described, and the results of the predicted building energy performance are presented. The assessment of these results leads to first conclusions about the extent of the impact of degradation on the long-term energy performance of buildings.

2. Review of Building Performance Degradation

As mentioned, the impact of building ageing on its energy efficiency is generally neglected in current performance assessments. Nevertheless, some studies examine the influence of degradation on whole building thermal performance while also taking climate change into account [9,12]. De Wilde et al. [12] use the open source building simulation software EnergyPlus V 5.0 to simulate the performance of a supermarket in Plymouth, UK, over 40 years, while the IDA ICE model is implemented by Waddicor et al. [9] for the energy performance simulations of a library building in Turin, Italy, over 50 years. In a thesis by Magnuson, [13] the impact of heating, ventilation, and air conditioning (HVAC) component degradation on two buildings of the University of Kansas in Lawrence, Kansas, USA, is examined. Here, as well as in [9], simple deterministic models are applied for degradation consideration, whereas in [12] both a deterministic and a stochastic method are used. Regardless of the used degradation models, these three studies conclude that building energy performance is very sensitive to its ageing and particularly to the degradation of mechanical components used for heating, ventilation, and air conditioning (HVAC).
The amount of reviewed studies is not sufficient for drawing definite conclusions on the impact of ageing on the whole building energy performance. Hence, a more thorough examination of the degradation of the single building elements is needed for predicting building long term performance. Even though there is limited amount of quantitative data available on the long-term performance of single building elements and mechanical components [12], there are studies that deal with the degradation of some of them. An overview of such studies on HVAC systems and different insulation types can be found in [14]. According to this article, the components for which the most reliable degradation values are available are boilers and heat pumps. As far as insulation is concerned, the ageing of extruded polystyrene (XPS), polyisocyanurate (PIR), polyurethane (PUR), and vacuum insulation panels (VIPs) has been reviewed to a satisfactory level.
Generally, HVAC performance deteriorates with time because of natural ageing and wear due to operation. This performance degradation is expressed by a drop in the Coefficient of Performance (COP) of an HVAC system. Struck et al. [15] present a method for predicting the COP drop of HVAC systems over their lifetime. According to this study, long-term HVAC performance depends on part load performance and annual COP drop expressed by a degradation factor. Similar degradation factors that take maintenance quality into account are applied by the national renewable energy laboratory (NREL) of the US department of energy to equations predicting performance decline over time. These equations can be of either linear [16] or exponential [17] nature. Indeed, there are many causes of performance decline associated with inadequate maintenance, especially for heat pumps and chillers. These include fouling in the condenser tube [18] as well as oil fouling on heat exchangers due to leaks from the compressor [19]. Wang et al. [20] quantify the effect of such issues and present the results on the simulated energy consumption of an office building in Chicago, USA. An additional cause of COP drop is the change in ground temperature in the case where ground is used as an energy source [21].
The degradation of the building envelope elements comes as a result of the external and internal climate of the building. The external climate factors that impact the envelope include but are not limited to solar radiation, extreme temperatures, moisture, and pollution. The internal environment is dependent upon both the external climate and occupant behavior [22]. The performance decline of insulation can best be quantified by conducting accelerated climate ageing tests in the laboratory. Singh et al. [23] apply the simulation software Agesim in addition to such laboratory measurements in order to predict future performance of XPS and polyisocyanurate (PIR) boards. Results from this and other studies show that the largest amount of performance degradation of most insulation elements occurs during the first two years after installation.
The different degradation characteristics of three vaccum insulation panel (VIP) barrier envelope types after subjection to high temperature, alkali, and stress concentration were investigated by Li et al. [24]. Their main conclusion was that the combination of increased temperature and alkalinity leads to the highest degradation rates. In an assessment of the performance of VIPs after five years of installation, Molletti et al. [25] reported a degradation of 10%. As far as glass wool insulation is concerned, Stazi et al. [26] carried out an experimental study on buildings constructed in the 1980s with a glass wool insulation layer in the envelope cavity. One key finding of this study was that the thermal conductivity has risen by 12% during the investigated time frame. Finally, Lakatos [27] assessed the impact of moisture accumulation on aerogel blankets and found out that the thermal resistance of insulation elements decreases by at least 20% if they contain at least 20% moisture and that wall surface heat transfer coefficient changes with 1 W/m2∙K if 0.28 kg of water are sprayed on it.

3. The Case Study

3.1. Building Description

In order to study the effect of ageing on building performance by means of energy simulations one of the buildings assessed in the report by the Federal Ministry of Transport, Building and Urban Development is selected. It is a single-family house located in Würzburg, Germany, and has a usable area of 148.8 m2, according to EnEV calculations. The specifications regarding building structural design and geometry are taken from the German national building database [28]. The most important data regarding building geometry is presented in Figure 1 and Table 1.
Since the goal of the report by the German ministry was the assessment of the EnEV requirements, the assumed building envelope and HVAC specifications for this report are exactly the ones defined for the reference building in DIN V 18599. DIN V 18599 is the German norm where the standard calculation procedure for the energy assessment of buildings according to EnEV is documented. The same energy-relevant data is being used for the purposes of the current case study. The resulting building configuration is shown in Table 2.
Apart from the required U-values, there are no further specifications regarding the used insulation material. Therefore, the thicknesses of envelope elements with given thermal properties have to be adapted in order to achieve these U-values. Furthermore, the effects of thermal bridging have to be taken into account by adding 0.05 W/m2∙K to each envelope element’s U-value.
For the purposes of the current article, it was decided to assess the performance deterioration of condensing gas boilers, air-source heat pumps, and XPS insulation. In addition to the sufficient literature on these elements, all three of them are widely used in buildings in Germany. Hence, the assessment of their ageing on the energy performance of the case study building can increase accuracy when planning real buildings in this country. A detailed description of the XPS thermal insulation properties and the insulation thicknesses required to reach the U-values for the envelope elements as listed in Table 1 is provided in Table 3.

3.2. Building Energy Model (BEM)

3.2.1. BEM Characteristics

The energy consumption for lighting, appliances and other equipment is not considered in EnEV and, as a consequence, in the report of the German ministry. Hence, the energy model is used to simulate only the thermal performance of the building. This is being done through the combined use of the advanced building simulation software EnergyPlus V 5.0 and MATLAB. EnergyPlus V 5.0 is responsible for carrying out an annual dynamic thermal simulation with a time step of six per hour to determine the building heating energy demand. For the heating energy demand simulation, it is assumed that the building HVAC system can meet all thermal loads (ideal heating system). The data used for approximating the outdoor weather conditions is derived from the German reference climate tables in DIN V 18599. The modeled building consists of two thermal zones, one for each floor, while the mechanical ventilation rate is set at 0.33, and the natural infiltration rate at 0.17 air changes per hour. The fact that only the heating energy demand is an EnergyPlus simulation output means that neither the electricity consumption of the ventilation system nor the fuel (natural gas or electricity) consumption of the central heating component are part of the EnergyPlus simulation.
The simulated results for the building heating energy demand flow into MATLAB for post-processing. Here, the performance of the heating system is emulated using annual system efficiency factors that take distribution losses into account and are derived from the respective calculations in the German ministry report. This way, the energy consumption for heating and domestic hot water is determined. For the reference building from the German ministry report, a condensing boiler is used as the central component with annual system efficiency amounting to 89%. Additionally, the electricity consumption of the ventilation system is calculated according to the assumed mechanical ventilation rate. Finally, the primary energy factors of 1.1 for natural gas and 2.6 for electricity, as listed in EnEV 2009, are applied in order to calculate the primary energy consumption.

3.2.2. BEM Validation

In order to validate the EnergyPlus energy model, the simulated heating energy demand has to be compared with the demand found in the German ministry report. The latter is the result of calculations conducted in accordance with DIN V 18599, using suitable software. The initial simulation of the reference building and comparison with the calculations made by the German government yields the results shown in Table 4 for the heating energy demand.
The observed deviation of 0.09% can be rated as negligible. However, when simulating the building energy performance after implementation of energy-saving measure packages, deviations of up to 28% can be observed, as shown in Table 5.
It is evident that these deviations are the largest in cases where the U-values of the envelope elements are reduced significantly. Thus, it can be stated that calculations according to EnEV 2009 overestimate the positive influence of insulation improvement on building energy demand, at least when compared to the simulation results. Since the envelope elements’ thermal properties deteriorate with time, it is important that these deviations in heating demand are corrected before considering degradation impact on building energy performance. After application of a fitting equation for correcting the simulated heating demand, the deviations for reference building and Packages 1–3 lie at −1.87%, 5%, 1.75%, and −3.6%, respectively, which can be viewed as acceptable. The heating demand for the simulated reference building is now 74.85 kWh/m2∙a.

3.3. Consideration of Performance Degradation in BEM

After the successful validation of the building energy model, modifications can be undertaken in order for performance degradation of selected envelope elements and heat supply systems to be taken into account. As mentioned, the degradation of a condensing gas boiler, an air-source heat pump, and XPS insulation is taken into account for the purposes of this article. This means that in addition to the presented reference building with a condensing gas boiler as primary heating system, the same building with an air source heat pump as central heating component has to be simulated. Since maintenance quality is a major factor influencing the long-term performance of HVAC components, it is fitting to cover the extremes by considering one scenario with annual professional maintenance and one with poor maintenance for the building primary heating component. On the other hand, the building envelope configuration remains the same for all assessments. Thus, four different scenarios in total are assessed in respect to building energy performance over a life span of 20 years.
For the examined heat pump and boiler, it was decided that the exponential degradation model presented in [17] is the most suitable for predicting future performance, since the frequency of faults and failures in mechanical components is low during the first years of operation and sharply increases during the last ones. The exponential equation applied is the following:
Eff = BaseEff∙(1 − M)age,
with Eff being the annual efficiency (SEER, EER, HSPF, AFUE) of the equipment at a certain age, and BaseEff the efficiency of the Pre-Retrofit equipment when new. M is the factor used to consider the impact of maintenance quality, and age is the age of the equipment in years.
Performance degradation of insulation material can be expressed as a rise in thermal conductivity (λ) with time. A function expressing this relationship for XPS can be developed by fitting data from [23]. As a first step, the λ-values found there have to be multiplied by a factor of 1.59. This is done because the listed thermal conductivity for the first year has a value of 0.022 W/m·K, while it is assumed to lie at 0.035 W/m·K for the purposes of the current study. Subsequently, the polyfit function of MATLAB is used to determine the correct equation.
λage = 1/(−0.000097502∙(age − 1)5 + 0.0054∙(age − 1)4 − 0.1126∙(age − 1)3 + 1.0895∙(age − 1)2 − 4.9677∙(age − 1) + 28.7371)∙W/m∙K.
The scenarios that result for the different central heating components and maintenance levels as well as the respective total energy and primary energy consumption for the first year of operation are shown in Table 6. Since the building envelope remains unchanged, the heating demand lies at 74.85 kWh/m2.a for all four cases, as presented in Section 3.2.2.

4. Results

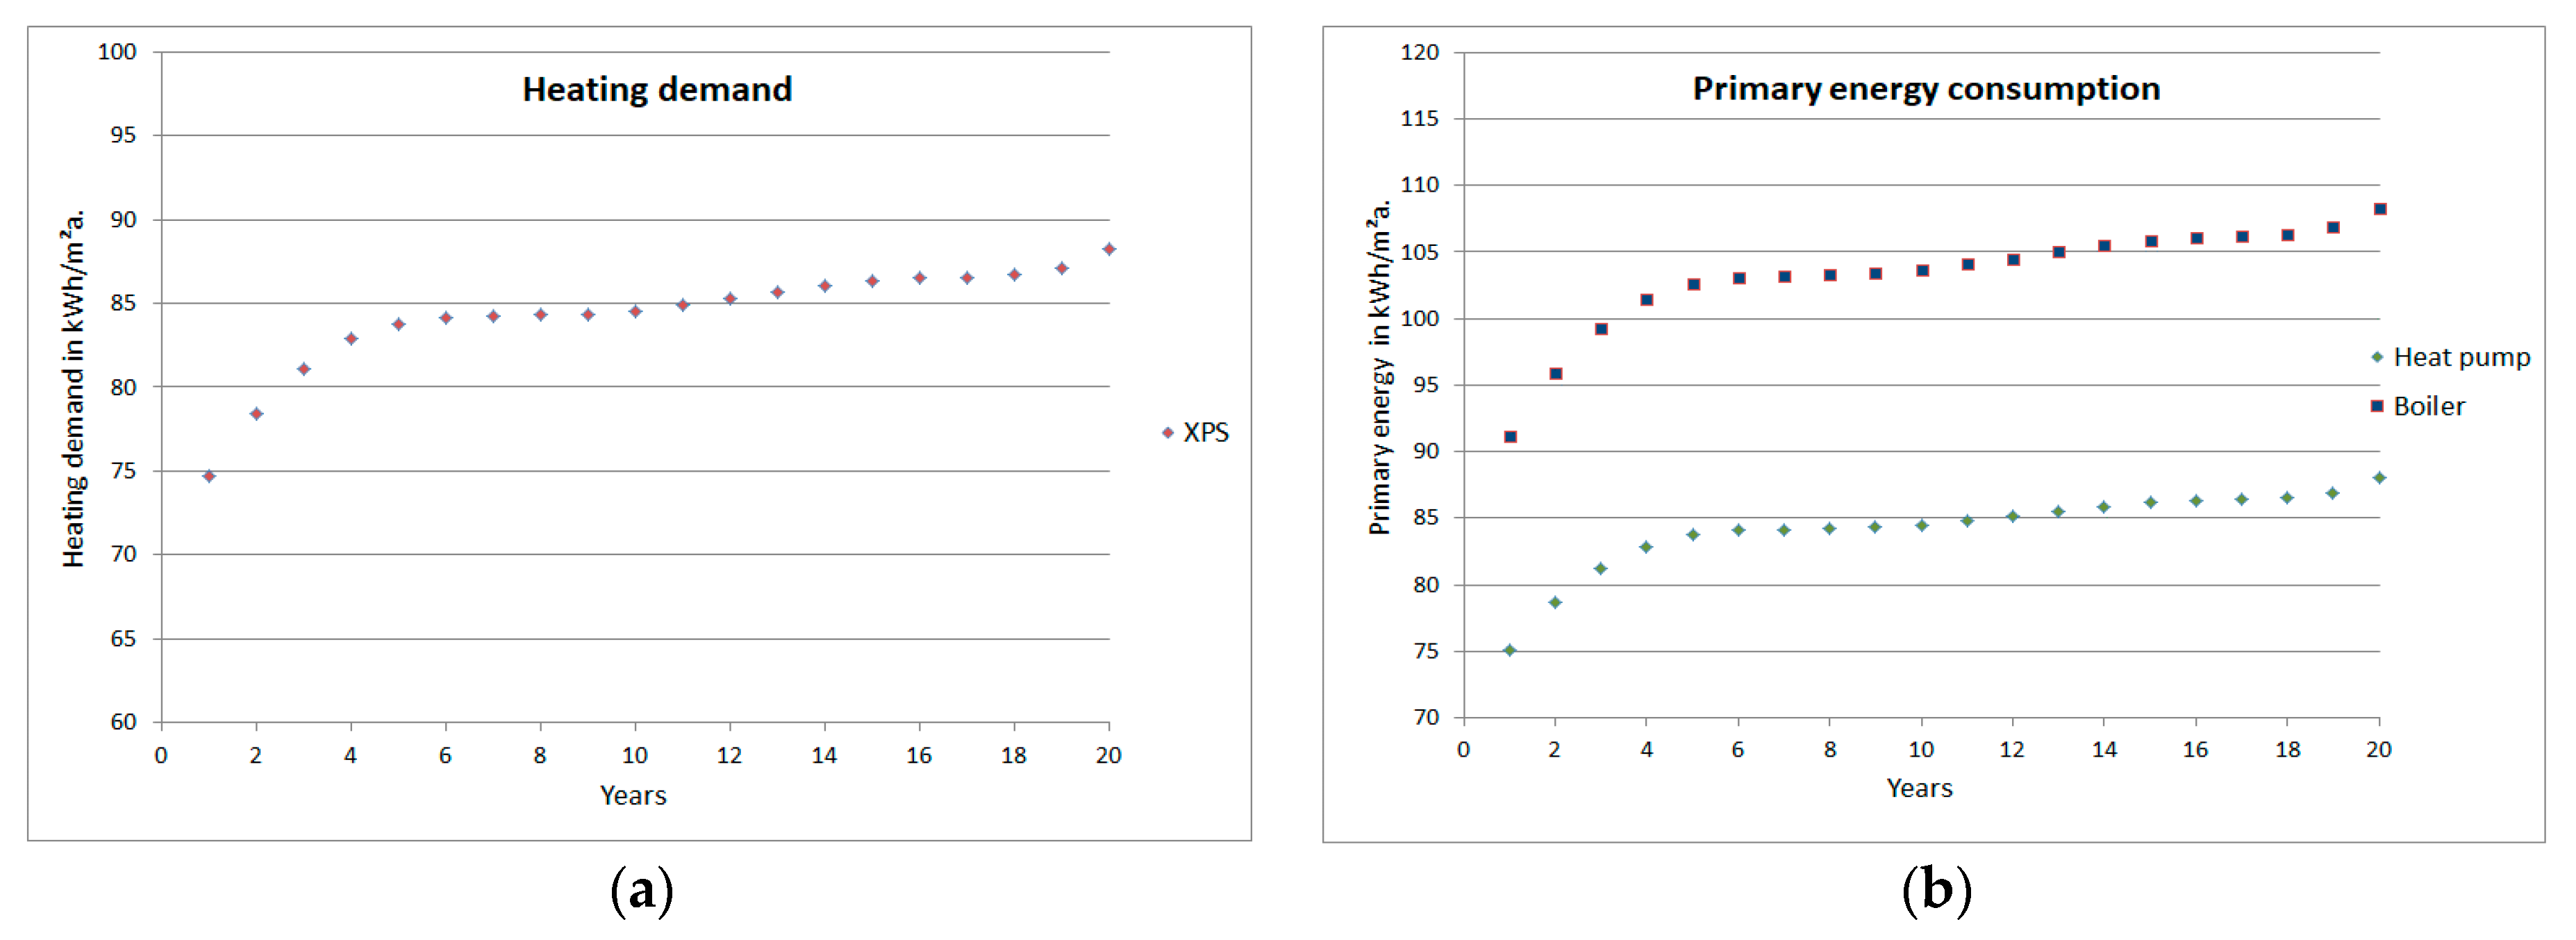
As a first step, the impact of the performance decline of single elements on building energy consumption for heating, DHW and ventilation over 20 years is examined. The effect of insulation thermal conductivity rise is shown in 
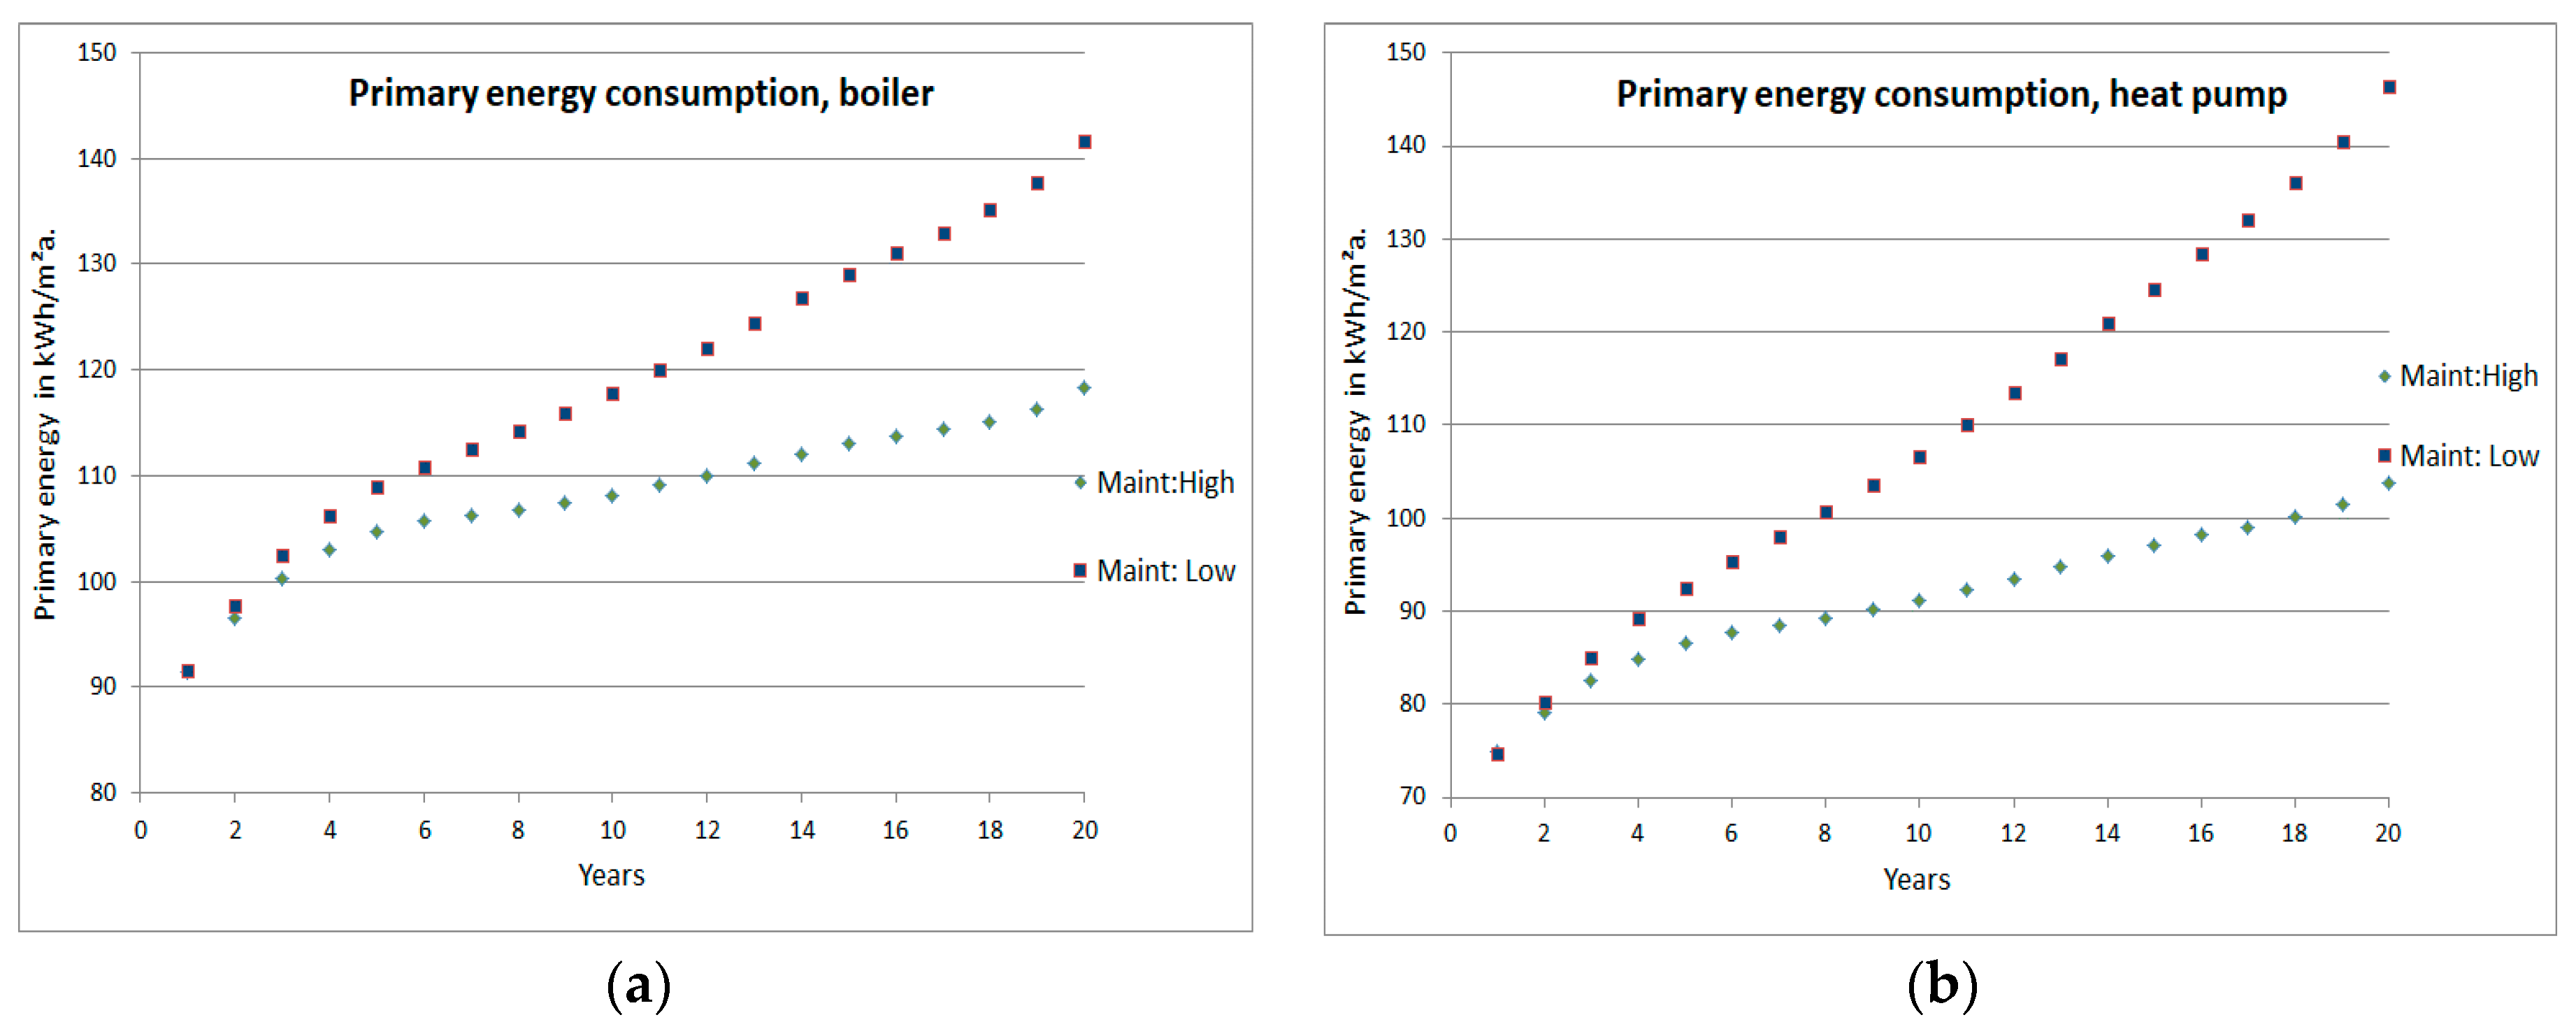
Figure 2, while the results of the efficiency drop of boiler and heat pump for the two different maintenance scenarios are presented in Figure 3.
In Table 7, an overview of the key results regarding single building element degradation is provided. It is worth noting that the building can consume up to 29.7% more primary energy than expected over the life cycle of 20 years, if air-source heat pump is the central heating component and it is not maintained properly. Additionally, the energy savings of the heat pump system compared to the boiler system are nullified after 20 years in the case that both components undergo poor maintenance.
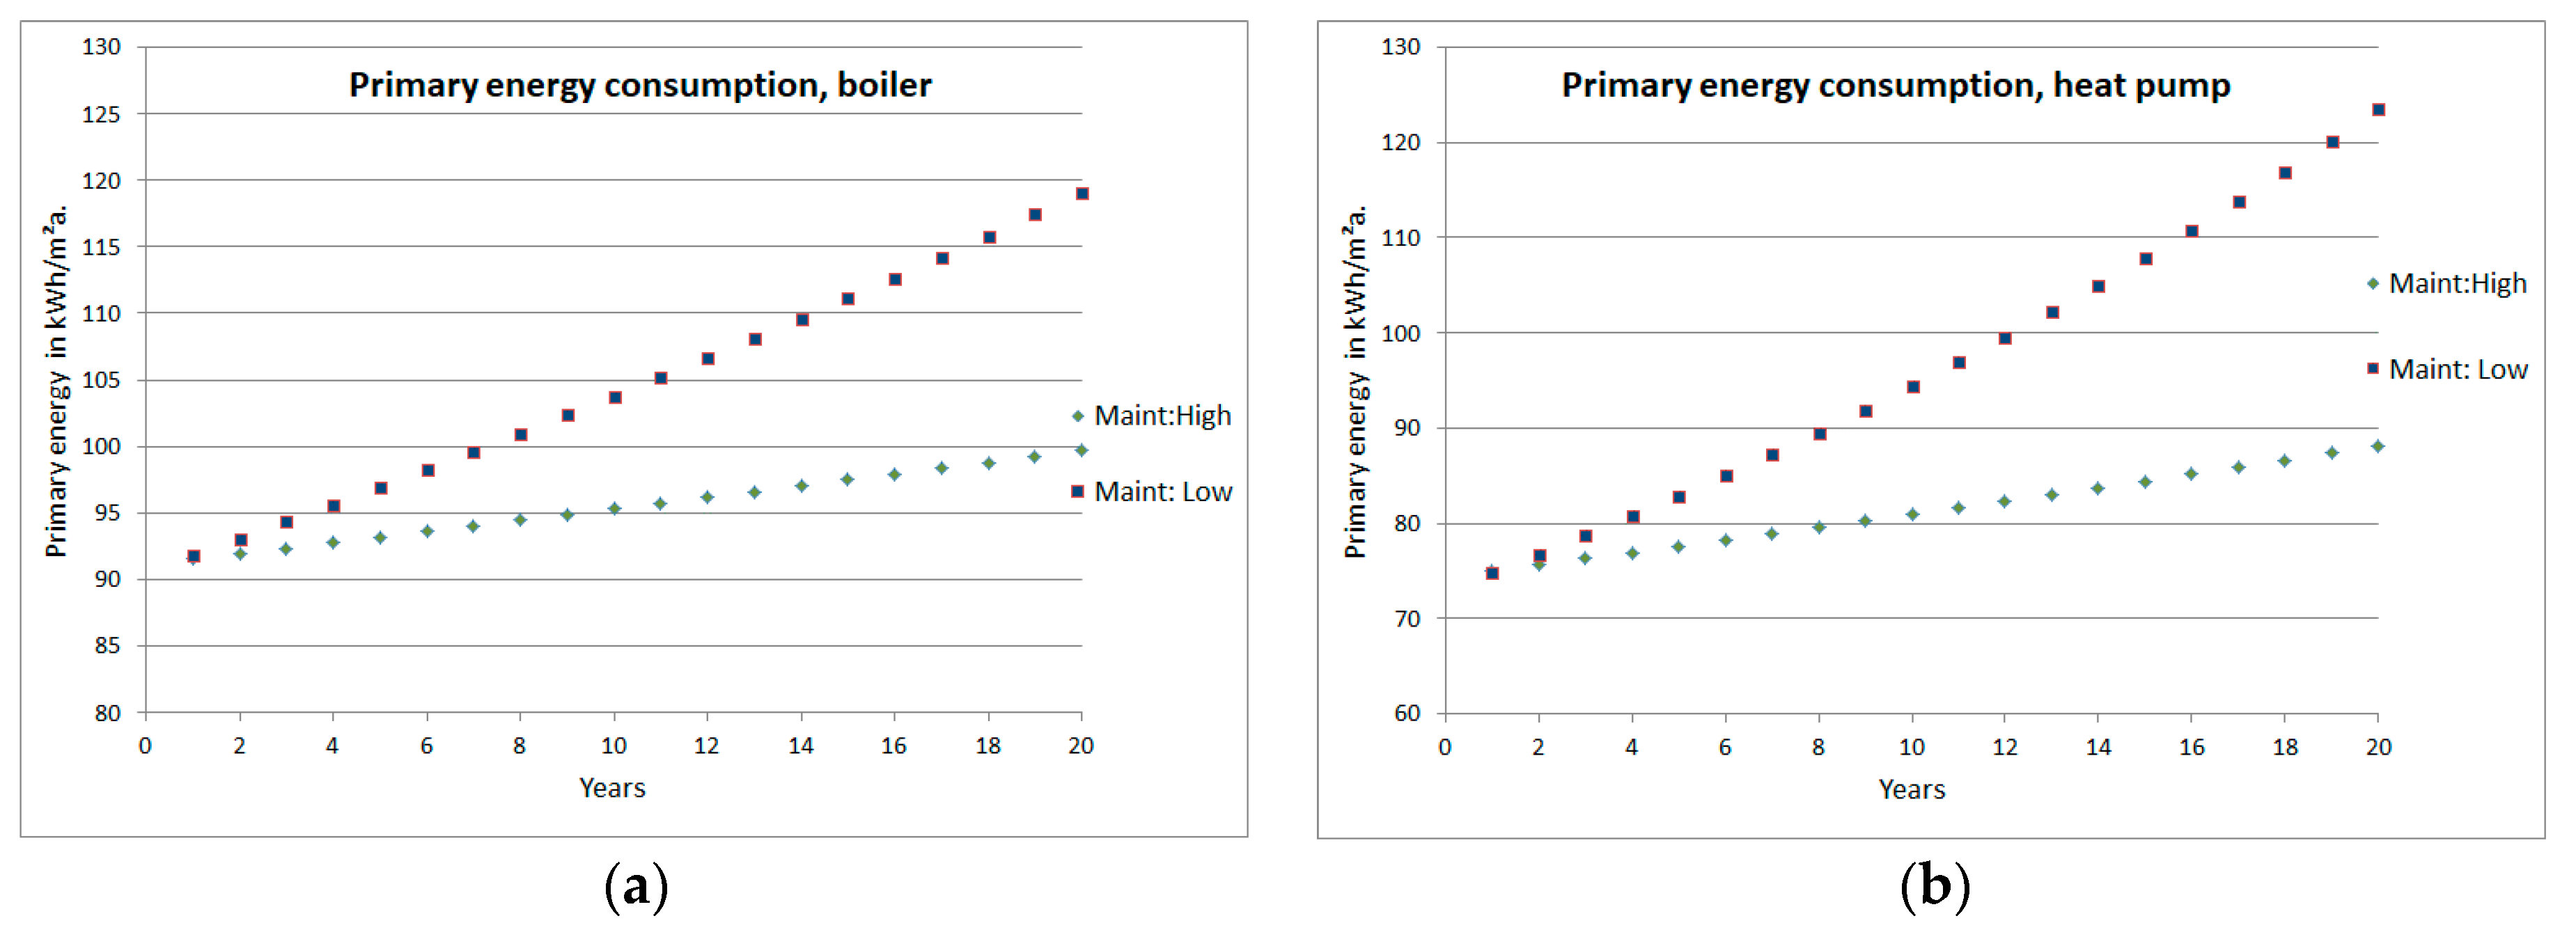
The combined effects of insulation and heat supply system degradation are evaluated next. As expected, the building energy performance deterioration with time is considerably higher in this case. The effect of envelope degradation is more dominant during the first three years, as can be concluded by the fact that maintenance quality does not play a major role in energy performance in this time frame. For the next 10 years, the rise in energy consumption is almost linear, since the envelope degradation rate diminishes while HVAC degradation is increased, whereas in the last year of operation, the high impact of mechanical degradation is evident through the exponential energy consumption increase. The projected primary energy consumption for all four assessed scenarios is depicted in Figure 4.
The key findings regarding the combined impact of insulation, boiler and heat pump degradation on overall building performance are shown in Table 8. Even if the central heating component of the building is a professionally maintained boiler, the total primary energy consumed over 20 years is at least 18.4 % higher than the projected value without degradation. For a poorly maintained heat pump, this value lies at 47.1%. This means that in such a case the building consumes in a time interval of 20 years the primary energy it would consume in 29 years and four months if no degradation occurred. An additional value that stands out in this scenario is the primary energy consumption in the 20th year, which is almost twice as high (+96.2%) as its expected value, if its coefficient of performance remained stable.

5. Conclusions

In this article, the impact of performance degradation of XPS insulation, gas boilers, and air-source heat pumps on the long-term building energy performance is examined through simulation of different scenarios. Due to the limited amount of quantitative data, simplified degradation equations have to be introduced to project the future performance of the mentioned elements. The application of these degradation models leads to a significant rise in building energy consumption with time. In the case where single component degradation is considered, the additional primary consumption over the course of 20 years is 4.4–29.7 % higher than in a scenario without degradation, while the combined effects of component ageing lead to values between 18.4% and 47.1%. Thus, it is evident that performance degradation is a significant factor that has to be taken into account for energy performance assessments in the early design phase of a building.
HVAC component performance is very susceptible to decline due to ageing. Highly complex systems, such as the assessed air-source heat pump, are set to perform considerably worse than expected if they are not maintained properly, with energy consumption after 20 years reaching values that are almost twice as high as the initial ones. For that reason, proper annual maintenance is crucial for moderating the consequences of performance deterioration due to natural ageing and mechanical wear.
The demonstration of the significance of taking performance degradation into account is possible even with the low amount of components and the high degree of simplification that are characteristic of this paper. Nonetheless, it should be expected that the real extent of building performance decline due to component ageing and malfunction is considerably higher. Due to the limited amount of data available, more accurate quantification of the long-term performance of a wider range of components is required. This would principally require extensive building performance monitoring and data acquisition. Additionally, since it is highly unrealistic to claim that degradation occurs solely due to ageing and poor maintenance and that its values consequently follow predefined functions of time, a closer look has to be taken into each building element. The wider usage of simulation tools that emulate component behavior that leads to a higher wear, such as the constant switching on and off of heat pumps, can be a useful means of achieving that. Only through taking such steps to improve the predictability of long term energy performance will it be possible to reach the required maximum accuracy when designing future-proof energy-efficient buildings.

Author Contributions

Georgios Eleftheriadis and Mohamed Hamdy conceived and designed the simulations; Georgios Eleftheriadis performed the simulations based on code written by Mohamed Hamdy and a model developed by ECOGLOBE GmbH; Georgios Eleftheriadis analyzed the data; Mohamed Hamdy contributed analysis tools; Georgios Eleftheriadis wrote the paper under Mohamed Hamdy’s supervision.

Conflicts of Interest

The authors declare no conflict of interest.

References

  1. Directive 2012/27/EU of the European Parliament and of the Council of 25 October 2012 on the energy efficiency. Off. J. Eur. Union 2012. Available online: http://eur-lex.europa.eu/legal-content/EN/TXT/PDF/?uri=CELEX:32012L0027&from=EN (accessed on 19 December 2017).
  2. Mohamed, A.; Hamdy, M.; Hasan, A.; Sirén, K. The performance of small scale multi-generation technologies in achieving cost-optimal and zero-energy office building solutions. Appl. Energy 2015, 152, 94–108. [Google Scholar] [CrossRef]
  3. EPBD Recast, Directive 2010/31/EU of the European Parliament and of the Council of 19 May 2010 on the energy performance of buildings (recast). Off. J. Eur. Union 2010. Available online: http://eur-lex.europa.eu/legal-content/EN/TXT/PDF/?uri=CELEX:32010L0031&from=en (accessed on 19 December 2017).
  4. Guidelines Accompanying Commission Delegated Regulation (EU) No 244/2012 of 16 January 2012 Supplementing Directive 2010/31/EU of the European Parliament and of the Council on the Energy Performance of Buildings by Establishing a Comparative Methodology Framework for Calculating Cost Optimal Levels of Minimum Energy Performance Requirements for Buildings and Building Elements. Off. J. Eur. Union 2012. Available online: http://eur-lex.europa.eu/legal-content/EN/TXT/PDF/?uri=CELEX:52012XC0419&from=EN (accessed on 19 December 2017).
  5. European Union. National Reports on Energy Performance Requirements. Available online: https://ec.europa.eu/energy/en/topics/energy-efficiency/buildings (accessed on 9 September 2017).
  6. Federal Ministry of Transport, Building and Urban Development. Begleituntersuchung zur europäischen Berichterstattung “Cost-Optimal-Level”—Modellrechnungen. 2013. Available online: http://www.bbsr.bund.de/BBSR/DE/Veroeffentlichungen/BMVBS/Online/2013/ON262013.html?nn=396116 (accessed on 9 September 2017). (In German).
  7. Radhi, H. Evaluating the potential impact of global warming on the UAE residential buildings—A contribution to reduce the CO2 emissions. Build. Environ. 2009, 44, 2451–2462. [Google Scholar] [CrossRef]
  8. Gaterell, M.R.; McEvoy, M.E. The impact of climate change uncertainties on the performance of energy efficiency measures applied to dwellings. Energy Build. 2005, 37, 982–995. [Google Scholar] [CrossRef]
  9. Waddicor, D.; Fuentes, E.; Sisó, L.; Salom, J.; Favre, B.; Jiménez, C.; Azar, M. Climate change and building ageing impact on building energy performance and mitigation measures application: A case study in Turin, northern Italy. Build. Environ. 2016, 102, 13–25. [Google Scholar] [CrossRef]
  10. Hamdy, M.; Hasan, A.; Sirén, K. A multi-stage optimization method for cost-optimal and nearly-zero-energy building solutions in line with the EPBD-recast 2010. Energy Build. 2013, 56, 189–203. [Google Scholar] [CrossRef]
  11. Mauro, G.M.; Hamdy, M.; Vanoli, G.P.; Bianco, N.; Hensen, J.L.M. A new methodology for investigating the cost-optimality of energy retrofitting a building category. Energy Build. 2015, 107, 456–478. [Google Scholar] [CrossRef]
  12. De Wilde, P.; Tian, W.; Augenbroe, G. Longitudinal prediction of the operational energy use of buildings. Build. Environ. 2011, 46, 1670–1680. [Google Scholar] [CrossRef]
  13. Magnuson, G.R. Assessment of Degradation of Equipment and Materials in Relation to Sustainability Measures. Master’s Thesis, University of Kansas, Lawrence, KS, USA, 20 November 2013. [Google Scholar]
  14. Eleftheriadis, G.; Hamdy, M. Impact of building envelope and mechanical component degradation on the whole building performance: A review paper. Energy Procedia 2017, 132, 321–326. [Google Scholar] [CrossRef]
  15. Struck, C.; Markov, D.; Stankov, P.; Ilic, G.; Seravimov, M.; Bionda, D.; Seerig, A. Towards compensating HVAC system degradation phenomena with adaptable building elements. In Proceedings of the 13th International Conference on Sustainable Energy Technologies, Geneva, Switzerland, 25–28 August 2014. [Google Scholar] [CrossRef]
  16. Griffith, B.; Long, N.; Torcellini, P.; Judkoff, R.; Crawley, D.; Ryan, J. Methodology for Modeling Building Energy Performance across the Commercial Sector; National Renewable Energy Laboratory: Golden, CO, USA, 2008.
  17. Hendron, R. Building America Performance Analysis Procedures for Existing Homes; National Renewable Energy Laboratory: Golden, CO, USA, 2006.
  18. Bannai, M.; Yoshida, T.; Kimura, Y.; Fujii, T.; Skiguchi, K.; Sawa, T. Energy Solution in the Industrial and Commercial Sectors. Hitachi Rev. 2008, 57, 220–225. [Google Scholar]
  19. Powertron Global. Thermal Degradation in HVAC Systems. 2016. Available online: http://www.powertronglobal.com/the-problem-we-solve/ (accessed on 3 December 2017).
  20. Wang, L.; Hong, T. Modeling and Simulation of HVAC Faulty Operations and Performance Degradation due to Maintenance Issues; Ernest Orlando Lawrence Berkeley National Laboratory: Berkeley, CA, USA, 2013.
  21. Zhou, S.; Cui, W.; Zhao, S.; Zhu, S. Operation analysis and performance prediction for a GSHP system compounded with domestic hot water (DHW) system. Energy Build. 2016, 119, 156–163. [Google Scholar] [CrossRef]
  22. Jelle, B.P. Accelerated climate ageing of building materials, components and structures in the laboratory. J. Mater. Sci. 2012, 47, 6475–6496. [Google Scholar] [CrossRef]
  23. Singh, S.N.; Coleman, P.D. Accelerated Aging Test Methods for Predicting the Long Term Thermal Resistance of Closed-Cell Foam Insulation; Huntsman Advanced Technology Center: The Woodlands, TX, USA, 2007. [Google Scholar]
  24. Li, H.; Chen, H.; Li, X.; Duan, W. Degradation of VIP barrier envelopes exposed to alkaline solution at different temperatures. Energy Build. 2015, 93, 208–216. [Google Scholar] [CrossRef]
  25. Moletti, S.; Baskaran, A.; Lefebvre, D.; Beaulieu, P. The Use of VIPs as a Next-Generation Insulation Material in Roofing Systems; RCI Inc.: Raleigh, NC, USA, 2017; Available online: http://rci-online.org/rci-interface-featured-article-vacuum-insulation-panels-vips-five-years-field-performance/ (accessed on 8 November 2017).
  26. Stazi, F.; Tittarelli, F.; Politi, G.; di Perna, C.; Munafò, P. Assessment of the actual hygrothermal performance of glass mineral wool insulation applied 25 years ago in masonry cavity walls. Energy Build. 2014, 68, 292–304. [Google Scholar] [CrossRef]
  27. Lakatos, Á. Investigation of the moisture induced degradation of the thermal properties of aerogel blankets: Measurements, calculations, simulations. Energy Build. 2017, 139, 506–516. [Google Scholar] [CrossRef]
  28. Klauß, S.; Maas, A. Entwicklung einer Datenbank mit Modellgebäuden für energiebezogene Untersuchungen, insbesondere der Wirtschaftlichkeit; Zentrum für Umweltbewusstes Bauen e.V. (ZUB): Kassel, Germany, 2010; Available online: http://www.bbsr-energieeinsparung.de/EnEVPortal/DE/EnEV/EnEV2013/Begleitgutachten/Sonstiges/_gutachten/DatenbankModellgebaeude/DL_Endbericht.pdf?__blob=publicationFile&v=1 (accessed on 10 April 2017). (In German)
Figure 1. The assessed reference building.
Buildings 08 00023 g001
Figure 2. Impact of extruded polystyrene (XPS) insulation degradation on (a) heating demand; (b) primary energy.
Buildings 08 00023 g002
Figure 3. Impact of (a) boiler; (b) heat pump degradation on building primary energy consumption, two maintenance scenarios.
Buildings 08 00023 g003
Figure 4. Combined impact of XPS and (a) boiler; (b) heat pump degradation on building primary energy consumption.
Buildings 08 00023 g004
Table 1. Assessed building design data.
SectionDesign SpecificationValue
Basic dimensionsLiving space110 m2
Width of base plate9.4 m
Length of base plate10.5 m
Perimeter39.8 m
Floor height 2.75 m
Floor number2
Envelope specificationsArea of north facade40 m2
Area of west facade36 m2
Area of south facade40 m2
Area of east facade36 m2
Total wall area125 m2
Total Roof area118 m2
Total window area27 m2
Basement area99 m2
Calculated usable areaHeated volume465 m3
Usable area according to EnEV148.8 m2
Table 2. Energy performance relevant data.
Element TypeComponentConfiguration
Envelope elementsWallsU-Value = 0.28 W/m2∙K
RoofU-Value = 0.20 W/ m2∙K
FloorU-Value = 0.35 W/ m2∙K
WindowsU-Value = 1.30 W/ m2∙K
All envelope elementsAdded ΔU due to thermal bridging: 0.05 W/m2∙K
Mechanical componentsPrimary heating systemCondensing gas boiler, system efficiency = 0.89
Domestic hot water systemFrom primary heating system + Solar thermal collector with 59% coverage
Ventilation systemAccording to DIN V 18599, no heat recovery
Table 3. Detailed information on building envelope element insulation.
Building ElementXPS Insulation PropertiesBase Element U-Value (W/m2∙K) U-Value incl. Thermal Bridging (W/m2∙K)
λ
(W/m∙K)
ρ
(kg/m3)
Cp (J/kg∙K)Thickness (cm)
External Wall 0.03535140010.70.280.33
External Roof0.03535140016.20.200.25
Ground floor0.0353514008.80.350.40
Table 4. Comparison between report and simulation results for reference building heating demand.
Results SourceHeating Demand (kWh/m2∙a)Deviation
Report76.270.09%
Simulation76.34
Table 5. Comparison between report and simulation results for heating demand, different packages.
Measure PackageU-Values incl. Thermal Bridging (W/m2∙K)Heat Demand (kWh/m2∙a)Deviation (%)
WallRoofFloorWindowsReportSimulation
Reference 0.330.250.41.3576.376.30.1
Package 10.170.190.231.0549.357.015.6
Package 20.170.190.231.0536.644.621.7
Package 30.170.130.230.827.935.828.2
Table 6. Four different heating system scenarios for degradation assessment.
ScenarioHeating and DHW System CharacteristicsMaintenancePrimary Energy for Heating, DHW and Ventilation, 1st Year (kWh/m2∙a)Project Life (Years)
Annual System Efficiency, 1st Year Solar CollectorLevelM-Factor
Boiler 10.89YESHIGH0.00591.520
Boiler 20.89YESLOW0.01591.820
Heat pump 11.94NOHIGH0.017520
Heat pump 21.94NOLOW0.0374.820
Table 7. Cumulative results for single element degradation.
Element DegradingPrimary Heating SystemMaintenance QualityDifference Year 20–Year 1 (kWh/m2∙a)Cumulative Additional Primary Energy over 20 Years (kWh/m2)
Heat DemandPrimary Energy
XPS insulationBoilerNot relevant13.6 (+18.1%)17.1 (+18.8%)242.1 (+13.3%)
Heat pump Not relevant13.6 (+18.1%)13 (+17.3%)183.7 (+12.2%)
Central heating componentBoilerHIGH0 (+0%)8.2 (+9%)80.6 (+4.4%)
BoilerLOW0 (+0%)27.3 (+29.7%)260.2 (+14.2%)
Heat pumpHIGH0 (+0%)13.1 (+17.4%)126.9 (+8.5%)
Heat pump LOW0 (+0%)48.7 (+65.2%)443 (+29.7%)
Table 8. Cumulative results for insulation and primary heating system degradation.
ScenarioPrimary Heating SystemMaintenance QualityDifference Year 20 - Year 1 (kWh/m2∙a)Cumulative Additional Primary Energy over 20 Years (kWh/m2)
Heat DemandPrimary Energy
1BoilerHIGH13.6 (+18.1%)27 (+29.6%)336.5 (+18.4%)
2BoilerLOW13.6 (+18.1%)50 (+54.6%)546.8 (+29.8%)
3Heat pumpHIGH13.6 (+18.1%)28.8 (+38.4%)332.2 (+22.2%)
4Heat pump LOW13.6 (+18.1%)71.8 (+96.2%)702.8 (+47.1%)

