Construction Technology Adoption Cube: An Investigation on Process, Factors, Barriers, Drivers and Decision Makers Using NVivo and AHP Analysis


Abstract
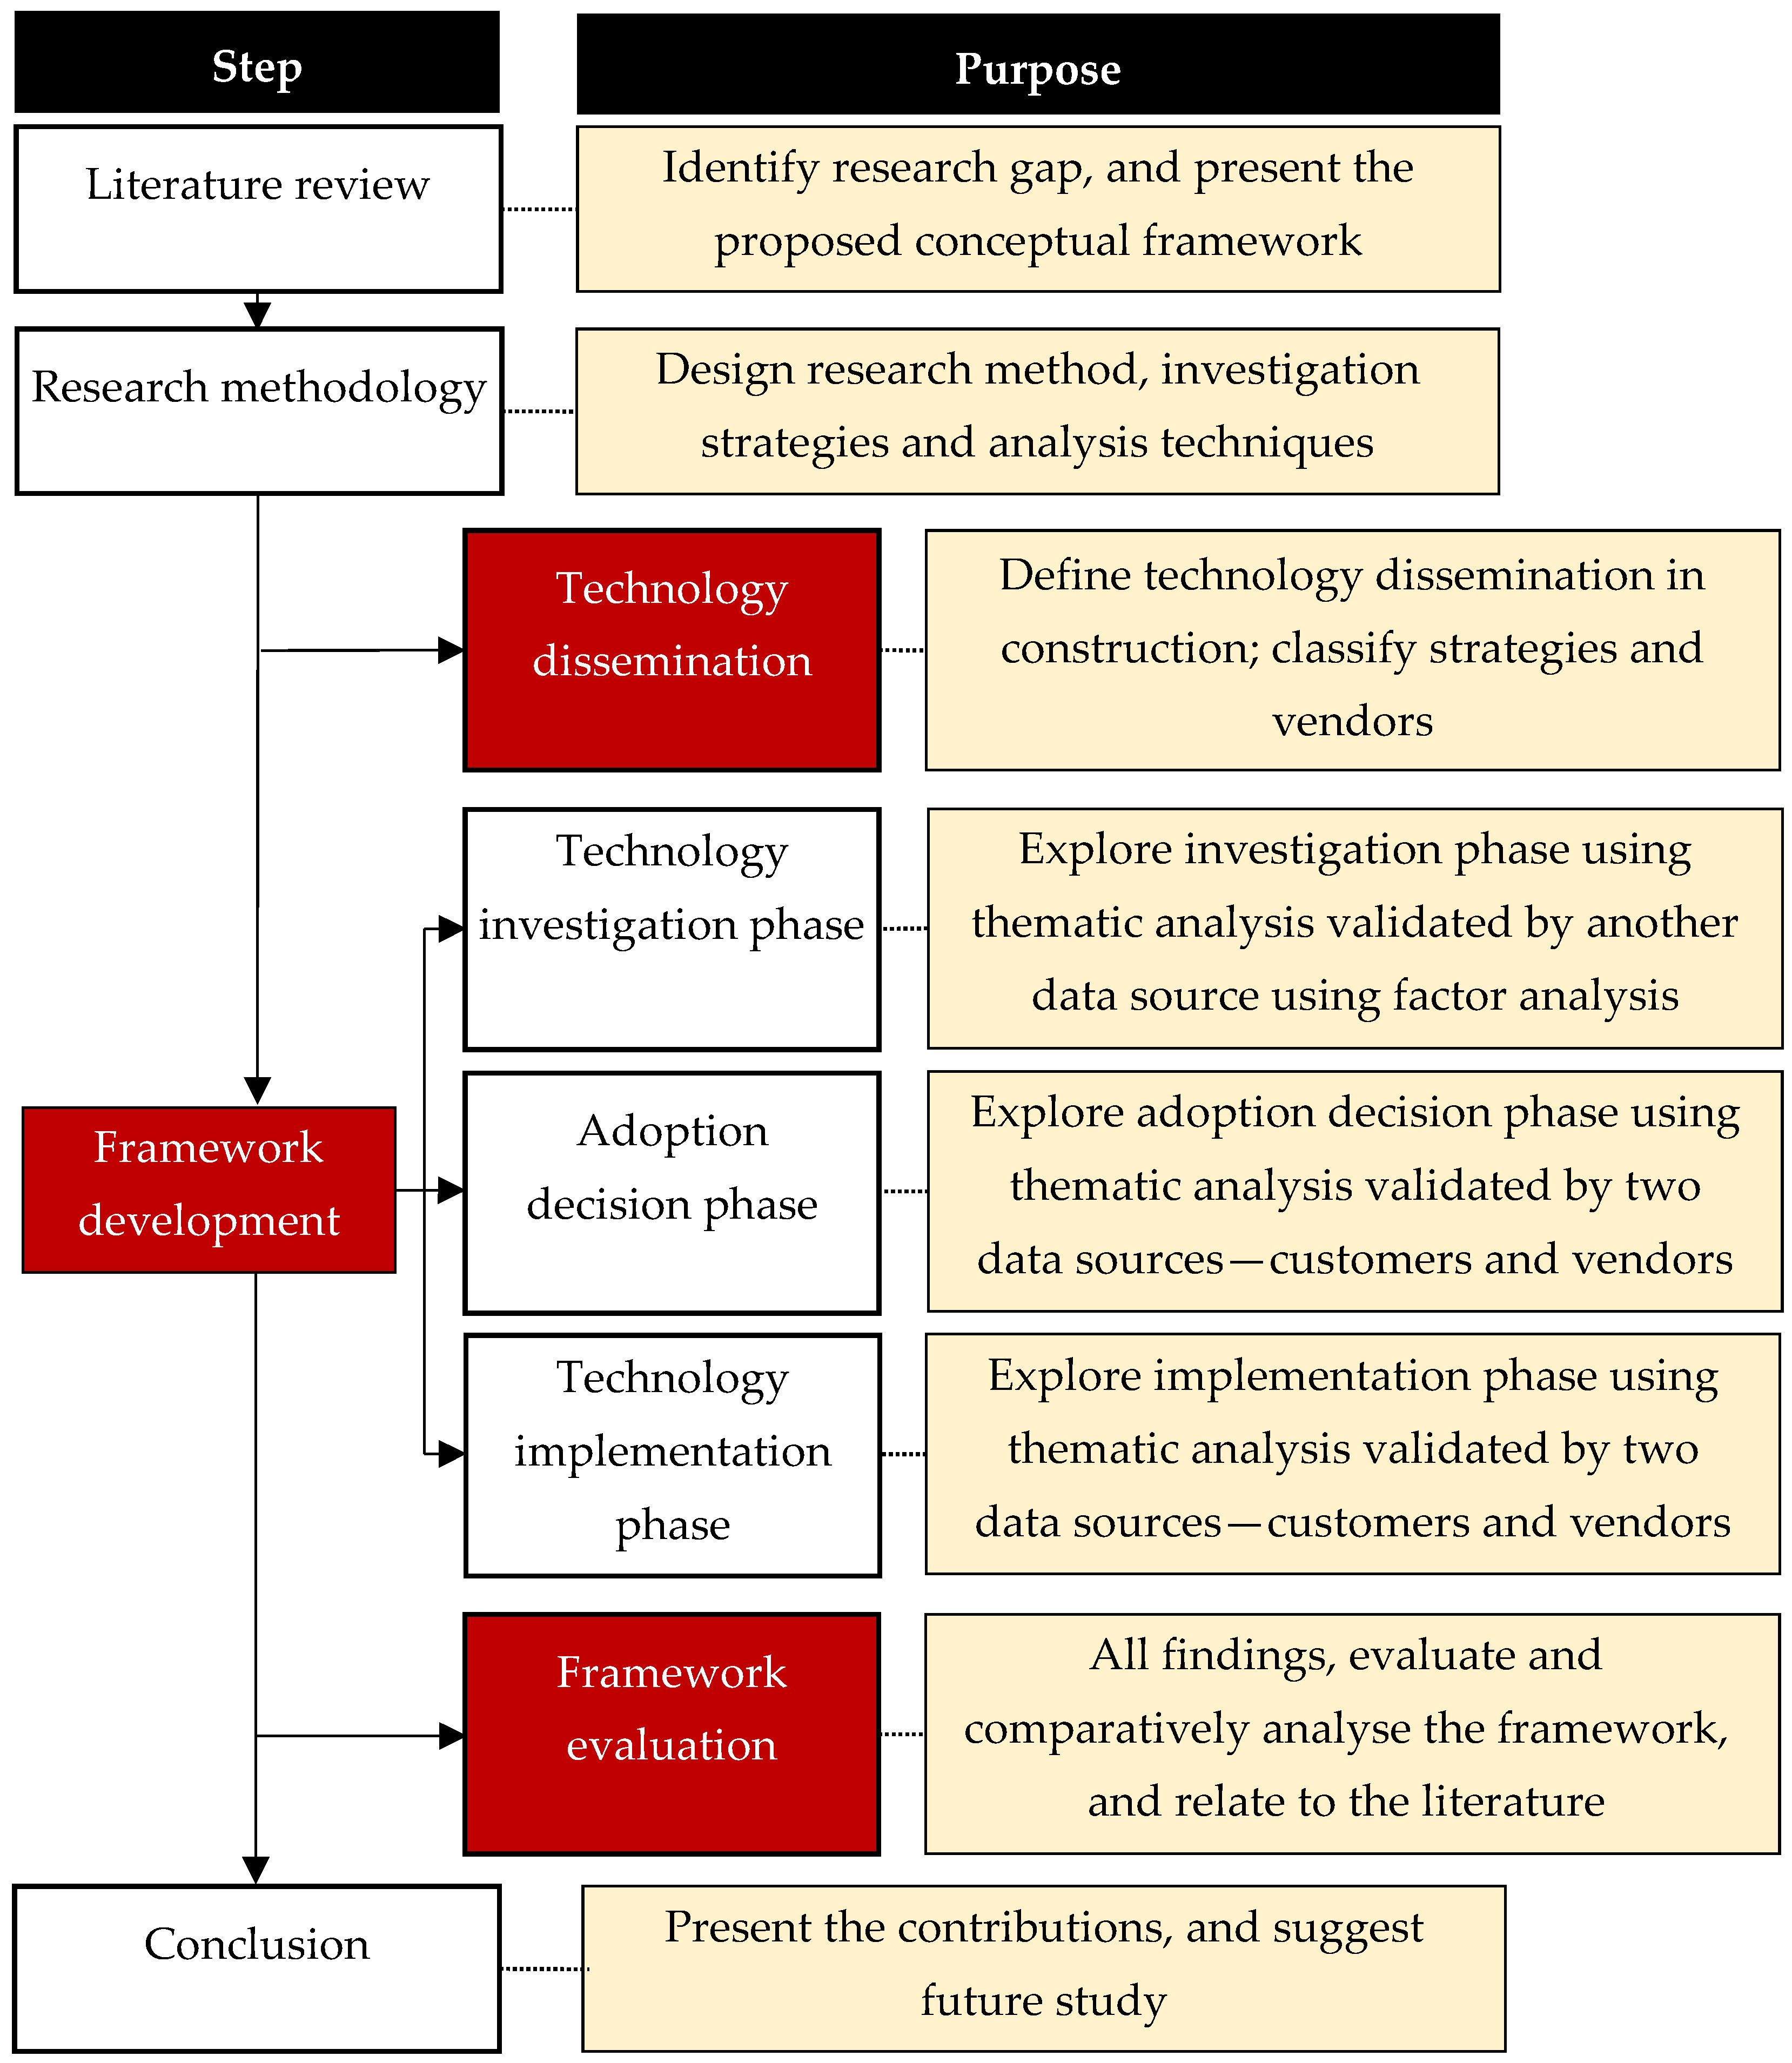
:1. Introduction
- (1)
- to investigate the process used by customers of new technologies as they move from recognizing a need to actually using a new technology;
- (2)
- to investigate the interaction and relationships between the activities of customers and vendors;
- (3)
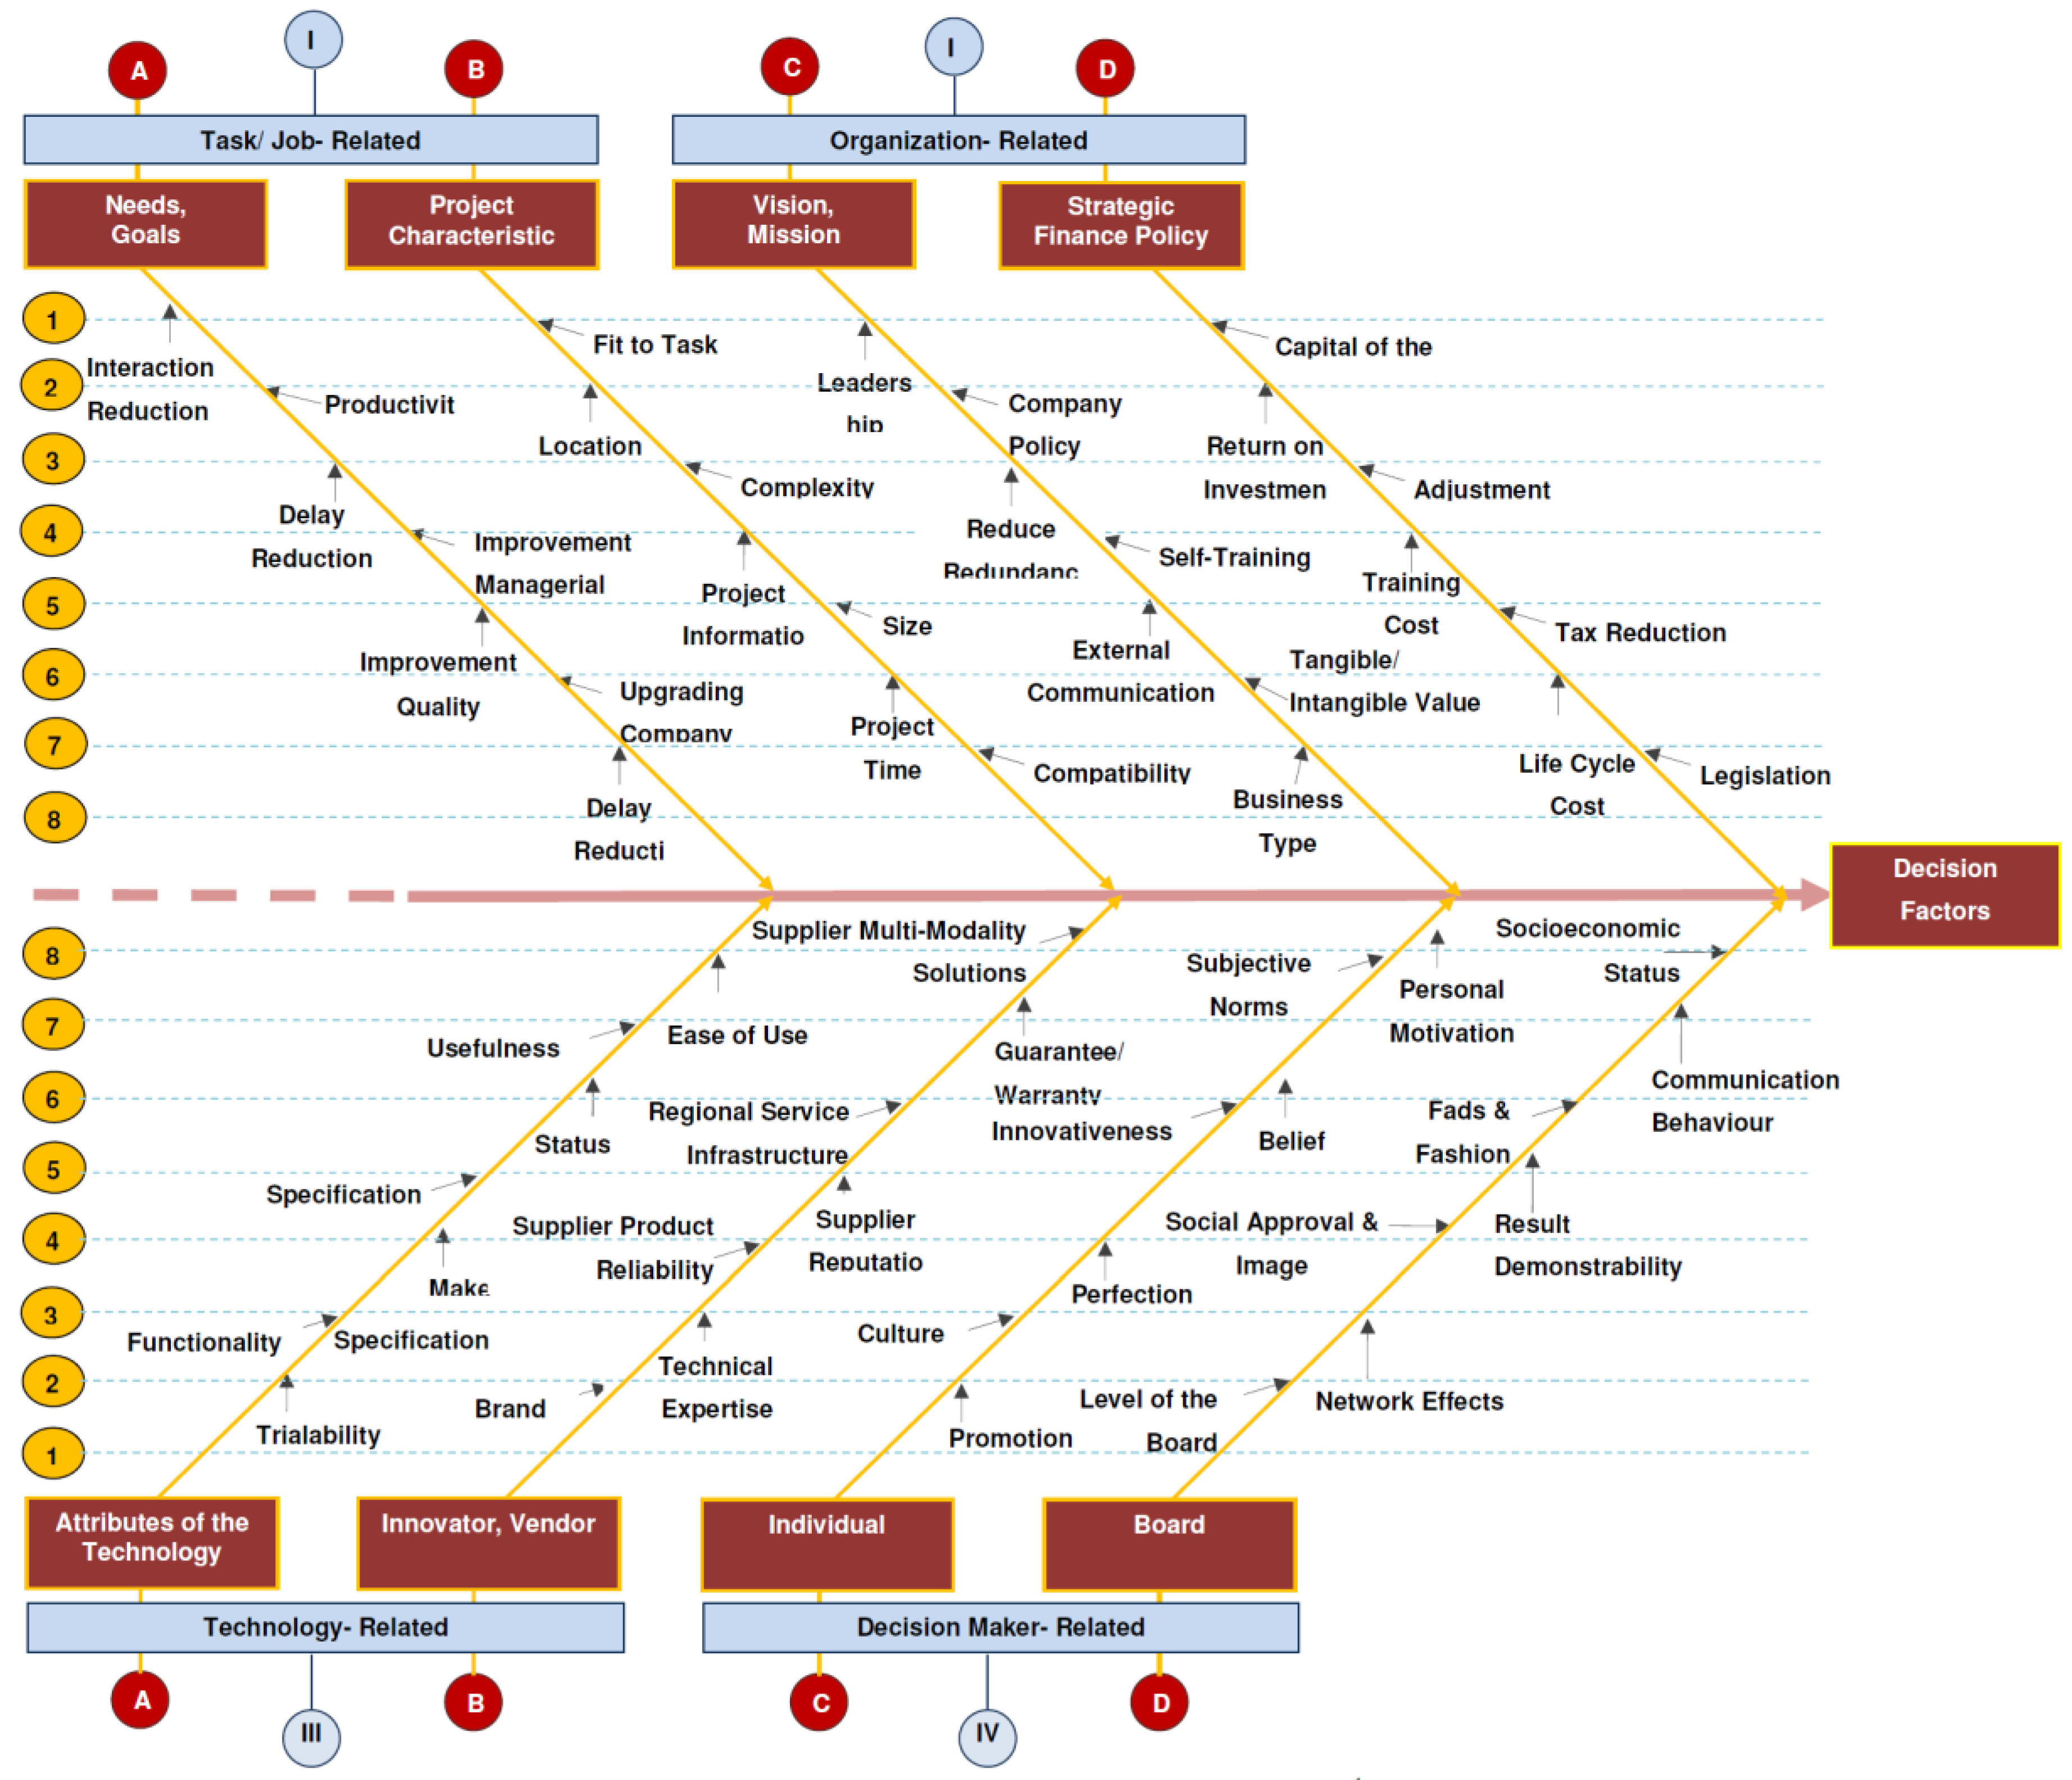
- to explore influential factors affecting the process;
- (4)
- to identify individuals involved in the process;
- (5)
- to formulate the understanding of these activities into a comprehensive framework;
- (6)
- to validate this framework empirically against industry practice.
2. The Concept of Construction Technology
2.1. Innovation
2.2. Construction Technology
- (i)
- the new Autonomous Haulage System developed by Komatsu Ltd., using a high-precision GPS navigation system, millimetre wave radar and optic-fibre gyro technology to control unmanned trucks on predetermined courses [53];
- (ii)
- the universal piling and drilling rig LRB 18 with vibrator type LV 20 with virtual reality and a positioning system.
2.3. Technology Adoption, Acceptance, Diffusion and Implementation
- (i)
- the “socio-economic perspective”, focusing on diffusion theories [55];
- (ii)
- (iii)
3. Research Design
3.1. Mixed Research Method for Construction
3.2. Grounded Theory
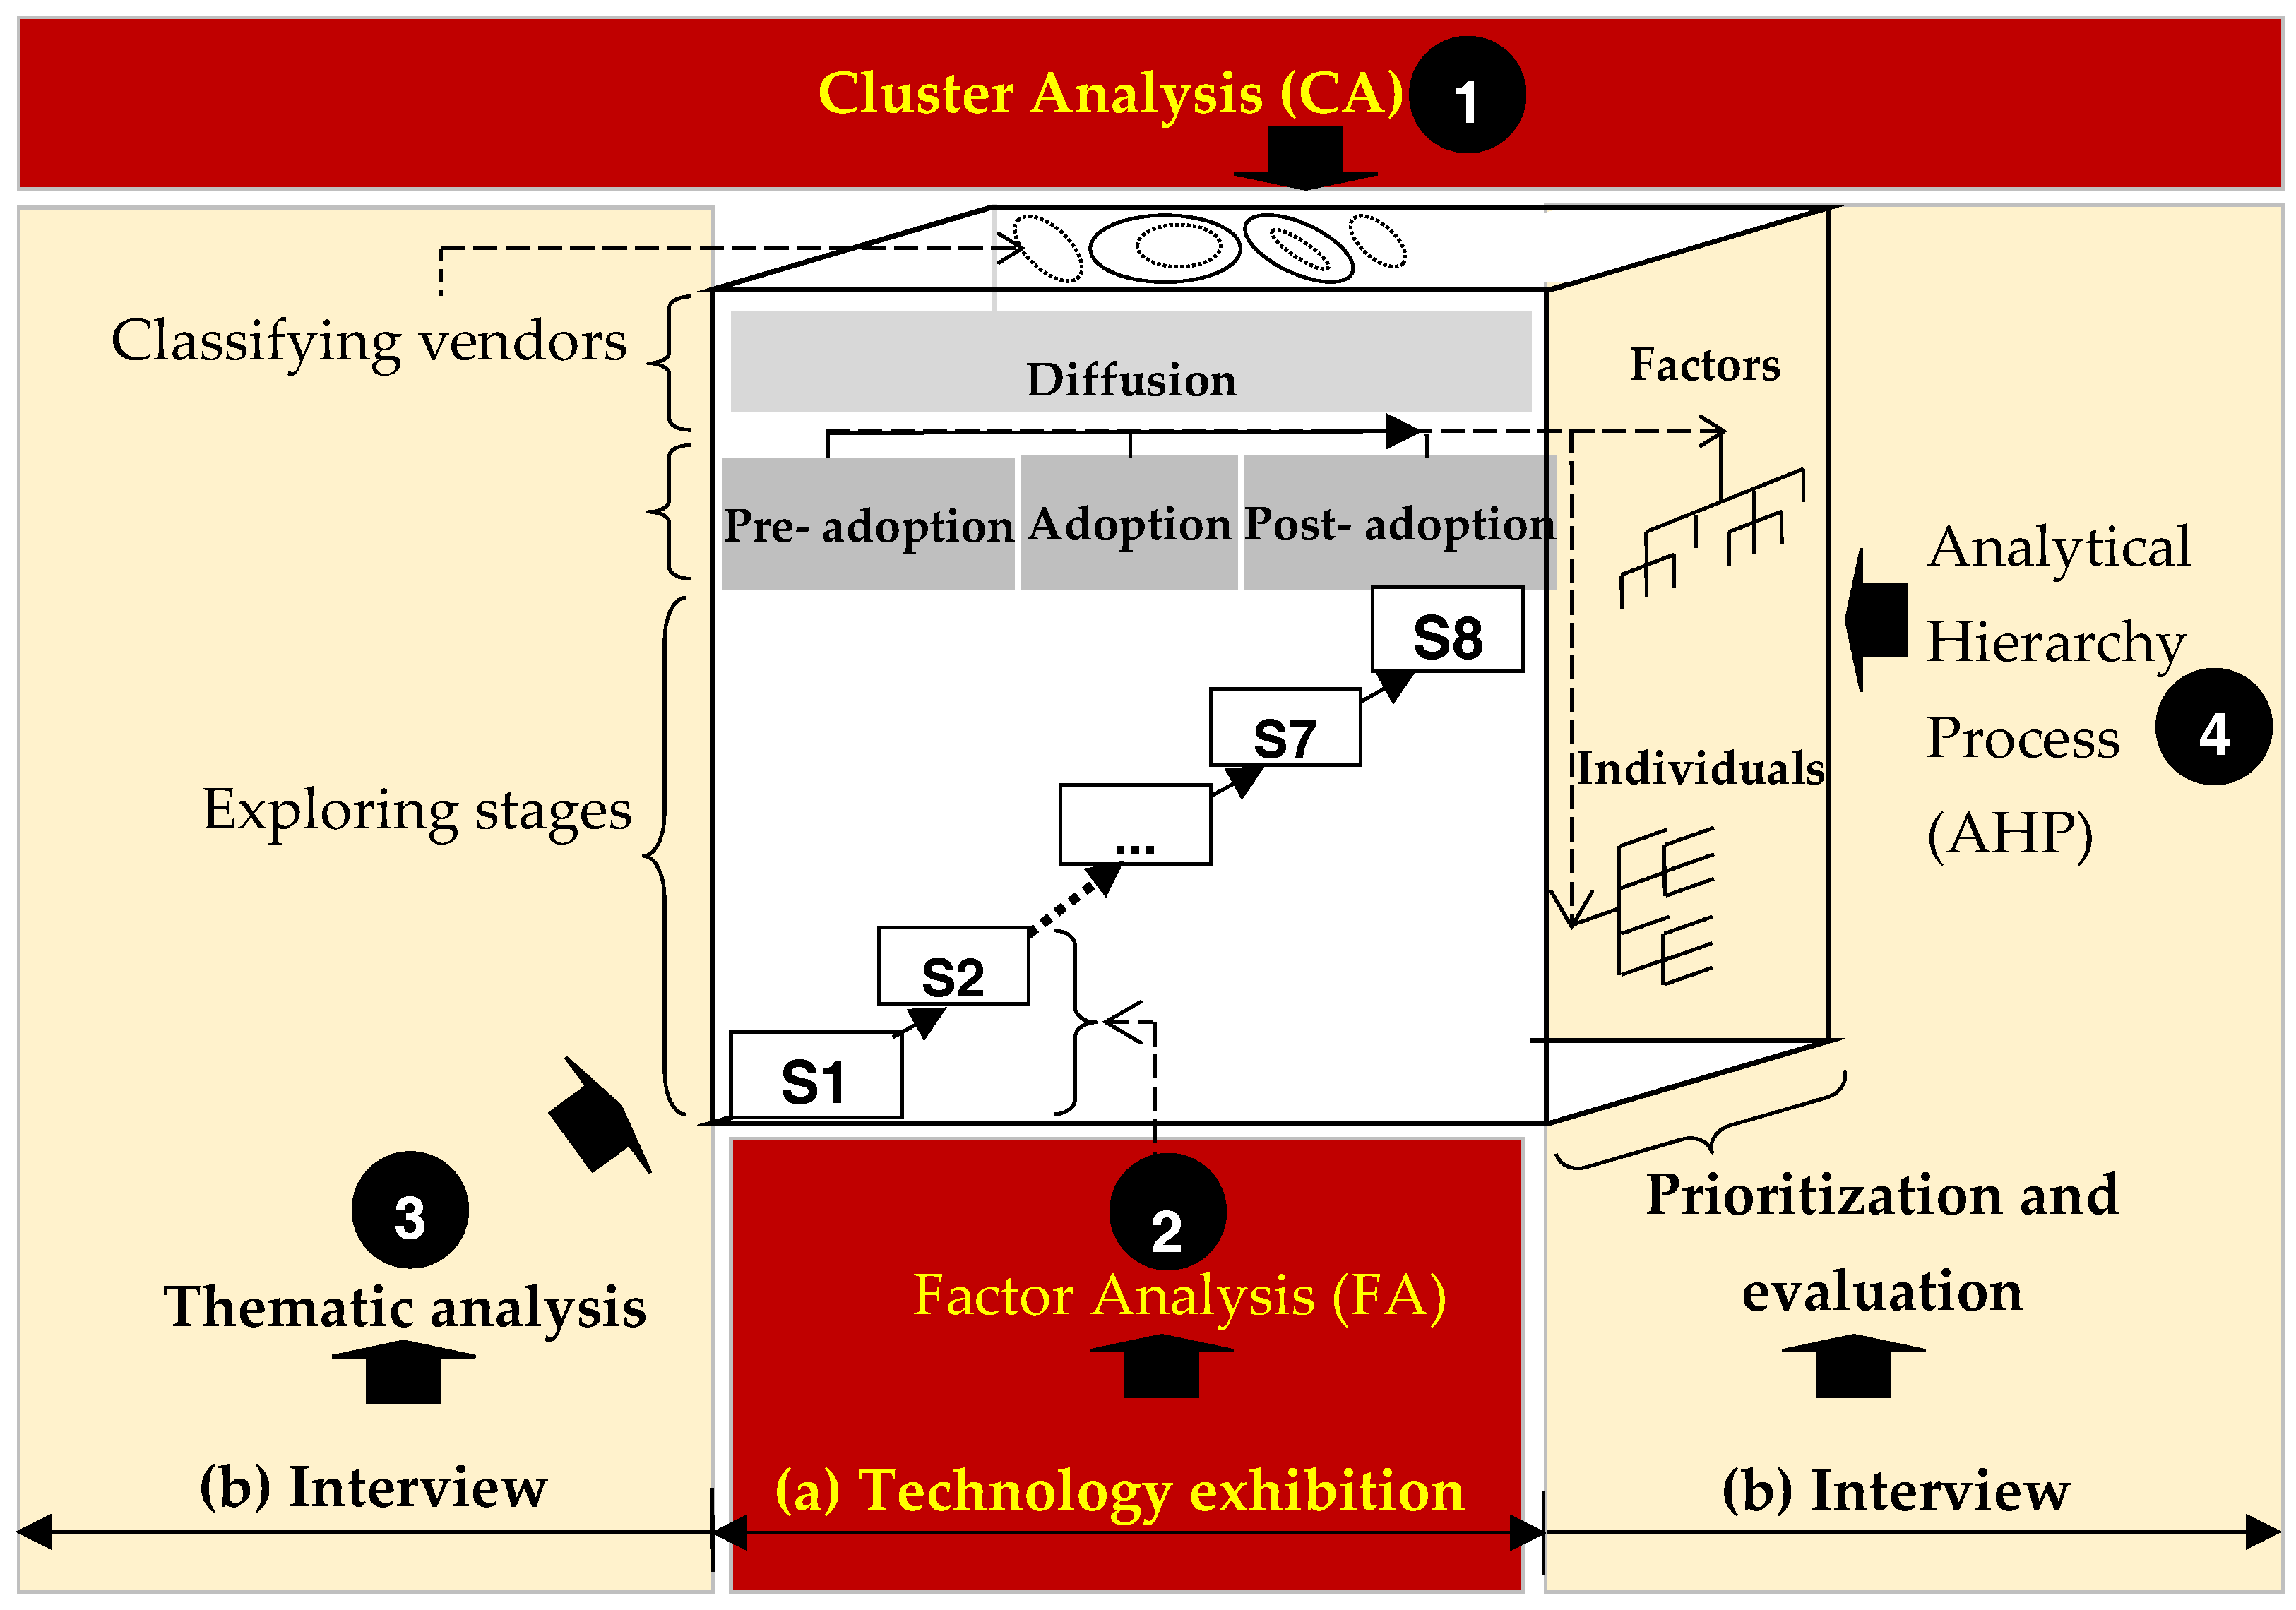
3.3. The Methodological Cube
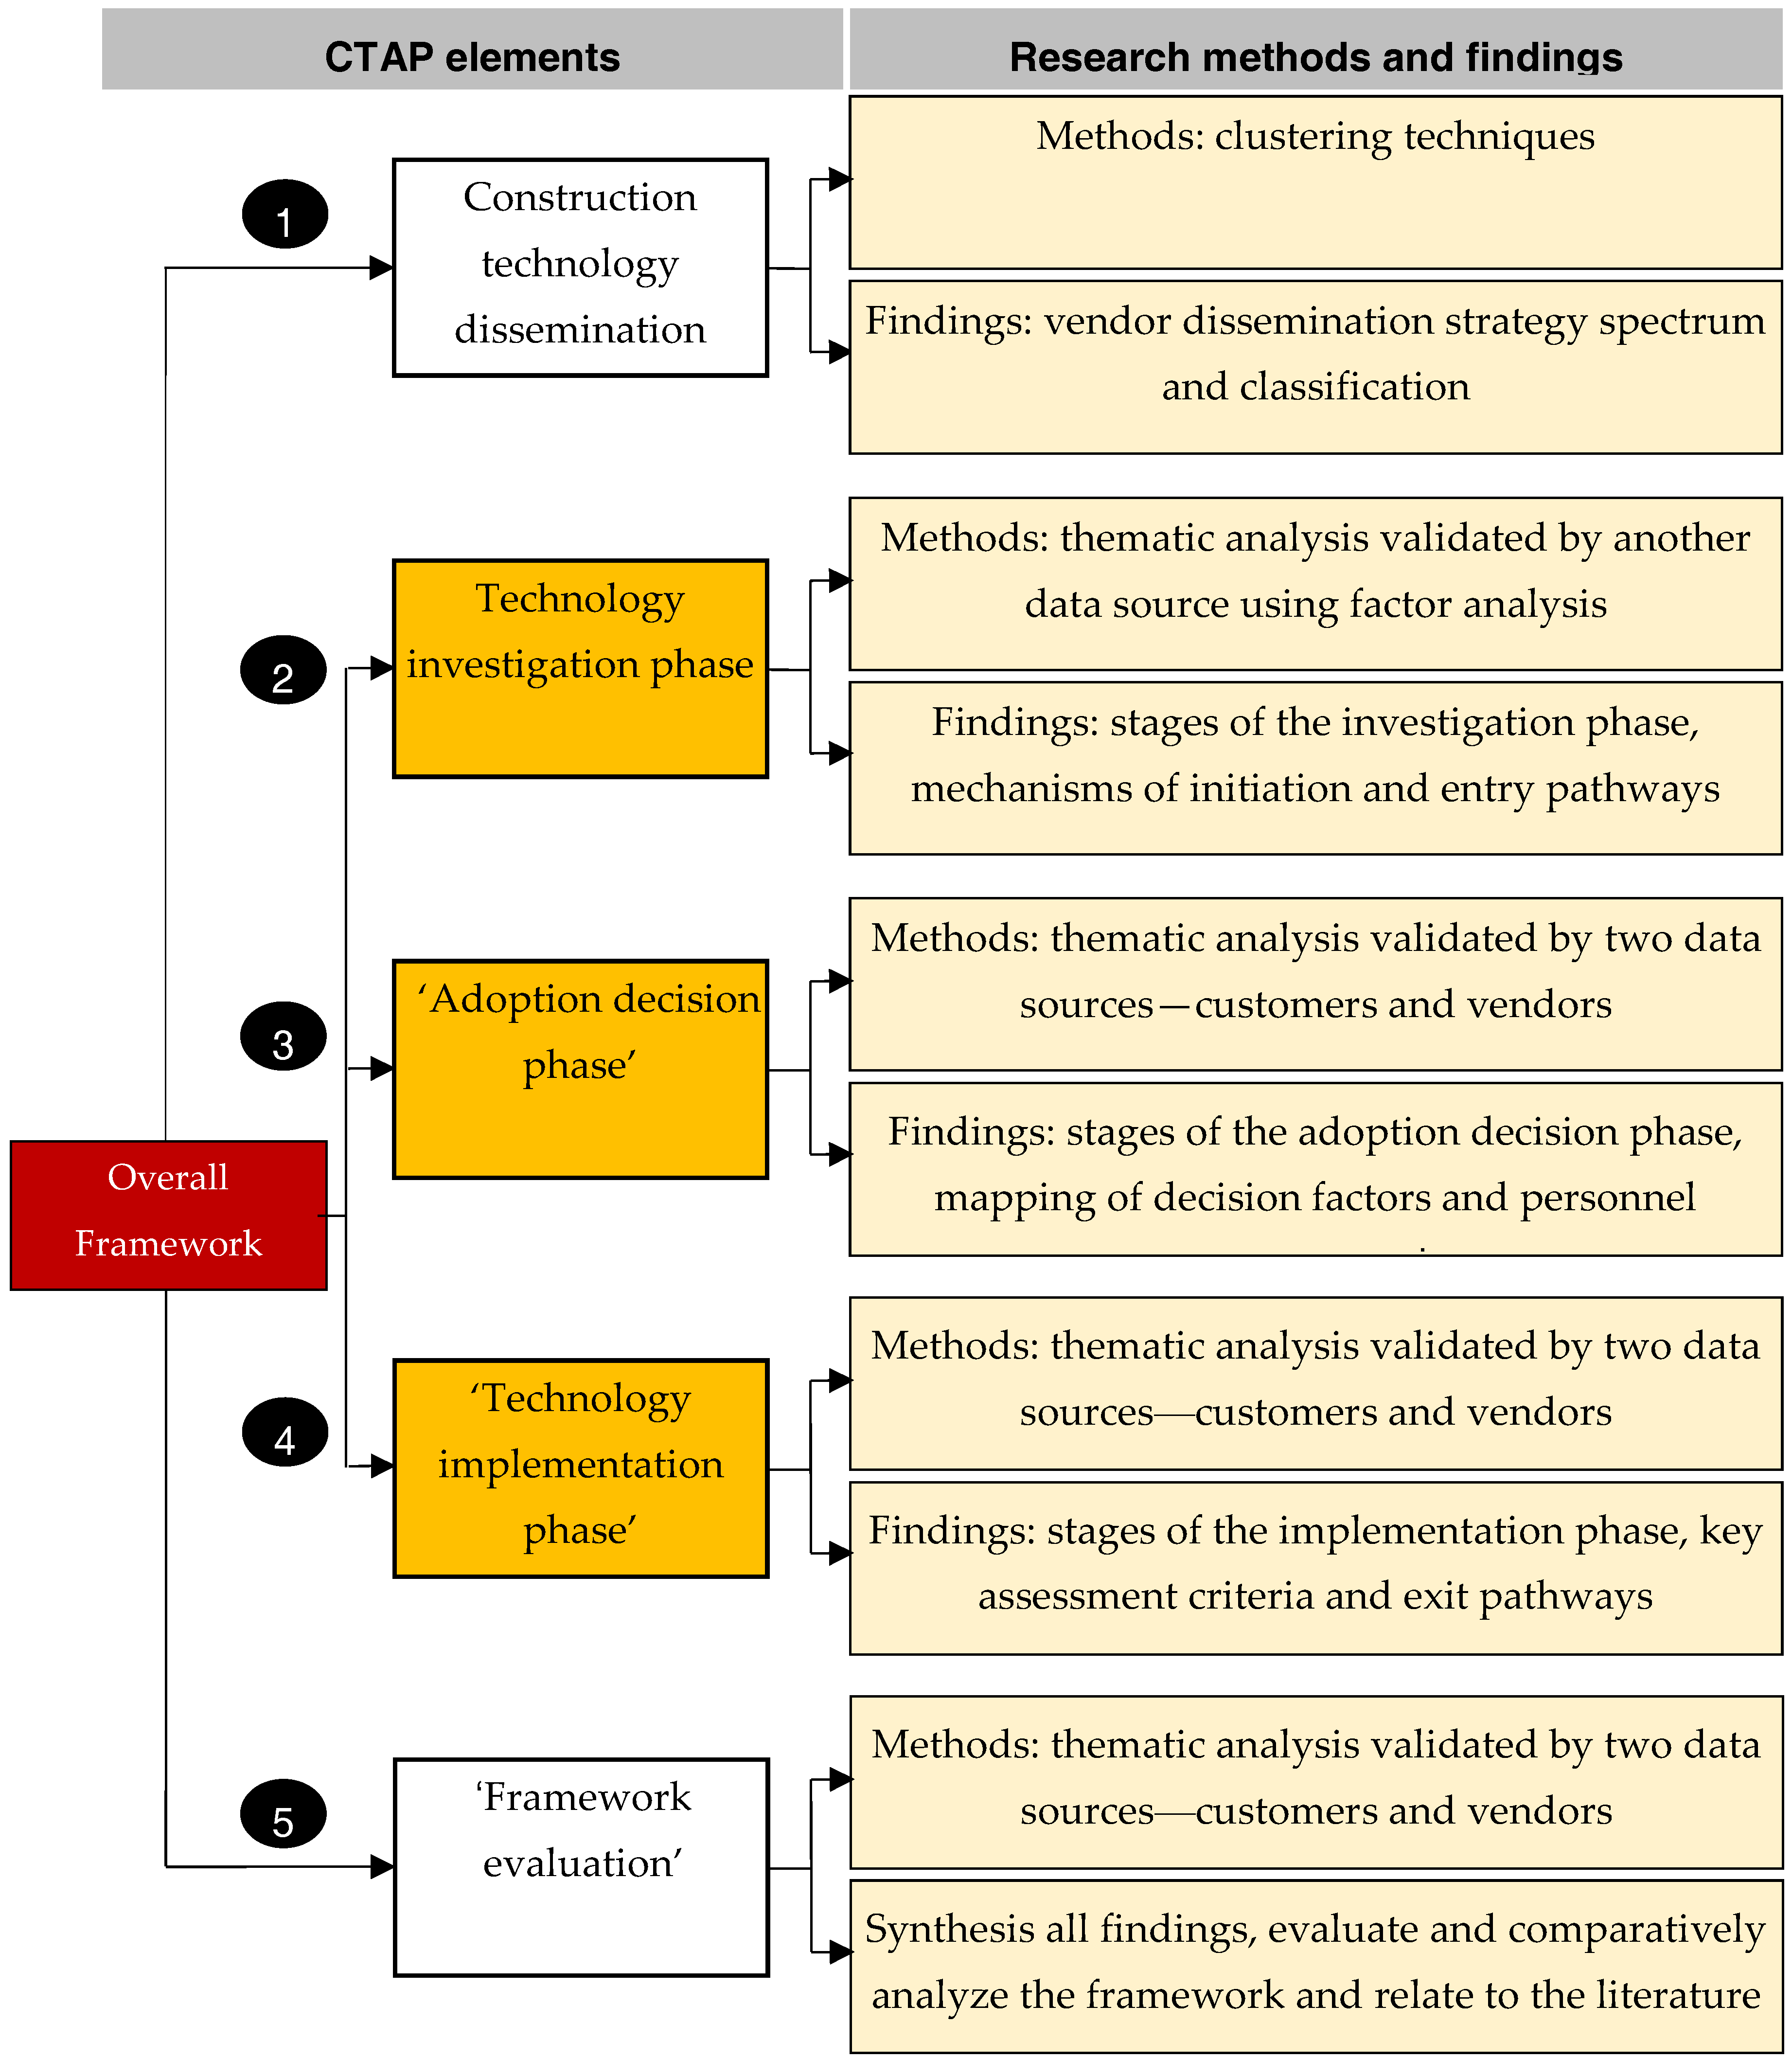
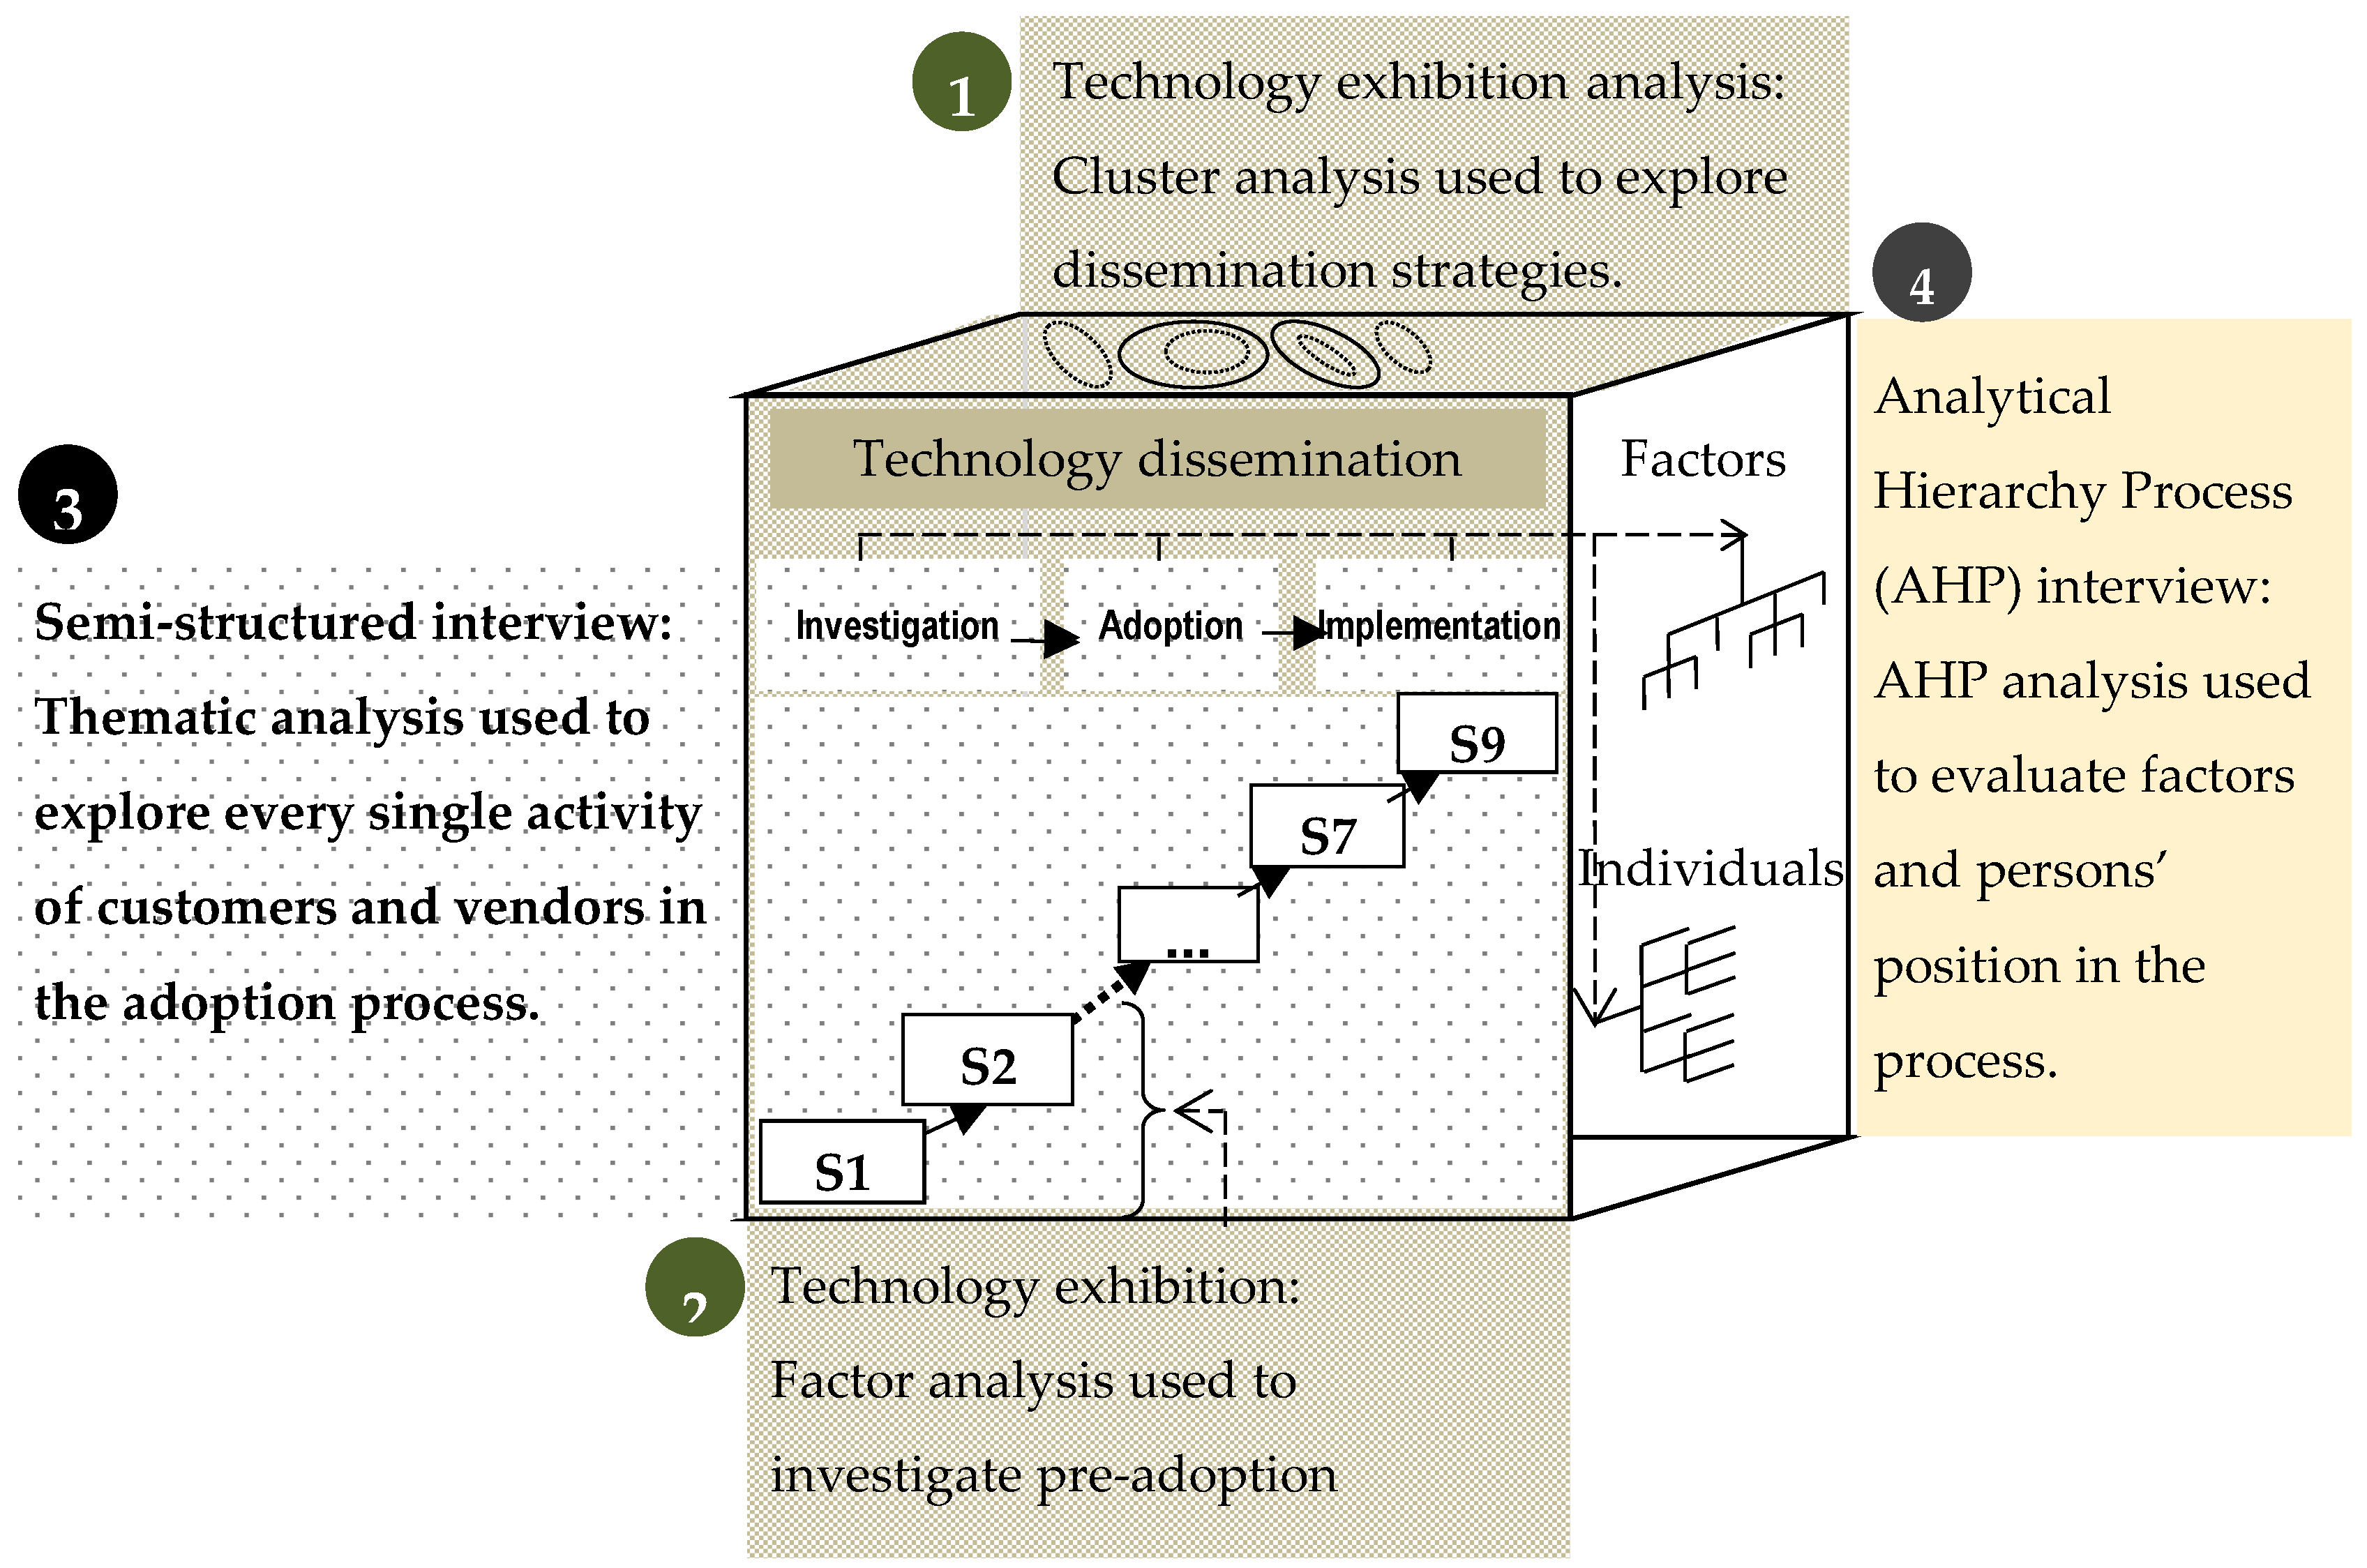
- (1)
- cluster analysis of the exhibition data to explore how vendors disseminate their technologies and to classify them based on their dissemination strategies;
- (2)
- factor analysis of the exhibition data to explore how vendors support decision makers at the early stages of the adoption process, validating the first phase of the framework;
- (3)
- thematic analysis of transcriptions of semi-structured interviews to examine the adoption process based on the current best practices of the industry by purposely selected experienced customer and vendor participants who have recently purchased or sold a new technology; and
- (4)
- the Analytic Hierarchy Process (AHP) to prioritize factors influencing the adoption and the importance of individuals holding various positions in the decision making process; this last is not the main object of the study, but gives more insight about the factors and individuals.
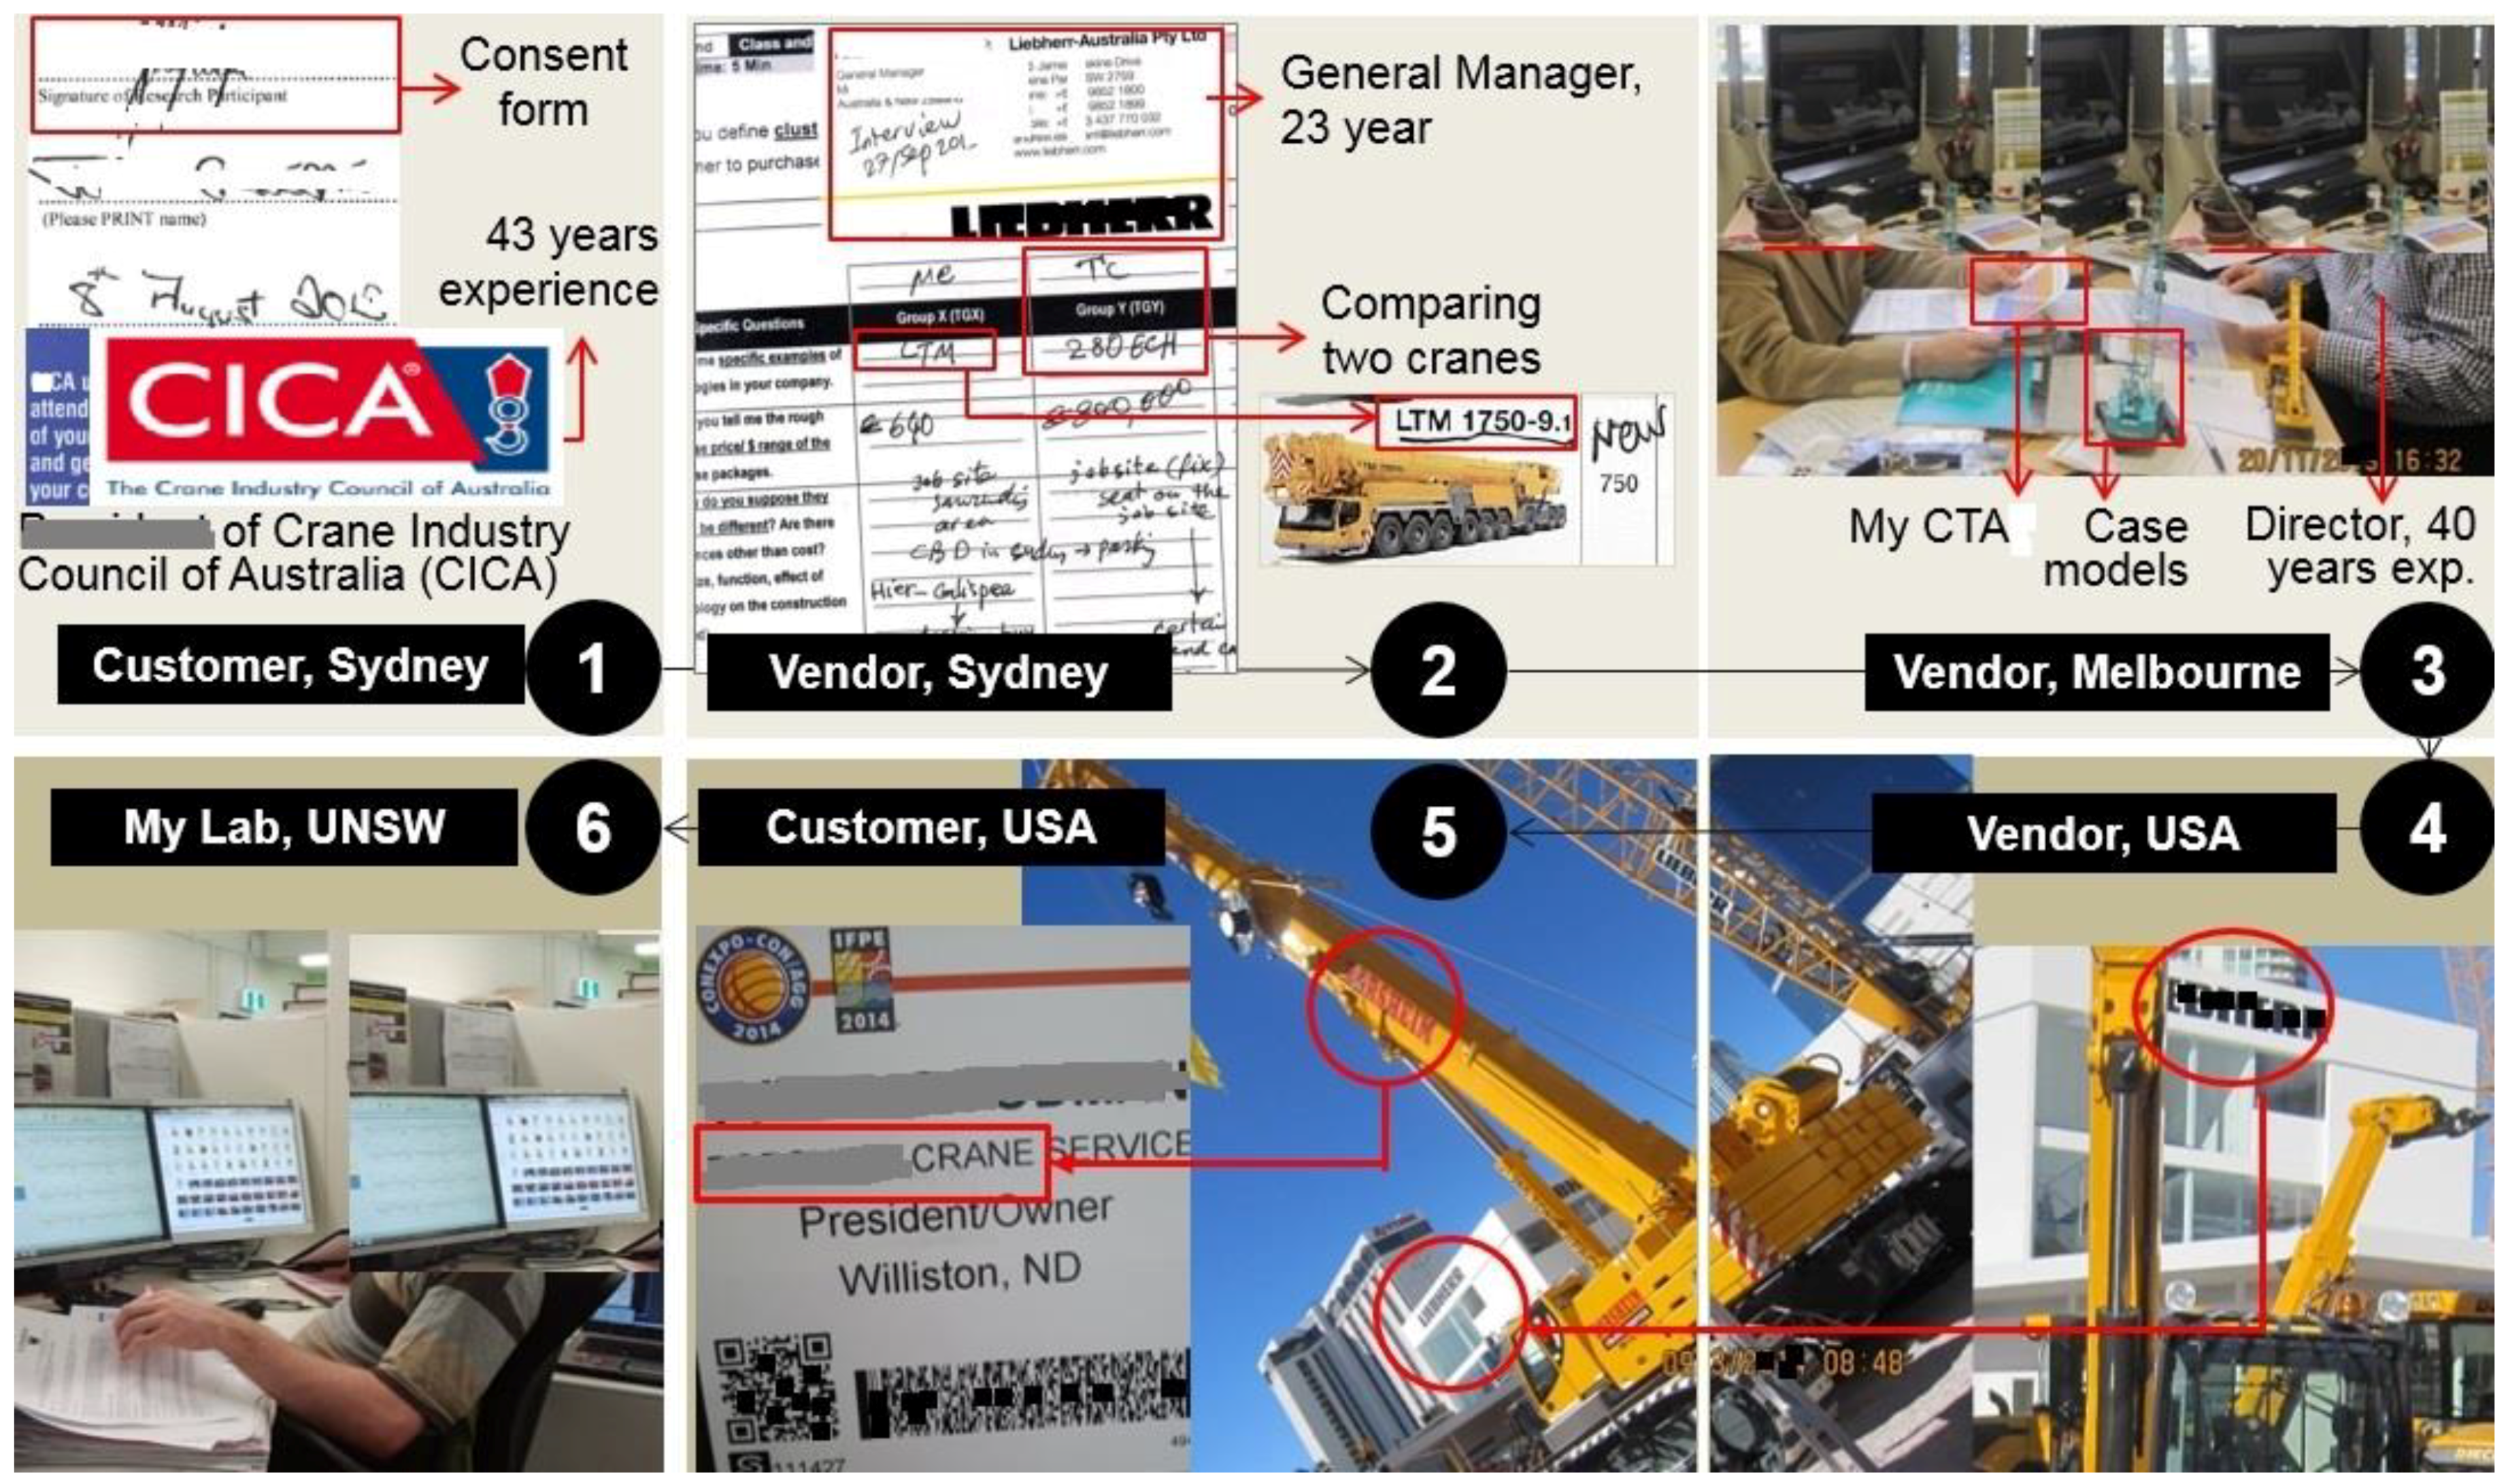
3.4. Triangulation Methods
- Data triangulation was achieved by collecting data from both sides involved in the process (i.e., customers and vendors); different companies (e.g., family businesses and corporations); a diverse range of businesses (e.g., pumping and earthmoving); and different regions (e.g., Australia and North America).
- Methodological triangulation was achieved by using different analysis methods (clustering, factor and thematic analysis), different data types (e.g., photos, voice records, checking structured forms) and from different sources (e.g., TEs or outside exhibitions).
- (a)
- Technology Exhibitions (TEs) were visited to immerse the investigator in the technology market [19]. TEs are the best environment to investigate vendor and customer interactions and to record vendor dissemination activities. These visits also enabled the researcher to learn about new technologies on the market, which helped in interpreting some of the interview data.
- (b)
- Selective participants were recruited using a wide range of strategies including criterion-chain and comparative sampling methods and interviewed to collect the details of the technology adoption process from both the customer and vendor perspectives. Obtaining views from both sides enabled cross-validation of the findings. Each of the TE visits and sampling methods are explained in the following sections.
3.5. Technology Exhibitions
3.6. Selective Participants Using Criterion-Chain and Comparative Sampling Strategies
- had been involved in the technology adoption process for at least two major purchases of different technology types in the previous three years; and
- had been with their present company for at least three years, such that they had good knowledge of their company’s procedures.
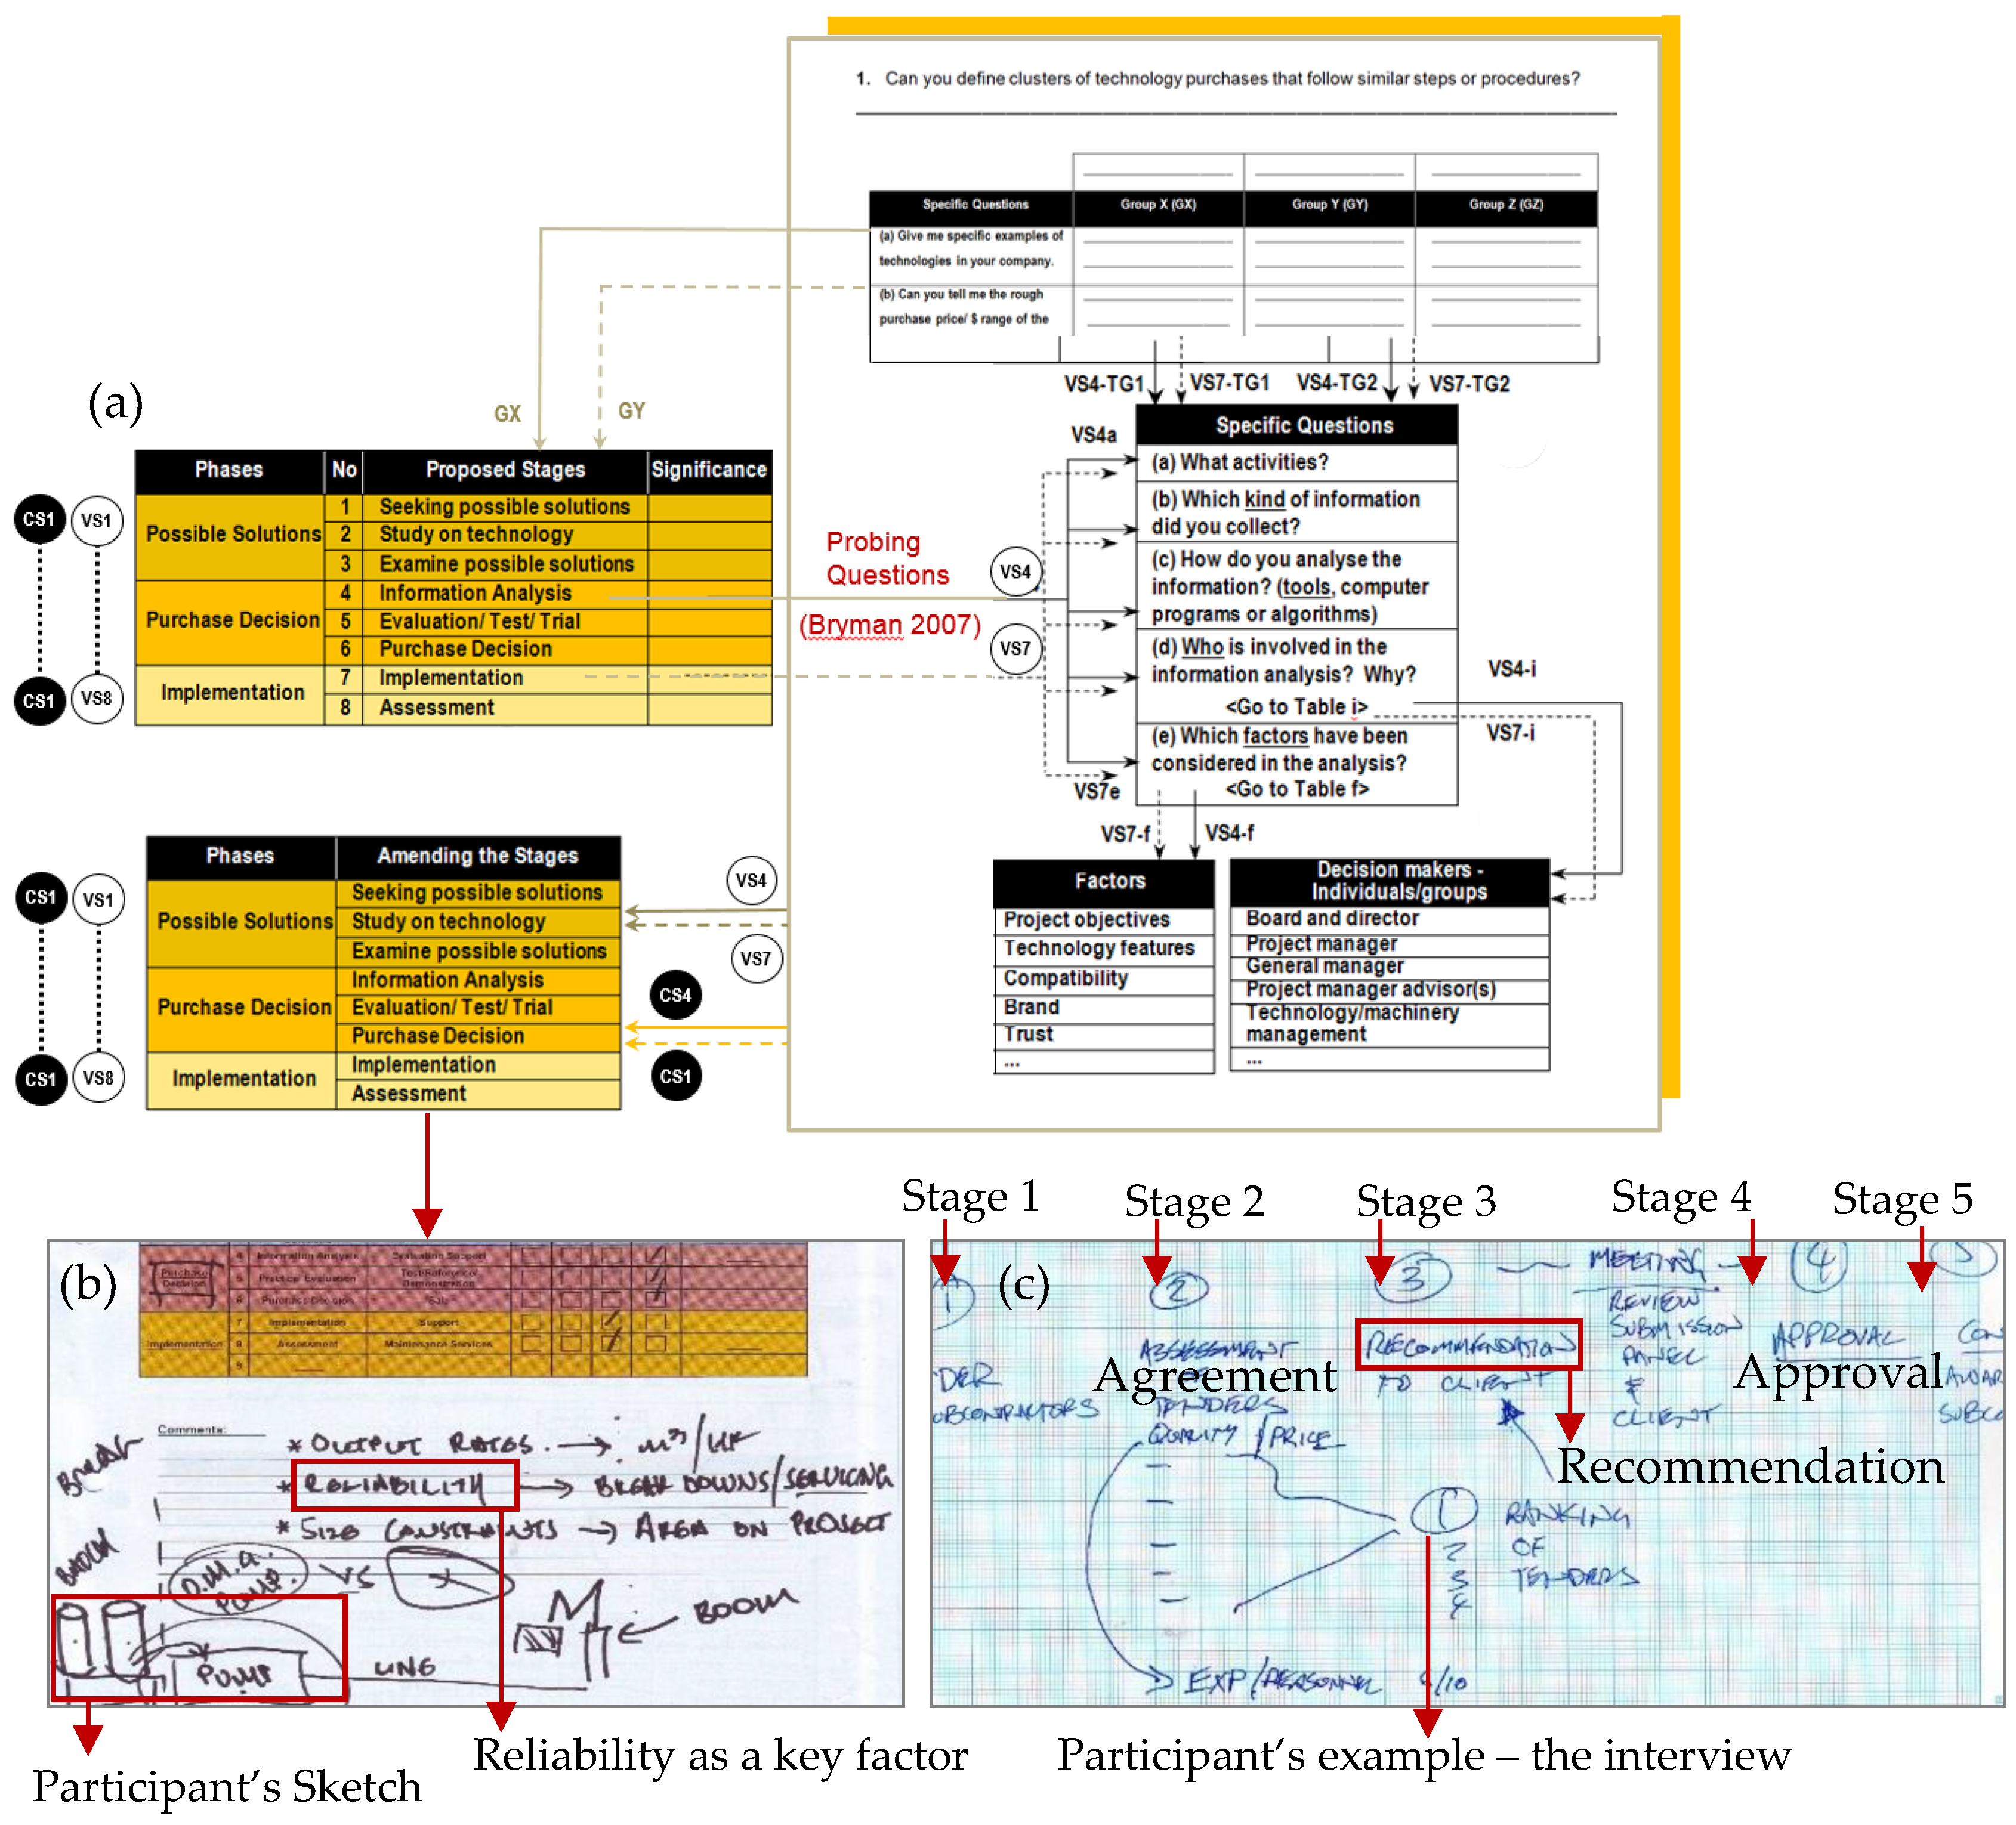
3.7. Semi-Structured Interview
3.8. Questions in the Survey Instrument
3.9. Exploring the Process
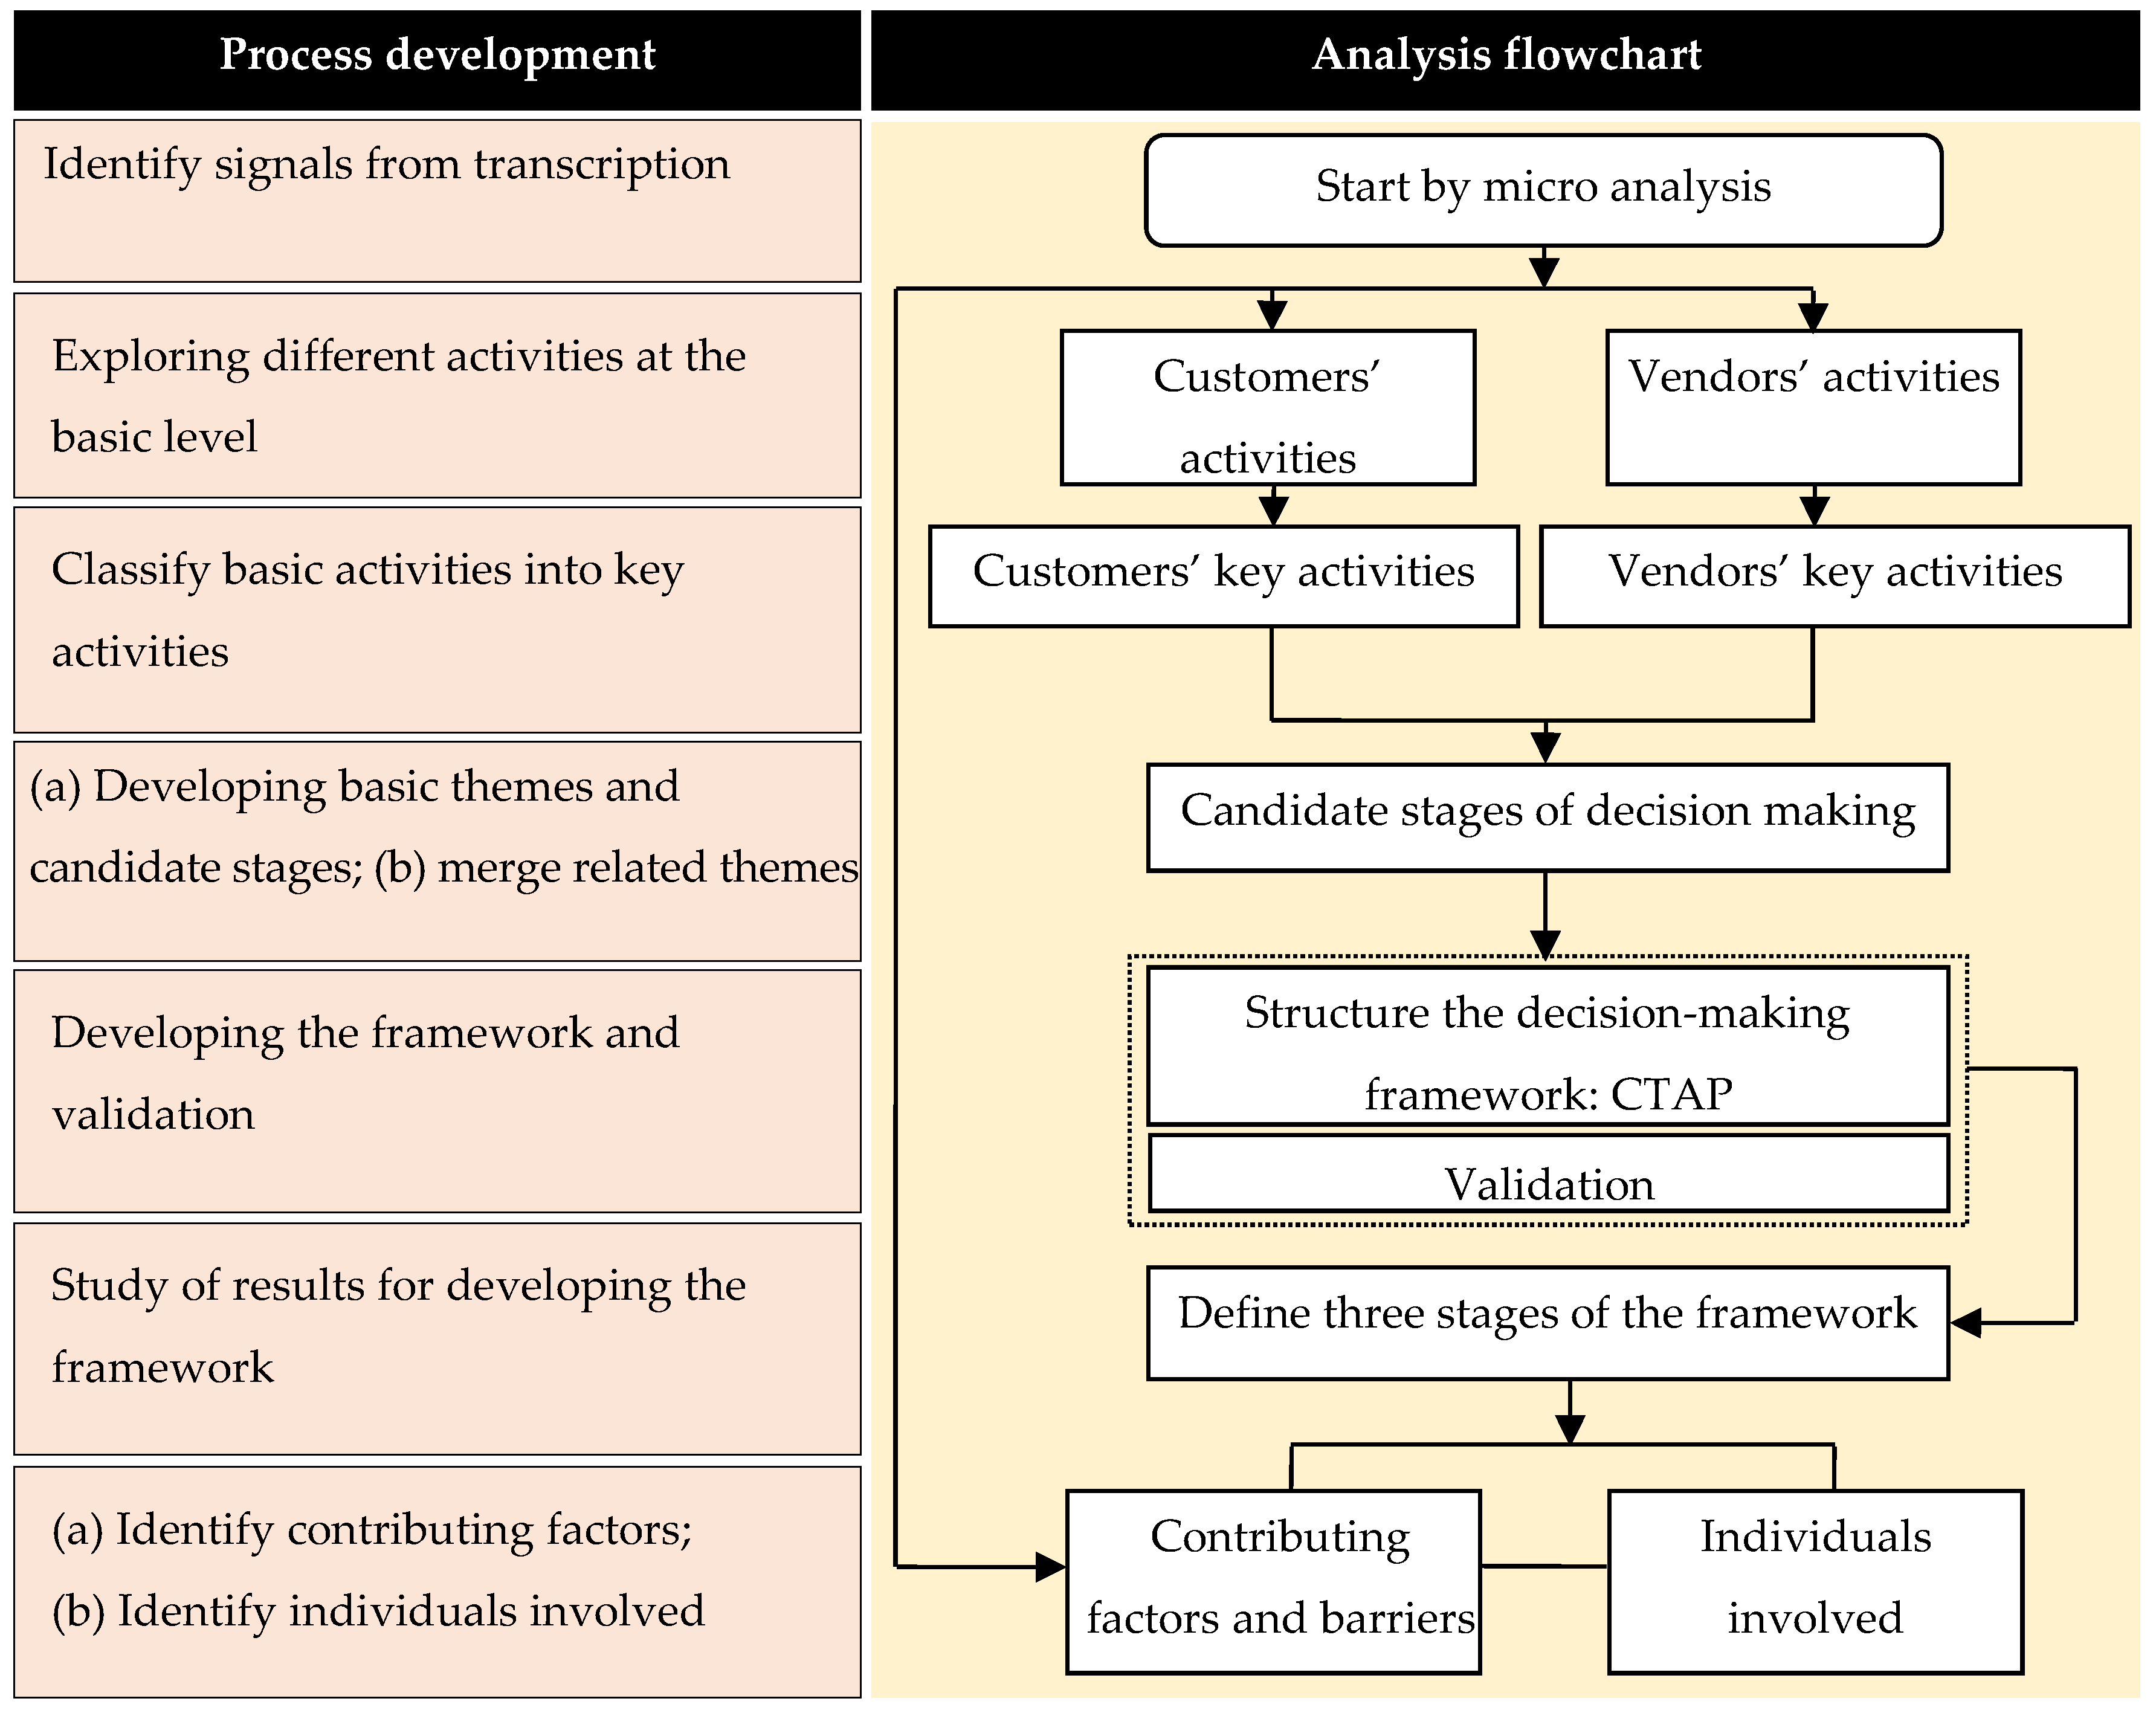
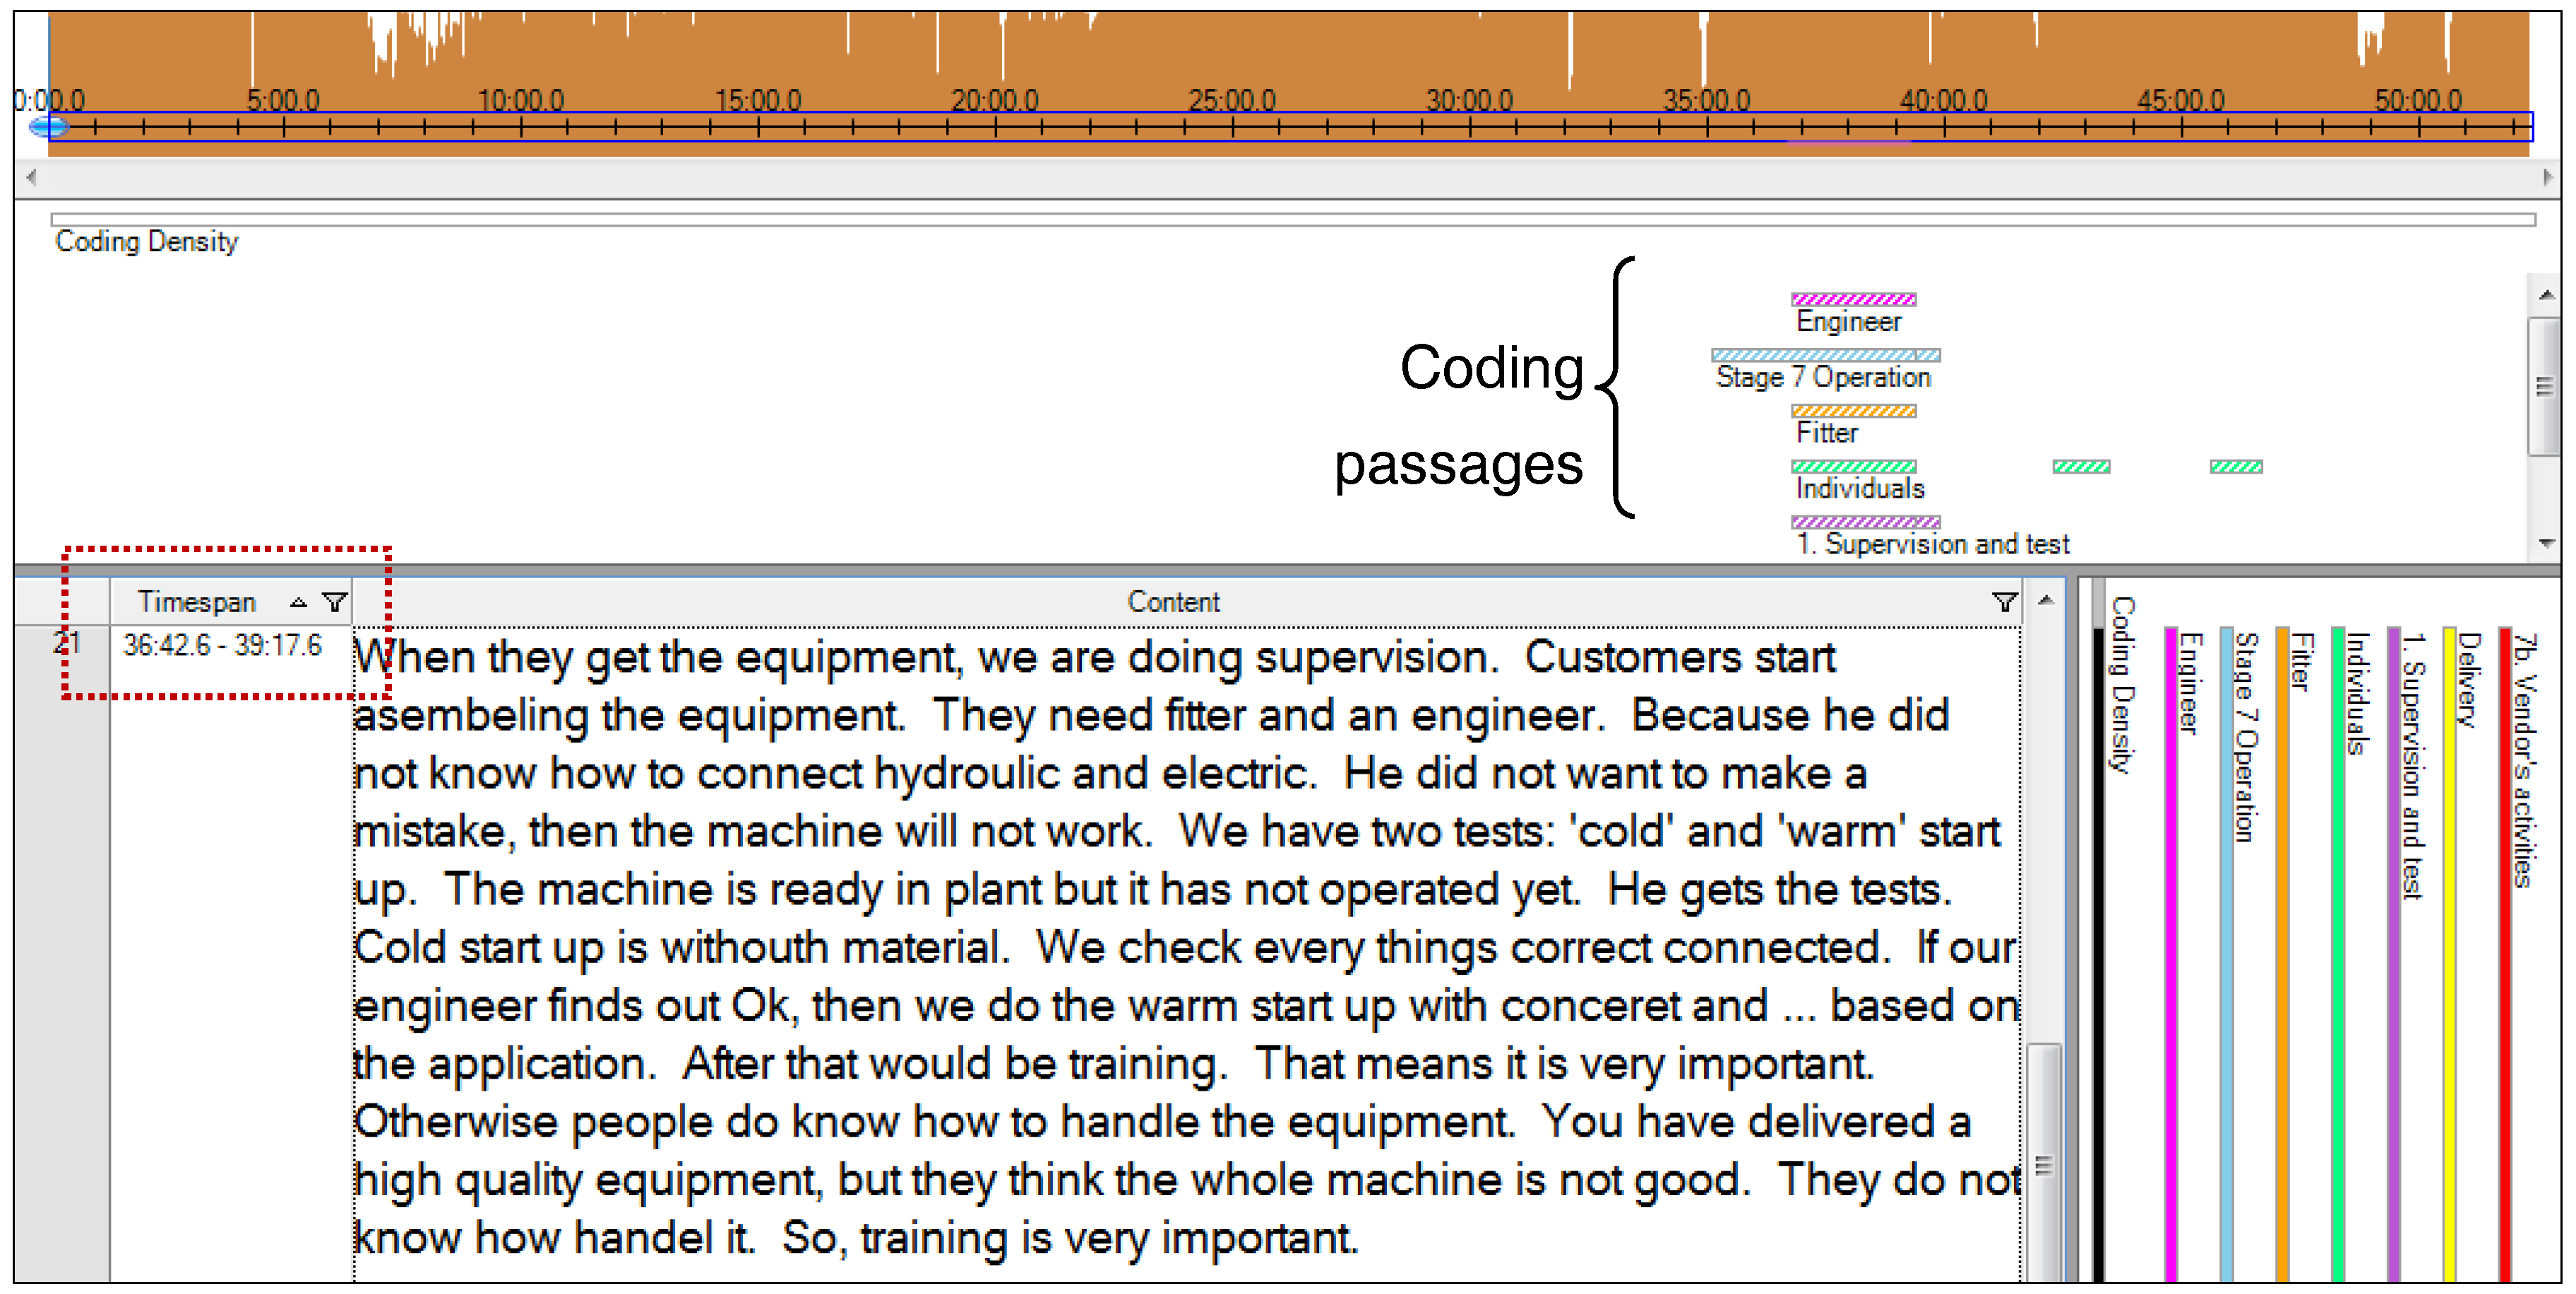
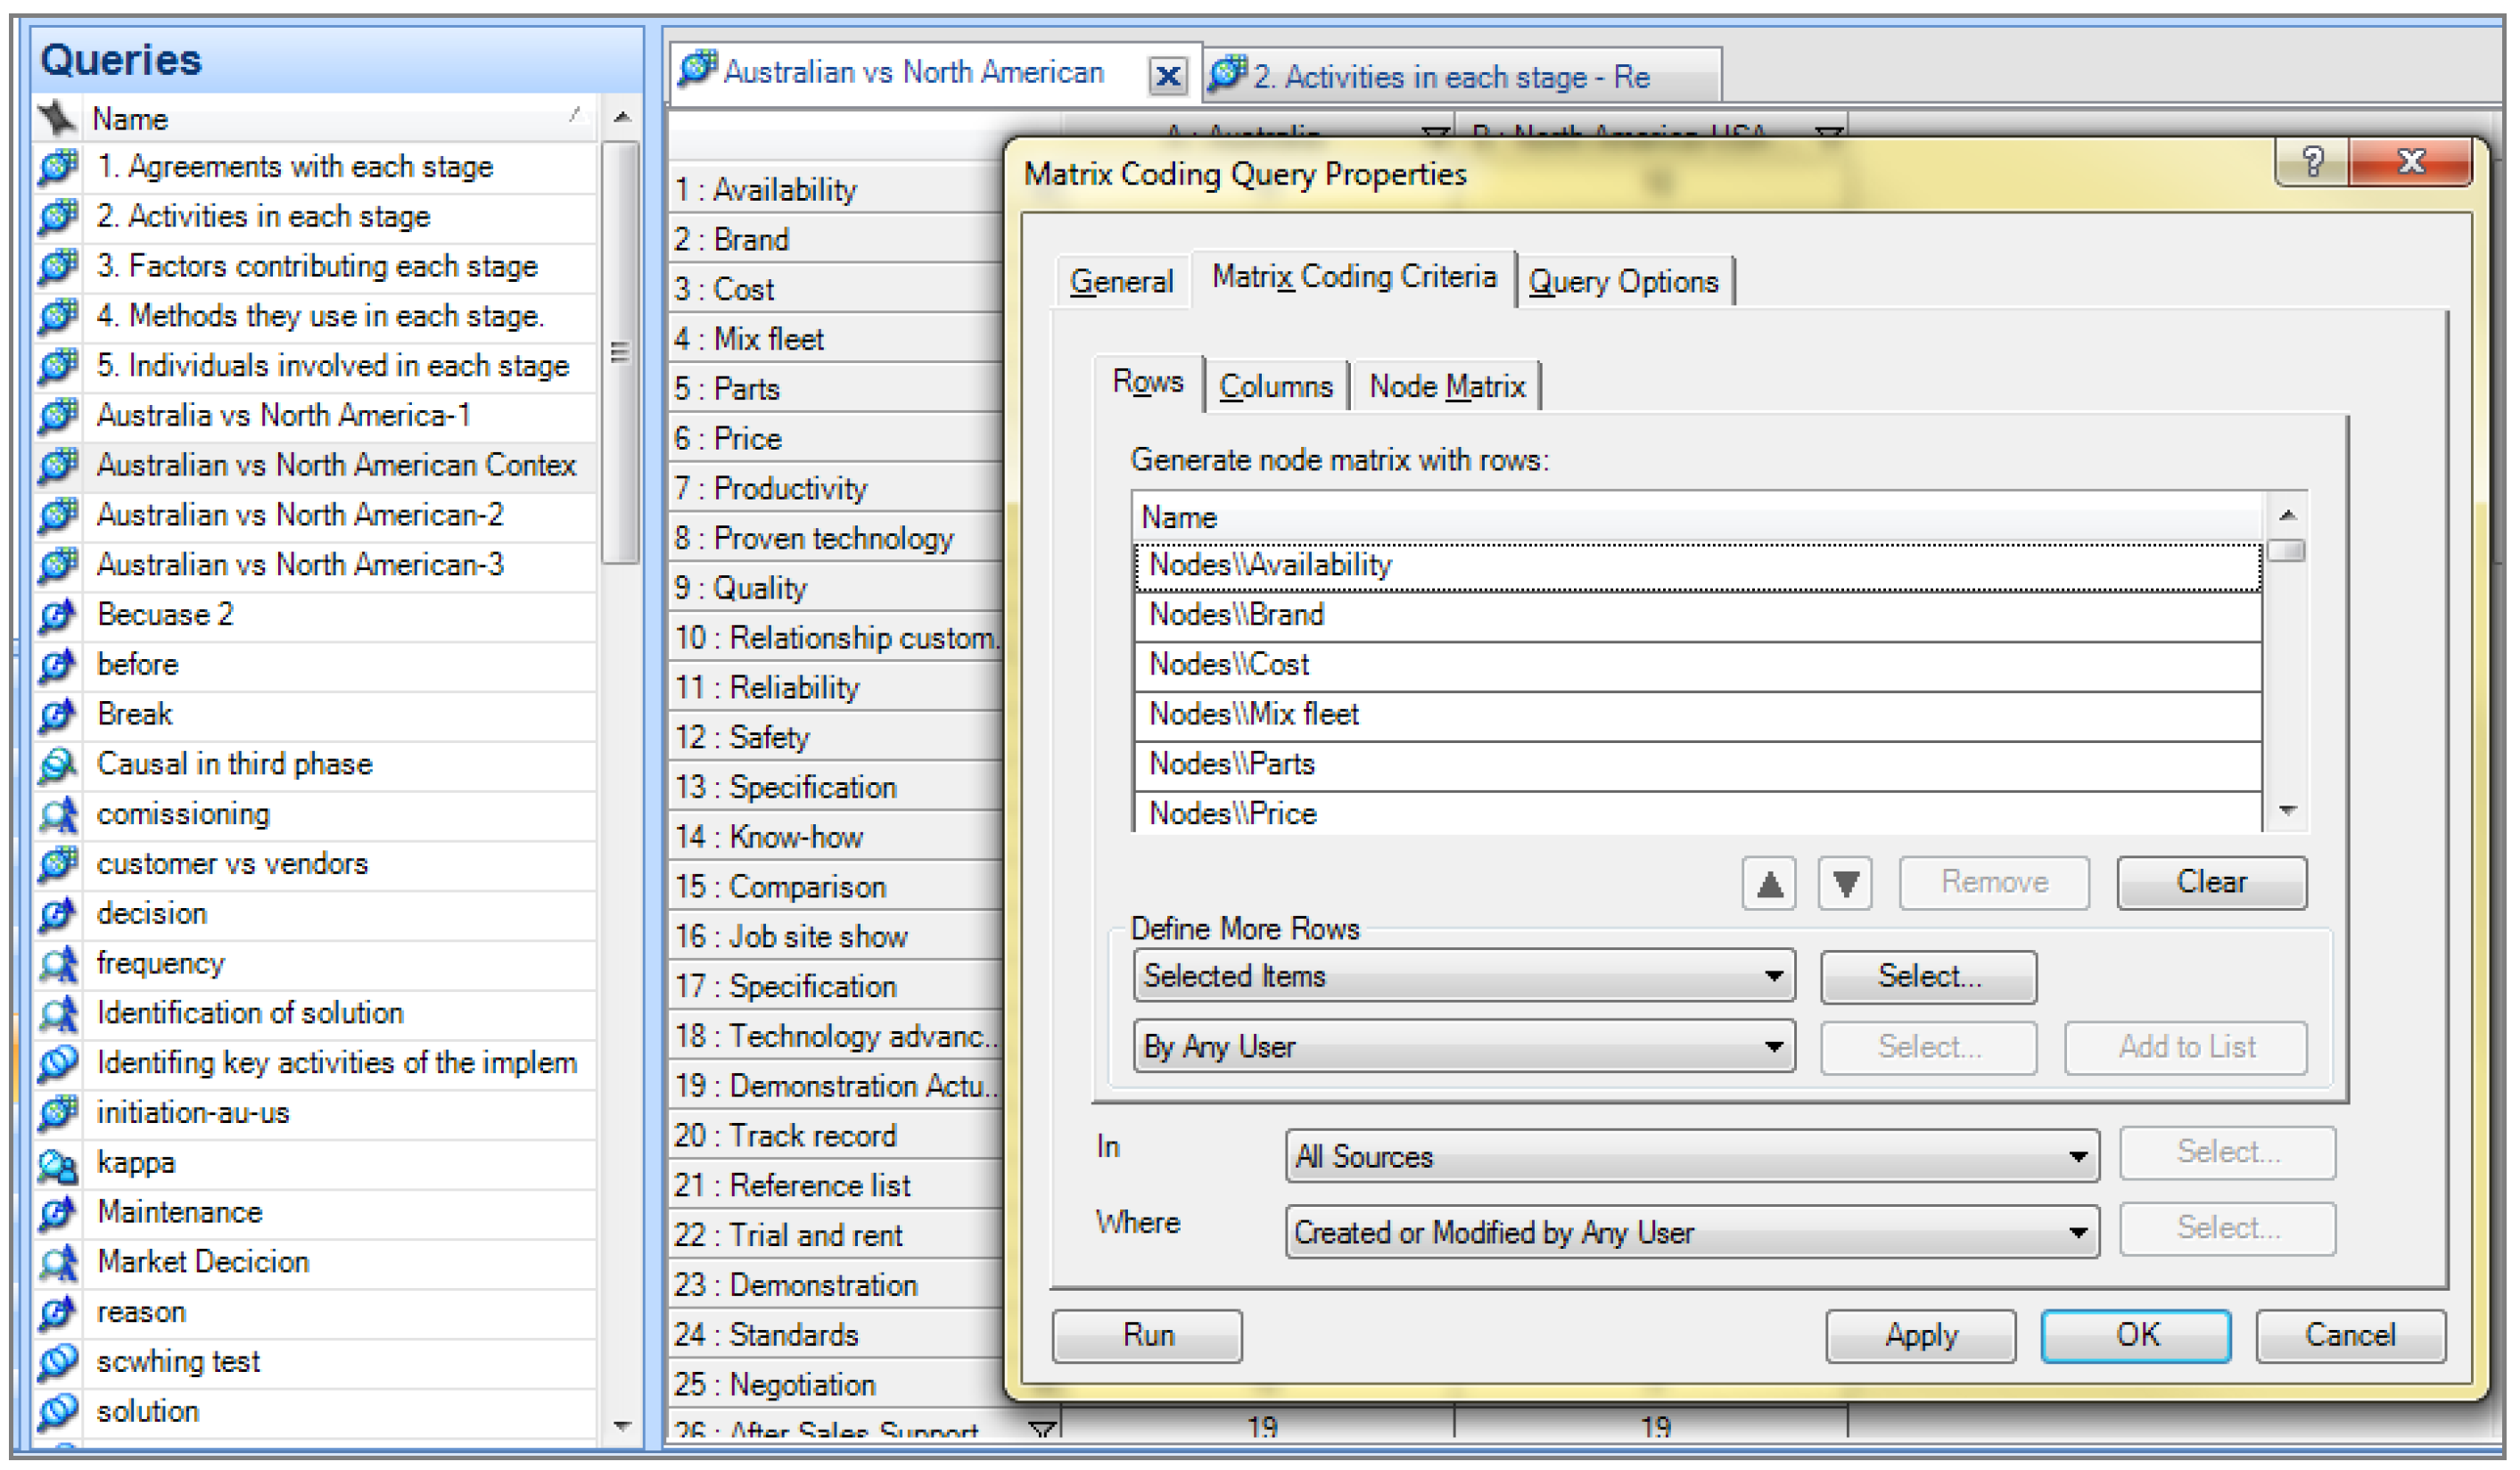
3.10. Micro Analysis and Coding Data
- (1)
- (2)
- any incidents describing the process, to discover patterns and contrasts between groups that might be used ultimately to evaluate the process investigated [107];
- (3)
- causal sentences with signal words (e.g., because, reason, do you know why) that would be used in the next step of the analysis to identify relationships [108];
- (4)
- preceding and sequential statements that might have led to a process (e.g., before, after, then, the next stage);
- (5)
- any new idea or sentence related to the adoption decision [107];
- (6)
3.11. Create Activity and Factor Nodes
4. Results
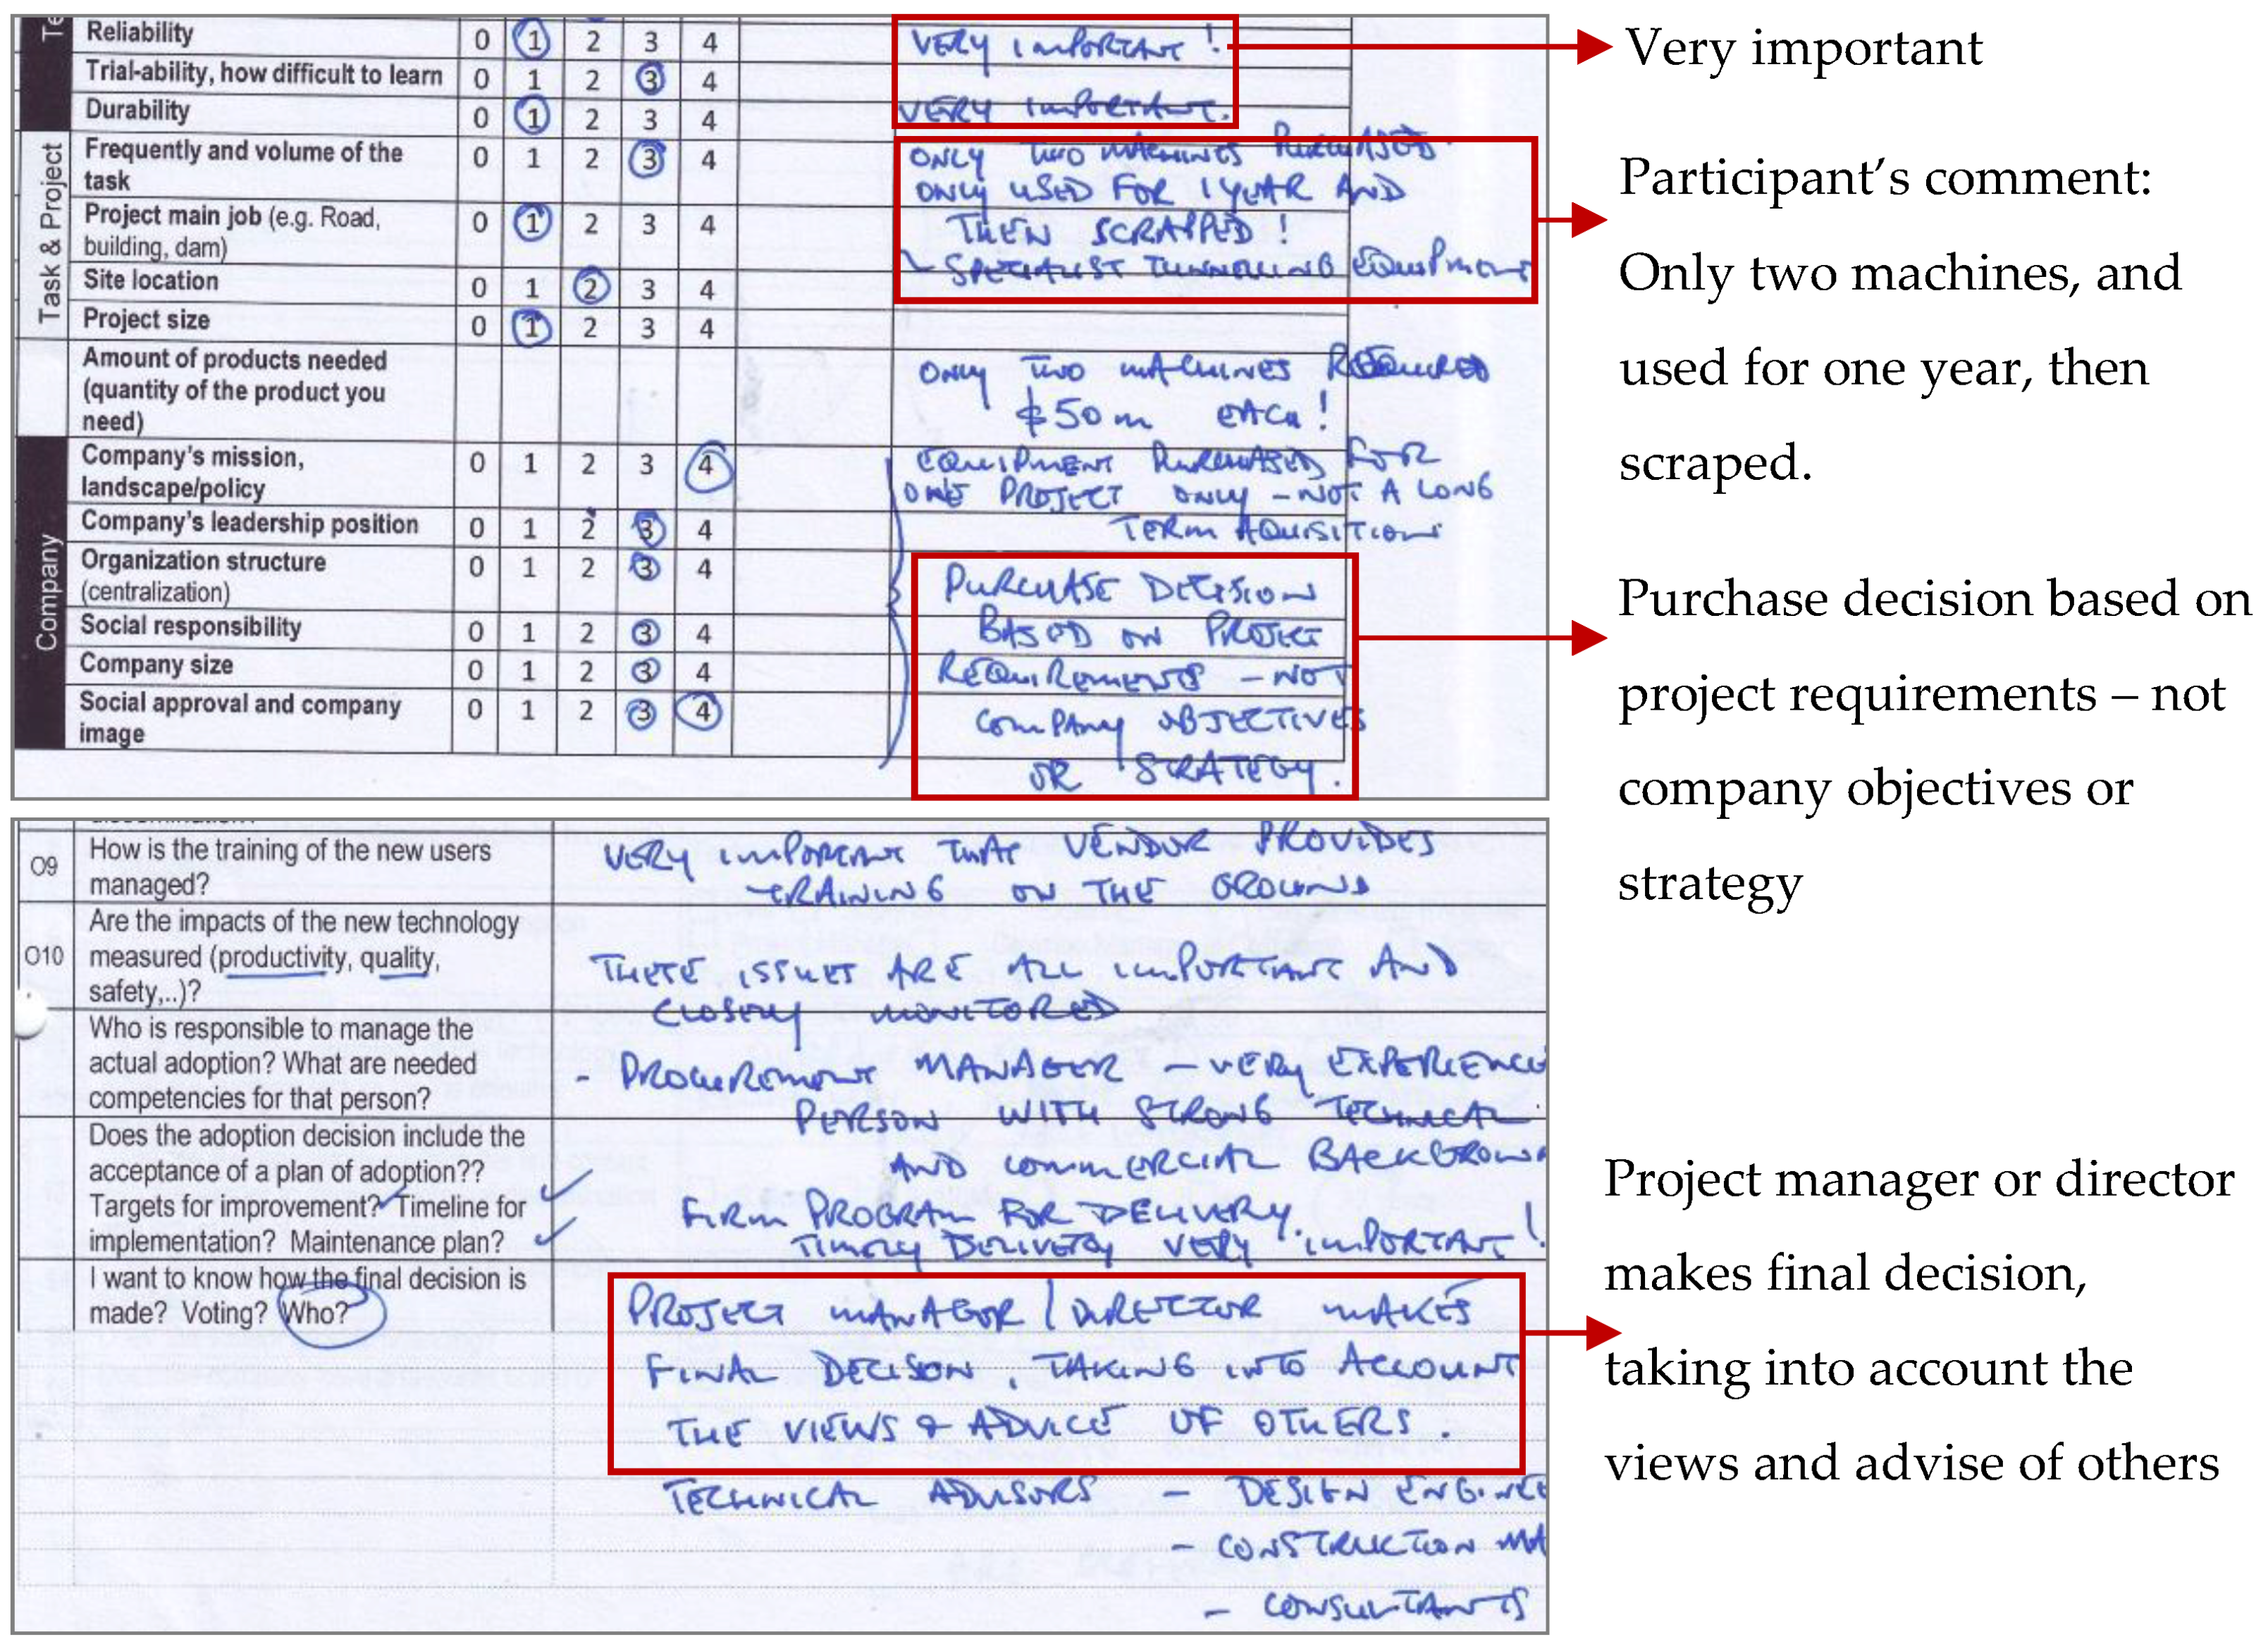
“evaluation of support is the most critical part. That will make or buy the sale. The sale will come later; it will come automatically”.
“[In this stage,] he knows that he wants to buy [brand A], and he gets the price. The pricing difference between [brand A] and [brand B], for example, may only be marginally different. There might only be, let’s say $20,000 in it. [...] So, he will go back to the [brand A] bloke and he will say, ‘This is the quote from [brand B]. He is cheaper than you’. And he will haggle with the price. [The brand A vendor] then says ‘Well, I will I match that’ or he says ‘I cannot do it.’”
“[We make the decision] based on experience; if you find someone that is an equipment person, that has been in the field for many years and has been around different pieces, you get his knowledge: ‘what have you experienced has been the best one for this?’.”
“Normally, the purchasing guy takes three offers. This is the rule. Then he checks the three offers with the [project] manager, and says can we take all three? Do you have any problem if we take three? Or should any company [be] deleted because of technical competency (let’s say technically is not good)? and the manager says, for example, ‘from these three companies we took only two.’ Then they invite both companies.”
5. Discussion and Future Directions
5.1. Technology ‘Dissemination’ Strategy Patterns and Vendors’ Classification
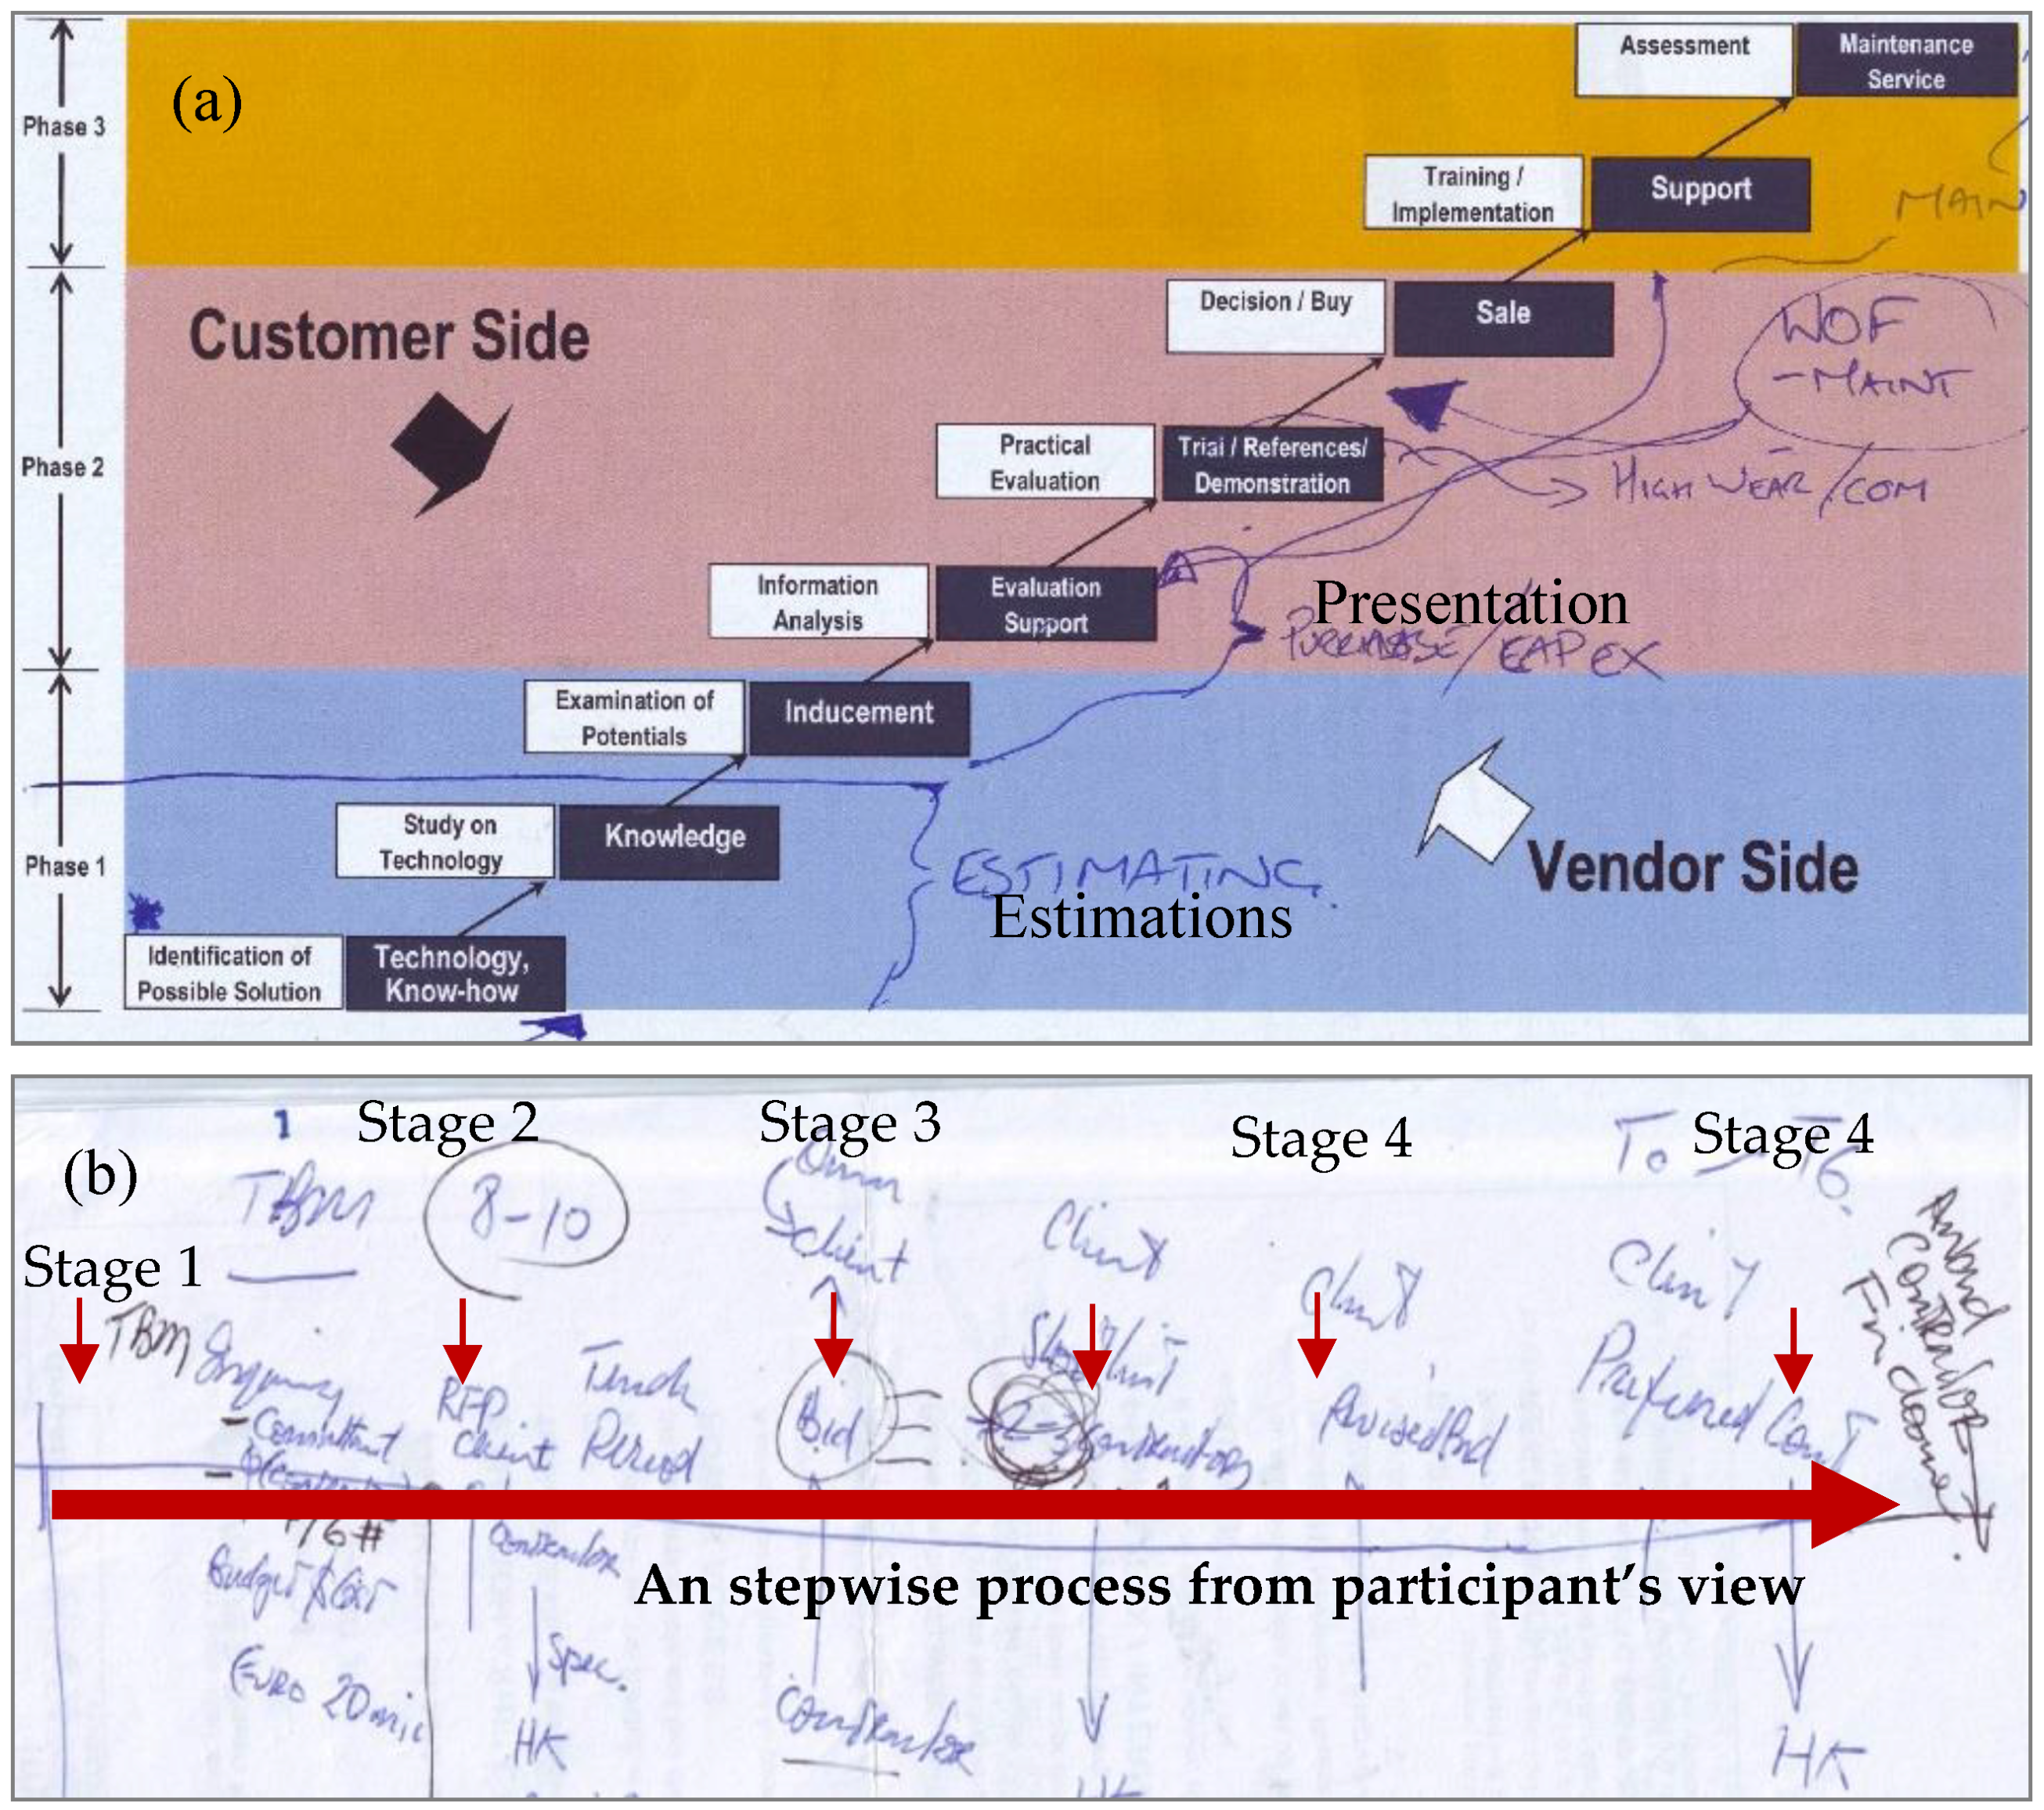
5.2. The ‘Investigation’ Process
5.3. The ‘Adoption Decision’ Process
5.4. The ‘Implementation’ Process
5.5. The ‘CTAP Cube’
5.5.1. Technology Exhibitions and Cluster Analysis
5.5.2. Technology Exhibitions and Factor Analysis
5.5.3. Semi-Structured Interviews and Thematic Analysis
5.5.4. Structured Interviews and AHP Analysis
5.5.5. Cube Development
5.6. Triangulation Techniques and Validation
- Using different datasets from both sides involved in the process (i.e., customers and vendors); different companies (e.g., family business and corporations); diverse types of businesses (e.g., pumping and earthmoving); different regions (e.g., Australia and North America, see Figure 12);
- Using different analysis methods (clustering, factor and thematic analysis); different data (e.g., photos, voice records, checking structured forms); and from different sources (e.g., TEs or outside the exhibitions).
5.7. Statement of CTAP Cube Novelty
- the adoption process consists of separate stages;
- each stage comprises unique activities;
- the process steps of the decision makers (customers) are paralleled by clearly identifiable steps taken by vendors;
- the characteristics of the technology (e.g., large crane) and the need of the customer (e.g., start new project) result in discernible pathways within the adoption process;
- the applications of the CTAP cube provide discernible sub-patterns within the process, which would be applicable for different technology types;
- the study also pointed out factors contributing to the adoption decision process, which would be mapped to the different phases of the adoption process in the future; and
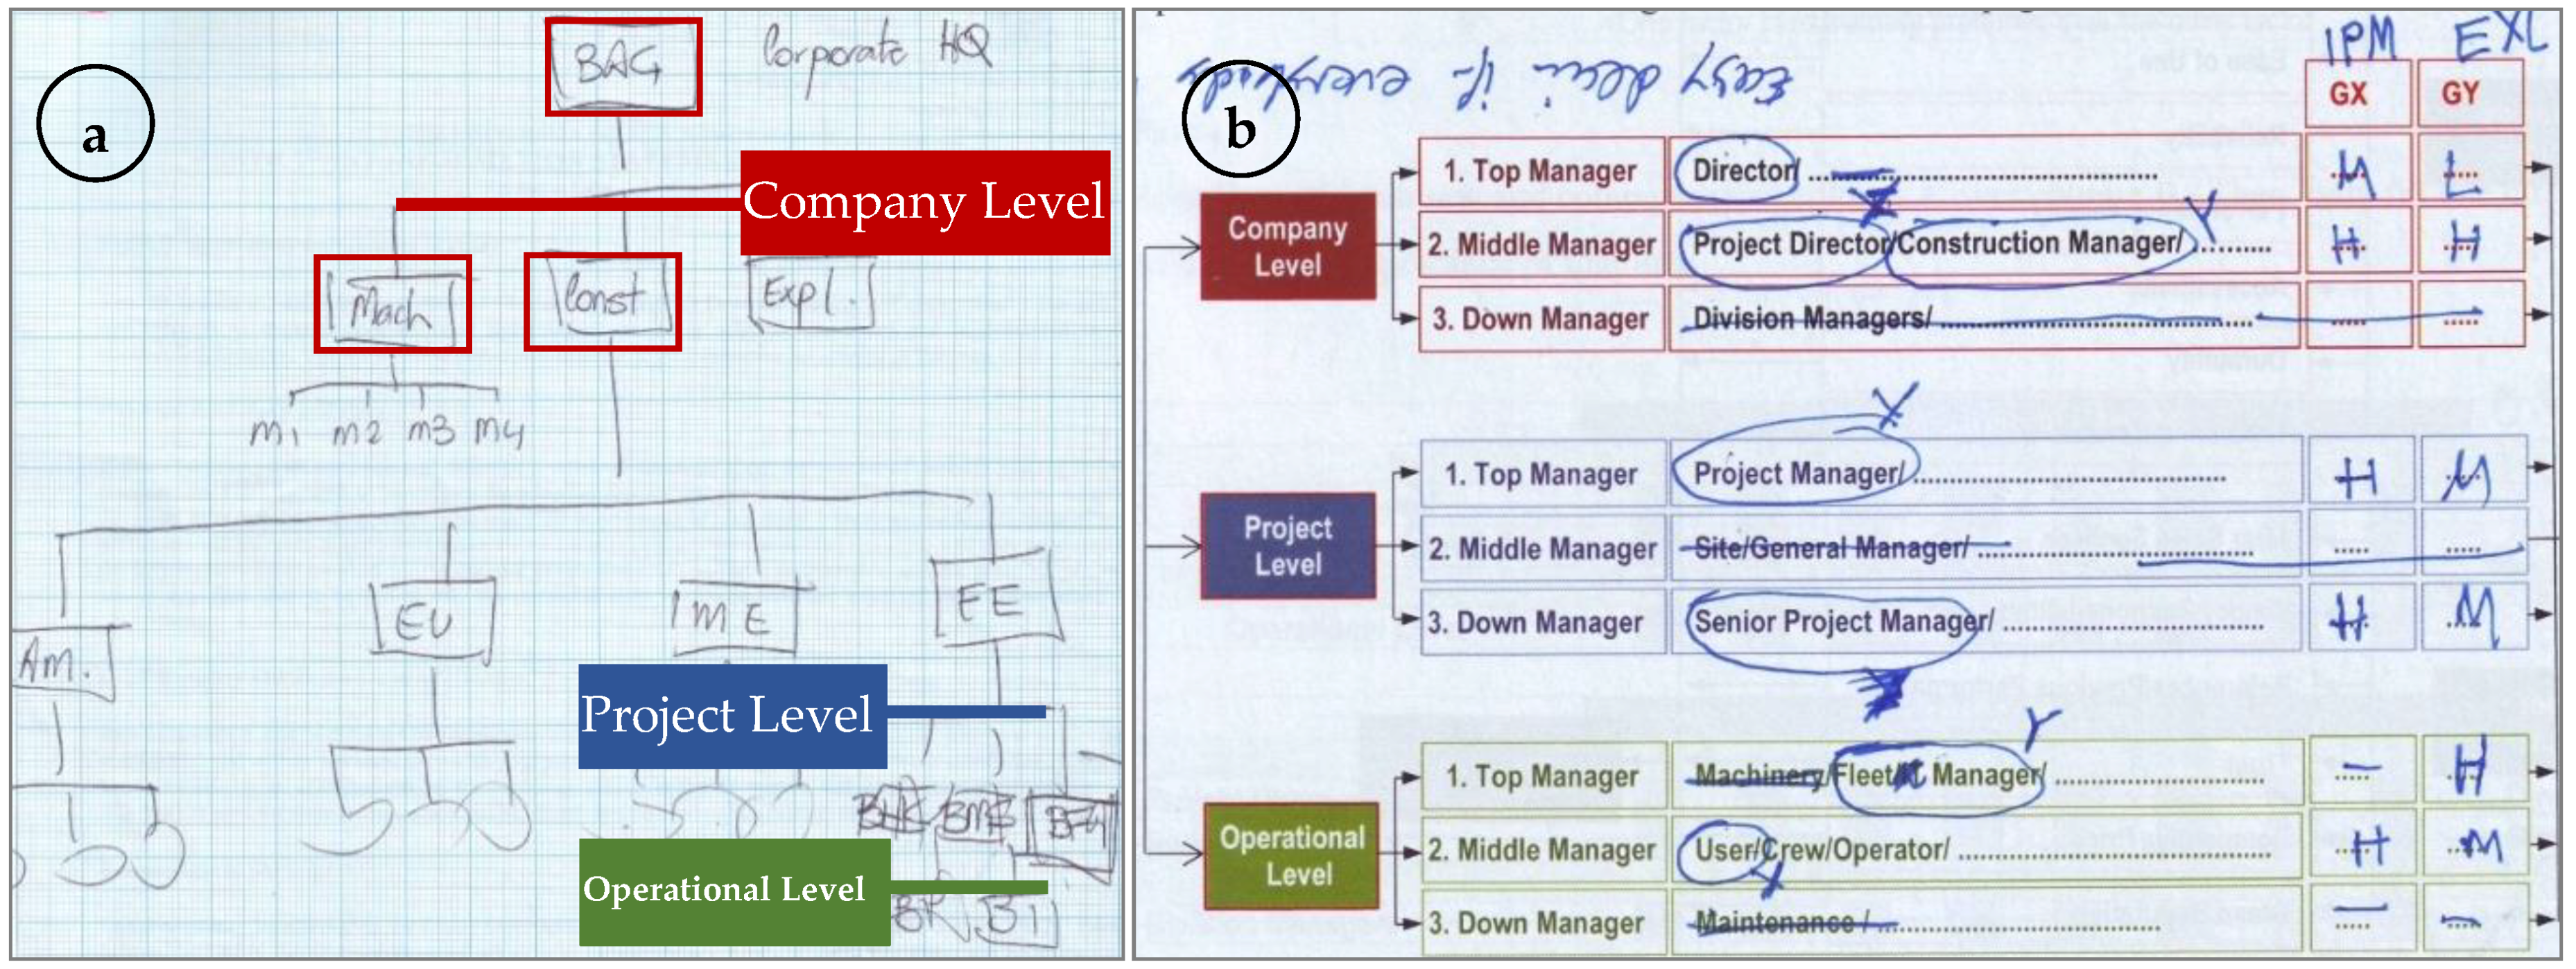
- the study identified the individuals (or more specifically, their roles) involved in different phases of the process.
6. Conclusions
Author Contributions
Funding
Acknowledgments
Conflicts of Interest
References
- Damanpour, F. Organizational Innovation: A Meta-Analysis of Effects of Determinants and Moderators. Acad. Manag. J. 1991, 34, 555–590. [Google Scholar]
- Lee, E.-J.; Lee, J.; Schumann, D.W. The Influence of Communication Source and Mode on Consumer Adoption of Technological Innovations. J. Consum. Aff. 2002, 36, 1–27. [Google Scholar] [CrossRef]
- Porter, M. Competitive Advantage: Creating and Sustaining Superior Performance; Simon and Schuster: New York, NY, USA, 2008. [Google Scholar]
- Skibniewski, M.J. Information Technology Applications in Construction Safety Assurance. J. Civ. Eng. Manag. 2014, 20, 778–794. [Google Scholar] [CrossRef]
- Heller, A.; Orthmann, C. Wireless Technologies for the Construction Sector—Requirements, Energy and Cost Efficiencies. Energy Build. 2014, 73, 212–216. [Google Scholar] [CrossRef]
- Goodrum, P.M.; Haas, C.T. Long-Term Impact of Equipment Technology on Labor Productivity in the U.S. Construction Industry at the Activity Level. J. Constr. Eng. Manag. 2004, 130, 124–133. [Google Scholar] [CrossRef]
- Hong, Y.; Sepasgozar, S.M.E.; Ahmadian, A.F.F.; Akbarnezhad, A. Factors influencing BIM adoption in small and medium sized construction organizations. In Proceedings of the 33th International Symposium on Automation and Robotics in Construction, Auburn, AL, USA, 18–21 July 2016. [Google Scholar]
- Sepasgozar, S.M.; Forsythe, P. Lifting and Handling Equipment: From Selection to Adoption Process. In Proceedings of the 40th Australasian Universities Building Education Association (AUBEA) Conference, Cairns, Australia, 6–8 July 2016. [Google Scholar]
- Ying, H.; Sepasgozar, S.M.; Akbar, N. Key Factors Affecting Construction Organizations’ Acceptance of BIM: A Comparative Study. In Proceedings of the 2016 Modular and Offsite Construction [MOC] Summit, Edmonton, AB, Canada, 29 September–1 October 2016. [Google Scholar]
- Sepasgozar, S.M.; Davis, S.R.; Li, H.; Luo, X. Modeling the Implementation Process for New Construction Technologies: Thematic Analysis Based on Australian and US Practices. J. Manag. Eng. 2018, 34, 05018005. [Google Scholar] [CrossRef]
- Haas, C.T.; Borcherding, J.D.; Allmon, E.; Goodrum, P.M. U.S. Construction Labor Productivity Trends, 1970–1998. J. Constr. Eng. Manag. 1999, 126. [Google Scholar] [CrossRef]
- Miettinen, R.; Paavola, S. Beyond the BIM utopia: Approaches to the development and implementation of building information modeling. Autom. Constr. 2014, 43, 84–91. [Google Scholar] [CrossRef]
- Skibniewski, M.J. Research Trends in Information Technology Applications in Construction Safety Engineering and Management. Front. Eng. Manag. 2015, 1, 246–259. [Google Scholar] [CrossRef]
- Shirowzhan, S.; Sepasgozar, S.M.E.; Zaini, I.; Wang, C. An integrated GIS and Wi-Fi based Locating system for improving construction labor communications. In Proceedings of the 34th International Symposium on Automation and Robotics in Construction (ISARC 2017), Taipei, Taiwan, 28 June–1 July 2017. [Google Scholar]
- Didehvar, N.; Teymourifard, M.; Mojtahedi, M.; Sepasgozar, S. An Investigation on Virtual Information Modeling Acceptance Based on Project Management Knowledge Areas. Preprints 2018, 2018050024. [Google Scholar] [CrossRef]
- Manley, K.; McFallan, S.; Kajewski, S. Relationship between Construction Firm Strategies and Innovation Outcomes. J. Constr. Eng. Manag. 2009, 135, 764–771. [Google Scholar] [CrossRef] [Green Version]
- Sexton, M.; Barrett, P. Appropriate innovation in small construction firms. Constr. Manag. Econ. 2003, 21, 623–633. [Google Scholar] [CrossRef]
- Goodrum, P.M.; Haas, C.T.; Caldas, C.; Zhai, D.; Yeiser, J.; Homm, D. Model to Predict the Impact of a Technology on Construction Productivity. J. Constr. Eng. Manag. 2010, 137, 678–688. [Google Scholar] [CrossRef]
- Sepasgozar, S.M.E.; Davis, S. Diffusion Pattern Recognition of Technology Vendors in Construction. In Proceedings of the Construction Research Congress, Atlanta, GA, USA, 19–21 May 2014; pp. 2106–2115. [Google Scholar]
- Statista. Largest Construction Machinery Manufacturers Worldwide—Sales 2013. 2014. Available online: http://www.statista.com/statistics/280343/leading-construction-machinery-manufacturers-worldwide-based-on-sales/ (accessed on 1 September 2014).
- Statista. Global Construction Machinery Market—Outlook through 2015. 2014. Available online: http://www.statista.com/statistics/280344/size-of-the-global-construction-machinery-market/ (accessed on 1 Sepember 2014).
- Association of Equipment Manufacturers (AEM). U.S. Construction Machinery Exports Down 21 Percent at Midyear 2013; Association of Equipment Manufacturers (AEM): Milwaukee, WI, USA, 2013. [Google Scholar]
- Frambach, R.T.; Schillewaert, N. Organizational Innovation Adoption: A Multi-level Framework of Determinants and Opportunities for Future Research. J. Bus. Res. 2002, 55, 163–176. [Google Scholar] [CrossRef]
- Devapriya, K.A.K.; Ganesan, S. Technology transfer subcontracting in developing countries through. Build. Res. Inf. 2002, 30, 171–182. [Google Scholar] [CrossRef]
- Drejer, I.; Vinding, A.L. Organisation, anchoring of knowledge, and innovative activity in construction. Constr. Manag. Econ. 2006, 24, 921–931. [Google Scholar] [CrossRef]
- MacGauran, P.; Macfarlane, I. Construction 2020 A Vision for Australias Property and Construction Industry; CRC for Construction Innovation: Brisbane, Australia, 2004. [Google Scholar]
- Business Council of Australia (BCA). Pipeline or Dream—Securing Australia’s Investment Future; Business Council of Australia: Sydney, Australia, 2012. [Google Scholar]
- GCS. Government Construction Strategy; UK Cabinet Office: London, UK, 2011; p. 14.
- Brewer, G.; Gajendran, T.; Goff, R.L. Building Information Modelling (BIM): Australian Perspectives and Adoption Trends; Tasmanian Building and Construction Industry Training Board: Battery Point, Australia, 2012. [Google Scholar]
- Barlow, J. Innovation and Learning in Complex Offshore Construction Projects. Rese. Policy 2000, 29, 973–989. [Google Scholar] [CrossRef]
- Dubois, A.; Gadde, L.-E. The Construction Industry as a Loosely Coupled System: Implications for Productivity and Innovation. Constr. Manag. Econ. 2002, 20, 621–631. [Google Scholar] [CrossRef]
- Straub, E.T. Understanding Technology Adoption: Theory and Future Directions for Informal Learning. Rev. Educ. Res. 2009, 79, 625–649. [Google Scholar] [CrossRef]
- Hinkka, V.; Tätilä, J. RFID Tracking Implementation Model for the Technical Trade and Construction Supply Chains. Autom. Constr. 2013, 35, 405–414. [Google Scholar] [CrossRef]
- Ozorhon, B.; Oral, K. Drivers of Innovation in Construction Projects. J. Constr. Eng. Manag. 2017, 143, 04016118. [Google Scholar] [CrossRef]
- Sardroud, J. Perceptions of Automated Data Collection Technology Use in the Construction Industry. J. Civ. Eng. Manag. 2014, 21, 54–66. [Google Scholar] [CrossRef]
- Lee, S.; Yu, J.; Jeong, D. BIM Acceptance Model in Construction Organizations. J. Manag. Eng. 2013, 31, 04014048. [Google Scholar] [CrossRef]
- Robertson, T.S.; Gatignon, H. Competitive Effects on Technology Diffusion. J. Mark. 1986, 50, 1–12. [Google Scholar] [CrossRef]
- Slaughter, E.S. Models of Construction Innovation. J. Constr. Eng. Manag. 1998, 124, 226–231. [Google Scholar] [CrossRef]
- Blayse, A.; Manley, K. Key Influences on Construction Innovation. Constr. Innov. 2004, 4, 143–154. [Google Scholar] [CrossRef]
- Damanpour, F.; Aravind, D. Managerial Innovation: Conceptions, Processes, and Antecedents. Manag. Organ. Rev. 2012, 8, 423–454. [Google Scholar] [CrossRef]
- Sepasgozar, S.; Lim, S.; Shirowzhan, S.; Kim, Y.; Nadoushani, Z.M. Utilisation of a New Terrestrial Scanner for Reconstruction of As-built Models: A Comparative Study. In Proceedings of the International Symposium on Automation and Robotics in Construction, Oulu, Finland, 15–18 June 2015. [Google Scholar]
- MacKenzie, D.; Wajcman, J. The Social Shaping of Technology; Open University Press: Buckingham, UK, 1999. [Google Scholar]
- Bijker, W.E. How Is Technology Made?—That Is the Question! Camb. J. Econ. 2010, 34, 63–76. [Google Scholar] [CrossRef]
- Arditi, D.; Kale, S.; Tangkar, M. Innovation in Construction Equipment and Its Flow into the Construction Industry. J. Constr. Eng. Manag. 1997, 123, 371–378. [Google Scholar] [CrossRef]
- Skibniewski, M.J.; Zavadskas, E.K. Technology Development in Construction: A Continuum From Distant Past into the Future. J. Civ. Eng. Manag. 2013, 19, 136–147. [Google Scholar] [CrossRef]
- Tatum, C.B. Technology and Competitive Advantage in Civil Engineering. J. Prof. Issues Eng. Educ. Pract. 1988, 114, 256–264. [Google Scholar] [CrossRef]
- Sepasgozar, S.M.E.; Loosemore, M.; Davis, S.R. Conceptualising information and equipment technology adoption in construction: A critical review of existing research. Eng. Constr. Architect. Manag. 2016, 23, 158–176. [Google Scholar] [CrossRef]
- Brandon, P.S.; Lu, S.-L. Clients Driving Innovation; John Wiley & Sons: Hoboken, NJ, USA, 2008. [Google Scholar]
- Shirowzhan, S.; Sepasgozar, S.; Liu, C. Monitoring Physical Progress of Indoor Buildings Using Mobile and Terrestrial Point Clouds. In Proceedings of the Construction Research Congress, New Orleans, LA, USA, 2–4 April 2018. [Google Scholar]
- Hooper, B.; Haris, M. 2020 Vision; Royal Institution of Chartered Surveyors: London, UK, 2010; pp. 34–36. [Google Scholar]
- Shirowzhan, S.; Lim, S.; Trinder, J. Enhanced Autocorrelation-Based Algorithms for Filtering Airborne Lidar Data over Urban Areas. J. Surv. Eng. 2016, 142, 04015008. [Google Scholar] [CrossRef]
- Sepasgozar, S.M.E.; Forsythe, P.; Shirowzhan, S.; Norzahari, F. Scanners and Photography: A Combined Framework. In Proceedings of the 40th Annual Australasian Universities Building Education Association (AUBEA 2016) Conference, Cairns, Australia, 6–8 July 2016. [Google Scholar]
- Sepasgozar, S.; Loosemore, M. The role of customers and vendors in modern construction equipment technology diffusion. Eng. Constr. Archit. Manag. 2017, 24, 1–20. [Google Scholar] [CrossRef]
- Sepasgozar, S.M.; Bernold, L.E. Factors Influencing the Decision of Technology Adoption in Construction. In Proceedings of the Developing the Frontier of Sustainable Design, Engineering, and Construction—ICSDEC, Fort Worth, TX, USA, 7–9 November 2012. [Google Scholar]
- Rogers, E.M. Diffusion of Innovations, 4th ed.; Free Press: New York, NY, USA, 1995. [Google Scholar]
- Damanpour, F.; Schneider, M. Phases of the Adoption of Innovation in Organizations: Effects of Environment, Organization and Top Managers. Br. J. Manag. 2006, 17, 215–236. [Google Scholar] [CrossRef]
- Foroozanfar, M.; Sepasgozar Samad, M.E. Modeling Green Digital Technology Implementation in Construction. In Proceedings of the Construction Research Congress, New Orleans, LA, USA, 2–4 April 2018. [Google Scholar]
- Foroozanfar, M.; Sepasgozar, S.M.E.; Arbabi, H. An empirical investigation on construction companies’ readiness for adopting sustainable technology. In Proceedings of the 34th International Symposium on Automation and Robotics in Construction (ISARC 2017), Taipei, Taiwan, 28 June–1 July 2017. [Google Scholar]
- Davis, F.D.; Bagozzi, R.P.; Warshaw, P.R. User Acceptance of Computer Technology: A Comparison of Two Theoretical Models. Manag. Sci. 1989, 35, 982–1003. [Google Scholar] [CrossRef]
- Venkatesh, V.; Bala, H. Technology Acceptance Model 3 and a Research Agenda on Interventions. Decis. Sci. 2008, 39, 273–315. [Google Scholar] [CrossRef]
- Sepasgozar, S.; Shirowzhan, S.; Wang, C.C. A Scanner Technology Acceptance Model for Construction Projects. Procedia Eng. 2017, 180, 1237–1246. [Google Scholar] [CrossRef]
- Sepasgozar, S.; Bliemel, M.; Bemanian, M. Discussion of “Barriers of Implementing Modern Methods of Construction” by M. Motiar Rahman. J. Manag. Eng. 2015, 32, 07015001. [Google Scholar] [CrossRef]
- Ritchie, J.; Spencer, L. Qualitative Data Analysis for Applied Policy Research. In The Qualitative Researcher’s Companion; Routledge: London, UK, 2002; pp. 305–329. [Google Scholar]
- Cassell, C.; Symon, G. Essential Guide to Qualitative Methods in Organizational Research; Sage Publications: Thousand Oaks, CA, USA, 2004. [Google Scholar]
- Yin, R.K. Qualitative Research from Start to Finish; Guilford Press: New York, NY, USA, 2010. [Google Scholar]
- Gibbs, G.R. Qualitative Data Analysis: Explorations with NVivo; Open University Press: Buckingham, UK, 2002. [Google Scholar]
- Urquhart, C. Grounded Theory for Qualitative Research: A Practical Guide; Sage Publications: London, UK, 2012. [Google Scholar]
- Charmaz, K. Constructing Grounded Theory; Sage Publications: Thousand Oaks, CA, USA, 2014. [Google Scholar]
- Charmaz, K. Grounded Theory Methods in Social Justice Research. In The Sage Handbook of Qualitative Research; Denzin, N.K., Lincoln, Y.S., Eds.; Sage Publications: Thousand Oaks, CA, USA, 2011; pp. 359–380. [Google Scholar]
- Glaser, B.G.; Strauss, A.L. The Discovery of Grounded Theory: Strategies for Qualitative Research; Transaction Publishers: Piscataway, NJ, USA, 2009. [Google Scholar]
- Belk, R.W. Handbook of Qualitative Research Methods in Marketing; Edward Elgar Publishing: Cheltenham, UK, 2008. [Google Scholar]
- Adriaanse, A.; Voordijk, H.; Dewulf, G. The Use of Interorganisational ICT in United States Construction Projects. Autom. Constr. 2010, 19, 73–83. [Google Scholar]
- Brockmann, C.; Brezinski, H.; Erbe, A. Innovation in Construction Megaprojects. J. Constr. Eng. Manag. 2016, 142, 04016059. [Google Scholar] [CrossRef]
- Leung, M.; Yu, J.; Chan, Y. Focus Group Study to Explore Critical Factors of Public Engagement Process for Mega Development Projects. J. Constr. Eng. Manag. 2014, 140, 04013061. [Google Scholar] [CrossRef]
- Singh, V. BIM and Systemic ICT Innovation in AEC: Perceived Needs and Actor’s Degrees of Freedom. Constr. Innov. 2014, 14, 292–306. [Google Scholar] [CrossRef]
- Onwuegbuzie, A.J.; Leech, N.L. Validity and Qualitative Research: An Oxymoron? Qual. Quant. 2007, 41, 233–249. [Google Scholar] [CrossRef]
- Shenton, A.K. Strategies for Ensuring Trustworthiness in Qualitative Research Projects. Educ. Inf. 2004, 22, 63–75. [Google Scholar] [CrossRef]
- Lincoln, Y.S. Emerging Criteria for Quality in Qualitative and Interpretive Research. Qual. Inq. 1995, 1, 275–289. [Google Scholar] [CrossRef]
- Morse, J.M.; Barrett, M.; Mayan, M.; Olson, K.; Spiers, J. Verification Strategies for Establishing Reliability and Validity in Qualitative Research. Int. J. Qual. Methods 2008, 1, 13–22. [Google Scholar] [CrossRef]
- Whittemore, R.; Chase, S.K.; Mandle, C.L. Validity in Qualitative Research. Qual. Health Res. 2001, 11, 522–537. [Google Scholar] [CrossRef] [PubMed]
- Irvine, A.; Drew, P.; Sainsbury, R. ‘Am I Not Answering Your Questions Properly?’Clarification, Adequacy and Responsiveness in Semi-structured Telephone and Face-to-Face Interviews. Qual. Res. 2013, 13, 87–106. [Google Scholar] [CrossRef]
- Takhar-Lail, A.; Ghorbani, A. Innovative Research Methodology. In Market Research Methodologies: Multi-Method and Qualitative; Wolfe, K., Ed.; Business Science Reference: Hershey, PA, USA, 2015. [Google Scholar]
- Sepasgozar, S.M.E.; Bernold, L.E. A Technology pre-adoption model for construction. In Proceedings of the 37th Annual Conference of Australasian University Building Educators Association (AUBEA), Sydney, Australia, 4–6 July 2012. [Google Scholar]
- Abowitz, D.; Toole, T. Mixed Method Research: Fundamental Issues of Design, Validity, and Reliability in Construction Research. J. Constr. Eng. Manag. 2009, 136, 108–116. [Google Scholar] [CrossRef]
- Patton, M.Q. Qualitative Evaluation and Research Methods; Sage Publications: Thousand Oaks, CA, USA, 1990. [Google Scholar]
- Mason, J. Qualitative Researching; Sage Publications: London, UK, 2002. [Google Scholar]
- Teddlie, C.; Yu, F. Mixed Methods Sampling: A Typology With Examples. J. Mixed Methods Res. 2007, 1, 77–100. [Google Scholar] [CrossRef]
- Schultze, U.; Avital, M. Designing Interviews to Generate Rich Data for Information Systems Research. Inf. Organ. 2011, 21, 1–16. [Google Scholar] [CrossRef]
- Cheng, E.; Li, H. Construction Partnering Process and Associated Critical Success Factors: Quantitative Investigation. J. Manag. Eng. 2002, 18, 194–202. [Google Scholar] [CrossRef]
- Venkatesh, V.; Brown, S.A.; Maruping, L.M.; Bala, H. Predicting different conceptualizations of system USE: The competing roles of behavioral intention, facilitating conditions, and behavioral expectation. MIS Q. Manag. Inf. Syst. 2008, 32, 483–502. [Google Scholar] [CrossRef]
- Bryman, A. Social Research Methods; Oxford University Press: New York, NY, USA, 2012. [Google Scholar]
- Stewart, R.A.; Mohamed, S.; Marosszeky, M. An Empirical Investigation into the Link Between Information Technology Implementation Barriers and Coping Strategies in the Australian Construction Industry. In Construction Innovation; Sage Publications, Ltd.: Thousand Oaks, CA, USA, 2004; pp. 155–171. [Google Scholar]
- Alkalbani, S.; Rezgui, Y.; Vorakulpipat, C.; Wilson, I.E. ICT adoption and diffusion in the construction industry of a developing economy: The case of the sultanate of Oman. Archit. Eng. Des. Manag. 2013, 9, 62–75. [Google Scholar] [CrossRef]
- Agapiou, A. Perceptions of gender roles and attitudes toward work among male and female operatives in the Scottish construction industry. Constr. Manag. Econ. 2002, 20, 697–705. [Google Scholar] [CrossRef]
- Sarshar, M.; Isikdag, U. A survey of ICT use in the Turkish construction industry. Eng. Constr. Archit. Manag. 2004, 11, 238–247. [Google Scholar] [CrossRef]
- Bassioni, H.A.; Price, A.D.; Hassan, T.M. Building a conceptual framework for measuring business performance in construction: An empirical evaluation. Constr. Manag. Econ. 2005, 23, 495–507. [Google Scholar] [CrossRef]
- Redmond, A.; Hore, A.; Alshawi, M.; West, R. Exploring How Information Exchanges can be Enhanced through Cloud BIM. Autom. Constr. 2012, 24, 175–183. [Google Scholar] [CrossRef]
- Aziz, N.; Salleh, H. Case studies of the human critical success factors in information technology (IT) implementation in Malaysian construction industry. J. Build. Perform. 2013, 5. [Google Scholar]
- Samuelson, O.; Björk, B.-C. Adoption processes for EDM, EDI and BIM technologies in the construction industry. J. Civ. Eng. Manag. 2013, 19 (Suppl. 1), S172–S187. [Google Scholar] [CrossRef]
- Boyatzis, R.E. Transforming Qualitative Information: Thematic Analysis and Code Development; Sage Publications: Thousand Oaks, CA, USA, 1998. [Google Scholar]
- Roulston, K. Data analysis and ‘theorizing as ideology’. Qual. Res. 2001, 1, 279–302. [Google Scholar] [CrossRef]
- Dey, I. Qualitative Data Analysis: A User Friendly Guide for Social Scientists; Routledge: London, UK, 1993. [Google Scholar]
- Tuckett, A.G. Applying thematic analysis theory to practice: A researcher’s experience. Contemp. Nurse 2005, 19, 75–87. [Google Scholar] [CrossRef] [PubMed]
- Wicks, D. Coding: Axial Coding. Encyclopedia of Case Study Research; Sage Publications: Thousand Oaks, CA, USA, 2010; pp. 154–156. [Google Scholar]
- Charmaz, K. Constructing Grounded Theory: A Practical Guide through Qualitative Analysis; Pine Forge Press: London, UK, 2006. [Google Scholar]
- Auerbach, C.F.; Silverstein, L.B. Qualitative Data: An Introduction to Coding and Analysis; NYU Press: New York, NY, USA, 2003. [Google Scholar]
- Given, L.M. The Sage Encyclopedia of Qualitative Research Methods; Sage Publications: Thousand Oaks, CA, USA, 2008. [Google Scholar]
- Peansupap, V.; Walker, D. Factors Affecting ICT Diffusion: A Case Study of Three Large Australian Construction Contractors. Eng. Constr. Architect. Manag. 2005, 12, 21–37. [Google Scholar] [CrossRef]
- Huang, L.K. Top Management Support and IT Adoption in the Taiwanese Small and Medium Enterprises: A Strategic View. Int. J. Enterp. Netw. Manag. 2008, 2, 227–247. [Google Scholar] [CrossRef]
- Tanner, J.F., Jr.; Chonko, L.B. Trade show objectives, management, and staffing practices. Ind. Mark. Manag. 1995, 24, 257–264. [Google Scholar] [CrossRef]
- Smith, T.M.; Hama, K.; Smith, P.M. The Effect of Successful Trade Show Attendance on Future Show Interest: Exploring Japanese Attendee Perspectives of Domestic and Offshore International Events. J. Bus. Ind. Mark. 2003, 18, 403–418. [Google Scholar] [CrossRef]
- Hansen, K. Measuring Performance at Trade Shows: Scale Development and Validation. J. Bus. R. 2004, 57, 1–13. [Google Scholar] [CrossRef]
- Golfetto, F.; Salle, R.; Borghini, S.; Rinallo, D. Opening the Network: Bridging the IMP Tradition and Other Research Perspectives. Ind. Mark. Manag. 2007, 36, 844–848. [Google Scholar] [CrossRef]
- Reychav, I. Antecedents to Acquisition of Knowledge in Trade Shows. Knowl. Process Manag. 2011, 18, 230–240. [Google Scholar] [CrossRef]
- Bettis-Outland, H.; Johnston, W.J.; Wilson, R.D. Using Trade Show Information to Enhance Company Success: An Empirical Investigation. J. Bus. Ind. Mark. 2012, 27, 384–391. [Google Scholar] [CrossRef]
- Lee, C.H.; Kim, S.Y. Differential Effects of Determinants on Multi-dimensions of Trade Show Performance: By Three Stages of Pre-show, At-show, and Post-show Activities. Ind. Mark. Manag. 2008, 37, 784–796. [Google Scholar] [CrossRef]
- Ling-yee, L. Marketing Resources and Performance of Exhibitor Firms in Trade Shows: A Contingent Resource Perspective. Ind. Mark. Manag. 2007, 36, 360–370. [Google Scholar] [CrossRef]
- Berne, C.; García-Uceda, M.E. Criteria involved in evaluation of trade shows to visit. Ind. Mark. Manag. 2008, 37, 565–579. [Google Scholar] [CrossRef]
- Yuksel, U.; Voola, R. Travel Trade Shows: Exploratory Study of Exhibitors’ Perceptions. J. Bus. Ind. Mark. 2010, 25, 293–300. [Google Scholar] [CrossRef]
- Ling-yee, L. Relationship Learning at Trade Shows: Its Antecedents and Consequences. Ind. Mark. Manag. 2006, 35, 166–177. [Google Scholar] [CrossRef]
- Tafesse, W. Understanding How Resource Deployment Strategies Influence Trade Show Organizers’ Performance Effectiveness. Eur. J. Mark. 2014, 48, 1009–1025. [Google Scholar] [CrossRef]
- Rinallo, D.; Borghini, S.; Golfetto, F. Exploring Visitor Experiences at Trade Shows. J. Bus. Ind. Mark. 2010, 25, 249–258. [Google Scholar] [CrossRef]
- Rinallo, D.; Golfetto, F. Exploring the Knowledge Strategies of Temporary Cluster Organizers: A Longitudinal Study of the EU Fabric Industry Trade Shows (1986–2006). Econ. Geogr. 2011, 87, 453–476. [Google Scholar] [CrossRef]
- Gottlieb, U.; Brown, M.; Ferrier, L. Consumer Perceptions of Trade Show Effectiveness: Scale Development and Validation within a B2C Context. Eur. J. Mark. 2014, 48, 89–107. [Google Scholar] [CrossRef]
- Schultze, U. Reflexive Ethnography in Information Systems Research. Qualitative Research in IS: Issues and Trends; Idea Group: Hershey, PA, USA, 2000; pp. 78–103. [Google Scholar]
- Tan, Y.; Shen, L.; Langston, C. Competition Environment, Strategy, and Performance in the Hong Kong Construction Industry. J. Constr. Eng. Manag. 2011, 138, 352–360. [Google Scholar] [CrossRef]
- Hambrick, D.C. Taxonomic Approaches to Studying Strategy: Some Conceptual and Methodological Issues. J. Manag. 1984, 10, 27–41. [Google Scholar] [CrossRef]
- Kaufman, L.; Rousseeuw, P.J. Finding Groups in Data: An Introduction to Cluster Analysis; John Wiley & Sons: Hoboken, NJ, USA, 2009; Volume 344. [Google Scholar]
- Bezdek, J.C. Pattern Recognition with Fuzzy Objective Function Algorithms; Kluwer Academic Publishers: Dordrecht, The Netherlands, 1981. [Google Scholar]
- Gnanadesikan, R. Methods for Statistical Data Analysis of Multivariate Observations; Wiley-Interscience: Saint Nom, France, 1997; Volume 321. [Google Scholar]
- Park, H.S.; Dailey, R.; Lemus, D. The use of Exploratory Factor Analysis and Principal Components Analysis in Communication Research. Hum. Commun. Res. 2002, 28, 562–577. [Google Scholar] [CrossRef]
- Abdi, H.; Williams, L.J. Principal Component Analysis. Wiley Interdiscip. Rev. Comput. Stat. 2010, 2, 433–459. [Google Scholar] [CrossRef]
- Davies, R.; Harty, C. Measurement and Exploration of Individual Beliefs about the Consequences of Building Information Modelling Use. Constr. Manag. Econ. 2013, 31, 1110–1127. [Google Scholar] [CrossRef]
- Rabionet, S.E. How I Learned to Design and Conduct Semi-Structured Interviews: An Ongoing and Continuous Journey. Qual. Rep. 2011, 16, 563–566. [Google Scholar]
- Nikas, A.; Poulymenakou, A.; Kriaris, P. Investigating Antecedents and Drivers Affecting the Adoption of Collaboration Technologies in the Construction Industry. Autom. Constr. 2007, 16, 632–641. [Google Scholar] [CrossRef]
- Rahman, M. Barriers of Implementing Modern Methods of Construction. J. Manag. Eng. 2014, 30, 69–77. [Google Scholar] [CrossRef]
- Cao, D.; Li, H.; Wang, G. Impacts of Isomorphic Pressures on BIM Adoption in Construction Projects. J. Constr. Eng. Manag. 2014, 140. [Google Scholar] [CrossRef]
- Fulford, R.; Standing, C. Construction Industry Productivity and the Potential for Collaborative Practice. Int. J. Proj. Manag. 2014, 32, 315–326. [Google Scholar] [CrossRef]
- Samuelson, O.; Björk, B. Adoption Processes for EDM, EDI and BIM Technologies in the Construction Industry. J. Civ. Eng. Manag. 2013, 19 (Suppl. 1), S172–S187. [Google Scholar] [CrossRef]
- Olawale, Y.; Sun, M. PCIM: Project Control and Inhibiting-Factors Management Model. J. Manag. Eng. 2013, 29, 60–70. [Google Scholar] [CrossRef]
- Attride-Stirling, J. Thematic Networks: An Analytic Tool for Qualitative Research. Qual. Res. 2001, 1, 385–405. [Google Scholar] [CrossRef]
- Saaty, T.L. What is the Analytic Hierarchy Process? Springer: Berlin/Heidelberg, Germany, 1988. [Google Scholar]
- Lai, V.S.; Wong, B.K.; Cheung, W. Group Decision Making in a Multiple Criteria Environment: A Case Using the AHP in Software Selection. Eur. J. Operational Res. 2002, 137, 134–144. [Google Scholar] [CrossRef]
- Hasnain, M.; Ullah, F.; Thaheem, M.J.; Sepasgozar, S.M.E. Prioritizing Best Value Contributing Factors for Contractor Selection: An AHP Approach. In Proceedings of the 21st International Symposium on Advancement of Construction Management and Real Estate; Chau, K.W., Chan, I.Y.S., Lu, W., Webster, C., Eds.; Springer: Singapore, 2018; pp. 1121–1131. [Google Scholar]
- Denzin, N.K. Interpretive Biography; Sage Publications: Thousand Oaks, CA, USA, 1989. [Google Scholar]
- Myers, M.D. Qualitative Research in Business and Management; Sage Publications: Thousand Oaks, CA, USA, 2013. [Google Scholar]
- Flick, U. An Introduction to Qualitative Research; Sage Publications: Thousand Oaks, CA, USA, 2014. [Google Scholar]
- Lucko, G.; Rojas, E.M. Research validation: Challenges and opportunities in the construction domain. J. Constr. Eng. Manag. 2009, 136, 127–135. [Google Scholar] [CrossRef]
- Ameyaw, E.E.; Chan, A.P. Risk allocation in public-private partnership water supply projects in Ghana. Constr. Manag. Econ. 2015, 33, 187–208. [Google Scholar] [CrossRef]
- Yang, Y.N.; Kumaraswamy, M.M.; Pam, H.J.; Mahesh, G. Integrated qualitative and quantitative methodology to assess validity and credibility of models for bridge maintenance management system development. J. Manag. Eng. 2010, 27, 149–158. [Google Scholar] [CrossRef]
- Sepasgozar, S.M.; Davis, S.R. Decision Analysis and Negotiations for Technology Adoption Decision: An Exploratory Study. In Proceedings of the 29th Australian and New Zealand Academy of Management (ANZAM), Queenstown, New Zealand, 2–4 December 2015. [Google Scholar]
- Rogers, E.M. Diffusion of Innovations; Free Press: New York, NY, USA, 2010. [Google Scholar]


| Node | New Role | Confirmed Role |
|---|---|---|
| Top manager | √ | |
| Middle manager (project or construction manager) | √ | |
| Production manager (e.g., fleet manager) and operators | √ | |
| Financial manager | √ | |
| Engineer (mechanical, electrical) | √ | |
| Project manager advisor | √ |
| Node | New Individual | Confirmed Individual |
|---|---|---|
| Top manager | √ | |
| Middle manager (project or construction manager) | √ | |
| Production manager (and/or fleet manager) | √ | |
| Fitter | √ | |
| Engineer (electrical and/or mechanic) | √ | |
| Crew (and/or operator) | √ |
| Description | Limitations and/or Future Direction |
|---|---|
| To investigate the vendors’ activities to expose their technology | To profile them based on their dissemination strategies in different contexts |
| To explore influential factors and barriers affecting the process | To examine the identified factors in different contexts |
| To identify individuals involved in the process | To investigate the interaction and relationships between the activities of customers and vendors |
| To formulate the understanding of these activities into a comprehensive framework | To investigate the process used by customers of new technologies as they move from recognizing a need to actually using a new technology |
© 2018 by the authors. Licensee MDPI, Basel, Switzerland. This article is an open access article distributed under the terms and conditions of the Creative Commons Attribution (CC BY) license (http://creativecommons.org/licenses/by/4.0/).
Share and Cite
Sepasgozar, S.M.E.; Davis, S. Construction Technology Adoption Cube: An Investigation on Process, Factors, Barriers, Drivers and Decision Makers Using NVivo and AHP Analysis. Buildings 2018, 8, 74. https://doi.org/10.3390/buildings8060074
Sepasgozar SME, Davis S. Construction Technology Adoption Cube: An Investigation on Process, Factors, Barriers, Drivers and Decision Makers Using NVivo and AHP Analysis. Buildings. 2018; 8(6):74. https://doi.org/10.3390/buildings8060074
Chicago/Turabian StyleSepasgozar, Samad M. E., and Steven Davis. 2018. "Construction Technology Adoption Cube: An Investigation on Process, Factors, Barriers, Drivers and Decision Makers Using NVivo and AHP Analysis" Buildings 8, no. 6: 74. https://doi.org/10.3390/buildings8060074