Article

Evaluation of Repair Costs for Masonry Infills in RC Buildings from Observed Damage Data: the Case-Study of the 2009 L’Aquila Earthquake

by
Maria Teresa De Risi
*,
Carlo Del Gaudio
and
Gerardo Mario Verderame
Department of Structures for Engineering and Architecture, University of Naples Federico II, 80125 Naples, Italy
*
Author to whom correspondence should be addressed.
Buildings 2019, 9(5), 122; https://doi.org/10.3390/buildings9050122
Submission received: 31 March 2019 / Revised: 29 April 2019 / Accepted: 6 May 2019 / Published: 14 May 2019
(This article belongs to the Special Issue Masonry Buildings: Research and Practice)

Abstract

:
The estimation of direct and indirect losses due to earthquakes is a key issue in the Performance Based Earthquake Engineering framework. In commonly adopted loss computation tools, no specific data related to masonry infill panels, widespread in moment-resisting-frame residential buildings, are available to perform a probabilistic assessment of losses. To fill this gap, specific fragility and loss functions have been recently proposed in the last years. To assess their validity and estimate the relevance of the repair costs due to infills after earthquakes with respect to the total reconstruction process, the present work analyses the Reinforced Concrete residential buildings with masonry infills struck by the 2009 L’Aquila (Italy) earthquake, focusing on the dataset of “lightly” damaged buildings, where only damage to masonry infills occurred. Based on available data related to these buildings, the observed damage scenario after L’Aquila earthquake is first obtained. The repair costs for infills are estimated given this damage scenario. The resulting estimated repair costs are then compared with the actual repair costs presented in the available literature. The percentage influence of infills on the total repair costs due to earthquakes for residential buildings is lastly computed, resulting on average equal to the fifty percent.

1. Introduction

Earthquakes certainly represent a paramount kind of natural hazard due to the current impossibility to predict their occurrence and significant impact on civil structures worldwide in terms of social consequences, direct and indirect losses, and risk of casualties. FEMA P-58 [1] explicitly proposes a seismic performance assessment methodology for buildings according to the Performance-Based Earthquake Engineering (PBEE) concept [2], namely combining seismic hazard, structural response, damage analysis and associated consequences, the latter defined in terms of repair costs, repair time, and casualties. FEMA P-58 is also accompanied by a Performance Assessment Calculation Tool (PACT) [3], a user-friendly electronic calculation tool, including a repository of component-by-component (structural and non-structural) fragility and consequence data, which allows performing the probabilistic assessment of losses, as described in the FEMA P-58 methodology.
Several works over the last few years have carried out an estimation of the post-earthquake damage [4] and total repair costs (e.g., [5,6], among others). In particular, after the 2009 L’Aquila (Italy) earthquake, a systematic analysis of the actual costs for reconstruction was carried out, both for repairing and retrofitting activities [7,8,9,10,11]. Some of these studies also highlighted that no specific data related to masonry infill panels in typical moment-resisting-frame residential buildings are accounted for in the PACT tool [11,12]. This gap is particularly important for typical Mediterranean building stock, especially for Reinforced Concrete (RC) Moment Resisting Frames (MRF), generally characterized by masonry exterior infills and partitions. The analysis of post-earthquake damage data in [7,13,14,15,16] highlights the key role played by damage to the masonry infills and partitions. Therefore, seismic performance assessment of infilled RC frames needs to take into account also the contribution of these components in estimating properly the expected seismic performance of RC MRF both in terms of seismic response [17] and loss estimation [18]. To fill the above-mentioned gap, specific fragility and loss functions have been recently carried out in [12] and [18]. These proposals need to be compared with actual repair costs, specifically related to the masonry infills, obtained from real post-earthquake damage surveys, to assess their validity and estimate the relevance of the repair costs due to infills with respect to the total reconstruction process. This is the core of this work.
To this aim, the present work analyses the RC residential buildings with masonry infills struck by the 6 April 2009 L’Aquila earthquake, focusing on the dataset of “lightly” damaged buildings. “Lightly” damaged buildings are defined herein as those buildings where only damage to masonry infills occurred. The evaluation of repair costs can thus be made by neglecting the contribution due to repair activity to other structural components (e.g., vertical structures, horizontal structures, stairs, and roofs). All these buildings, in the Abruzzi region, after the 2009 earthquake, have been charged with a post-earthquake usability in-situ assessment procedure [4], providing for each building a very useful description of the damage severity and extent and its resulting usability rating. The observed damage scenario for the investigated building stock is obtained and analysed in detail.
The repair costs for infills are then estimated, starting from the cost analysis related to a single infill panel reported in Del Gaudio et al. [18], and by means of its extension to the whole analysed dataset of buildings. The resulting estimated repair costs are lastly compared with the actual repair costs properly analysed in Dolce and Manfredi [19], depending on the building’s usability rating, to compute the percentage influence of infills on the total amount of all the repairing activities.

2. IN-SITU Post-Earthquake Damage and Safety Assessment

In-situ surveys are significantly important for a rapid response to earthquake emergency. Their primary goal is to judge the usability of inspected buildings, defining if they can still be used with a reasonable level of safety. Secondly, these data, properly elaborated, can also be used to provide statistics about damage to buildings after a seismic event, as recently published by the Italian Department of Civil Protection through the Da.D.O. platform (“Database di Danno Osservato” [20]).
A well-consolidated post-earthquake usability assessment procedure was proposed in the past by Baggio et al. [4], and it was widely used in Italy in the aftermath of recent events, from the 1997 Umbria-Marche earthquake to present day, thus representing the base of the above-mentioned Da.D.O. platform. These post-earthquake survey data are synthetically reported in the so-called AeDES (Agibilità e Danno nell’Emergenza Sismica, Usability and Damage in Post-Earthquake Emergency) form [4].
In general, the parameters collected by the AeDES form can be grouped into five macro-sections:
  • Building identification: data related to the municipality and position of the building;
  • Building description: number of stories, average storey height, average surface, construction and renovation age, use and utilisation (Figure 1);
  • Building typology: information on vertical and horizontal (masonry or RC) structures, on the presence of tie rods or tie beams, of isolated columns, of mixed type structures among others, on plan and elevation regularity;
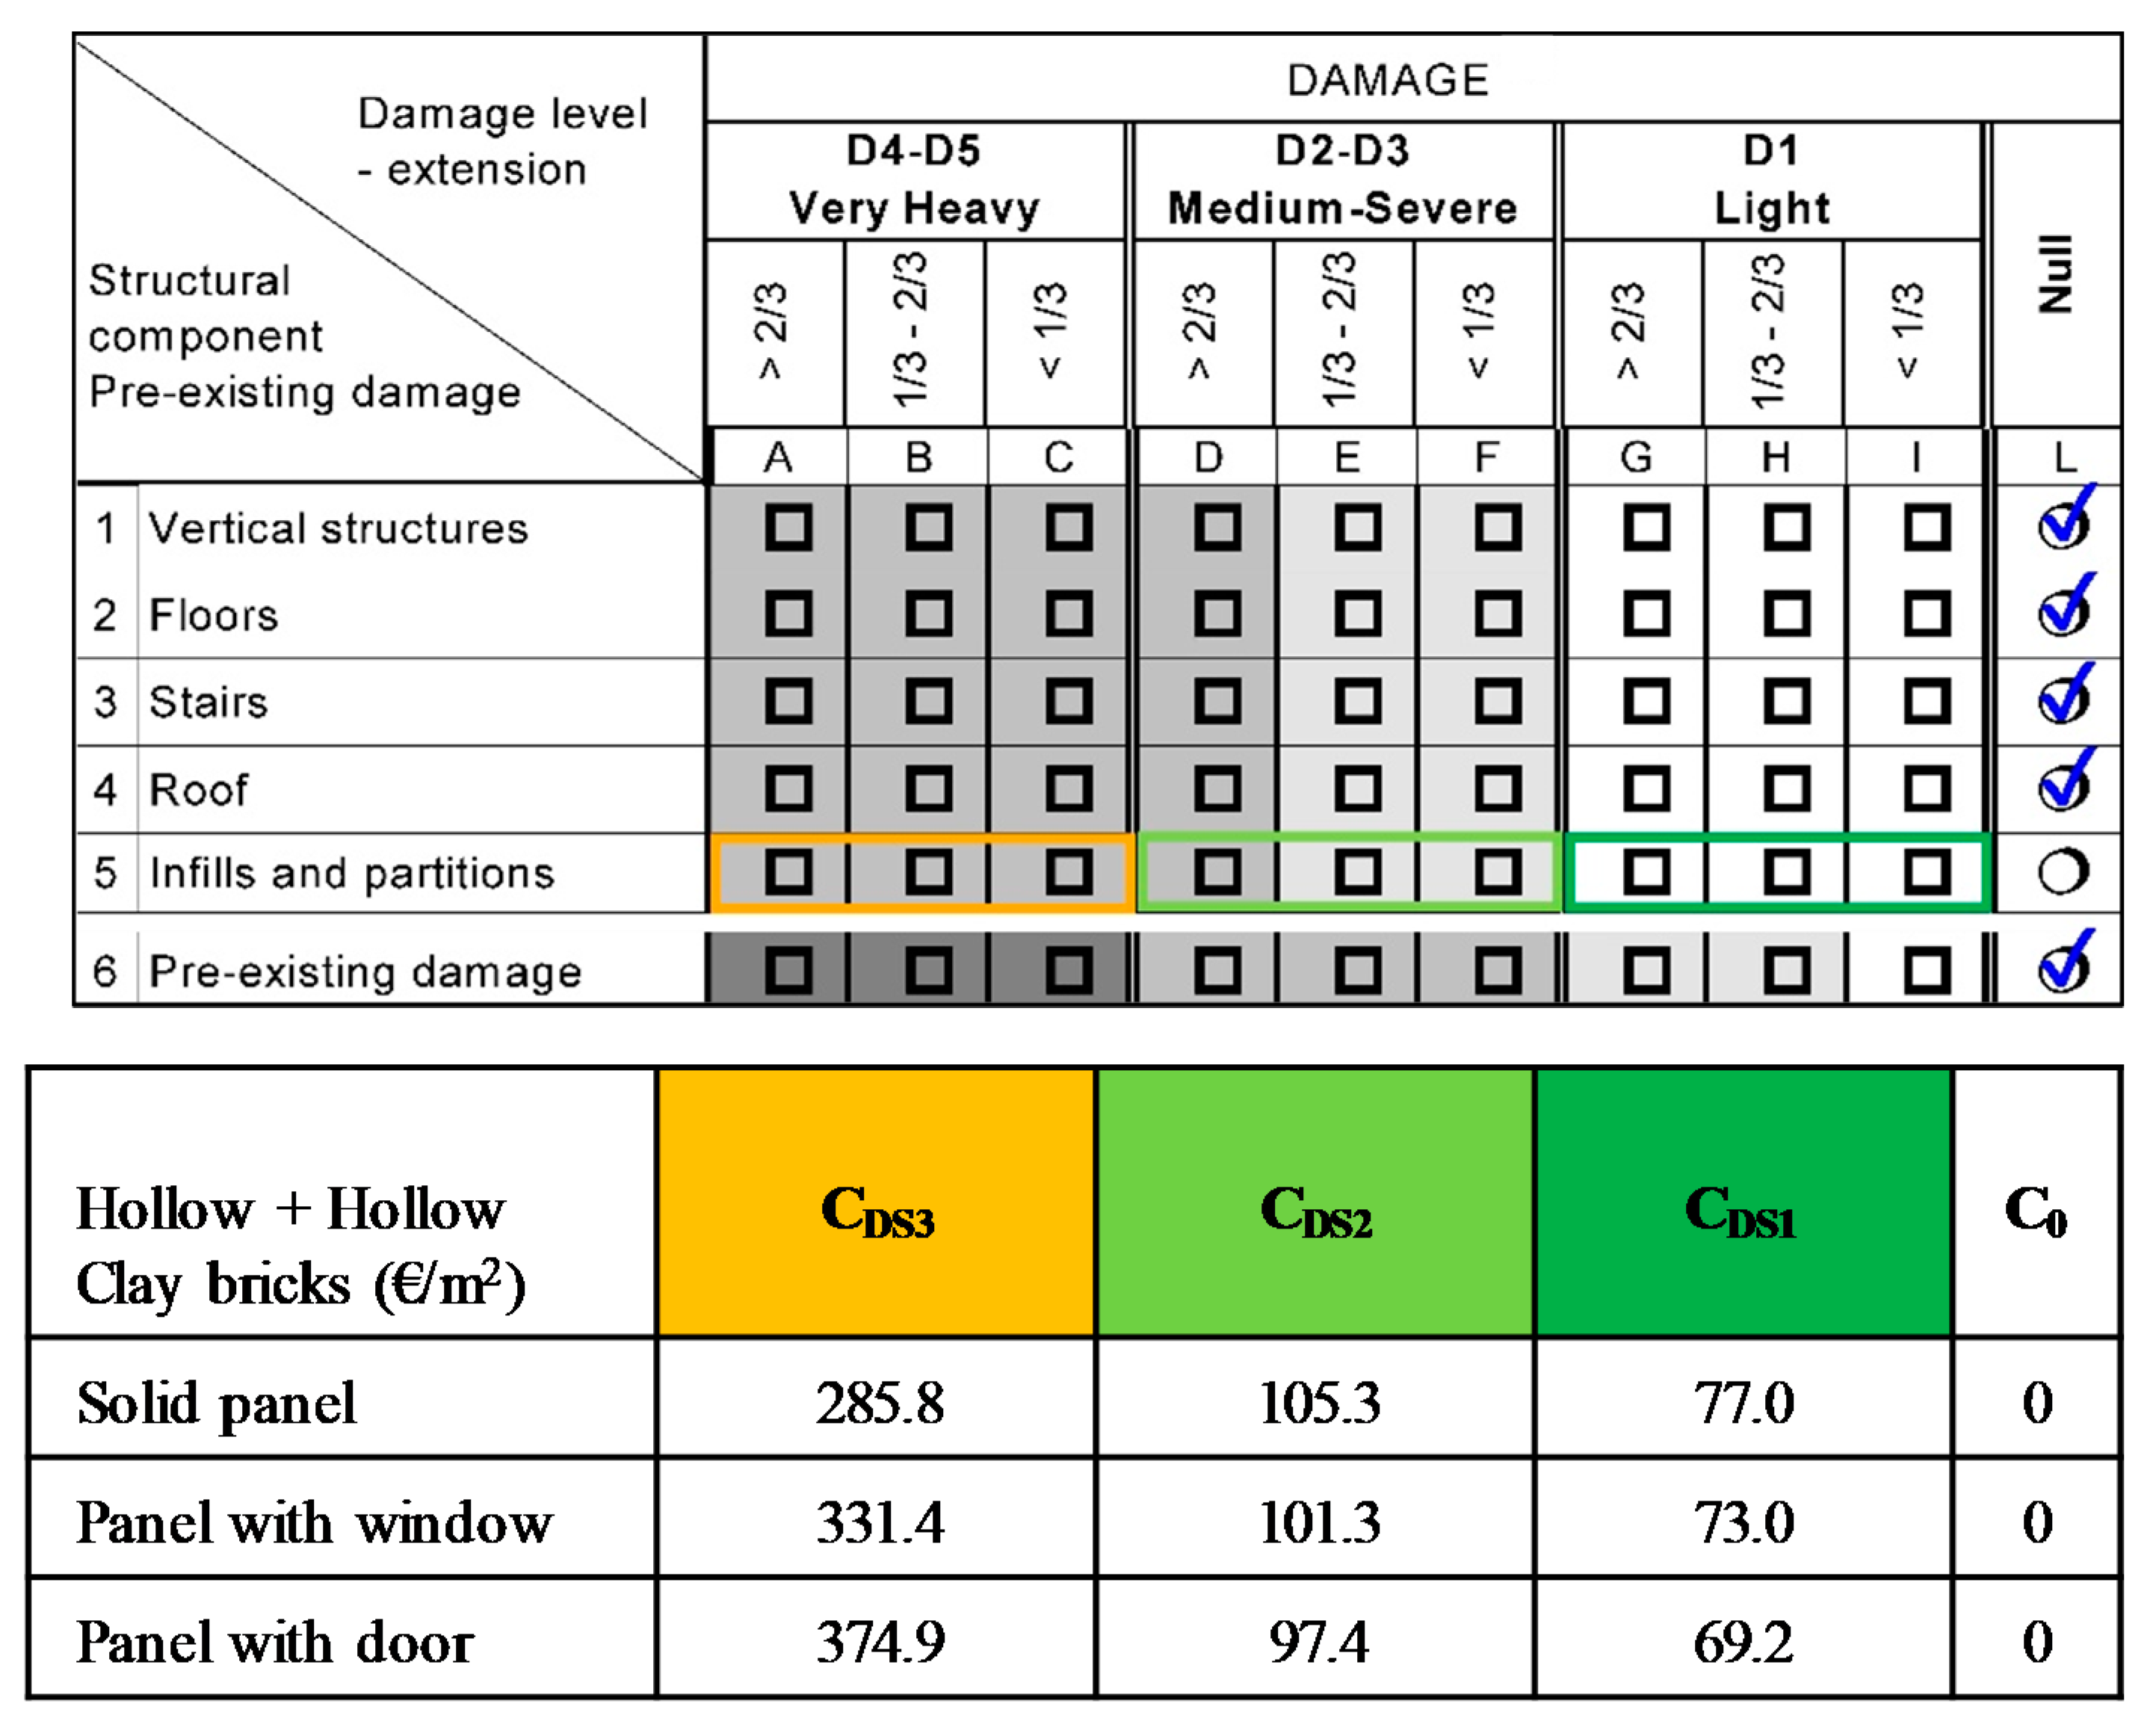
  • Damage: (3 + 1) damage levels are considered (“Null”; “D1: Slight”; “D2–D3: Medium-Severe”; “D4–D5: Very heavy”) based on European Macroseismic Scale [21] classification, with explicit indication about the damaged portion of the whole building (<1/3, 1/3–2/3, >2/3) for different structural components (vertical structures, floors, stairs, roofs, infills/partitions);
  • Usability: six usability judgements are reported as a function of the risk conditions detected on the structure for structural and non-structural components (or external risk), and eventual short-term countermeasures are suggested.
Note that only residential buildings are analysed in the following (Figure 1).
The analysed damage can be related to vertical structures, floors, stairs, roofs, infills, or can be pre-existing damage. The “structural” damage can be also related to infills and partitions, thus recognising their primary role in structural responses. Possible damage grade and extent in infills is described in Section 2.1, as suggested in the AeDES user manual [4]. How this damage description can provide a usability judgment is the objective of Section 2.2.

2.1. Damage to Infills According to the Aedes Form

As for the other structural components, the damage grade to infills can be defined as “Null”, “D1: Slight”, “D2–D3: Medium-Severe”, or “D4–D5: Very heavy”. Damage extension can be reported in the following ranges: “<1/3”, “1/3–2/3”, “>2/3” of the whole building.
Damage grade D1 (“Slight”) is a damage level that does not significantly change the behaviour of the building and does not affect the safety of the building’ occupants. Particularly for infills, slight detachments (<1 mm) of the infill panels from the surrounding beams/columns can occur, with eventual cracks (<1 mm width) due to the participation of the infill to the total lateral strength of the building. This damage level for infills can contribute to the definition of a “low” total damage level in the building, unless there is a certain degree of risk of out-of-plane collapse due to the eventual absence of connection between the panel and other structural components.
A more severe damage level (“D2–D3: Medium-Severe”) can significantly change the building’s lateral strength, which will be lower in the case of a subsequent similar seismic shaking, even if without any collapse risk. The infill panel can present cracks (between 1 and 5 mm) due to detachment from the surrounding elements, diagonal cracks up to “some” millimetres, and quite evident corner crushing with some localized bricks expulsions. If a big number of infill panels (high extent) are affected by this damage level, the total structural risk can be “high”; otherwise, a lower damage level can be evaluated case-by-case for less significant damage.
Damage grade D4–D5, defined as “Very heavy” damage, significantly modifies the structural response leading to a possible partial or total collapse of the building. Cracks’ width and extension on the infills are significantly more severe than for the previous damage level. Some examples of Medium-Severe and Very Heavy damage to infills are shown in Figure 2.

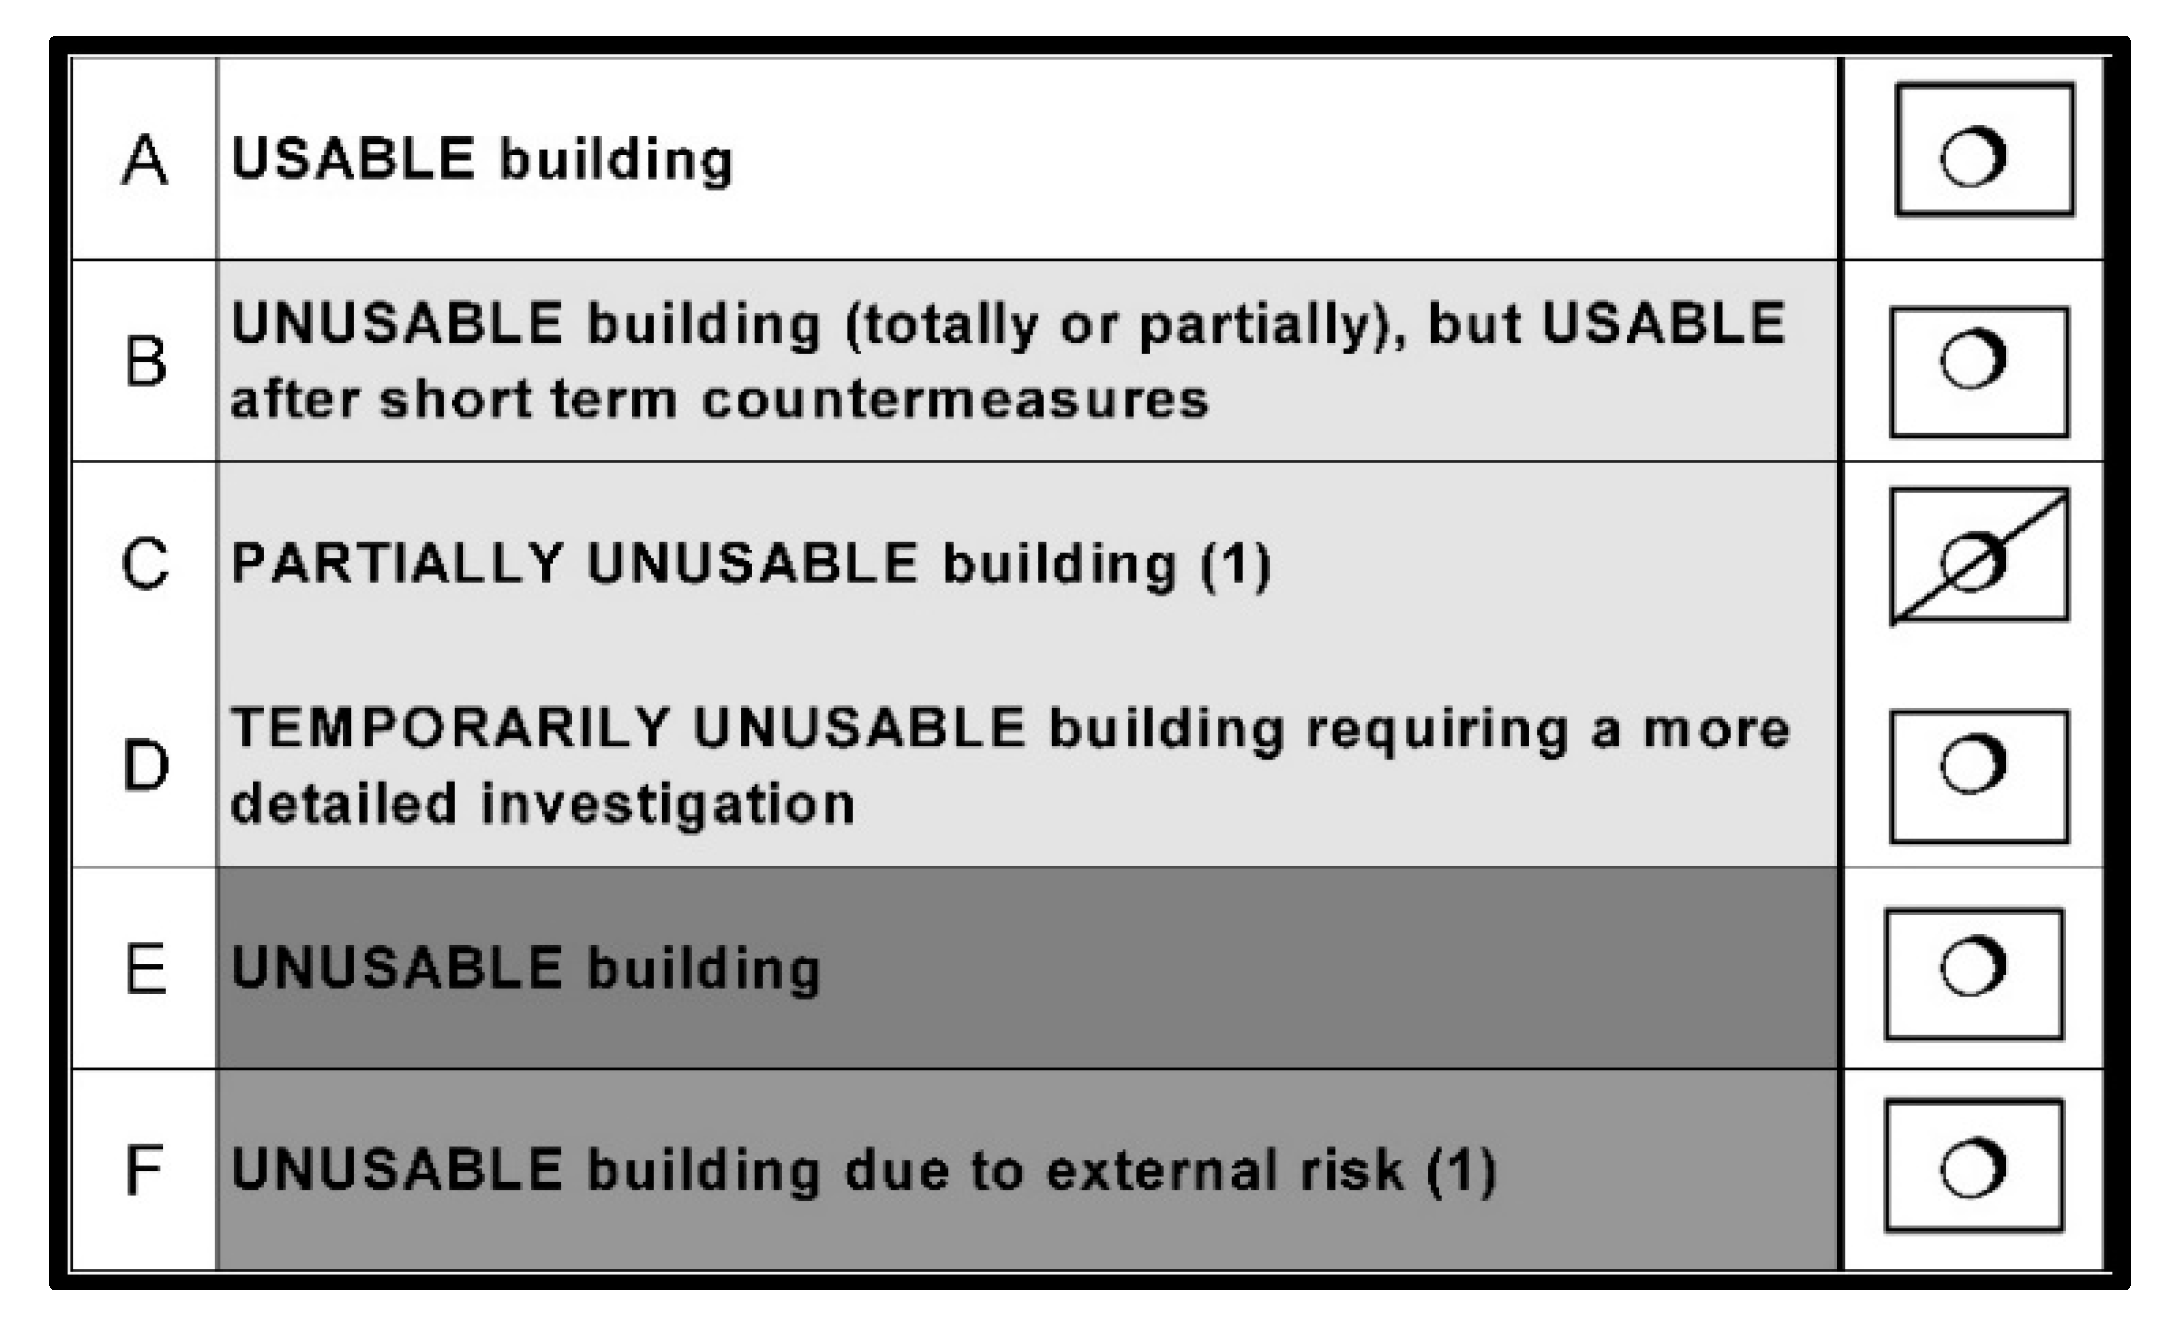
2.2. Post-Earthquake Usability Rating According to the Aedes Form

The damage extent and severity for structural and non-structural elements are lastly converted in a usability judgment for the analysed building [4]. Six usability judgments can be selected for each building, from “A” to “F” (Figure 3). In particular:
  • “A” (“Usable building”) does not mean that the building has not suffered any damage, but that the repair of damage is not a necessary condition for the usability of the building;
  • “B” (“Temporary Unusable”) requires short-term countermeasures to reduce the risk to the occupants to an “acceptable” level; the building is unusable until these countermeasures are realized;
  • The judgment “C” (“Partially Unusable”) is like “B” but related to only a part of the building;
  • “D” is a case in which a further or more expert investigation is required;
  • “E” (“Unusable building”) means that the building cannot be used at all and short-term countermeasures are not enough. Damages could be repaired, but the repairing activities must be considered as part of the “reconstruction process”;
  • “F” is related to external risk sources.
Only usability judgment “A”, “B” and “E” will be considered in the following analyses reported herein, since the other usability judgements are related to exterior risk (“F”), or to not definitive analyses (“D”), or to a not-known unusable portion of the building (“C”).
Note that the information about the usability judgment is particularly important since generally it is strictly related to the reconstruction refund level for each building [9,10,19]. In this work, the repair costs due to infills, estimated as explained in the following sections, will be compared with the total actual reconstruction cost (reported in [19]), depending on the usability judgment, to highlight the percentage incidence of the infills on the whole repair cost.

3. Post-L’Aquila 2009 Earthquake Observed Damage to RC Buildings

In this work, the attention is focused on the well- and sadly- known L’Aquila 2009 seismic event, whose main characteristics are briefly described in Section 3.1. After this event, an extensive post-earthquake survey campaign was performed, based on the AeDES form to evaluate the produced damage to residential buildings and to judge the usability of those buildings, as mentioned in Section 2. Thanks to this data collection, a subset of buildings are investigated herein, as explained and described in Section 3.2, to obtain an “observed” damage scenario (Section 3.3) allowing, in the end, to identify post-earthquake repair costs due to infills, one of the main aims of this work.

3.1. Seismic Input Description

On 6th April, 2009, an earthquake of magnitude Mw = 6.3 struck the Abruzzo region, heavily affecting the area in the proximity of L’Aquila city, and killing 308 people. The area near the epicentre, in the neighbourhood of L’Aquila Municipality, was seriously damaged, resulting in IX–X grade of MCS (Mercalli–Cancani–Sieberg) macro-seismic scale.
The related ShakeMap in terms of Peak Ground Acceleration (PGA) and spectral ordinates (PSA) (for periods of vibration, T, equal to 0.3, 1 and 3 sec) can be derived by means of the Italian National Institute of Geophysics and Volcanology (INGV) procedure [22]. The ShakeMap in terms of PGA is shown in Figure 4. The map is derived by means of the software package ShakeMap® by using different Ground Motion Prediction Equations and signals registered by Italian Strong Motion Network (Rete Accelerometrica Nazionale, RAN) and the Italian National Seismic Network (RSN).

3.2. Investigated Database: “Lightly Damaged” Infilled RC Buildings

The dataset of buildings investigated in this work is made up of the MRF residential RC buildings located in the Abruzzi region, which after the 2009 earthquake have been involved in the post-earthquake usability assessment procedure by means of the AeDES form [4]. The focus herein has been first restrained from an original sample of 12223 to a subset of 7597 residential MRF RC buildings (for further detail, see [13]) from those collected in the Da.D.O. platform [20]. Among these data, only the buildings characterized exclusively by damage to infill panels are considered herein, since the aim of this work is the evaluation of repair costs due to infills in RC buildings, neglecting the contribution of repairing activity to other structural components (namely vertical structures, horizontal structures, stairs, roofs). An extract of the AeDES form is reported in Figure 5, to highlight the selection process among all the forms available in the Da.D.O platform. Therefore, only buildings for which the AeDES form reported damage to exterior infills and interior partitions and “Null” damage to all the other structural components are considered for the following analyses (as shown by the blue box in Figure 5). These buildings are defined herein as “lightly damaged buildings”. The resulting database analysed herein is thus composed of 5095 RC buildings. The related frequency distribution of number of stories, year of construction, plan area (A), and suffered PGA during the main seismic shock are reported in Figure 6 and Figure 7.
Figure 6 shows that three-storey buildings are the most common; additionally, a relevant percentage of buildings have two or four stories. The major part of these buildings has a plan area varying between 50–300 square meters, was built after 1972, and was struck by a PGA level in the range of 0.30–0.50 g. In Figure 7, it can be noted that the tallest buildings have the highest plan surface. No other evident trends between year of construction and number of stories or plan area can be found (Figure 7).

3.3. Observed Damage Scenario

Based on data described in the previous section, the observed damage scenario is obtained and shown in this section. To obtain such a damage scenario, some assumptions are necessary, particularly in relation to the damage metric definition for infill panels.
Over the past years, authors have proposed definitions of different Damage States (DSs) through observation on the extent and severity of cracking patterns on the panels or the failure of brick units. Some other research works also relate such damage levels to the achievement of the peak strength of the infilled frame or the achievement of given lateral strength reduction thresholds. Typically, three or four DSs have been defined in the literature, corresponding, for increasing damage level, to (i) the onset of cracking and first detachment between infill panel and the surrounding RC frame, (ii) the widening of previous damage pattern, (iii) the crushing and spalling of a significant portion of bricks and (iv) the partial/total collapse of the panel.
European Macroseismic Scale (EMS-98) [21], first, proposes three DSs specifically for infill panels in RC frames, as a function of a qualitative description of damage (Table 1): fine cracks (DS1), large cracks (DS2), collapse (DS3). DS4 and DS5 are also defined in the EMS-98 scale, but they are basically related to damage suffered by RC members (in the specific case, RC buildings). Therefore, due to the scope of the present work, these latter two DSs will be neglected in the following analyses.
Similar to EMS-98, AeDES survey forms [4] define three DSs, as explained in Section 2, reporting a more accurate and detailed damage description with a quantitative indication of crack width for each one. A certain degree of correlation can be found between these two damage scales, as reported in Table 1.
Starting from the damage metric reported in Table 1, the collected buildings with damage to infills can be classified in DS1, DS2, or, DS3, depending on the information reported on the related AeDES form. The resulting “observed” damage scenario is shown in Figure 8a, reporting the number of buildings in each DS, where the DS of the whole building is assumed as the maximum observed damage level identified in the AeDES form for that building. In summary, 2406 buildings present no damage to infills and partitions (and no damage to vertical structures, roofs, stairs, etc.). A total of 1943 buildings fall within the damage level DS1, 555 are in DS2, and a smaller portion (191 buildings) presents a damage level DS3.
For each building, the maximum damage level shown in Figure 8a can be attained with different damage extents, as shown in Figure 5 and Table 1. Figure 8b additionally shows the distribution of the damage extent (“<1/3”, “1/3–2/3”, “>2/3”) that defined the maximum achieved DS. Note that, for each given maximum DS, the prevalent damage extent is “<1/3”, namely the maximum achieved damage is generally quite concentrated in a small portion of the building. Together with this maximum damage level, with its extent in a certain portion of the building, a less severe damage—distributed in other portions/stories of the buildings—can (co)exist. The information about this “co-existing” damage is shown in Figure 9, depending on the maximum achieved damage level. For all buildings with maximum damage level DS1 (1943 buildings), different damage extent can be present; their complement to the unity is assumed to be in DS0. About buildings with maximum damage level DS2 (555 buildings), a certain extent of less severe damage (DS1) or not damaged portions of the whole building (DS0) can be present, as shown in Figure 9. Similarly, for a building with a maximum damage level equal to DS3, some portions of the building with a damage level DS0, DS1 or DS2 can be present. Such information should be considered for a realistic repairing cost estimation, as explained in Section 4.
Further analysis of the observed damage scenario reported in Figure 8a can be carried out by means of the decomposition of the whole scenario depending on plan area, number of storeys, year of construction of the analysed building stock, or depending on the suffered PGA during the seismic event, as shown in Figure 10. It can be noted that:
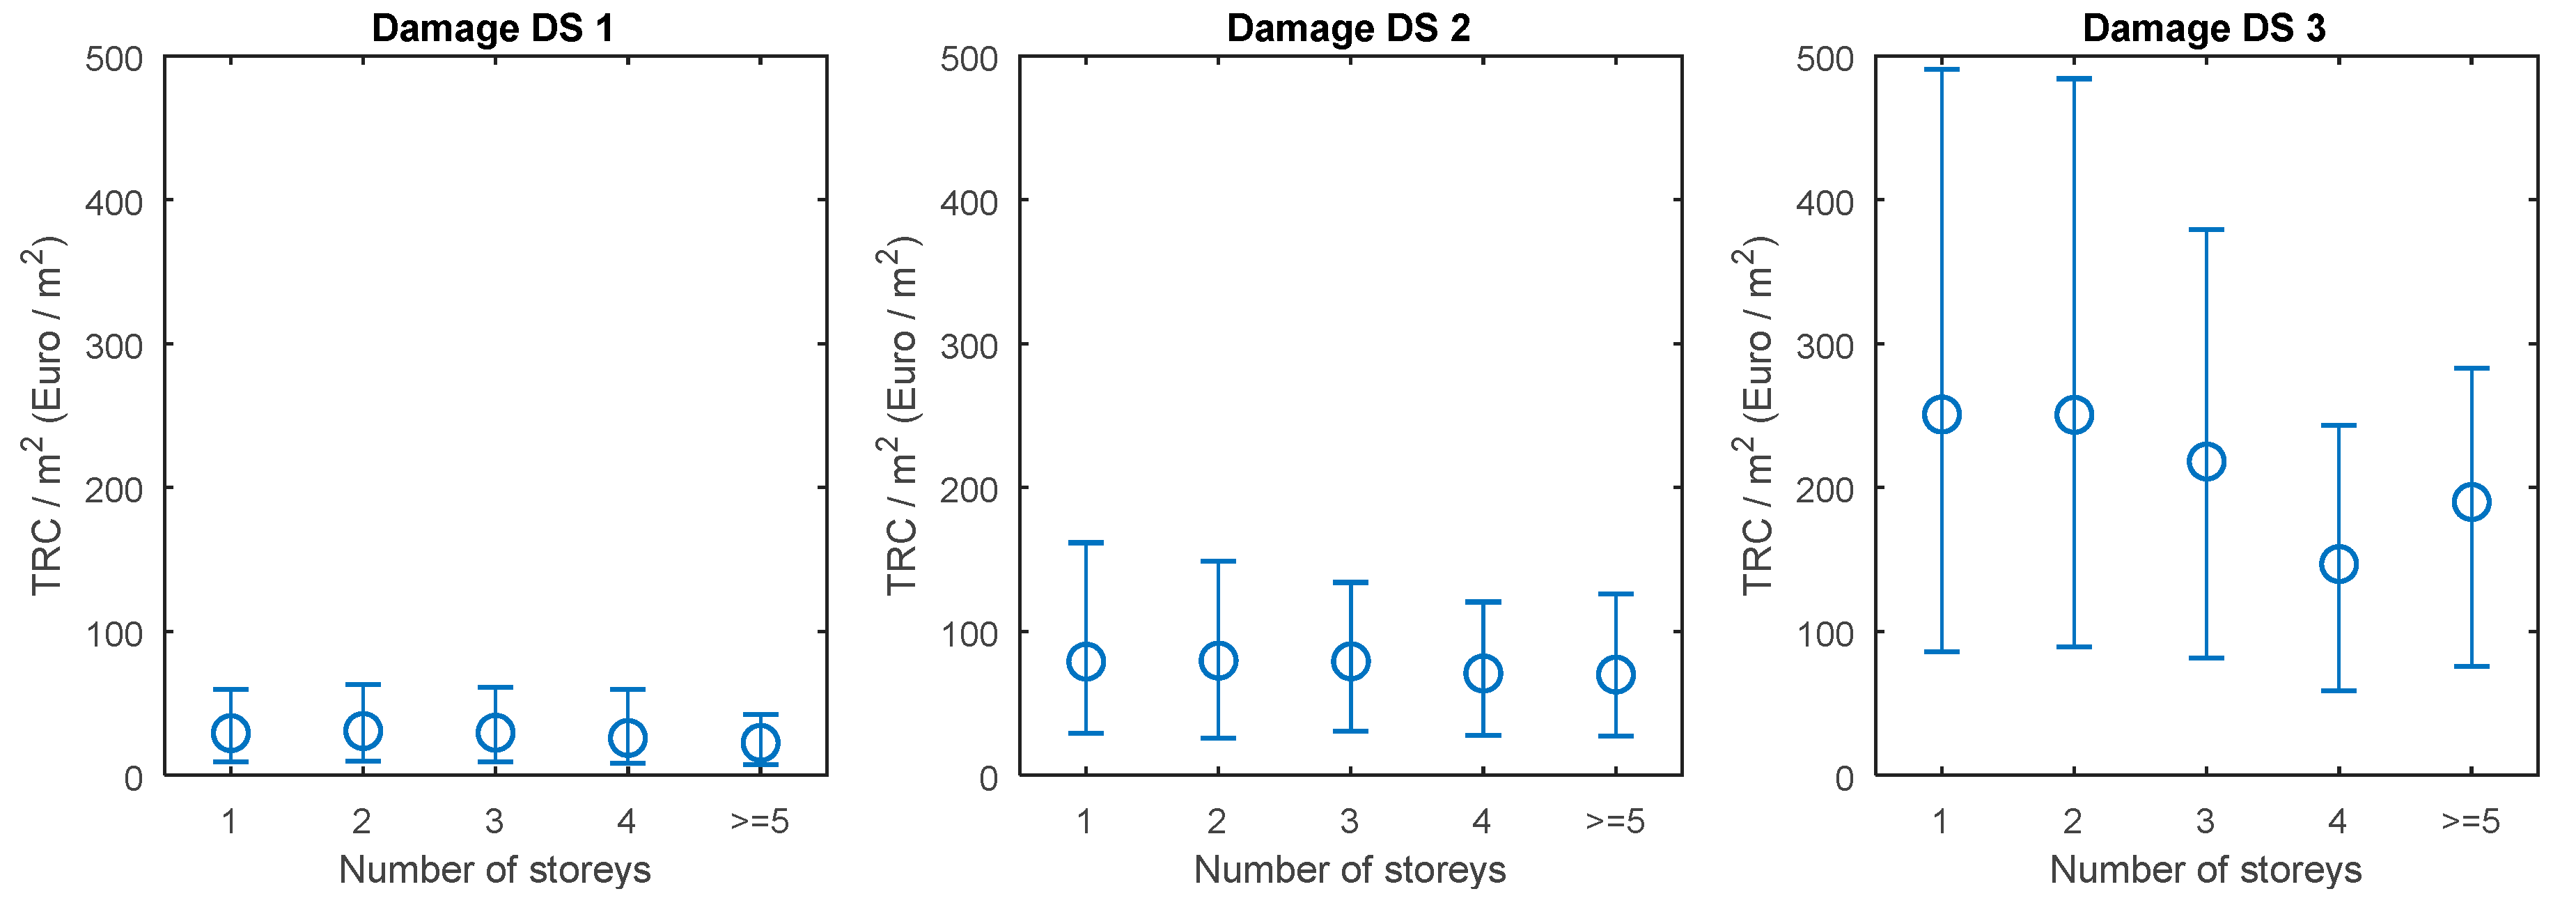
  • For high-rise buildings, a more severe damage level (i.e., higher percentage of DS2 and DS3) is observed, likely due to the generally higher seismic vulnerability of higher buildings, (all the other main characteristics being the same);
  • Construction age is not a significant parameter in the definition of damage trend;
  • A higher plan area is associated with more severe damage levels;
  • Damage severity increases for higher values of PGA, as expected.

4. Repair Costs Estimation for Masonry Infills

The repair cost estimation performed herein belongs to “component-level” loss prediction methodologies [1,3,5]. Only repair costs due to infills are analysed and presented, to show their percentage incidence on the total repair costs and to provide a lower bound for the actual repair costs for infilled RC buildings.
The repair costs estimation provided in this section is directly derived from: (i) the cost analysis related to a single infill panel and (ii) the “observed” damage scenario reported and commented in the previous section, as explained in Section 4.1 and Section 4.2.

4.1. Repair Cost Evaluation for A Single Masonry Infill Panel

First, a list of considered macro-activities is needed. To this aim, the main operations in repairing a single infill panel damaged during a seismic event has to be defined, as reported in Table 2.
Each group of activities—from a) to g)—is made of a list of elementary actions, established on engineering judgement to restore the infill panel to its undamaged state, according to Del Gaudio et al. [18], where the corresponding unit cost (cj) has been evaluated from the Price List of Public Works in Abruzzi Region [23].
Summing up the product of the unit cost (cj) and the area of intervention (Aj,DSi) for all the activity groups, the total cost of restoration C DSi TOT of an infill panel damaged during a seismic event for a given damage state (DSi, with i = 1,…,3) can be evaluated as reported in Equation (1):
C DSi TOT = j { a , b , c , d , e , f , g } c j A j , DSi
Note that Del Gaudio et al. [18] reported the repair costs related to four conditions: the first one was related to a light cracking damage; the second one to an extensive cracking damage; the third one was assumed as the “economically convenience” limit to repair without demolish/reconstruct; the fourth one corresponds to the total infill collapse/failure condition [18]. Therefore, the cost related to the light cracking damage has been used for DS1; that related to the extensive cracking damage for DS2; that related to the “economically convenience” limit to repair without demolish/reconstruct is neglected in what follows; lastly the one related the total infill collapse/failure condition has been used herein (Figure 11) to determine the repair cost of buildings characterized by the DS3 according to the definition of EMS-98 (in which the total failure of the infill is assumed).
Hence, C DSi TOT has been evaluated as suggested in [18] for three panel typologies (panel without openings, panel with window opening and panel with door opening), by means of a Monte Carlo simulation technique, considering a number of 1000 simulations varying the length dimension of the infill panel from 4.00 m to 5.00 m and assuming the panel height equal to 2.75 m. It is assumed herein that the clay infill panel is realized with a double leaf cavity masonry wall with (hollow + hollow) panel, constituted by (12 × 25 × 25) cm hollow clay brick (void percentage > 55%) for exterior leaf and (8 × 25 × 25) cm hollow clay brick (void percentage > 55%) for interior leaf, with thermal insulation, as generally widespread in the L’Aquila region [24]. Openings are assumed as constituted by wood frames with plan dimensions of (1.20 × 2.20) m2 or (0.90 × 1.50) m2, for door or window opening, respectively. The resulting C DSi TOT for each panel typology at DSi (with i = 1,…,3) are reported in Figure 11.
Note that the values in Figure 11 can be considered as expected (mean) values of economic losses for restoring a damaged infill partition after an earthquake. A dispersion value around them may be considered due to variability related to different professional practices or considering uncertainty in contractor pricing strategies. However, this aspect is not investigated herein.
The above reported remarks and resulting data reported in Table 2 are related to exterior infill panels, namely to infills belonging to the external skin of the building. To obtain a realistic repair cost prediction for a whole building, the interior partitions should also be considered. Therefore, some hypotheses are assumed herein to evaluate the repair cost of interior infill partitions with cement mortar and (8 × 25 × 25) cm hollow clay bricks, starting from the costs obtained for the corresponding (hollow + hollow) double leaf exterior infill panel. Such assumptions and their results are summarized in Table 3, where the activities to be subtracted/added to the total cost of an exterior infill are listed and quantified. Additionally, the equivalent length of interior infill panels (Lint,x and Lint,y) along the two main orthogonal directions (x and y) is determined by assuming that the geometric percentage of interior infills (with thickness sw,int) was equal to the 50% [25] of the geometric percentage of exterior infills (with thickness sw,ext), as shown in Equations (2) and (3):
s w , int ( L int , x ) = 0.5 [ s w , ext ( 2 L x ) ] L int , x = s w , ext s w , int L x
s w , int ( L int , y ) = 0.5 [ s w , ext ( 2 L y ) ] L int , y = s w , ext s w , int L y
where sw,int = 80 mm and sw,ext = 200 mm are assumed. As a consequence, the Lint,x – to – Lint,y ratio results coherent with the plan aspect ratio (PR = Lx/Ly).

4.2. Probabilistic Evaluation of Repair Costs Due to Infill Panels for a Whole RC Building

The total repair cost estimation due to infills in a RC building obviously starts from the repair cost related to a single infill panel, but additionally requires the definition of some Random Variables (RVs) to identify the complete configuration of the damaged infills throughout the whole building, belonging to a building stock. The necessary RVs, assumed here with uniform probability density functions, are listed below:
  • Plan Area (A), assumed as a continuous RV within the ranges presented in Figure 6;
  • Plan aspect Ratio (PR), assumed as a continuous RV within the range [1; 2.5] (as suggested in [16] for a building stock in the same geographic area)
  • Damage Extent (DE), assumed as a continuous RV within the ranges [0; 1/3], [1/3; 2/3], [2/3; 1] (as in the AeDES form)
  • Presence of Openings (OP), assumed as a discrete RV among the cases: “no opening”, “window”, “door”
Therefore, for each building belonging to the collected database, starting from its own plan area range and damage extent range from the related AeDES form, 1000 random samples are generated in a Monte Carlo simulation approach, thus assuming Aj, PRj, DEj, OPj with j = 1, …,1000. Then, the following cascading quantities can be defined for each building and for each sample j:
  • Longitudinal (Lxj) and Transversal (Lyj) plan length:
    Lxj = Aj/PRj; Lyj = Aj/Lxj
  • Exposed infills area (S): Plan perimeter (P) × Building height (H) (the latter defined as the number of stories (ns) multiplied by the inter-story height, h, assumed equal to 3 meters), as in Equation (4):
    Sj = Pj × H = 2(Lxj + Lyj) × ns × 3 m
  • Damaged infills area at DSi (SDSij): Exposed infills area × Damage Extent at the damage level DSi, as in Equation (5):
    SDSij = Sj × DEij
  • Repair cost at a given DSi (RCDSij): Damaged infills area at DSi × Repair cost at that DSi, as shown in Equation (6):
    RCDSij = SDSij × CTOTDSi
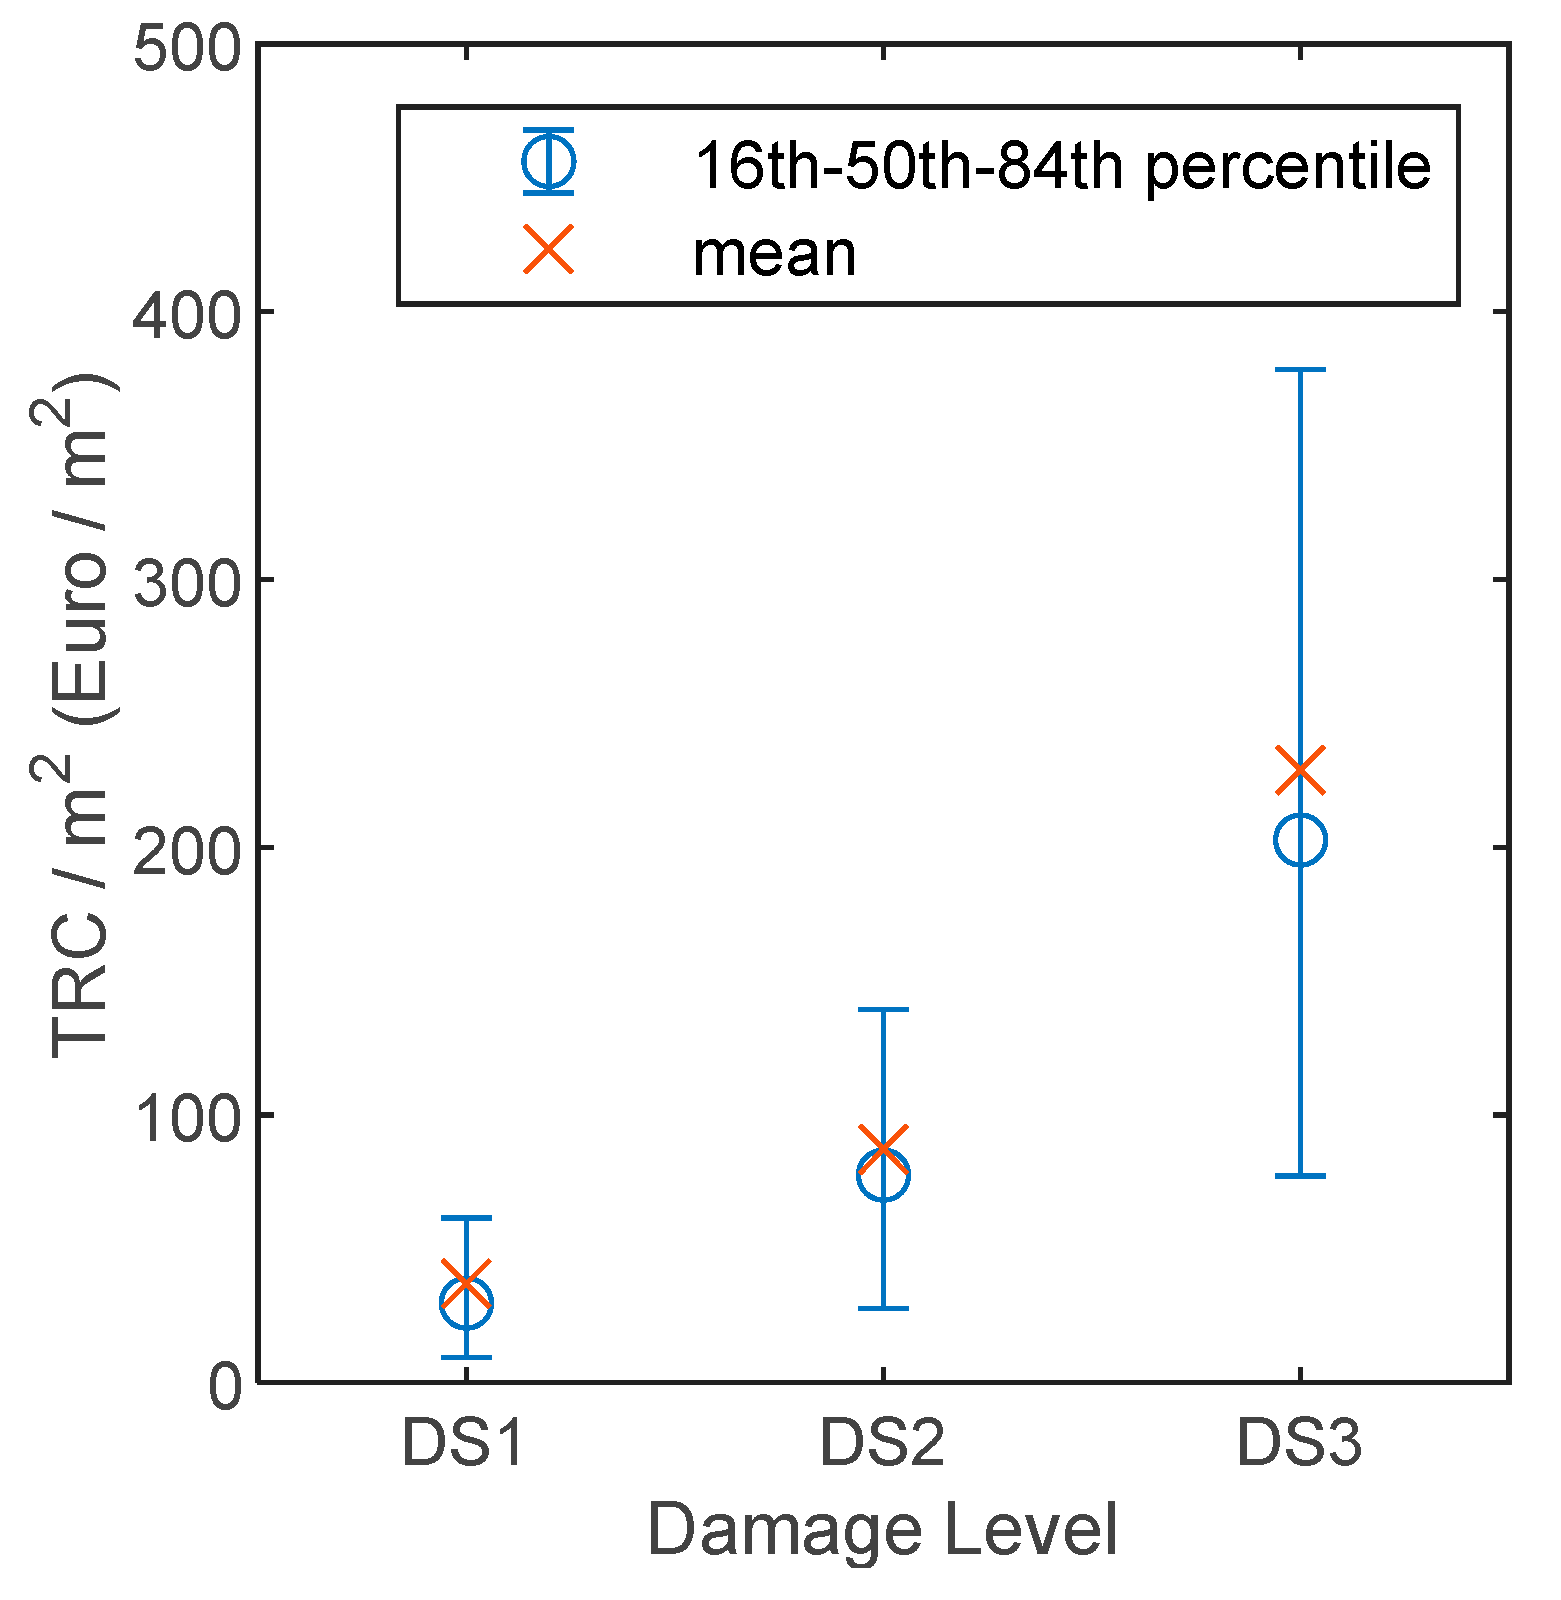
  • Mean total repair cost TRC, as the sum of RCDSi, for i = 1, …,3, averaged among all the samples.

5. Resulting Repair Costs for Infills and Discussion

The result of the procedure described in Section 4 is summarized in Figure 12, in terms of TRC per the total plan area unit (average plan surface × number of stories) in Euro (€)/m2 and depending on the maximum observed DS. Mean and median values, 16th and 84th percentiles are shown in Figure 12 and reported in Table 4 for each maximum DS.
A further de-composition of these costs is performed and explained below. The TRC reported in Figure 12 can be disaggregated as shown in Figure 13, depending on the maximum damage level to investigate about the influence, if any, of the parameters number of stories, age of construction, and average plan surface on the outcome TRC/m2.
Figure 13 highlights that the age of construction is generally not significantly influent on the total repair cost per square meter. On the contrary, the TRC/m2 very slightly decreases for increasing number of storeys and more significantly decreases with the average plan area. Such a trend seems to be counter-intuitive, due to the (opposite) trends of damage distribution, shown in Figure 10. Actually, DSs distributions are related to the maximum observed damage level, which is generally quite concentrated in a small portion (“<1/3”) of the building (Figure 8b). Therefore, when TRC is divided by the whole plan surface (average plan surface x number of stories), a decreasing trend is observed with increasing average plan surface or number of stories. Additionally, the decreasing trend is more evident depending on the average surface, likely because for increasing plan area, the percentage incidence of the (at least) exterior infills decreases, thus leading to a reduction of the TRC per surface unit.

Comparison with the Actual Repair Costs

The usability judgments carried out in the aftermath of the seismic event have been strictly related to the (mean) total actual repair cost and, consequently, to the reconstruction refund level, as reported in [19] and [9]. Therefore, the mean actual costs depending on the usability judgments can be a useful term of comparison for the mean repair costs due to infills estimated herein, to highlight the percentage incidence of the infills on the total actual repair cost. To this aim, first a correlation between the usability judgment and the damage extent and severity should be assumed, in compliance with the AeDES form. According to the AeDES form (as explained in more detail in Section 2), the damage level D1, whatever the extent, generally leads to the definition of a “low” structural risk for the building, namely to a usability judgment “A” (i.e., “Usable building”). Therefore, DS1 as defined above, is completely included within the usability judgment “A”, together with the damage level DS0. AeDES manual [4] also suggests that, if a big number of infill panels (high extent) are interested by damage level D2–D3, the total structural risk can be “high”; otherwise, a lower structural risk level can be evaluated for less significant damage. Therefore, when D2–D3 has an extent “<2/3”, usability judgment “B” is obtained. When the extent of the damage level D2–D3 is “>2/3” or the building reaches the damage level D4–D5, its usability rating is “E”. In summary, the complete assumed correlation between DSs by EMS-98, AeDES damage grade and extent, and AeDES usability judgments is reported in Table 5.
Starting from this definition of usability rating, the percentage of buildings with “A”, “B”, and “E” judgements can be obtained, as reported in Figure 14. Note that the main difference between the DSs distribution (shown in Figure 8) and the usability judgments distribution is the attribution of damage level D2-D3 for an extent “>2/3” to the most severe usability rating (“E”).
In summary, a total of 4349 buildings result in “A” rating; 478 buildings have judgement “B” and 268 buildings “E”. Note that in the following analyses, to evaluate the repair costs for “A” buildings, only those actually damaged are considered (namely only buildings in DS1), since buildings in DS0 clearly do not require any repairing activities.
The estimated repair costs are the same already evaluated in the previous Section, but now TRC/m2 is plotted depending on the usability rating, as shown in Figure 15 (and in Table 6), where 16th, 50th and 84th percentiles are reported together with the mean values (red crosses).
The actual repair costs can be obtained from Dolce and Manfredi [19], depending on the usability judgments, specifically for those buildings that, after the post-L’Aquila earthquake in-situ surveys, have been classified:
  • As “B” rating, or
  • In usability judgment “E” with “high risk due to damage to infills and slight structural damages” (defined as “E according to O.P.C.M. 3779” in [19]), the latter representing the subset of data with “E” rating more similar to the dataset analysed in this work (“lightly-damaged buildings”).
The actual repair costs include building safety measures, eventual demolition, transportation and landfill disposal, repair and finishing activities, services (sanitary and electrical equipment, plumbing), other non-structural components (floors, roof and chimney, lights…), technical works, charges for design and technical assistance [26]. These actual repair costs are shown in Table 7 and compared with the estimated TRC reported above. Note that no actual costs can be obtained for “A” usability rate, because they were not explicitly reported in [19].
Table 7 clearly shows that the predicted repair costs due to masonry infills represent a lower bound for the total actual repair cost for the analysed buildings dataset, as expected. The mean estimated TRC does not include the repairing of the structural components (even if very slight damage for the considered buildings dataset), services (sanitary and electrical equipment, plumbing) and other non-structural components (floors, roof and chimney, lights…). The reparability analysis of these additional components would require the exact knowledge of the disposal of the services with respect to the infill panels distribution or some arbitrarily assumptions on the floor replacement, for example. Such “additional activities” can represent up to a maximum of 50% of the total repair cost depending on the damage grade and extent on the vertical structural components ([26,27]). Additionally, the mean TRC estimated herein consider the minimum damaged infill area to be repaired/replaced, without any conversion in a minimum effective (integer) number of infill panels, conversion that would be quite arbitrary. This circumstance is much more emphasized for “B” Usability judgements, where a predicted-versus-actual TRC ratio equal to 0.4 is observed. As a matter of fact, for these buildings, the predicted repair activities concerning the demolition/construction of masonry infill panels and plaster removal/application are restricted to only 10% and 30%, respectively, of the exposed area. These percentages have to be considered as the minimum strictly necessary in compliance with the damage classification reported by the AeDES form. Likely, the actual area of intervention could be affected by a stronger level of invasiveness, well beyond this conventional limit, producing a higher actual TRC.
In conclusion, the repair cost due to masonry infills only, including all the activities listed in Table 2, represent an average of 50% of the total actual repair cost. This outcome is in good agreement with a recent study by [26], which investigated a specific case-study building among those collected after the post-L’Aquila earthquake survey defined as “E according to OPCM 3779”. It shows that infills represent about 55% of the sum of costs related to services (sanitary and electrical equipment, plumbing), structural components, infills and partitions, other non-structural components (floors, roof and chimney, lights…), in tune with the outcome obtained herein.
It could be stated that repair costs (as per the evaluation) should be multiplied by a factor equal to 2, on average, to obtain the actual total repair cost, for lightly-damaged RC residential buildings. Further studies are certainly necessary to confirm the outcome obtained and commented herein.

6. Conclusions

In commonly adopted loss computation tools (e.g., PACT tool [3] proposed by FEMA P-58 [1]), no specific data related to masonry infill panels, as widespread in moment-resisting-frame residential buildings, are available to perform a reliable probabilistic assessment of losses. To fill this gap, specific fragility and loss functions have been recently carried out in the literature, e.g., by Del Gaudio et al. [18], as adopted in the present study. This proposal has been compared herein with actual repair costs, specifically related to masonry infills, obtained from real post-earthquake damage surveys to estimate the relevance of the repair costs due to infills with respect to the total reconstruction process.
To this aim, Reinforced Concrete (RC) residential buildings with masonry infills struck by the 2009 L’Aquila earthquake have been analysed, focusing on the dataset of 5095 “lightly” damaged buildings, where only damage to masonry infills (or no damage at all) occurred. All these buildings have been assessed with a post-earthquake usability in-situ assessment procedure (Baggio et al., [4]), which provided a comprehensive description of the damage severity and extent. The observed damage scenario for this building stock has been obtained and analysed, starting from the Damage States (DSs) definition (from DS1 to DS3, increasing damage severity) by the EMS-98 (Grunthal [21]), and AeDES survey forms (Baggio et al. [4]). In summary, 2406 buildings presented no damage to infills and partitions (and no damage to vertical structures, roofs, stairs, etc.). A total of 1943 buildings were in damage level DS1, 555 were in DS2, and a smaller portion (191 buildings) presented a damage level of DS3.
The repair costs for infills have been estimated given the observed damage scenario, starting from the cost analysis related to a single infill panel reported in Del Gaudio et al. [18] and extending to the whole analysed dataset of buildings. Mean values of these costs resulted in a range from about 37 €/m2 to about 230 €/m2, passing from DS1 to DS3. They were not affected by the age of construction of the buildings; only slightly decreasing for an increasing number of storeys and more significantly decreasing with the average plan area. The predicted repair costs due to masonry infills have been lastly compared with the related actual repair costs reported in Dolce and Manfredi [19], specifically related to buildings with damage to infills and only slight damage to structural components. The predicted repair costs due to masonry infills resulted equal, on average, to 50% of the total actual repair cost.
It is worth noting that the predicted costs estimated in this work refer to a specific infill typology, commonly adopted in the L’Aquila region. Nevertheless, this study can be extended in future research to other infill typologies, also considering different kinds of doors/windows technology and materials, or variability of the estimated costs. Therefore, further studies are certainly necessary to support the outcomes obtained herein.

Author Contributions

Conceptualization, M.T.D.R., C.D.G., G.M.V.; methodology, M.T.D.R., C.D.G.; software, C.D.G.; validation, M.T.D.R., C.D.G.; formal analysis, M.T.D.R.; investigation, M.T.D.R., C.D.G., G.M.V.; data curation, C.D.G.; writing—original draft preparation, M.T.D.R.; writing—review and editing, C.D.G., G.M.; supervision, G.M.V.; project administration, M.T.D.R., G.M.V.; funding acquisition, M.T.D.R., G.M.V.

Funding

This research was funded by AXA Research Fund Post-Doctoral Grant “Advanced nonlinear modelling and performance assessment of masonry infills in RC buildings under seismic loads: the way forward to design or retrofitting strategies and reduction of losses” (grant number: E67G17000020007), and ReLUIS-DPC 2014-2018 Linea CA-WP6 Tamponature funded by the Italian Department of Civil Protection (grant number: E56D16000670005).

Conflicts of Interest

The authors declare no conflict of interest. The funders had no role in the design of the study; in the collection, analyses, or interpretation of data; in the writing of the manuscript, or in the decision to publish the results.

References

  1. FEMA. Seismic Performance Assessment of Buildings; Fema: Washington, DC, USA, 2012.
  2. Moehle, J.; Deierlein, G.G. A framework methodology for performance-based earthquake engineering. In Proceedings of the 13th World Conference on Earthquake Engineering, Vancouver, BC, Canada, 1–6 August 2004. Article number 13. [Google Scholar]
  3. FEMA. Performance Assessment Calculation Tool (PACT). Available online: http://www.fema.gov/medialibrary/assets/documents/90380 (accessed on 15 October 2018).
  4. Baggio, C.; Bernardini, A.; Colozza, R.; Coppari, S.; Corazza, L.; Della Bella, M.; Di Pasquale, G.; Dolce, M.; Goretti, A.; Martinelli, A.; et al. Field manual for post-earthquake damage and safety assessment and short term countermeasures. JRC Sci. Tech. Rep. 2007. [Google Scholar]
  5. Cremen, G.; Baker, J.W. A Methodology for Evaluating Component-Level Loss Predictions of the FEMA P-58 Seismic Performance Assessment Procedure. Earthq. Spectra 2019, 35, 193–210. [Google Scholar] [CrossRef]
  6. Cardone, D.; Gesualdi, G.; Perrone, G. Cost-benefit analysis of alternative retrofit strategies for RC frame buildings. J. Earthq. Eng. 2017, 23, 208–241. [Google Scholar] [CrossRef]
  7. Dolce, M.; Goretti, A. Building damage assessment after the 2009 Abruzzi earthquake. Bull. Earthq. Eng. 2015, 13, 2241–2264. [Google Scholar] [CrossRef]
  8. De Martino, G.; Di Ludovico, M.; Prota, A.; Moroni, C.; Manfredi, G.; Dolce, M. Estimation of repair costs for RC and masonry residential buildings based on damage data collected by post-earthquake visual inspection. Bull. Earthq. Eng. 2017, 15, 1681–1706. [Google Scholar] [CrossRef]
  9. Di Ludovico, M.; Prota, A.; Moroni, C.; Manfredi, G.; Dolce, M. Reconstruction process of damaged residential buildings outside historical centres after the L’Aquila earthquake: Part I—“Light damage” reconstruction. Bull. Earthq. Eng. 2017, 15, 667–692. [Google Scholar] [CrossRef]
  10. Di Ludovico, M.; Prota, A.; Moroni, C.; Manfredi, G.; Dolce, M. Reconstruction process of damaged residential buildings outside historical centres after the L’Aquila earthquake: Part II—“Heavy damage” reconstruction. Bull. Earthq. Eng. 2017, 15, 693–729. [Google Scholar] [CrossRef]
  11. Del Vecchio, C.; Di Ludovico, M.; Pampanin, S.; Prota, A. Repair costs of existing RC buildings damaged by the L’Aquila earthquake and comparison with FEMA P-58 predictions. Earthq. Spectra 2018, 34, 237–263. [Google Scholar] [CrossRef]
  12. Cardone, D.; Perrone, G. Developing fragility curves and loss functions for masonry infill walls. Earthq. Struct. 2015, 9.1, 257–279. [Google Scholar] [CrossRef]
  13. Del Gaudio, C.; De Martino, G.; Di Ludovico, M.; Manfredi, G.; Prota, A.; Ricci, P.; Verderame, G.M. Empirical fragility curves from damage data on RC buildings after the 2009 L’Aquila earthquake. Bull. Earthq. Eng. 2017, 15, 1425–1450. [Google Scholar] [CrossRef]
  14. Del Gaudio, C.; Ricci, P.; Verderame, G.M.; Manfredi, G. Development and urban-scale application of a simplified method for seismic fragility assessment of RC buildings. Eng. Struct. 2015, 91, 40–57. [Google Scholar] [CrossRef]
  15. Del Gaudio, C.; Ricci, P.; Verderame, G.M.; Manfredi, G. Observed and predicted earthquake damage scenarios: The case study of Pettino (L’Aquila) after the 6th April 2009 event. Bull. Earthq. Eng. 2016, 14, 2643–2678. [Google Scholar] [CrossRef]
  16. Del Gaudio, C.; Ricci, P.; Verderame, G.M. A class-oriented mechanical approach for seismic damage assessment of RC buildings subjected to the 2009 L’Aquila earthquake. Bull. Earthq. Eng. 2018, 16, 1–25. [Google Scholar] [CrossRef]
  17. De Risi, M.T.; Del Gaudio, C.; Ricci, P.; Verderame, G.M. In-plane behaviour and damage assessment of masonry infills with hollow clay bricks in RC frames. Eng. Struct. 2018, 168, 257–275. [Google Scholar] [CrossRef]
  18. Del Gaudio, C.; De Risi, M.T.; Ricci, P.; Verderame, G.M. Empirical drift-fragility functions and loss estimation for infills in reinforced concrete frames under seismic loading. Bull. Earthq. Eng. 2019, 17, 1285. [Google Scholar] [CrossRef]
  19. Dolce, M.; Manfredi, G. Libro Bianco Sulla Ricostruzione Privata Fuori dai Centri Storici nei Comuni Colpiti dal Sisma dell’Abruzzo del 6 Aprile 2009; Doppiavoce Editore: Napoli, Italy, 2015. (In Italian) [Google Scholar]
  20. Dolce, M.; Speranza, E.; Giordano, F.; Borzi, B.; Bocchi, F.; Conte, C.; Pascale, V. Da. DO—A web-based tool for analyzing and comparing post-earthquake damage database relevant to national seismic events since 1976. In Atti del XVII Convegno ANIDIS L’ingegneria Sismica in Italia; Pisa University Press: Pisa, Italy, 2017; pp. 347–357. [Google Scholar]
  21. Grunthal, G. Cahiers du Centre Europeen de Geodynamique et de Seismologie: Volume 15—European Macroseismic Scale; European Center for Geodynamics and Seismology: Luxembourg, 1998. [Google Scholar]
  22. Michelini, A.; Faenza, L.; Lauciani, V.; Malagnini, L. ShakeMap implementation in Italy. Seismol. Res. Lett. 2008, 79, 688–697. [Google Scholar] [CrossRef]
  23. B.U.R.A. Price List of Public Works in Abruzzi Region; Regione Abbruzzo: L’Aquila, Italy, 2017. (In Italian) [Google Scholar]
  24. Ricci, P.; De Luca, F.; Verderame, G.M. 6th April 2009 L’Aquila earthquake, Italy: Reinforced concrete building performance. Bull. Earthq. Eng. 2011, 9, 285–305. [Google Scholar] [CrossRef]
  25. Del Gaudio, C.; Ricci, P.; Verderame, G.M.; Manfredi, G. Urban-scale seismic fragility assessment of RC buildings subjected to L’Aquila earthquake. Soil Dyn. Earthq. Eng. 2017, 96, 49–63. [Google Scholar] [CrossRef]
  26. Del Vecchio, C.; Di Ludovico, M.; Prota, A.; Pampanin, S. Repair costs analysis for case study buildings damaged in the 2009 L’Aquila earthquake. In Proceedings of the NZSEE Conference, Christchurch, New Zealand, 1–3 April 2016. [Google Scholar]
  27. Aslani, H.; Miranda, E. Probabilistic Earthquake Loss Estimation and Loss Disaggregation in Buildings; Research Report No. 157; J. A. Blume Earthquake Engineering Center: Stanford, CA, USA, 2005. [Google Scholar]
Figure 1. Extract of the AeDES form for building description—adapted from Baggio et al. [4].
Buildings 09 00122 g001
Figure 2. Examples of Medium-Severe and Very Heavy damage to infills: horizontal and vertical cracks between infill and beams/columns—widespread damage D2–D3 and locally D4–D5 (a); damage D4–D5 to infills (b); damage D4–D5 with out-of-plane collapse of one infill leaf (c)—adapted from [4].
Buildings 09 00122 g002
Figure 3. Usability judgments according to the AeDES form—adapted from Baggio et al. [4].
Buildings 09 00122 g003
Figure 4. Shakemaps derived by the Italian National Institute of Geophysics and Volcanology (INGV) for PGA.
Buildings 09 00122 g004
Figure 5. Damage description according to the AeDES forms and analysed damage—adapted from Baggio et al. [4].
Buildings 09 00122 g005
Figure 6. Frequency distributions of number of stories, plan area (A) (“na” = not available), year of construction, and PGA suffered during the L’Aquila 2009 earthquake for the analysed subset of buildings.
Buildings 09 00122 g006
Figure 7. Cross-correlation in the frequency distributions for the analysed subset of buildings: number of storeys (from 1 to 7)—plan area (a), year of construction—plan area (b), number of storeys—year of construction (c).
Buildings 09 00122 g007
Figure 8. “Observed” maximum damage scenario for “lightly damaged” RC buildings (a), and details about the extent of the maximum damage in each DS (b).
Buildings 09 00122 g008
Figure 9. “Coexisting” damage given the maximum damage level (Number (#) of buildings is in logarithmic scale).
Buildings 09 00122 g009
Figure 10. Analysis of the observed damage scenario for “lightly-damaged” RC buildings depending on the PGA of the event, year of construction, number of storeys and plan area of the buildings.
Buildings 09 00122 g010
Figure 11. Repair costs ( C DSi TOT ) for double leaf hollow clay bricks.
Buildings 09 00122 g011
Figure 12. TRC due to infills depending on the maximum attained DS.
Buildings 09 00122 g012
Figure 13. Trends of TRC/m2 with number of storeys, age of construction, and average plan surface depending on the maximum achieved DS (the figure shows 50th, 16th and 84th percentiles).
Buildings 09 00122 g013aBuildings 09 00122 g013b
Figure 14. Usability judgments frequency and related damage extent.
Buildings 09 00122 g014
Figure 15. TRC depending on the usability judgment (costs for judgment “A” only consider buildings in DS1).
Buildings 09 00122 g015
Table 1. Correspondence of damage level according to EMS-98 and AeDES form (each background color represents the related DS in the following figures).
DSEMS-98 [21]AeDES form [4]
Damage DescriptionDamage SeverityDamage Extent
DS0No DamageD0—Null DamageNone
DS1Negligible to Slight damage:
Fine cracks in partitions and infills.
D1:
Slight
<1/3
1/3–2/3
>2/3
DS2Moderate damage:
Cracks in partition and infill walls
D2–D3:
Medium—Severe
<1/3
1/3–2/3
>2/3
DS3Substantial to Heavy damage:
Large cracks in partition and infill walls, failure of individual infill panels
D4–D5:
Very Heavy
<1/3
1/3–2/3
>2/3
Table 2. Extension of intervention for each elementary actions and related unit cost according to [23]—adapted from [18].
Activity GroupElementary ActionsUnitUnit Cost (cj)Aj,DS1Aj,DS2Aj,DS3
a. Preliminary operationsInstall scaffolding with steel scaffolding and multi-directional ringlock rosettes […].€/m225.72(Hw × Lw)(Hw × Lw)(Hw × Lw)
b. Demolition activitiesDemolition of single leaf masonry brick with mechanical equipment€/m213.84-10%(Hw × Lw)(Hw × Lw)
Render or plaster removal up to 5 cm thick (including surface brushing of affected area)€/m28.58(0.20 m) × d30%(Hw × Lw)(Hw × Lw)
c. Construction activitiesConstruction of infill panels:
Construction of double leaf cavity masonry wall (12 × 25 × 25 hollow clay brick for exterior leaf and 8 × 25 × 25 hollow clay brick for interior leaf)€/m272.58-10%(Hw × Lw)(Hw × Lw)
Cavity thermal insulation with Glass mineral wool€/m222.78
d. FinishingsCoat rendering or plastering (3 layers) with cement mortar€/m223.86(0.20 m) × d(30 + 10)%
(Hw × Lw)
(Hw × Lw)
Water-based primer application€/m22.53(Hw × Lw)(Hw × Lw)(Hw × Lw)
Coating painting (3 layers) for each side with water-based paints€/m213.19(Hw × Lw)(Hw × Lw)(Hw × Lw)
e. Windows or door frame installationInstallation of new or old window or door opening
Installation of new window or door opening with solid wood frame with douglas […]€/m2542.6--(Hop × Lop) *
Installation of old window or door opening with solid wood frame, glazing and rolling shutter €/m262.36---
Removal of solid wood frame, box and roller shutter€/m234.12--(Hop × Lop) *
f. LandfillLandfill transportation€/m326.24(0.20 m) × d × (0.1 0m)30%(Hw × Lw) × (0.10 m) +
10%(Hw × Lw) × (sw ** + 0.10 m)
(Hw × Lw) × (sw + 0.10 m)
Landfill disposal *€/t15.18
g. Technical costTechnical cost%8.00 j { a , b , c , d , e , f } c j A j , D S 1 j { a , b , c , d , e , f } c j A j , D S 2 j { a , b , c , d , e , f } c j A j , D S 4
* “Hop” and “Lop” are the height and length of the opening, respectively; ** sw = infill thickness.
Table 3. Definition of the repair cost for interior infill partitions starting from the costs of exterior infills.
(Hollow + Hollow) Panel without Openings: Exterior InfillCTOTDS1CTOTDS2CTOTDS3
77105.3285.8
subtractScaffolding with steel scaffolding and
multi-directional ring-lock rosettes, with fiberglass monofilament netting for scaffolding enclosure
25.725.725.7
Demolition of single leaf masonry brick
with mechanical equipment
-1.413.8
Construction of double leaf cavity masonry wall (12 × 25 × 25) cm hollow clay brick for exterior leaf
and (8 × 25 × 25) cm hollow clay brick for interior leaf
-7.372.6
addInterior infill partition with cement mortar and
(8 × 25 × 25) cm hollow clay bricks
-2.626.3
Costs for interior partition with hollow clay brick51.373.5199.9
Table 4. Median, 16th and 84th percentiles for TRC depending on the maximum DS.
TRC (€/m2)MeanMedian16th Percentile84th Percentile
DS136.9629.639.4561.3
DS287.0577.4327.72139.23
DS3228.86202.777.1378.5
Table 5. Assumed correspondence between usability judgments and damage levels according to EMS-98 and AeDES form (background colors are used in the figures to tag each DS or usability judgment).
DSEMS-98 [21]AeDES form [4]
Damage DescriptionDamage SeverityDamage ExtentUsability Judgement
DS0No DamageD0—Null DamageNoneA
DS1Negligible to Slight damage:
Fine cracks in partitions and infills.
D1:
Slight
<1/3
1/3–2/3
>2/3
DS2Moderate damage:
Cracks in partition and infill walls
D2–D3:
Medium—Severe
<1/3B
1/3–2/3
>2/3E
DS3Substantial to Heavy damage:
Large cracks in partition and infill walls, failure of individual infill panels
D4–D5:
Very Heavy
<1/3
1/3–2/3
>2/3
Table 6. Mean, median, 16th and 84th percentiles for the estimated TRC depending on the usability judgment (costs for judgment “A” only consider buildings in DS1).
TRC (€/m2)MeanMedian16th Percentile84th Percentile
A36.9429.639.4361.28
B74.3368.1724.07117.97
E211.77180.7894.36332.20
Table 7. Comparison between mean estimated TRC and mean actual repair cost.
Usability
Judgement
Mean Estimated
TRC
(€/m2)
Mean Actual Cost
(Dolce and Manfredi [19])
(€/m2)
Mean Estimated TRC/
Mean Actual Cost
(-)
A36.94not available-
B74.33183.760.40
E211.77342.35 *0.62
* “E according to O.P.C.M. 3779”.

