
Assessing Tenth-Grade Students’ Mathematical Literacy Skills in Solving PISA Problems


1
College of Education, Humanities and Social Sciences, Al Ain University, Al Ain P.O. Box 64141, United Arab Emirates
2
Emirates College for Advanced Education, Abu Dhabi P.O. Box 126662, United Arab Emirates
*
Author to whom correspondence should be addressed.
Soc. Sci. 2023, 12(1), 33; https://doi.org/10.3390/socsci12010033
Submission received: 15 October 2022
/
Revised: 3 December 2022
/
Accepted: 5 December 2022
/
Published: 3 January 2023
Abstract
:We tested the mathematical literacy (ML) proficiency of 204 grade 10 “advanced track” students in the United Arab Emirates (UAE) using 34 questions from the Programme for International Student Assessment (PISA) 2012 released items. Using a quantitative descriptive approach, we analyzed the performance of males (n = 106) and females (n = 98) on items spread across the four content subdomains (quantity, space and shape, change and relationship, and uncertainty), the processes of problem-solving (formulate, employ, reasoning, and interpret), and the four PISA contexts (personal, occupational, societal, and scientific) across six PISA proficiency levels. The test was formulated in three types of response format (multiple choice, closed- and open-ended). Results showed that overall student performance was in the very low category. Female students outperformed male students in all aspects of mathematical literacy. The highest percentage achieved in the modelling process was in the interpreting and then employ and formulate tasks. Students performed almost perfectly in problems that covered the uncertainty content area but fared poorly with problems dealing with change and relationship. Students performed better on personal mathematical problems than occupational, societal or scientific problems. These findings are important for UAE teachers regarding direct application to classroom practice and for researchers and officials to shape future research and recommendations for future new educational policies.
1. Introduction
We need to learn how to prepare our pupils for the future because of the rapid pace at which things are changing around us. As a result, the UAE’s focus is on appropriate and relevant educational goals, such as building a generation capable of tackling life’s difficulties on a global scale, as stated in the National Agenda for UAE Vision (UAE 2021).
According to Gellert and Jablonka (2007), the “mathematization of society” necessitates more than ever equipping students with the necessary mathematical knowledge and skills to effectively participate in this “mathematized world” and comprehend real-life quantitative challenges. Furthermore, the literature on mathematics education goals reflects the growing use of practical mathematical knowledge of quantitative problems in daily life. Participating in international studies, according to Hiebert and Stigler (2004), is an effective way to compare student performance with those in other countries, and can also help to improve mathematics instruction. This will assist governments in better understanding other countries’ practices and how the effectiveness of their educational systems can be improved.
In the UAE, students have performed poorly in mathematics in international studies such as PISA (Programme for International Student Assessment). The results of past PISA mathematical literacy test cycles showed that the UAE is on a “stable” path (OECD 2019). In 2018, the UAE was rated 50th out of roughly 80 countries in mathematics, indicating a poor performance despite an increase of about eight points over the 2015 cycle (OECD 2019).
There are six levels of proficiency in PISA, with level 1 being the lowest. Students with a proficiency level of 2 or higher are considered by the OECD to have the requisite abilities to succeed in a knowledge economy. Table 1 shows the percentages of low performers (below level 2) and high achievers (levels 5 and 6) from the beginning of the UAE’s accession to PISA in 2009 until 2018 (OECD 2019), noting that the results of the most recent PISA 2021/2022 have not yet been released.
According to the PISA 2018 results, roughly 54% of UAE students achieved level 2 or better in mathematics (OECD average: 76%), compared to 98% in Beijing, Shanghai, Jiangsu, and Zhejiang (China), implying that nearly half of UAE students (46%) perform below level 2 (at this level or below). These students can interpret and recognize how to depict a simple scenario numerically without being given explicit instructions (OECD 2018b). Only 5% of UAE pupils (OECD average: 11%) could solve problems at the two highest levels of mathematics, compared to 44% in Beijing, Shanghai, Jiangsu, and Zhejiang (China) and 37% in Singapore. Students regarded as gifted and capable in any country can model mathematically difficult situations and apply problem-solving techniques successfully and properly (OECD 2018b).
However, the UAE still has far to go to meet its National Agenda target of ranking among the top 20 countries in the PISA (UAE 2021). The PISA is particularly important since it is a competency-based assessment with a widely acknowledged framework for assessing and comparing student success regularly across countries. Given that UAE students’ skills are mostly at lower levels (OECD 2018b, 2019), greater efforts are needed to help them build higher-order thinking skills. High-achieving students are of particular importance since they are expected to lead the country in international competition. The first step in assisting pupils development of higher-order thinking skills is to assess their current level of competence. As a result, the purpose of this study is to describe the current condition of students’ mathematical literacy, with a particular focus on the PISA in terms of content, process, and context. This will help inform future decisions and preparations for the PISA future cycle. Furthermore, this research is particularly significant because it aligns with the UAE’s National Agenda aims (OECD 2014).
2. Research Questions
The purpose of this study is to describe the mathematical literacy skills of the UAE’s students. Therefore, to fulfill this purpose, we sought to answer the following questions:
- (a)
- What is the level of the UAE’s students’ mathematical literacy?
- (b)
- Is there a significant difference between male and female students’ mathematical literacy?
3. Literature Review
3.1. Mathematical Literacy Framework in the PISA
“An individual’s capacity to reason mathematically and to formulate, utilize, and interpret mathematics to solve issues in a range of real-world contexts” is characterized as mathematical literacy (ML) in the PISA. It consists of concepts, methods, data, and tools that can be used to describe, explain, and forecast occurrences. It helps people understand the role of mathematics in the world, enabling them to make the well-informed judgments and decisions that constructive, engaged, and thoughtful 21st century citizens require (OECD 2018a). The ML of the PISA 2021 framework is depicted in Figure 1.
This definition implies that the PISA is more focused on real-world applications of mathematical knowledge in various circumstances and that explicit mathematical problems are unlikely to be included in the assessment. As a result, rather than focusing on whether students have mastered a specific math topic, the PISA evaluation largely focuses on contextual questions that demonstrate what students can perform depending on what they have learned in school and on students’ mathematical reasoning (Novita and Putra 2016; OECD 2018a). The focus of contextual problems is on real-world issues that occur outside of the realm of pure mathematics (Reinke 2019).
Real-world challenge context issues in the PISA can be classified based on their context or mathematics content into four categories: personal, societal, occupational, and scientific. Personal context refers to the challenges that an individual may face; societal context refers to the community in which an individual lives, whether local, national, or global; occupational context refers to work situations, and scientific context refers to how mathematics is applied in the world (OECD 2013).
The nature of the mathematical phenomenon, which is based on four mathematical content categories dubbed “overarching notions,” can be described in addition to the problem’s context (OECD 2013). This contrasts with the content approach that many people are familiar with in terms of mathematics education and school curricula. However, the overarching concepts collectively cover a range of mathematical topics that students are likely to encounter. According to the OECD (2013), mathematical content categories include change and relationship, in which students can model change and relationships using appropriate functions and equations; space and shape, in which students understand perspective, create and read maps, and manipulate 3D objects; quantity, in which 15-year-olds can understand multiple representations of numbers, participate in mental arithmetic, use estimation, and assess the reasonableness of results; and incomplete understanding, in which students can understand multiple representations
3.2. Processes Involved in Mathematical Modeling Cycle
The OECD considers mathematical modeling to be a cornerstone of the PISA framework for mathematics, where it is included in the concept of mathematical literacy, which looks at the ability to cope with real-life situations. In several stages, students use mathematics and mathematics tools to address contextual problems. Mathematical modeling, according to Stacey and Turner (2015), consists of three steps: formulating, solving, and interpreting. With respect to these processes, the teacher’s main job is to guide pupils from real-life circumstances to the application of relevant mathematics. As shown in Figure 2, these procedures are important components of mathematical modeling and mathematical literacy, as defined for the 2012 cycle (OECD 2013).
A problem in context is used to start the mathematical modeling cycle. To begin solving the contextual problem, the person attempts to define the scenario mathematically using the necessary mathematics found in the problem situation. To apply the mathematical treatment, the problem solver converts the problem in context into a mathematical problem at this point. Then, to generate mathematical findings and concepts, techniques, facts, and tools are used. Mathematical thinking, manipulation, transformation, and computation take place at this stage. The mathematical outcomes must then be interpreted as results in context in terms of the original problem. In the real-world setting of the problem, the problem solver must “understand, apply, and evaluate” the mathematical answer (OECD 2013). Despite being an important part of the PISA notion of students as active problem solvers, it is not always necessary to complete every stage of a modeling cycle, especially in the context of an assessment (NCTM 2008). To be mathematically literate, however, the definition of mathematical literacy (OECD 2018b) is not focused primarily on problem-solving, as thinking is also at the core of the problem-solving cycle, as seen in Figure 3.
According to the OECD (2018a, 2018b), mathematically literate students may use their mathematical skills to derive the abstract mathematics of a contextual problem and then mathematically formulate it using proper terminology; this transformation necessitates the use of mathematics. The student must then solve the ensuing mathematical issue using mathematical concepts, techniques, and procedures learned in school. Making the right tool choice, on the other hand, may necessitate a strategic decision that also exhibits mathematical understanding. The process of analyzing and comprehending a solution within the context of the original real-world scenario also involves mathematical thinking (OECD 2018a, 2018b).
There is a connection between mathematical reasoning and problem-solving in the actual world. Furthermore, mathematical thinking is a technique of analyzing and interpreting the quantitative aspect of problem-solving that is best understood mathematically, in addition to solving practical difficulties. As a result, mathematical literacy is considered a composite of two interconnected characteristics of problem-solving and mathematical reasoning, with mathematical reasoning at the center of the problem-solving process in the PISA 2021 framework (OECD 2018b).
4. Methodology
In this descriptive study, survey research was combined with a quantitative descriptive technique. This type of study is necessary determine the current level of students’ mathematical literacy skills when completing the PISA problems, before attempting to understand why they are at this level. To achieve the study goal, test data were collected. This type of data collection provides us with a wealth of information that we may use in future studies. It is worth emphasizing that the United Arab Emirates University’s institutional review board granted ethical approval for the study.
4.1. Participants
Since they met the PISA criteria, the population for this study was 10th-grade pupils in the UAE. Students become eligible for the PISA test between the ages of 15 and 3 months and 16 and 2 months (OECD 2004). Students are at the fourth and last stage of Piaget’s stages of cognitive development, known as the formal operational stage, at the age of 15 (Gruber and Vonèche 1977). Piaget stated that pupils at this age are cognitively capable of thinking and solving problems that are congruent with the PISA test’s criteria. A consent letter was issued to the parents of the pupils before the study’s implementation.
The convenience sampling approach was used. Students who excel in mathematics and other areas choose the advanced track in the UAE school system. As a result, even if not all students performed well in the study test, it stands to reason that these high-achieving and exceptional children would be clustered in these classrooms. The implication of these factors is that rigorous procedures to investigate student performance should be followed. Consequently, the advanced stream beginning in grade 10 was deemed adequate for the study’s goal of determining the level of mathematical modeling skills of the UAE’s high achievers (and gifted, if any) in the PISA. The participants in this study included 204 students from four schools, with 19 (9%) being 14 years old, 144 (71%) being 15 years old, and 40 (20%) being 16 years old. Furthermore, 106 (52%) of the participants were males, whereas 98 (48%) were female. Table 2 shows the descriptive information.
4.2. The Study Instruments
This mathematical literacy test (MLT) was comprised of 34 PISA 2012 items available from the OECD website, and these were compared to previous results (OECD 2004). The mathematical problem items are grouped in a paragraph that describes a real-life occurrence (OECD 2010a). Since it is dependable, effective, and facilitates strong and scientific analysis, the multiple-choice exam is a crucial aspect of the PISA evaluation (OECD 2020). Frequently, up to a third of the questions in the PISA assessment are open-ended, requiring students to build an extended or short-answer response (OECD 2010b). The MLT items were disseminated across all six competency levels of the three types of response formats described in the 2012 PISA (multiple choice, closed- and open-ended responses). The items were also spread throughout the four PISA contexts (personal, public, educational/public, and scientific), as well as the four topic subdomains (quantity, space and shape, change and relationships, and uncertainty and data). In addition to reasoning, the three problem-solving procedures (formulate, employ, and interpret) were incorporated. The intervention test’s mathematical problems principally sought to assess problem-solving abilities in six competency levels presented in 26 problems (see Appendix A for sample problems). Table 3 shows the distribution of test items.
Each question in the PISA was given a difficulty level. Raw test results were translated to a score on the PISA scale using item response theory and these difficulty levels. In mathematics, the PISA scale is divided into six mathematical literacies. As shown in Table 4, the MLT items were distributed to cover all six competency levels of mathematical problems.
These proficiency levels detail what students normally know and can achieve at different levels of proficiency. In our intervention, the children were divided into six levels, with the first level consisting of students who could only complete simple activities and the sixth level of students who could answer complicated problems and had advanced thinking skills. Since the questions in this study were chosen from PISA-released items, no reliability or validity testing was conducted because the questions followed the PISA criteria and test questions. According to the PISA (OECD 2010a, 2013), “They [the questions] also have excellent measuring features, and place a focus on authenticity and educational validity”. As a result, the PISA results have a remarkable level of validity and reliability.
4.3. Methods of Data Analysis
To address the research goal, descriptive statistics were used. Highest and lowest scores, as well as means and standard deviations, were determined. The data were then categorized according to the PISA standards for each domain. In addition, the percentage of accurate answers for each item was calculated. The quantitative data on mean scores were then translated into the five categories of students’ skills and normative standard deviation (Ebel and Frisbie 1991), as shown in Table 5 ( is the ideal mean score, SDx is the ideal standard deviation, and X is the students’ score).
By subtracting the highest ideal score from the lowest ideal score, the ideal score standard deviation (SDx) was determined as 1/6 times. Then, X was computed by multiplying the greatest ideal score by the lowest ideal score 12 times. The ideal maximum score was obtained when all questions were correctly answered, while the ideal lowest score was obtained when none of the questions were successfully answered.
5. Findings
Descriptive Statistics
The optimum maximum score was 34, with a minimum score of 0 as the ideal. Table 6 shows the results of the data collection on students’ problem-solving abilities.
Table 6 shows that students’ skills in completing the PISA issues averaged 7.90 out of 34 points, with a standard deviation of 4.02. Furthermore, the male students’ mean score was 5.53, while the female students’ mean was 10.47. The female students had the highest score, whereas the males’ highest score was 9 points lower than the females’. The male students received the lowest grade as well. It is apparent that students’ abilities to solve the PISA tasks were in the very low range. Table 7 shows the percentage of pupils according to their classification score.
Table 7 reveals that none of the students scored in the very high category, and only two out of two-hundred and four students (less than 1%) scored in the high group. Furthermore, 7% of students fell into the average category, 30% of students fell into the low category, and 62% of students fell into the extremely poor category. This signifies that almost 90% of the students had below-average grades. Male students’ results were surprisingly low or very low, with the majority being extremely poor (89%). Only female pupils scored in the 2% and 14% high and average groups, respectively. Furthermore, as indicated in Table 8, student performance was evaluated using the PISA competence levels and the four primary components of ML.
Table 8 shows that student performance in a few ML subdomains was adequate. In answering level 1 and level 2 issues, student performance was high and average, respectively. For the respective subdomains of uncertainty and data as well as interpret, the students scored very well, but in the remaining subdomains performance was either poor or non-existent. Furthermore, for each of the ML domains, the percentage of correct responses was computed for all students, as well as for male and female students. Figure 4 shows the percentage of correct responses for each competence level.
Figure 4 shows that level 1 problems were easiest for students (67%) (this is the simplest competency level), followed by 53% for level 2 and 26% for level 3. On the other hand, the children scored poorly at high proficiency levels, with a 9% accuracy rate for level 4 questions, 5% for level 5, and only 2% for level 6, the most challenging proficiency level. This shows that pupils are comfortable addressing problems at the low levels of 1–3 but struggle with higher-order thinking and reasoning problems at levels 4–6. Female pupils outperformed male students at all levels. Male pupils, interestingly, failed to solve any problem from levels 5–6, which is concerning. The percentages of accurate responses for content subdomains are shown in Figure 5.
Figure 5 shows that the percentage of accurate responses for uncertainty and data was the highest at 67%, while the percentages for quantity, change and relationship, and space and form were 26%, 15%, and 16%, respectively. Female students outperformed male students in all four content subdomains, demonstrating the same pattern. Figure 6 depicts the percentages of accurate answers according to the process domain.
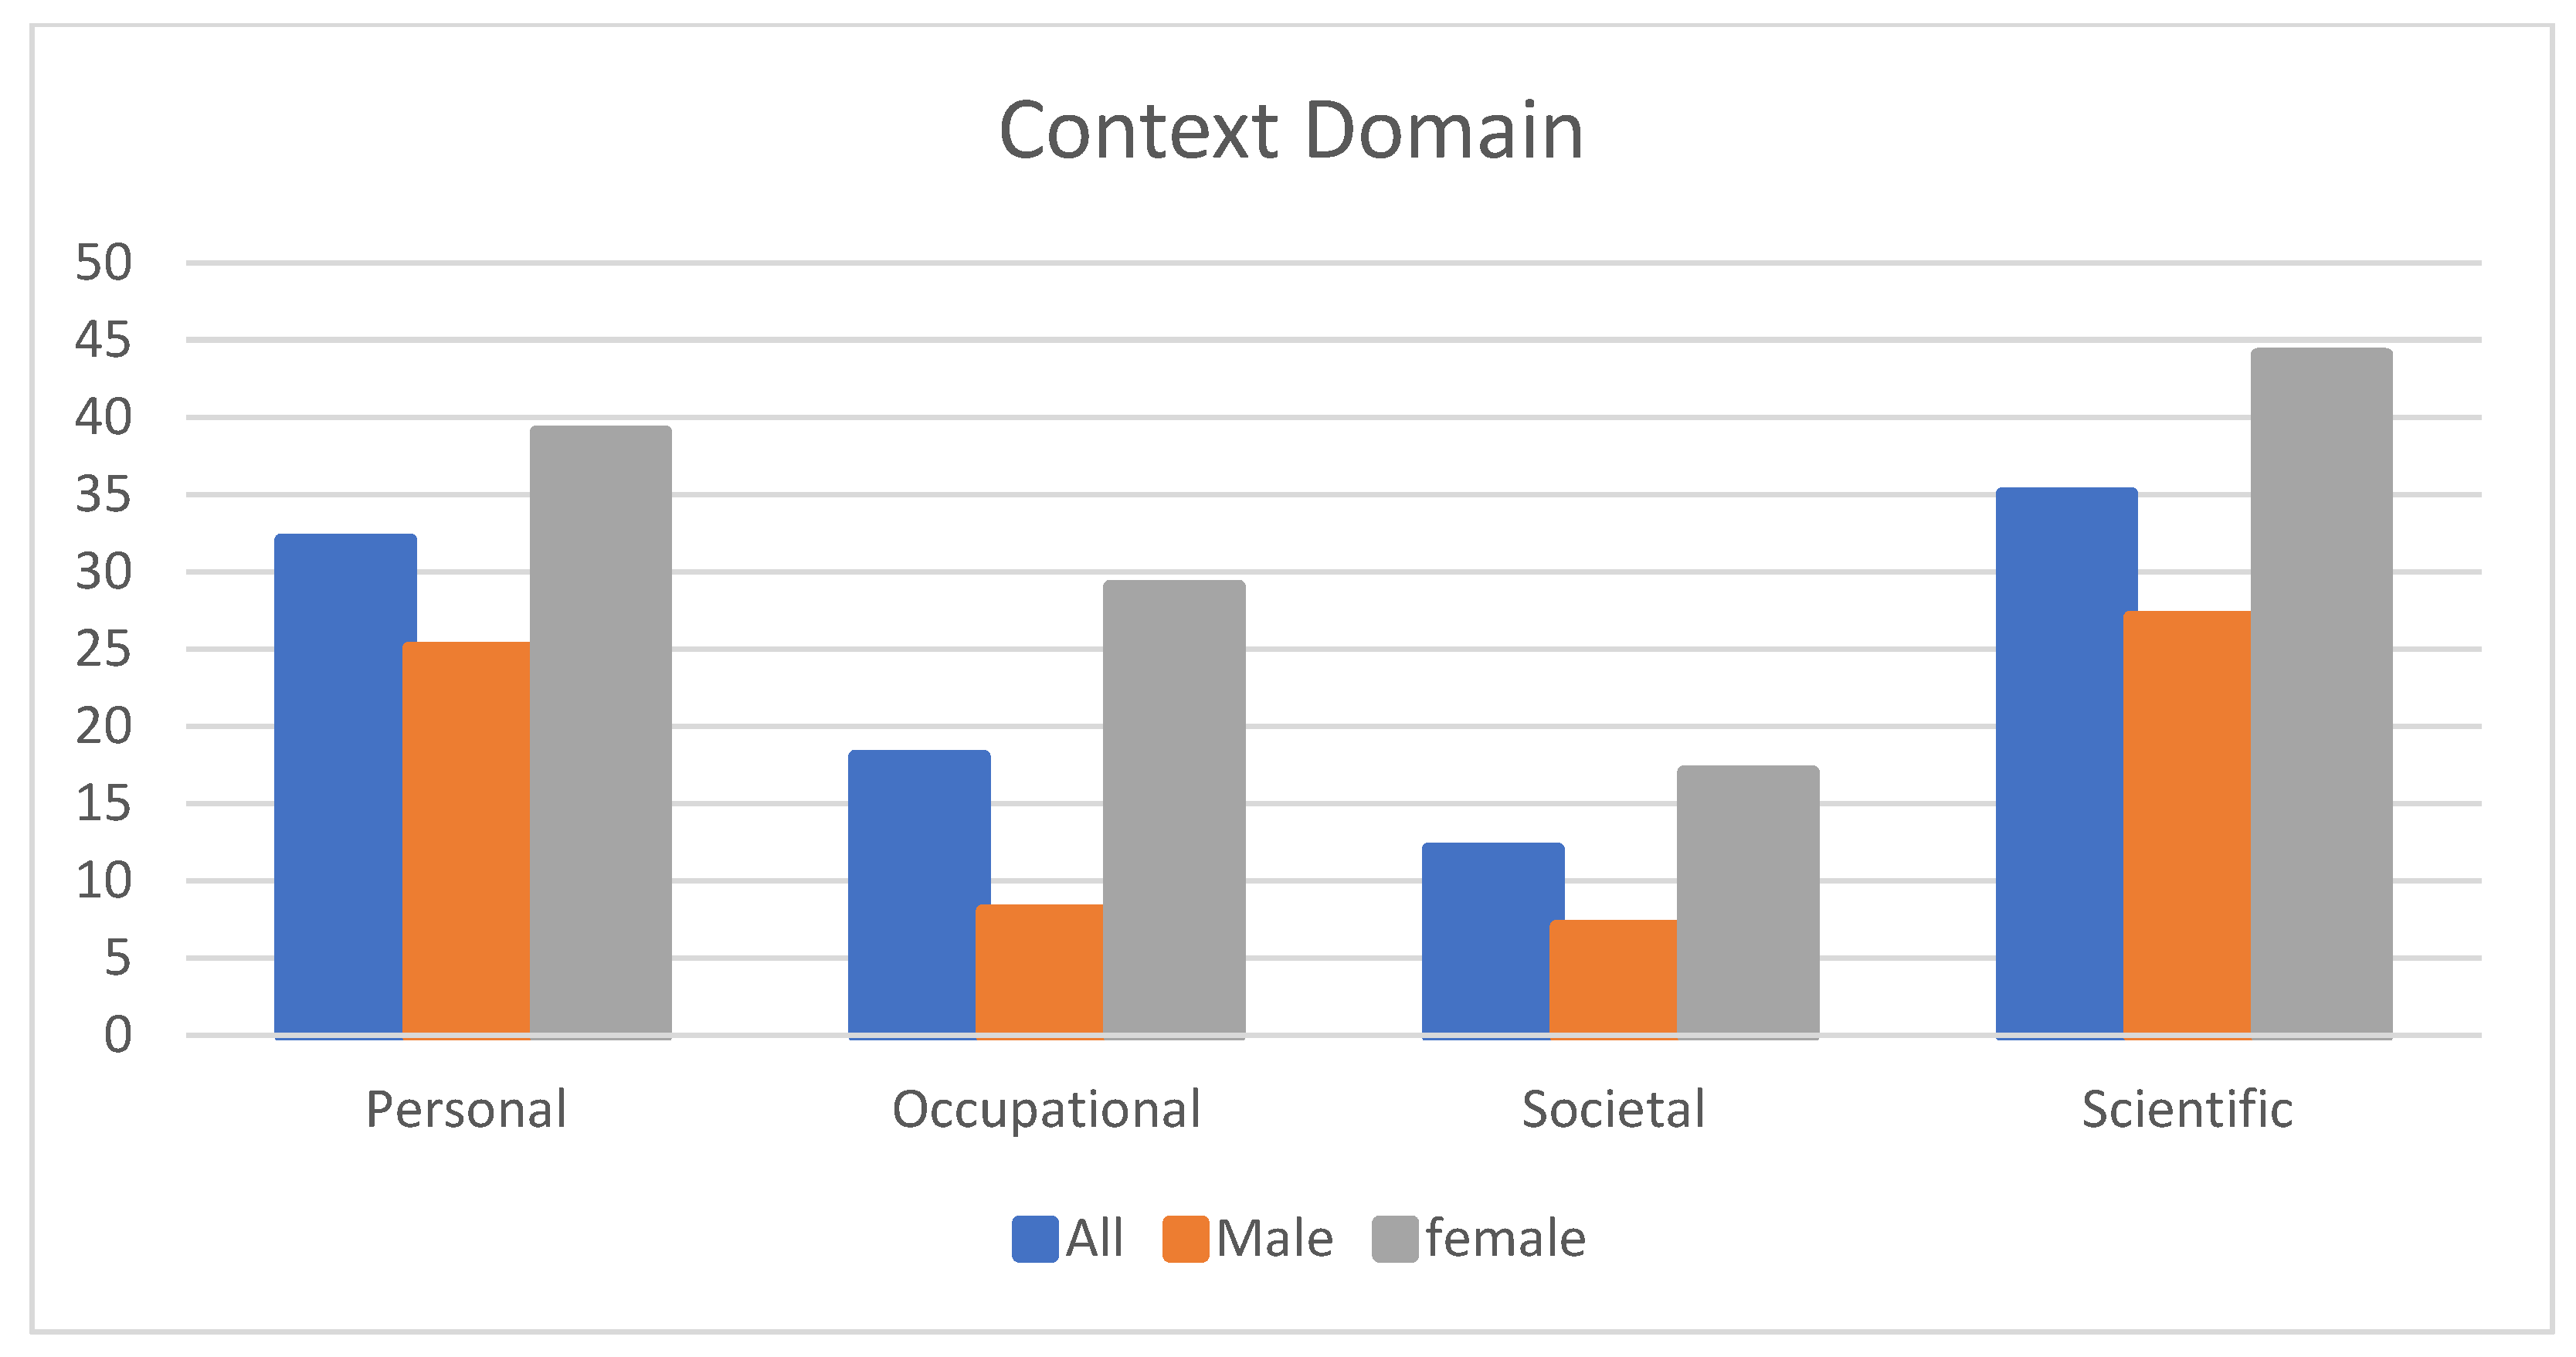
Figure 6 shows that the percentages of accurate responses in three of the process subdomains were both very close and low at 16%, 21%, and 14% for formulating, employing, and reasoning, respectively; in contrast, the proportion of correct answers in the interpret subdomain was 67%. The reasoning skill was moved to the core of the modeling cycle in the ML 2021 framework and is included in the process domain. Both male and female pupils continued to surpass their male counterparts. Figure 7 depicts the percentages of correct responses for ML questions in the context domain.
Surprisingly, for each of the four contexts, the percentage of correct responses was less than 35%, although for the personal, vocational, scientific, and societal subdomains of context these were 32%, 18%, 12%, and 35%, respectively. Female students continued to outperform male students in the context domain, as in all preceding ML subdomains.
To have a better understanding of the differences in performance between male and female students, an independent t-test was used to determine if there was a substantial difference in MLT scores between male and female students. The t-test findings are provided in Table 9 below.
Table 9 reveals a statistically significant difference in ML achievement between male (M = 5.53, SD = 2.32) and female (M = 10.47, SD = 3.89) students; t (202) = 11.109. These findings show that female students performed better on the MLT than male pupils.
6. Discussion
The findings of this study revealed that there is a considerable disparity in achievement between male and female students. Female pupils surpassed their male counterparts in terms of ML. This is in line with the UAE’s PISA 2018 findings, which showed that female students scored nine points higher than males. Male students in OECD countries, on the other hand, scored five points higher than females (OECD 2019). The findings of Edo et al. (2013) are comparable to those of this study concerning secondary school students’ difficulty in solving PISA tasks at levels 5–6. Their findings demonstrated that students struggled mathematically to formulate scenarios and assess the appropriateness of a mathematical solution in the context of a real-world problem.
Despite problem-solving being only one of the process standards for the NCTM, it is a critical component of understanding mathematics. Thus, understanding the strengths and limitations of student thinking requires a close examination of their processes. For example, the results of Dewantara et al. (2015) showed that students could produce and assess PISA-like issues. The study focused on the three mathematical processes employed in the modeling cycle: formulate, employ, and interpret. The findings revealed that students performed better in interpreting problems than in employing and formulating. The findings of our study are consistent with those of others (Dewantara et al. 2015; Edo et al. 2013; Putri and Zulkardi 2020), in that interpretation tasks accounted for a higher percentage of students’ accomplishment than employing and formulating. Females surpassed males in each of the modeling processes (formulate, utilize, and interpret) as well as the reasoning that has been introduced to the PISA 2021 mathematical literacy framework; these findings are consistent with the results of PISA 2018 for the UAE (OECD 2018a).
Change and relationship, space and forms, quantity, and uncertainty were the four key curriculum areas in which the pupils were tested. The best performance was in problems that covered the uncertainty content area, while the worst performance was for change and relationship. Putri and Zulkardi (2020) conducted comparable studies on uncertainty and data and found similar results. The four settings (personal, occupational, societal, and scientific) represent the diverse variety of scenarios in which people can encounter mathematical opportunities. In this study, students were most successful in dealing with personal issues.
A closer examination of the findings revealed a concern: the majority of the pupils failed the test (earning half of the total score), which is unsatisfactory. According to the findings of Depaepe et al. (2010), some students merely select numbers from the text and perform operations without understanding, and they continue to conceive of word problems as an exercise without considering the real constraints. The “suspension of sense-making,” or the mentality of seeking answers, is viewed as a severe obstacle in mathematics teaching (Schoenfeld 1991, 1992). Furthermore, because they primarily try hardest at the formal tests, the students’ scores may reflect the test culture that exists among them.
7. Conclusions
The students’ overall performance was in the very low category. In every area of mathematical literacy, female students performed better than males. This gender gap is consistent with the UAE’s 2018 results but contradicts the OECD results. The highest percentage achieved in the modelling process was for tasks of interpreting, employing, and formulating, respectively. The results showed students’ best performance was with uncertainty content area problems, while it was worst for change and relationship problems. Regarding the context of the mathematical problems, students were more successful in solving the context of personal mathematical problems than in the context of occupational, societal, or scientific problems.
8. Limitations
This study was conducted in Al Ain city and was limited to collecting students’ responses via survey. Students solved real-world math problems using previously released PISA items. The study was also restricted to 10th graders as most 15-year-olds are in this grade. In addition, the study was limited to the advanced track due to the study objective of evaluating high achievers’ mathematical literacy.
Implications and Future Research
According to the findings of this study, our existing educational system is failing our pupils in all facets of ML. One reason for the poor PISA scores is that pupils have not been taught how to solve contextual problems (Novita and Putra 2016). Their assessment should thus be rewritten to include comparable thinking. Furthermore, the poor level of student performance may motivate teachers to focus on the quality and manner of student evaluation. It is likely that the grade-level accomplishment test is too simple for the student, with insufficient items of adequate complexity, and that the result does not reflect their genuine level of knowledge (Rotigel and Fello 2004; Verschaffel et al. 2000). Students’ grasp of formal mathematical concepts may derive from problem-solving experience or contextual problems that rely on settings outside of mathematics, according to Freudenthal (1991). Teachers should place a greater emphasis on relating mathematics to real-world problems because this improves students’ comprehension and motivation to learn mathematics (Freudenthal 1991). According to the findings of the OECD (2019), pupils can only address problems that involve a low level of thinking and are limited to knowledge and application. When mathematical thinking (reasoning) and problem-solving are encouraged and enriched, this typically leads to the development of cognitive processes usually associated with higher levels of chronological schooling (OECD 2010a). As a result, providing an enrichment program for high achievers and even gifted children to ensure that prospective students can engage in a high level of mathematical problem solving and reasoning will help them enhance their mathematical level (Gainsburg 2008). This is of special interest because UAE teachers are skeptical of the usefulness, if any, of gifted programs in their schools (Jarrah and Almarashdi 2019). Students must also have a high degree of enthusiasm, ability, and willingness to take on challenges to participate in the study of science, technology, engineering, and mathematics (STEM) topics (Wang and Degol 2016).
The fundamental criteria for learning should be critical thinking, problem-solving, and conceptual understanding. Furthermore, educational tactics such as problem-solving processes and reasoning should be given more attention, with a focus on relating mathematics to real-life situations. The PISA is a welcome intervention for both educators and students in this regard, as it will not only make our education more relevant for today’s world but will also better our future.
Finally, the results of this research provide novel and important insights about students’ ML skills in the UAE; therefore, a follow-up study was conducted. Specifically, a proposed mathematics enrichment program was developed and administered with 10th grade students. The results obtained from the follow-up research indicate that it is possible to improve students’ ML through the implementation of mathematical enrichment programs based on the PISA framework (Almarashdi and Jarrah 2022).
Author Contributions
Conceptualization, H.S.A. and A.M.J.; methodology, H.S.A.; software, H.S.A.; validation, H.S.A. and A.M.J.; formal analysis, H.S.A.; investigation, H.S.A.; resources, H.S.A. and A.M.J.; data curation, H.S.A.; writing—original draft preparation, H.S.A.; writing—review and editing, A.M.J.; visualization, H.S.A.; supervision, A.M.J. All authors have read and agreed to the published version of the manuscript.
Funding
This research received no external funding.
Institutional Review Board Statement
Not applicable.
Informed Consent Statement
Informed consent was obtained from all subjects involved in the study.
Data Availability Statement
The data for this study are not publicly available but can be made available upon request to authors.
Conflicts of Interest
The authors declare no conflict of interest.
Appendix A
Sample of mathematical literacy test problems specifying the problems’ proficiency level, process, content, and context.
- FERRIS WHEEL
A giant Ferris wheel is on the bank of a river. See the picture and diagram below.
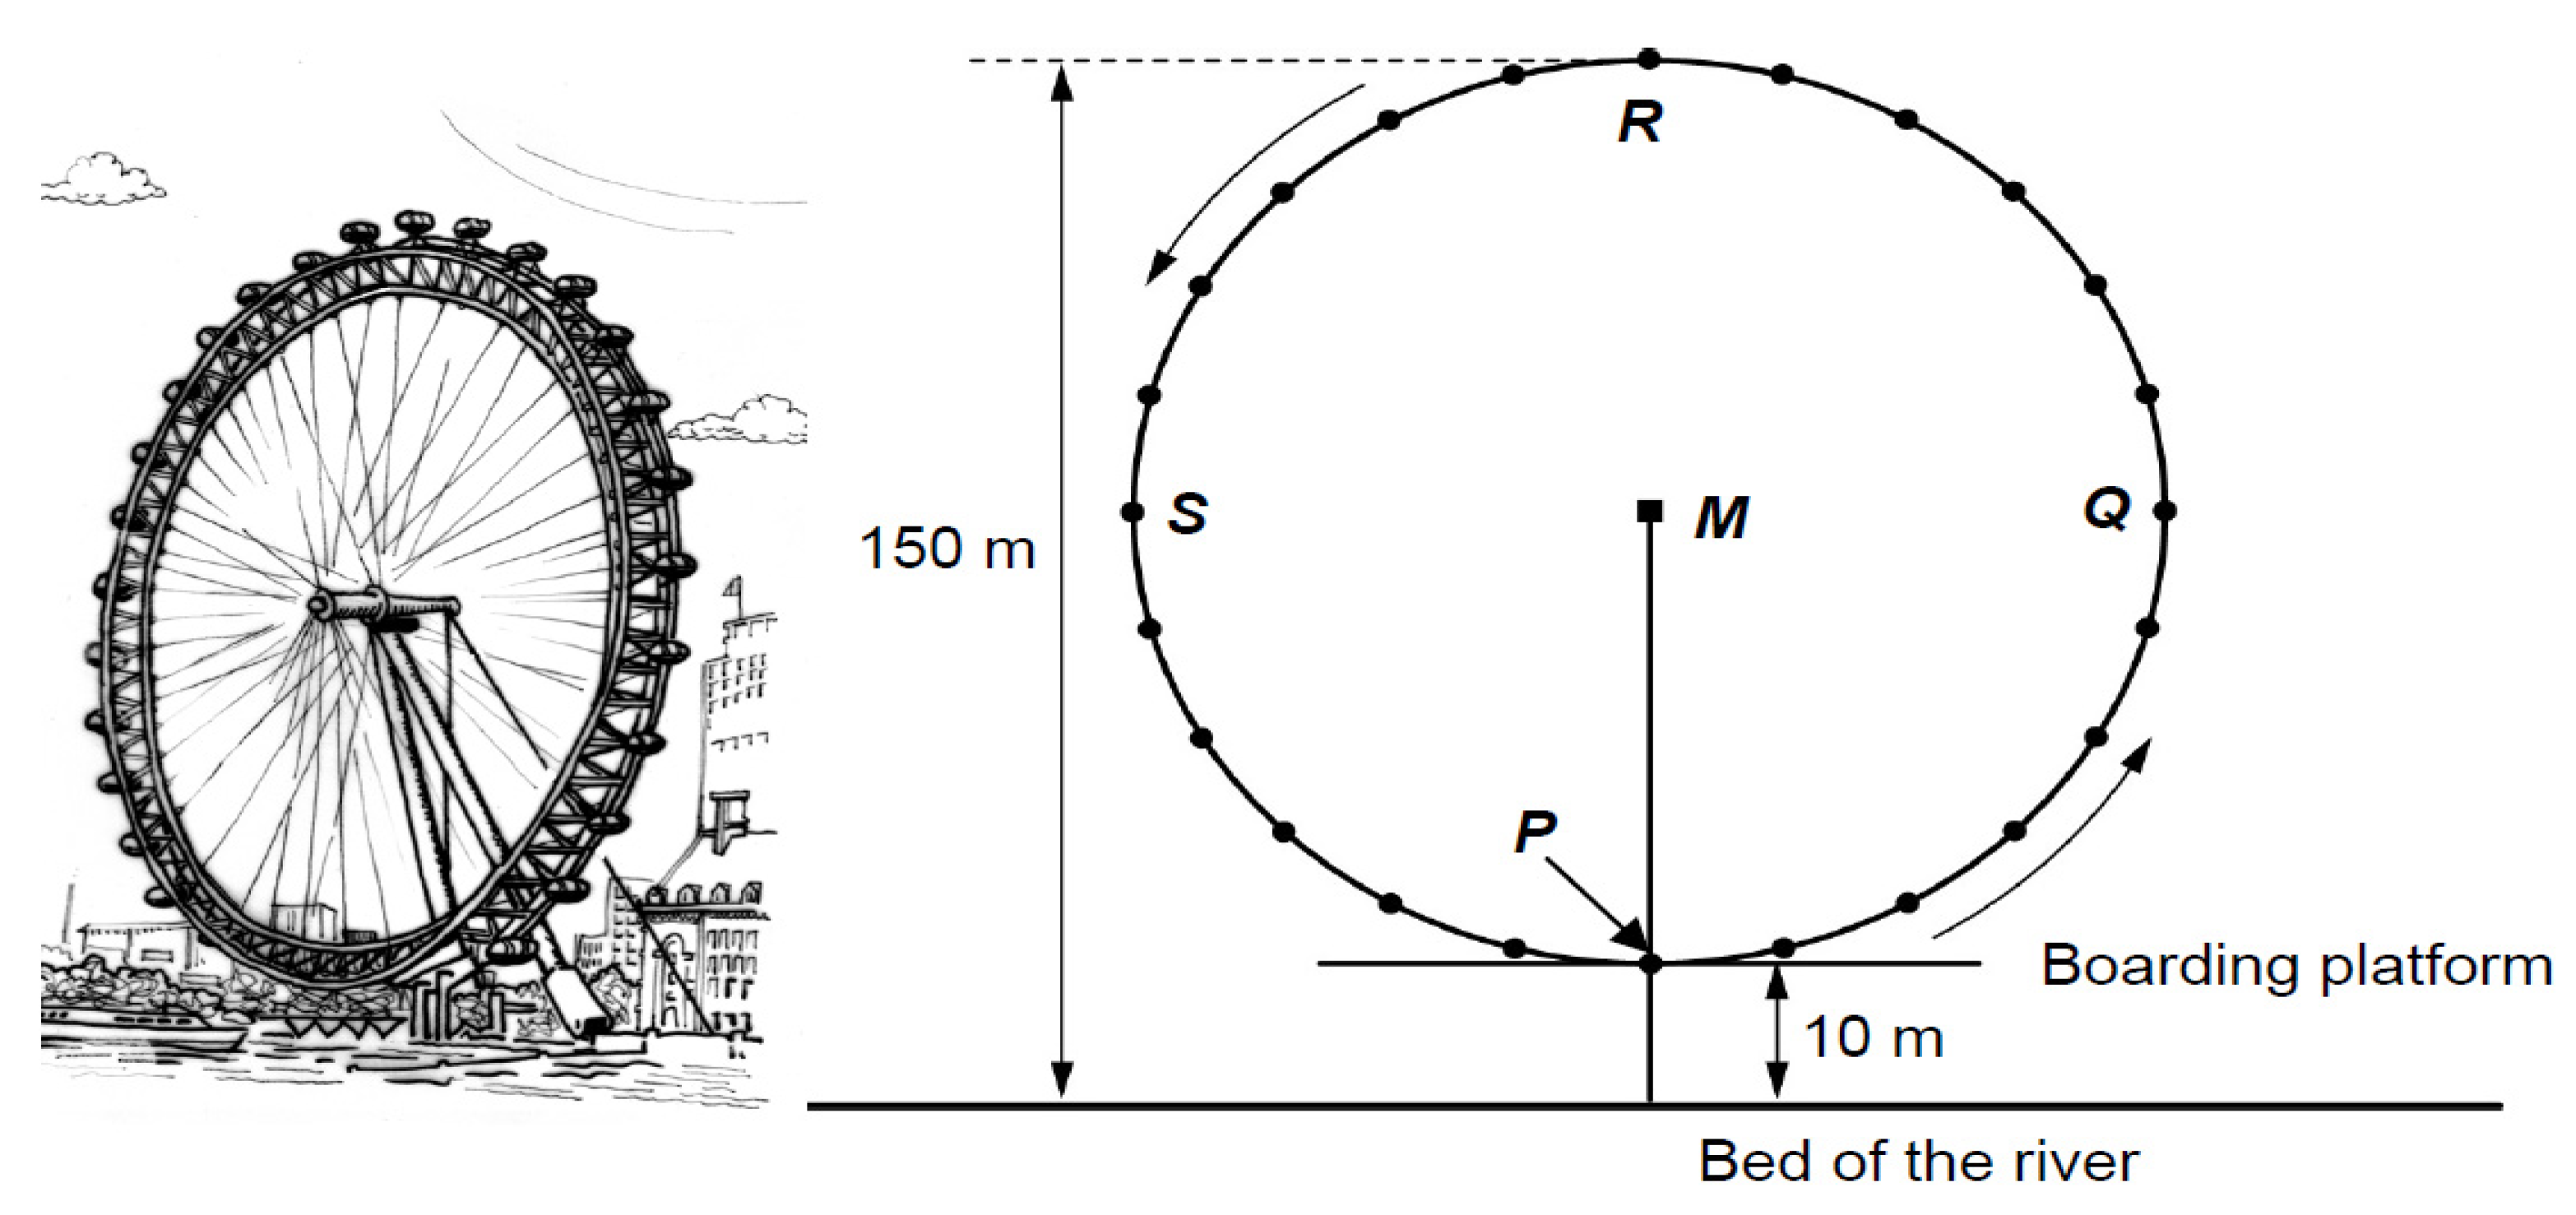
The Ferris wheel has an external diameter of 140 m and its highest point is 150 m above the bed of the river. It rotates in the direction shown by the arrows.
- Question 1: FERRIS WHEEL (proficiency level: 4, process: employ, content: space and shapes, context: societal)
- The letter M in the diagram indicates the center of the wheel.
- How many meters (m) above the bed of the river is point M?
- Answer: ………………………………… m
- Question 2: FERRIS WHEEL (proficiency level: 3, process: formulate, content: space and shapes, context: societal)
- The Ferris wheel rotates at a constant speed. The wheel makes one full rotation in exactly 40 min.
- John starts his ride on the Ferris wheel at the boarding point, P.
- Where will John be after half an hour?
- (A)
- At R
- (B)
- Between R and S
- (C)
- At S
- (D)
- Between S and P
References
- Almarashdi, Hanan Shaher, and Adeeb M. Jarrah. 2022. The Impact of a Proposed Mathematics Enrichment Program on UAE Students’ Mathematical Literacy Based on the PISA Framework. Sustainability 14: 11259. [Google Scholar] [CrossRef]
- Depaepe, Fien, Erik De Corte, and Lieven Verschaffel. 2010. Teachers’ approaches towards word problem solving: Elaborating or restricting the problem context. Teaching and Teacher Education 26: 152–60. [Google Scholar] [CrossRef]
- Dewantara, Andi Harpeni, Zulkardi Zulkardi, and Darmawijoyo Darmawijoyo. 2015. Assessing seventh graders’ mathematical literacy in solving PISA-like tasks. Journal on Mathematics Education 6: 117–28. [Google Scholar] [CrossRef]
- Ebel, Robert, and David Frisbie. 1991. Essentials of Educational Measurement, 5th ed. Englewood Cliffs: Prentice-Hall. [Google Scholar]
- Edo, Sri Imelda, Yusuf Hartono, and Ratu Ilma Indra Putri. 2013. Investigating Secondary School Students’ Difficulties in Modeling Problems PISA-Model Level 5 And 6. Journal on Mathematics Education 4. [Google Scholar] [CrossRef]
- Freudenthal, Hans. 1991. Revisiting Mathematics Education: China Lectures. Dordrecht: Kluwer Academic Publishers. [Google Scholar]
- Gainsburg, Julie. 2008. Real-world connections in secondary mathematics teaching. Journal of Mathematics Teacher Education 11: 199–219. [Google Scholar] [CrossRef]
- Gellert, Uwe, and Eva Jablonka. 2007. Mathematisation and Demathematisation. Rotterdam: Sense Publishers. [Google Scholar]
- Gruber, Howard E., and J. Jacques Vonèche, eds. 1977. The Essential Piaget. New York: Basic Books. [Google Scholar]
- Hiebert, James, and James Stigler. 2004. Improving Mathematics Teaching. Educational Leadership 61: 12–17. [Google Scholar]
- Jarrah, Adeeb, and Hanan Shaher Almarashdi. 2019. Mathematics teacher perceptions toward teaching gifted and talented learners in general education classrooms in the UAE. Journal for the Education of Gifted Young Scientists, 835–47. [Google Scholar] [CrossRef] [Green Version]
- National Council of Teachers of Mathematics. 2008. Principles and Standards for School Mathematics. Reston: National Council of Teachers of Mathematics. [Google Scholar]
- Novita, Rita, and Mulia Putra. 2016. Using task like PISA’s problem to support student’s creativity in Mathematics. Journal on Mathematics Education 7. [Google Scholar] [CrossRef] [Green Version]
- OECD. 2004. The PISA 2003 Assessment Framework: Mathematics, Readings, Science, and Problem-Solving Knowledge and Skills. Paris: OECD Publishing. [Google Scholar]
- OECD. 2010a. Learning Mathematics for Life: A Perspective from PISA. Paris: OECD Publishing. [Google Scholar] [CrossRef]
- OECD. 2010b. PISA 2009 Assessment Framework Key Competencies in Reading, Mathematics, and Science. Paris: OECD Publishing. [Google Scholar] [CrossRef]
- OECD. 2013. PISA 2012 Results: What Students Know and Can Do (Volume I). Paris: OECD Publishing. [Google Scholar] [CrossRef]
- OECD. 2014. PISA 2012 Technical Report. Paris: Organization for Economic Co-Operation and Development (OECD). [Google Scholar]
- OECD. 2018a. PISA 2021 Mathematics Framework (First Draft). Available online: https://www.mokykla2030.lt/wp-content/uploads/2018/12/GB-2018-4-PISA-2021-Mathematics-Framework-First-Draft.pdf (accessed on 3 December 2022).
- OECD. 2018b. PISA 2021 Mathematics Framework (Draft). Available online: http://www.oecd.org/pisa/pisaproducts/pisa-2021-mathematics-framework-draft.pdf (accessed on 3 December 2022).
- OECD. 2019. PISA 2018 Results (Volume I): What Students Know and Can Do. Paris: OECD Publishing. [Google Scholar] [CrossRef]
- OECD. 2020. “FAQ”. Available online: http://www.oecd.org/pisa/pisafaq/ (accessed on 4 February 2022).
- Putri, Ratu Ilma Indra, and Zulkardi Zulkardi. 2020. Designing Pisa-Like Mathematics Task Using Asian Games Context. Journal on Mathematics Education 11: 135–44. [Google Scholar] [CrossRef]
- Reinke, Like T. 2019. Contextual problems as conceptual anchors: An illustrative case. Research in Mathematics Education 22: 3–21. [Google Scholar] [CrossRef]
- Rotigel, Jennifer V., and Susan Fello. 2004. Mathematically Gifted Students: How Can We Meet Their Needs? Gifted Child Today 27: 46–51. [Google Scholar] [CrossRef]
- Schoenfeld, Alan H. 1991. On mathematics as sense-making: An informal attack on the unfortunate divorce of formal and informal mathematics. In Informal Reasoning and Education. Edited by David Perkins, James F. Voss and Judith W. Segal. Hillsdale: Lawrence Erlbaum, pp. 311–43. [Google Scholar]
- Schoenfeld, Alan H. 1992. Learning to think mathematically: Problem-solving, metacognition, and sense-making in mathematics. In Handbook of Research on Mathematics Teaching and Learning. Edited by Douglas A. Grouws. New York: McMillan, pp. 334–70. [Google Scholar]
- Stacey, Kaye, and Ross Turner. 2015. The evolution and key concepts of the PISA mathematics frameworks. In Assessing Mathematical Literacy: The PISA Experience. Edited by Kaye Stacey and Ross Turner. New York: Springer, pp. 5–34. [Google Scholar]
- UAE. 2021. National Agenda—The Official Portal of the UAE Government. Available online: https://u.ae/en/about-the-uae/strategies-initiatives-and-awards/federal-governments-strategies-and-plans/national-agenda#:~:text=The%20National%20Key%20Performance%20Indicators (accessed on 12 March 2021).
- Verschaffel, Lieven, Brian Greer, and Eric De Corte. 2000. Making Sense of Word Problems. Lisse: Swets & Zeitlinger. [Google Scholar]
- Wang, Ming-Te, and Jessica L. Degol. 2016. Gender Gap in Science, Technology, Engineering, and Mathematics (STEM): Current Knowledge, Implications for Practice, Policy, and Future Directions. Educational Psychology Review 29: 119–40. [Google Scholar] [CrossRef] [PubMed]
Figure 1.
ML of PISA2021 framework (OECD 2018a).
Figure 1.
ML of PISA2021 framework (OECD 2018a).

Figure 2.
The mathematical modeling cycle of the PISA 2012 framework.

Figure 3.
The mathematical modeling cycle of the PISA 2021 framework (OECD 2018a).
Figure 3.
The mathematical modeling cycle of the PISA 2021 framework (OECD 2018a).
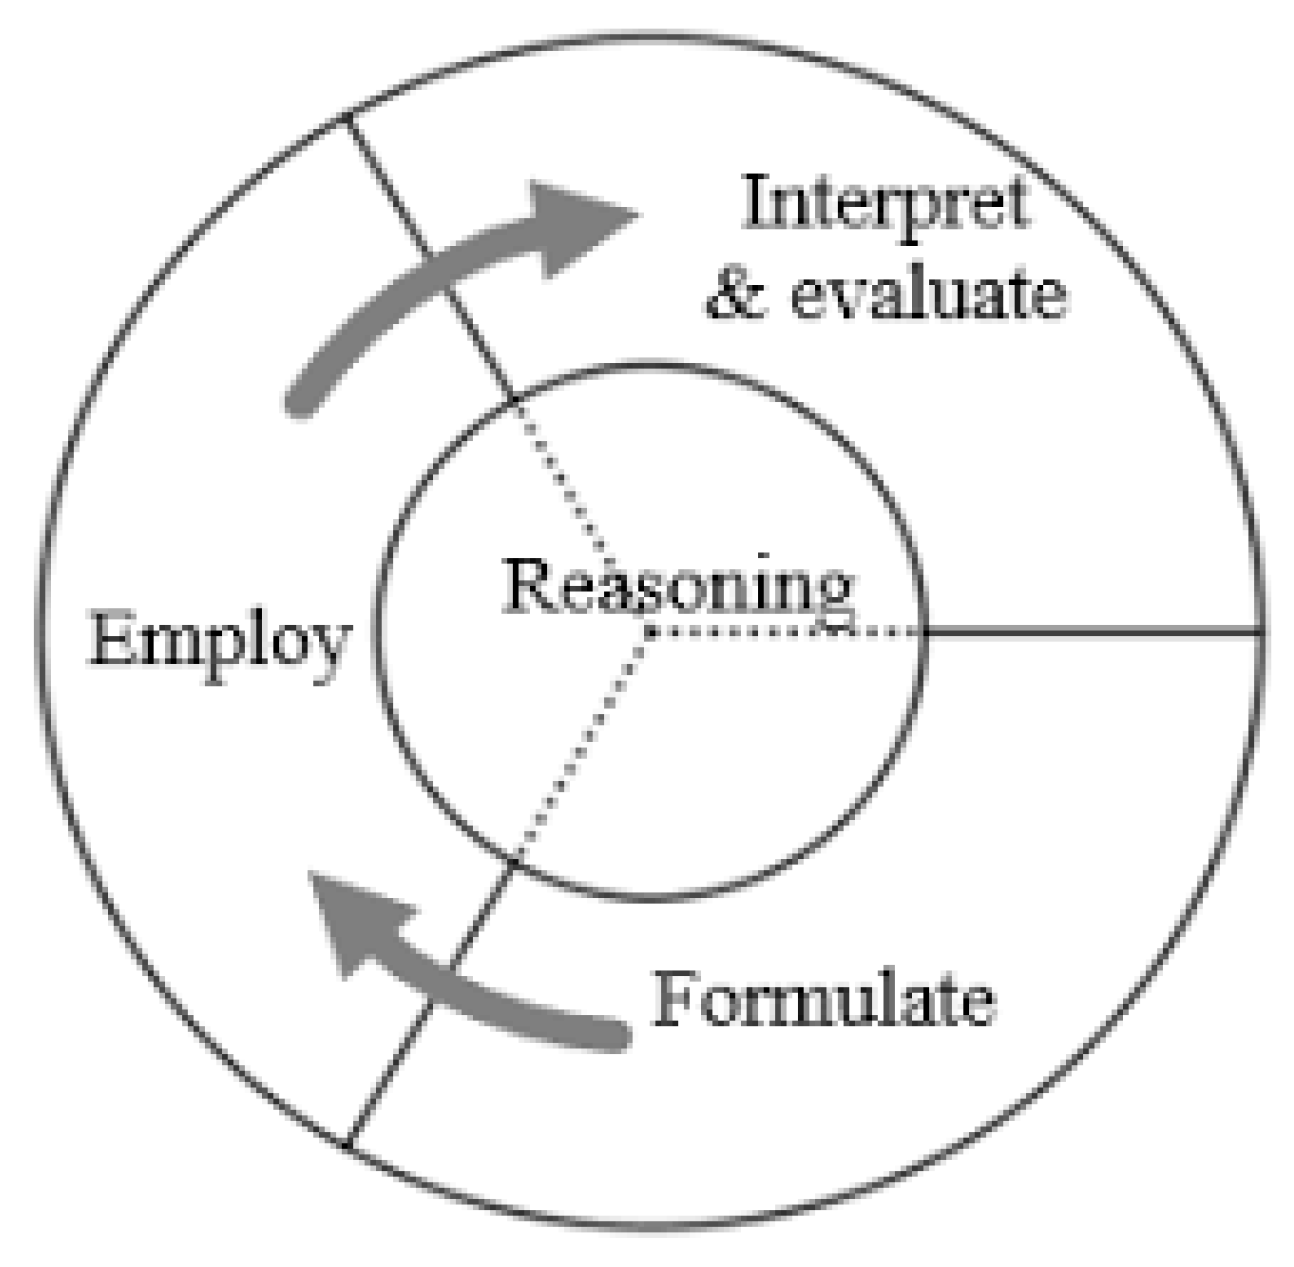
Figure 4.
Percentage of correct answers of ML proficiency levels.

Figure 5.
Percentage of correct answers of ML content domain.

Figure 6.
Percentage of correct answers of ML process domain.

Figure 7.
Percentage of correct ML answers for the context domain.

Table 1.
Percentage of low achievers and high achievers in mathematics in the UAE.
| PISA 2009 | PISA 2012 | PISA 2015 | PISA 2018 | ||||
|---|---|---|---|---|---|---|---|
| Below Level 2 | Level 5 and 6 | Below Level 2 | Level 5 and 6 | Below Level 2 | Level 5 and 6 | Below Level 2 | Level 5 and 6 |
| 51.3% | 2.9% | 46.3% | 3.5% | 48.7% | 3.7% | 45.5% | 5.4% |
Table 2.
Distribution of Participants.
| Frequency | Percentage % | ||
|---|---|---|---|
| Age (years) | 14 | 19 | 9% |
| 15 | 144 | 71% | |
| 16 | 41 | 20% | |
| Total | 204 | 100% | |
| Gender | Male | 106 | 52% |
| Female | 98 | 48% | |
| Total | 204 | 100% |
Table 3.
Distribution of MLT items.
| Processes | No. | Contents | No. | Contexts | No. |
|---|---|---|---|---|---|
| Formulate | 8 | Quantity | 7 | Personal | 8 |
| Employ | 14 | Space and shape | 8 | Occupational | 4 |
| Interpret | 4 | Change and relationship | 7 | Scientific | 6 |
| Uncertainty | 4 | Societal | 8 | ||
| Total | 26 | Total | 26 | Total | 26 |
N.B. Reasoning was later added to the PISA 2021 framework of mathematical literacy.
Table 4.
Distribution of MLT items by level of proficiency.
| Level of Proficiency | No. of Items | Percentage % |
|---|---|---|
| Level 1 and below | 4 | 15% |
| Level 2 | 3 | 12% |
| Level 3 | 7 | 27% |
| Level 4 | 5 | 19% |
| Level 5 | 4 | 15% |
| Level 6 | 3 | 12% |
| Total | 26 | 100% |
Table 5.
Criteria score ability mathematical problem-solving model students in PISA.
| Score Interval | Criterion |
|---|---|
| X > + 1.5 SDx | Very High |
| + 0.5 SDx < X ≤ +1.5 SDx | High |
| − 0.5 SDx < X ≤ + 0.5 SDx | Average |
| − 1.5 SDx < X ≤ − 0.5 SDx | Low |
| X ≤ − 1.5 SDx | Very Low |
Table 6.
Data description of student problem-solving skills.
| Description | Score | ||
|---|---|---|---|
| All | Male | Female | |
| Mean | 7.90 | 5.53 | 10.47 |
| Standard Deviation | 4.02 | 2.23 | 3.89 |
| Maximum Score | 20 | 11 | 20 |
| Minimum Score | 2 | 2 | 5 |
| No. of Students | 204 | 106 | 98 |
Table 7.
Classification of students’ categories.
| Score Interval | Criterion | All | Male | Female | |||
|---|---|---|---|---|---|---|---|
| F | % | F | % | F | % | ||
| X < 25.5 | Very High | 0 | 0% | 0 | 0% | 0 | 0% |
| 19.83 < X ≤ 25.5 | High | 2 | 1% | 0 | 0% | 2 | 2% |
| 14.16 < X ≤ 19.83 | Average | 14 | 7% | 0 | 0% | 14 | 14% |
| 8.5 < X ≤ 14.16 | Low | 62 | 30% | 12 | 11% | 50 | 51% |
| X ≤ 8.5 | Very Low | 126 | 62% | 94 | 89% | 32 | 33% |
| 204 | 100% | 106 | 100% | 98 | 100% | ||
Table 8.
Student performance in ML subdomains.
| Domain | Sub Domain (No. of Items) | Average | Standard Deviation | Max. Score | Category |
|---|---|---|---|---|---|
| Proficiency Levels | Level 1 (4) | 2.65 | 1.16 | 4 | High |
| Level 2 (3) | 1.58 | 0.95 | 3 | Average | |
| Level 3 (7) | 1.84 | 1.37 | 6 | Low | |
| Level 4 (5) | 0.46 | 0.74 | 3 | V. Low | |
| Level 5 (4) | 0.21 | 0.53 | 3 | V. Low | |
| Level 6 (3) | 0.06 | 0.31 | 2 | V. Low | |
| Content | Quantity (7) | 1.79 | 1.28 | 6 | Low |
| Change and relationship (7) | 1.02 | 0.91 | 4 | V. Low | |
| Space and shape (8) | 1.30 | 1.07 | 4 | V. Low | |
| Uncertainty and data (4) | 2.67 | 1.20 | 4 | High | |
| Process | Formulation (8) | 1.25 | 1.19 | 6 | V. Low |
| Employing (14) | 2.89 | 1.85 | 10 | V. Low | |
| Interpreting (4) | 2.67 | 1.20 | 4 | High | |
| Reasoning (8) | 1.11 | 0.97 | 4 | V. Low | |
| Context | Personal (8) | 2.54 | 1.39 | 6 | Low |
| Occupational (4) | 0.73 | 0.76 | 3 | V. Low | |
| Societal (8) | 2.82 | 1.43 | 4 | Low | |
| Scientific (6) | 0.71 | 0.97 | 6 | V. Low |
Table 9.
Comparison of male and female students’ performance in MLT.
| Variable | Male (n = 106) | Female (n = 98) | t | Df | P | ||
|---|---|---|---|---|---|---|---|
| M | SD | M | SD | ||||
| MLT results | 5.53 | 2.32 | 10.47 | 3.89 | 11.109 | 202 | 0.00 |
Disclaimer/Publisher’s Note: The statements, opinions and data contained in all publications are solely those of the individual author(s) and contributor(s) and not of MDPI and/or the editor(s). MDPI and/or the editor(s) disclaim responsibility for any injury to people or property resulting from any ideas, methods, instructions or products referred to in the content. |
© 2023 by the authors. Licensee MDPI, Basel, Switzerland. This article is an open access article distributed under the terms and conditions of the Creative Commons Attribution (CC BY) license (https://creativecommons.org/licenses/by/4.0/).
Share and Cite
MDPI and ACS Style
Almarashdi, H.S.; Jarrah, A.M. Assessing Tenth-Grade Students’ Mathematical Literacy Skills in Solving PISA Problems. Soc. Sci. 2023, 12, 33. https://doi.org/10.3390/socsci12010033
AMA Style
Almarashdi HS, Jarrah AM. Assessing Tenth-Grade Students’ Mathematical Literacy Skills in Solving PISA Problems. Social Sciences. 2023; 12(1):33. https://doi.org/10.3390/socsci12010033
Chicago/Turabian StyleAlmarashdi, Hanan Shaher, and Adeeb M. Jarrah. 2023. "Assessing Tenth-Grade Students’ Mathematical Literacy Skills in Solving PISA Problems" Social Sciences 12, no. 1: 33. https://doi.org/10.3390/socsci12010033
Note that from the first issue of 2016, this journal uses article numbers instead of page numbers. See further details here.