Remittance and Macroeconomic Performance in Top Migrating Countries


1
Imperial College Business School, London SW7 2AZ, UK
2
Centre for Econometrics and Applied Research, University of Ibadan, Ibadan 200285, Nigeria
3
Department of Economics, Fountain University, Osogbo 230284, Nigeria
*
Author to whom correspondence should be addressed.
Soc. Sci. 2024, 13(5), 239; https://doi.org/10.3390/socsci13050239
Submission received: 19 February 2024
/
Revised: 4 April 2024
/
Accepted: 12 April 2024
/
Published: 26 April 2024
(This article belongs to the Section International Migration)
Abstract
:Globalization opens up economies and encourages the free movement of persons and factors of production. Diaspora investors and workers earn income in the process and make remittances to the migrating countries. We examine the impact of the remittance inflow on the macroeconomic performance of top emigrating countries, which comprise nine emerging and two advanced economies. We conduct group and individual country analyses with distinct econometric models (Feasible Quasi Generalized Least Squares and Dynamic Common Correlated Effects) using data between 1987 and 2021. The results reveal positive impact of remittance inflows on nominal GDP and nominal GDP per capita and on real GDP and real GDP per capita, although evidence on the latter is weaker. In all, the emigrating countries can benefit from diaspora remittance in terms of improved productivity and macroeconomic performance. We therefore recommend better systems to facilitate remittance receipt and policies to channel such flows more into investment activities.
1. Introduction
People migrate from one destination to another to improve their living standards and those of their families in their home countries in the form of remittances. Remittances are items or financial instruments that migrants who are living and working abroad transfer to their families in their home countries. According to some scholars, remittances are important because of their impacts on improving the balance of payment position and living standard conditions in the recipient countries (Ratha 2003; Datta and Sarkar 2014; Kannan and Hari 2020; Qutb 2022; Oyadeyi and Akinbobola 2022; Oyadeyi 2023a). For at least the past three decades, migrant remittances have been regarded as an essential tool for economic development due to their effect on the recipient countries to encourage investments, boost consumption, speed up production and job creation, and indirectly boost the income of families who do not receive remittances (Taylor 1999; Aggarwal et al. 2006; Lucas 2006, 2008; Qutb 2022; Oyadeyi 2023b, 2023c). According to Kamuleta (2014) and Qutb (2022), remittance capital flows have outperformed foreign portfolio investments and private debt flows in recent times. In fact, global remittances continued to grow even during the financial crisis, the COVID-19 pandemic, and other economic downturn events. The foregoing represent reasons why the study of global remittances continues to receive attention among scholars.
There are empirical and policy motivations to further study the role of remittance flows, although the present study examines its impact on several macroeconomic performance indicators. This derives from the attraction of remittances as a tool for macroeconomic development, which needs to be substantiated with empirical investigation. In 2020, global remittance reached roughly USD 1.1 trillion, about 0.79 percent as a percentage of global gross domestic product (GDP) (World Development Indicator 2023). According to the World Population Review (2023), global migration reached over 315 million people in 2020, and most of the migrants are from developing to advanced nations, where remittances constitute about 27 percent of the GDP of the former countries (Meyer and Shera 2017). In other words, as the relationship between global migration and remittances strengthens, it interestingly becomes more crucial to consider the macroeconomic effects of remittances in order to inform policymakers in the nations where migration is most prevalent. The topic under discussion here offers compelling justification for further research into the relationship between remittances and macroeconomic performance, with a focus on the top migrating nations (those most adversely affected by emigration). In essence, this study can be insightful and assist decision-makers in creating the best possible policies to transform the economic potential of migrant remittances into a dependable source of capital that produces steady economic growth.
The present study makes contributions to an emerging area of research given that the debate on the macroeconomic effect of remittance flows still rages on. For instance, some studies find roles for remittance inflows to improve production, consumption, investments, income distribution, savings, and poverty reduction in recipient countries (Haas 2005; Carling 2008; Anyanwu and Erhijakpor 2010; Rao and Hassan 2012; Ustubici and Irdam 2012; Blouchoutzi and Nikas 2014; Dridi et al. 2019; Kannan and Hari 2020; Agyei 2021; Oyadeyi 2023d; Oyadeyi et al. 2024), while others opine that the impact of remittances on the recipient country can be ambiguous, as a rise in consumption brought about by an increase in migrant remittances may also have detrimental consequences on the recipient countries (World Bank Group 2006; Stojanov et al. 2019; Koczan et al. 2021; Bidawi et al. 2022). In the midst of these arguments, we re-examine the effects of remittances on the macroeconomic performance of top emigrating countries, given the following empirical contributions.
Therefore, the objective of this paper is to examine the effects of remittances on the macroeconomic performance of the selected countries, using both time-series and panel data approaches. This is because as the relationship between global migration and remittances strengthens, it interestingly becomes more crucial to consider the macroeconomic effects of remittances to inform policymakers in the nations where migration is most prevalent. Thus, this study focuses on the countries most affected by emigration and the effects of remittances on their economic performance. The rationale for undertaking this study is that it can be insightful and assist decision-makers in creating the best possible policies to transform the economic potential of migrant remittances into a dependable source of capital that produces steady economic growth. To reach this goal, the study uses the Feasible Quasi Generalized Least Square (FQGLS) and Dynamic Common Correlated Effects (DCCE) methods to find out how remittances affect the economies of the chosen countries. In essence, the study’s research hypothesis is to test whether an increased inflow of remittances positively affects a country’s macroeconomic performance.
The framework of the study involves estimating the models by selecting eleven out of twenty top emigrating countries (based on data availability) for the analyses of the research objective such that the scope of the study comprises nine (9) emerging countries (Bangladesh, China, India, Mexico, Pakistan, the Philippines, Indonesia, Myanmar, and Egypt) and two (2) advanced economies (Germany and the United Kingdom). The data were sourced based on the top twenty emigrating countries, according to the World Population Review (2023). From the country list, the handpicked countries were selected as a result of data availability for the sampled period. Our analyses consist of how remittance flows to these countries impact four various measures of macroeconomic performance, namely, nominal output (nominal GDP), real output (real GDP), nominal output per capita (GDP per capita), and real output per capita (real GDP per capita). These are explored over a collective study of the countries as panels and individual country analyses, using suitable panel data and time-series econometric data analysis techniques. In addition to the robustness checks mentioned above, different analyses of models with and without the role of the control variable and taking into account the macroeconomic environment of the countries being studied were also carried out. This was done to get rid of the effect of outliers. In all, these endeavors produce interesting findings that yield relevant policy prescriptions rendered in the concluding section.
The rest of the paper is designed as follows: Section 2 expands on the stylized facts on remittance and its nexus to macroeconomic performance, while Section 3 discusses the analytical approaches to achieving the objectives. Section 4 analyses and presents the results, while the final section concludes the paper with policy advice for consideration.
2. Stylized Facts
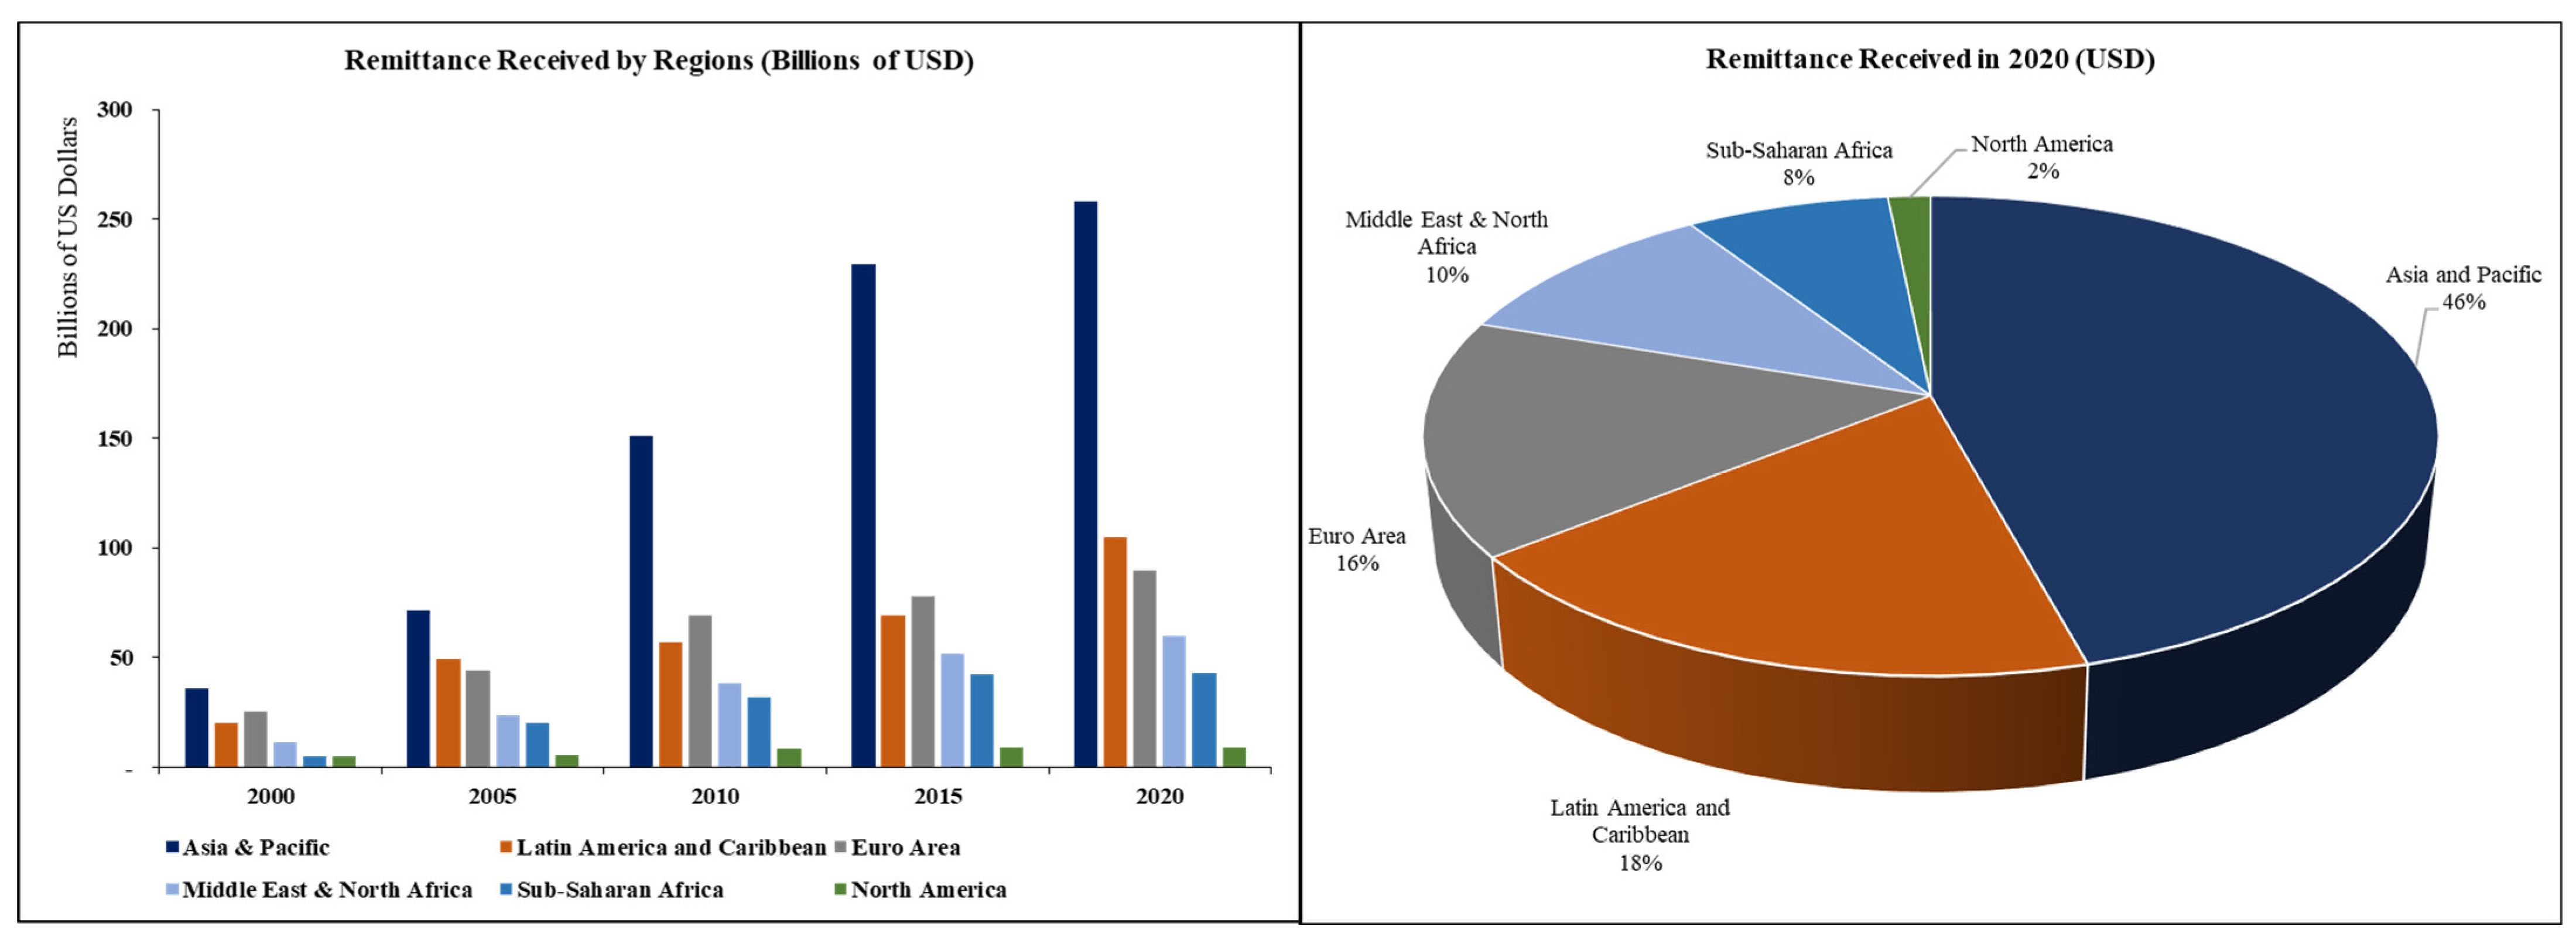
Remittance, as we know it, is a form of capital flow due to the movement of people among countries. Remittance payments grew steadily over the last 20 years in the period of focus in the study. The Asia and Pacific region received the most remittances during the period under investigation. They constitute roughly 46 percent of the total remittances received as of 2020. The region with the second biggest receipts of remittances is the Latin America and Caribbean region, which had roughly 18 percent of the total 2020 remittances. The charts also show that North America receives far fewer remittances globally, while Sub-Saharan Africa is not the greatest beneficiary of remittances when compared with other regions. These results point to the conclusion that the regions that are less developed, such as Asia, Latin America, and the Caribbean, and the combined Middle East and Sub-Saharan African region, receive more from global remittances than other regions (especially the advanced countries of Europe and America).
Figure 1 identifies the top countries where most migrants come from as of 2020. The chart showed that most migrants come from emerging markets and developing economies (EMDEs). The top EMDE countries people emigrate from include countries such as India, Mexico, China, the Philippines, Pakistan, and a host of others listed in Figure 1. People migrate to advanced economies due to the level of development and industrialization in these countries, to seek a better life and job opportunities and then remit some of the incomes they earn back to their families in their home country. According to the United Nations Department of Economic and Social Affairs, Population Division (UNDESA), some of the people in advanced countries migrate to destinations such as the United States (US), the United Kingdom (UK), France, Germany, Spain, Australia, and others (UNDESA 2020). Furthermore, the chart affirms that countries facing high levels of geopolitical risk, such as Pakistan, the Philippines, and Bangladesh, feature prominently in the list of countries people emigrate from. From the list, India had the highest number of emigrants and the highest number of emigrants per population. A reason for this may be due to their overpopulation as well as their high levels of poverty, which make their citizens leave the country to seek greener pastures. Mexicans also feature very high on the list, as 8.6 percent of their population migrated, mostly to the US. Many other countries, such as the Philippines, Myanmar, and the UK, also have high levels of emigrants per population. By location, the Asian region has the highest number of emigrants globally, as seven of the eleven countries examined come from that region, while two European countries (Germany and the UK), one North American country (Mexico), and one North African country (Egypt) feature prominently on the list of countries that were examined.
Figure 2 and Figure 3 present the remittance flows to the top emigrating countries across regions and across countries, respectively. Of the selected countries, India received the largest remittances globally since 2000. It rose from USD 12.9 billion in the year 2000 to USD 83.1 billion in 2020, a rise of about 544 percent over the 21-year period. Furthermore, India’s remittance inflow grew steadily over the 21-year period, averaging USD 53 billion in 2010 and rising to USD 83.1 billion by 2020. It is expected that in the future, India will continue to receive the largest remittance inflows globally. Mexico and the Philippines have both received the second and third largest remittances globally after India since 2000. Currently, remittances from Mexico (USD 42.9 billion) rank higher than those from the Philippines (USD 34.9 billion), even though their positions have been swapped on several occasions over the period.
Remittance inflows from Egypt and Pakistan rank highly on the list at USD 29.6 billion and USD 26.1 billion, respectively. Remittance inflows from China, Bangladesh, and Germany as of 2020 are very close to one another, between USD 18.9 billion and USD 21.8 billion. Remittances fell from a high of USD 33 billion in 2015 in China to USD 18.9 billion in 2020, implying that fewer Chinese citizens are migrating from the country within those 5 years. Finally, remittance inflows from Indonesia, the United Kingdom, and Myanmar fell below USD 10 billion as of 2020, with Indonesia having the highest inflows at USD 9.7 billion, the United Kingdom coming in second at USD 3.2 billion, and Myanmar coming in third at USD 2.2 billion. Remittance inflows into the United Kingdom fell from roughly USD 5.4 billion in 2000 to roughly USD 3.2 billion in 2020, peaking at USD 6.6 billion in 2007 during the global financial crisis.
Figure 4a,b illustrate the comparison between remittance inflows, foreign direct investment (FDI) inflows, foreign portfolio investment (FPI) inflows, and official development assistance (ODA) inflows. Figure 4a demonstrates that remittances contribute the largest amount of capital flows to the selected EMDEs. Therefore, it can be assumed that remittance is critical to the growth and development of these economies, and it would be important to establish the significant contributions of remittance inflows to these economies. On the other hand, Figure 4b shows that remittance constitutes the second largest form of inflow into the selected countries, lagging only behind FDI inflows. For countries with a higher level of industrial development, such as the United Kingdom, Germany, Indonesia, and China, FDI inflows outstrip remittance inflows during the period under investigation. But remittance remained the second-largest source of inflows for these countries (except the UK). However, the narrative changed for Mexico and Myanmar in 2018 as remittances became the highest form of inflow for these countries. These results highlight the importance of remittance in the selected economies, especially the EMDEs in both Figure 4a,b. These findings, amongst others, were one of the reasons why the econometric analysis focused on the impacts of remittance inflows on the macroeconomy of these countries to establish the significance of remittance inflows on these economies.
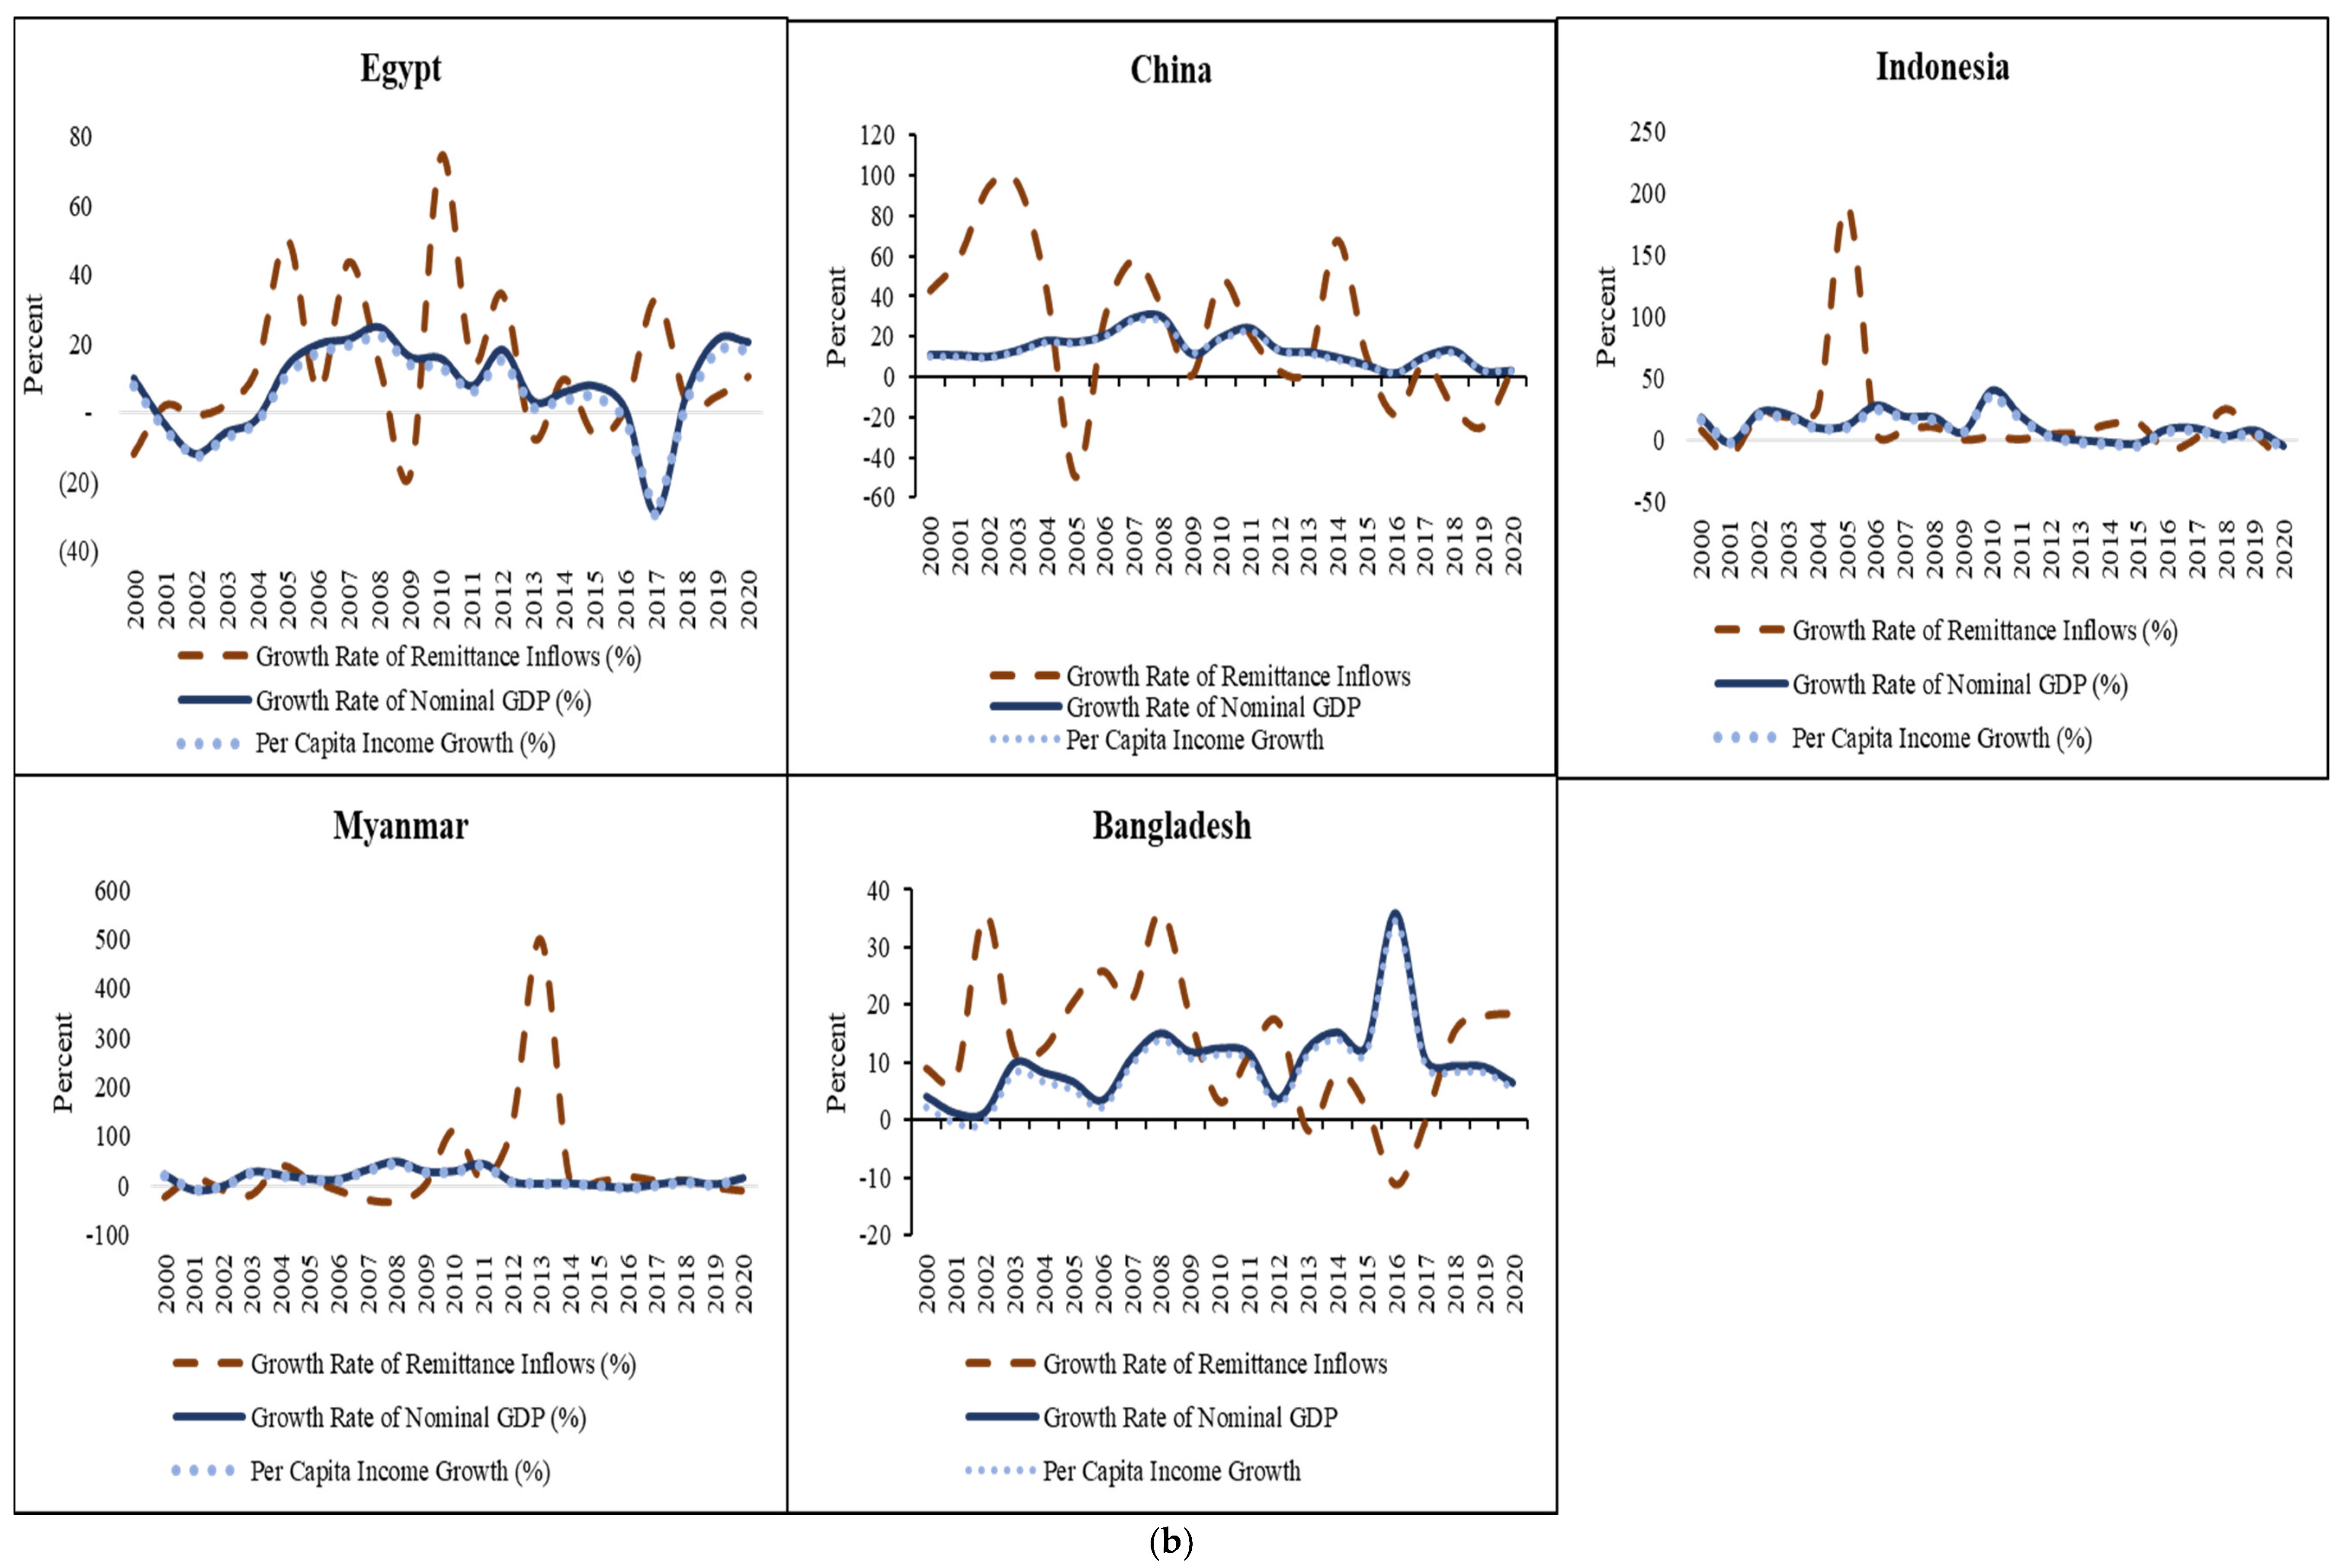
Figure 5a,b display the comparison between remittance income growth, nominal GDP growth, and per capita income growth. The essence is to ascertain the growth movement in these variables and to compare whether growth rates are in tandem or otherwise. In Figure 5a, the data showed that the growth rate of remittances and income (nominal GDP and GDP per capita) followed a similar pattern for Germany and the UK throughout the period under study. Furthermore, the trend analysis showed that except for a few years during the examined period, overall, the growth in remittance inflows followed an almost similar pattern as the growth rate in nominal GDP and per capita income for India, Mexico, Pakistan, and the Philippines. Their growth rates largely fluctuated at almost similar intensity during the period under investigation. These results may point to the suggestion that remittances may have some contributions to the income level and income per capita growth in these countries. Further investigations to ascertain whether this impact is significant will be empirically tested in the next section.
In Figure 5b, the growth rate of remittance inflows, nominal GDP, and GDP per capita for Bangladesh, China, Egypt, Indonesia, and Myanmar also fluctuated throughout the period, but the fluctuations did not follow the exact same patterns during the period under investigation, even though the patterns were very similar for some years. Furthermore, the data showed that the growth rate in remittance inflows fluctuated more than the nominal GDP and per capita income. Finally, the trend analysis showed that nominal GDP and GDP per capita followed the same trend throughout the period under investigation. These findings might imply that remittances make some contributions to these countries’ income. It is important to note that the investigation of the trend analysis is not to check if there is any causation or correlation between the variables. Rather, this section focuses on the patterns of income growth to see if there is any unique pattern in the remittance growth relationships and to ascertain the reasons for these patterns. The results showed that, in general, the patterns of remittance and income growth were similar for most periods during the investigation. However, a useful way to test the significance of these patterns will be to establish the impacts of remittance inflows on income, income per capita, and the output growth of these countries using econometric techniques, which will be discussed at length in the next sections.
3. Materials and Methods
This study examines the response of macroeconomic performance indicators in respective countries to remittance flows into the economies, with comparison for the countries with highest numbers of emigrants. In the data analysis, we look at the impacts of remittance received (remittance inflow in USD) on a number of macroeconomic indicators in the selected countries. The macroeconomic fundamentals examined are the log of nominal gross domestic product, the log of real gross domestic product, the log of nominal gross domestic product per capita, the log of real gross domestic product per capita, and inflation rate used as a control variable to measure the macroeconomic environment. For further robustness, we examine the nexus for the individual countries and as a group, using relevant time-series and panel data analytical techniques. The data are in annual frequency (1987–2021) and sourced from the World Development Indicator (2023). The sample used in the study contains eleven top emigrating countries (Bangladesh, China, India, Mexico, Pakistan, the Philippines, Indonesia, Myanmar, Egypt, Germany, and the United Kingdom). The choice of these eleven countries selected in this study comes from the list of the top twenty emigrating countries but is limited by data availability based on the World Population Review’s (2023) dataset. Therefore, the eleven countries from the top twenty list were selected based on their availability of data during the sample period. The sampled countries comprise nine emerging market countries and two developed countries. Their inclusion in the study was due to their high level of emigration outside their home countries. Using both time-series and panel data sets on the selected countries, this study will ascertain whether remittances may serve as a way of fostering the economies of the selected countries.
For the country-specific analyses, we employ the Feasible Quasi Generalized Least Squares (FQGLS) estimator (Westerlund and Narayan 2015), which assists us in circumventing the unit root problem that characterizes many macroeconomic variables, including the ones under investigation, to address any endogeneity bias that could cloud the model due to bivariate model specification. A similar model that also accounts for nonstationarity and endogeneity bias and cross sectional dependence [Dynamic Common Correlated Effects (DCCE) model] was adopted for panel data analyses (Chudik and Pesaran 2015; Chudik et al. 2016; Salisu et al. 2022).
For the country-specific analyses, we capture the relationship between remittances and macroeconomic performance indicators such that macroeconomic performance in the current period () is determined by remittance inflows in the previous period (), as follows:
The specification in Equation (1) cannot be estimated directly with the least squares technique given that the dependent and explanatory variables, like several other macroeconomic variables, exhibit a stochastic trend that make them nonstationary and therefore present persistence effect. The conventional econometric technique would also prove spurious due to endogeneity bias since a single predictor is considered and other possible regressors are suppressed to maintain focus, and the model is also a dynamic model. The FQGLS technique helps to correct for these effects in addition to any possible heteroscedasticity by pre-weighting the data by the inverse of the standard error of the residual obtained from Equation (1). Hence, the adoption of this method precludes the need to evaluate unit root tests and include several predictors in the model. Several additional details of the technique can be found in Sharma (2021); Salisu et al. (2021, 2023); Adediran et al. (2021). These are captured in Equation (2) as follows:
There are four variants of the variable: nominal output, nominal output per capita, real output, and real output per capita are all expressed in log form and included one at a time, and inflation is included as a control variable. The predictor variable, , is measured as remittance inflow in USD. With these variants and the foregoing econometric effects, we estimate Equation (2) to obtain the respective coefficients that define the impacts of remittance flows on the respective macroeconomic variables in each of the selected top emigrating countries.
In addition to the time-series analyses, we proceed with the group analyses for the top emigrant panel with the DCCE approach that accounts for salient data properties such as nonstationarity and endogeneity bias and cross-sectional dependence as follows.
where for the number of emigrating countries and for the number of time period considered in each panel; has been previously defined as the respective macroeconomic performance indicators: the log of nominal and real gross domestic products, the log of nominal and real GDP per capita, and inflation rate; is the measure of remittance inflow into the economy expressed in USD; is inflation used as a control variable; the inclusion of and introduce cross-sectional average to correct the respective models for endogeneity bias due to the dynamic nature of the models as and are included to correct for persistence; and are the two-way error terms of the models that can be divided into time-variant () component, time-invariant factor loadings ( and ), and the remainder error ( and ); and are the heterogenous parameters of interest analogous to coefficients obtained in the time-series analysis and are determined through Wald test: and .
4. Results
4.1. Preliminaries
We present some useful statistics in Table 1 to comment on the statistical features of the variables under investigation. The relevant preliminary statistics reported are mean, standard deviation, coefficient of variance, and ADF unit root test. The table is subdivided into six panels for describing nominal GDP (Panel A), real GDP (Panel B), per capita nominal GDP (Panel C), per capita real GDP (Panel D), remittance (Panel E), and inflation (Panel F), respectively. Table 1 shows that China has the highest average nominal GDP while Bangladesh has the lowest, and this is true for all the GDP proxies. As expected, the two advanced economies included in the study, Germany and the United Kingdom, have an overwhelming average output per capita for real and nominal GDP per head. For instance, while Germany turns out with an average GDP per capita of USD 34,364, the UK reports about USD 33,664. In the far distant third place is Mexico with USD 7239, whereas China, which reports the highest overall outputs, could only boast a USD 3582 nominal output per capita. The bright side of all these is that the analysis conducted in this study is more broad-based to take into account any heterogeneity that may matter in the discussion of diaspora remittances.
Standard deviation values measure the spread of the data around the average but are severely limited when there is a need to make a comparison among variables. Unlike the standard deviation, the coefficient of variation is a better measure of dispersion, especially when comparing uncommon variables, like in the present case where we compare similar variables between different countries. The coefficient of variation computed as the ratio of the standard deviation to the respective means suggests that the advanced top emigrating countries are less volatile than their emerging top emigrating counterparts. This is not far-fetched since the former are in their steady states, and hence the output values are expected to be close to the average, such that changes in output would be infinitesimal. Also intuitively, the heterogeneous nature of the study is brought to the fore with the descriptive statistics of the inflation figures, which show that emerging emigrating countries are largely high-inflation environments (for example, India, 7.3%, Mexico, 16.3%, and Bangladesh, 6.2%), whereas the advanced emigrating countries are low-inflation environments (UK, 2.7% and Germany, 1.8%). With this idea, we use inflation as a fringe variable to control for the role of the macroeconomic environment in the main data analysis.
On the descriptive statistics of the remittances, Table 1 shows that India receives the highest remittances (average, USD 34.1 billion), while Myanmar receives the lowest average remittances (average, USD 0.64 billion). Mexico (average, USD 17.2 billion) and the Philippines (average, USD 15.2 billion) are ranked second and third in remittance receipts, respectively. An interesting observation here is that China, which has the most nationals working abroad, is only placed in the sixth position (average, USD 9.28 billion) among receivers of diaspora remittances. Germany, which ranks lowest among the list of migrants, comes in fifth (average, USD 9.3 billion) after Egypt, which occupies the fourth position (average, USD 10.1 billion) among the top remittance receivers.
The last panel of Table 1 also shows the results of tests for unit root in the variables useful to check for stationarity/nonstationarity in the series. The Augmented Dickey–Fuller (ADF) test is employed, and the results show that the series are stationary at first difference in most cases and are therefore integrated of order 1. There are few exceptions in the main variables of interest that suggest an evidence of stationarity, such as nominal GDP for Mexico and remittances for Philippines. Interestingly, the evidence of a mixed order of integration obtained from Table 1 represents strong justification for the techniques of analysis proposed for the group- and country-specific analyses conducted in this study (the Feasible Quasi Generalized Least Squares estimator and Dynamic Common Correlated Effects model), since both accommodate the unit root inherent in the variables. The techniques operate as extensions of time-series and panel Autoregressive Distributed Lag (ARDL) models; hence, they are designed for nonstationary series, whether all variables are I(1) or a mixture of I(0) and I(1). These approaches in addition to ARDL take care of other problems in the data, such as serial correlation, heteroscedasticity, and endogeneity bias (see, for example, Salisu et al. 2021; Sharma 2021; Adediran and Swaray 2023; Adediran et al. 2023a, 2023b).
4.2. Main Results
The main data analysis is concerned with estimating the relationship between remittance and indicators of macroeconomic performance measured with nominal and real outputs and their per capita counterparts. The analyses were conducted using time-series and panel data regression approaches to explore the remittance–macroeconomic performance nexus for the migrating countries as a group and individually. The analytical models for analysis are the Dynamic Common Correlated Effect model and the Westerlund and Narayan (2015) predictive model in order to take care of nonstationarity and some other similar econometric problems of most macroeconomic variables. In order to further ensure that the study is robust and extensive, the panel-based analyses were conducted across seven subpanels to ensure the consistency of the findings and to be sure that they are not due to the effect of outliers (see Table 2 and Table 3). These panels are as follows: full sample, full sample excluding China, full sample excluding India, full sample excluding China and India, full sample excluding Germany, full sample excluding the UK, and full sample excluding Germany and the UK. Further efforts at robustness involve both the panel and time-series analyses being rerun after including inflation as a control variable, as argued in the previous section as a measure of macroeconomic environment.
The results in Table 2 show a consistent, significant positive relationship between remittance and the macroeconomic performance indicators. This implies that remittance inflow to the top emigrating countries may be linked to economic growth and this is in accordance with a number of existing findings (Kannan and Hari 2020; Qutb 2022; Oyadeyi 2024). Given that the estimated model is double-log, the results show that percentage increase in remittance leads to a less than proportionate increase in GDP and this is true for all the panels and macroeconomic performance indicators. The economic interpretation of the result is that output may be described as remittance (fairly) inelastic since the coefficients are less than 1 (although subject to the Wald test to formally test the coefficients against 1, which is beyond the scope of the present study). The effects are, however, higher in the case of nominal GDP compared to real GDP, which could be because the former is a measure of current prices unlike the latter which has deflated. Similar outcomes have been observed between nominal GDP per capita and real GDP per capita. The results across sub-panels prove the consistency of the results, with significantly positive relationships recorded for all the subgroups. This affirms the findings in Eggoh et al. (2019), which demonstrate that remittance inflow spur economic growth.
We introduce inflation into the model to check for the consistency of the results with the inclusion of the same as a control variable (see Table 3). This provides an avenue for us to account for the macroeconomic environment of the economies in question, as it was argued in the previous section that inflation incidence differs between the advanced and emerging emigrating countries. This could serve as a way to buttress Ebaidalla and Edriess (2015), who found that the macroeconomic environment plays an important role in facilitating remittance inflow into an economy. Further justification is that remittances have been found to be inflationary since they fuel higher consumer spending (Iqbal et al. 2013; Rivera and Tullao 2020). However, there is no cause for alarm on the potential endogeneity bias that could ensue as a result of combining remittance and inflation as multiple regressors, given that the two techniques of analysis employed provide for this eventuality. Therefore, we control for inflation in the model to see if it affects the remittance–macroeconomic performance relationship, and the results in Table 3 show that even in the presence of inflation, remittance has a significantly positive relationship with the macro variables, which suggests that the relationship is consistent.
For the country-specific analyses, we show the results for the relationship between remittances and the four proxies of macroeconomic performance for each of the countries using a time-series technique (FQGLS) in Table 4, Table 5, Table 6 and Table 7. Three parameters are reported and these are the constant, the β-adjusted coefficient, and the Gamma coefficient. The constant represents the value of the regressand (log of the macroeconomic indicators) when there are no remittances. The β-adjusted coefficient (the parameter of interest) represents the effect of remittance on the macroeconomic performance indicators, and the Gamma coefficient is the autoregressive parameter which is included to serve two purposes: to correct the model for unit root/persistence in the GDP series and to improve the predictive content of the model by adding past information about the dependent variable into the model.
Table 4, which assesses the relationship between logged remittance and nominal GDP, shows that most of the countries report results that are in support of the panel results where remittance is shown to have a significant and positive effect on the outputs of the economies. There are a few cases where the coefficients are positive but not significant (Egypt, Philippines, and the UK), whereas Myanmar has a significant negative relationship. The negative relationship recorded for Myanmar could be linked to the concern that the bulk of Myanmar migrants rely on informal money transfer operators which could make it hard to correctly trace the remittance inflow (Kubo 2017). For the remittance–real GDP nexus in Table 5, although most of the countries still show a positive relationship, for only three (China, India and the UK) is this relationship significant, and two others have a non-significant negative relationship. The results are also true for the per capita proxies as more countries show significantly positive relationships between remittances and nominal GDP per capita in Table 6 compared to real GDP per capita in Table 7. Further, the positive relationships obtained between remittances and output are stronger in terms of more consistent statistical significance when we adopt the remittance/GDP ratio as the predictor in place of the original remittance series (see Table A6 in Appendix A).1
Looking at the results as a whole, a synthesis of the results indicate that both the panel and time-series analyses point to the positive effect of remittances on the economies of the receiving countries, although the group analysis using the panel data technique produces a stronger evidence of positive relationship than the individual country analyses. Also, remittance is more positively and strongly connected with nominal output (nominal GDP and nominal GDP per capita) than with real output (real GDP and real GDP per capita). This points to the negative consequence of inflation in this nexus. Additional results of the time-series analyses that control inflation can be found in the Appendix A. The foregoing results indicate that the net-remittance-receiving countries could take more advantage of the diaspora remittance flow by creating a better environment that facilitates the receipt of such funds from citizens in the diaspora, as it has been shown as one of the ways of contributing to the economic growth of the countries. In countries where the results are not favorable, there may be a need for financial policies to be better targeted at remittances to ensure that the bulk of them is channeled to investment purposes rather than consumption.
5. Conclusions
This study examines how remittance inflow affects macroeconomic performance in top emigrating countries. We select eleven countries, based on data availability, from the top twenty emigrating countries as published in the World Population Review (2023). This list produces a mixture of emerging and advanced countries, which ensures that this study is more robust, unlike past similar studies that mostly focus on specific countries. All variables are measured in USD and are sourced from the World Development Indicators between 1987 and 2021. The macroeconomic indicators examined are nominal gross domestic product, real gross domestic product, nominal gross domestic product per capita, and real gross domestic product per capita, whereas remittance inflow is the predictor series and at the center of the discussion. The data analyses conducted in this study are extensive, including preliminary statistics (mean, standard deviation, coefficient of variation, and ADF tests), charts and figures, and formal analysis (time-series analysis using the Feasible Quasi Generalized Least Squares (FQGLS) estimator and panel data analysis using the Dynamic Common Correlated Effects (DCCE) model).
The preliminary results suggest that the Asia and Pacific region contributes more to the number of emigrants and also receives the most remittances. The group results show that remittance positively affects economies in terms of better economic performance. For the country-specific analyses, this outcome still largely holds true for most of the countries when nominal GDP is considered, unlike when real GDP is considered. The positive takeaway from this study is that the emigrating countries can benefit from diaspora remittance inflow in terms of improved productivity. The foregoing results indicate that the net-remittance-receiving countries could take more advantage of the diaspora remittance flow by creating a better environment that facilitates the receipt of such funds from citizens in the diaspora, as it has been shown as one of the ways of contributing to the economic growth of the countries. In countries where the results are not favorable, there may be a need for financial policies to be better targeted at remittances to ensure that the bulk of them is channeled to investment purposes rather than consumption. this study recommends improved financial systems that perform two roles: one, financial policies that facilitate the receipt of diaspora remittances to consolidate the positive impact on the economies, and two, policies that better channel the inflows from consumption into investment purposes.
Author Contributions
Conceptualization, O.O.O. and I.A.A.; Methodology, I.A.A.; Software, O.O.O., I.A.A. and B.A.K.; Validation, O.O.O. and I.A.A.; Formal analysis, O.O.O., I.A.A. and B.A.K.; Investigation, O.O.O.; Resources, O.O.O., I.A.A. and B.A.K.; Data curation, O.O.O.; Writing—original draft, O.O.O. and B.A.K.; Writing—review & editing, I.A.A.; Visualization, O.O.O. and B.A.K.; Supervision, I.A.A.; Project administration, O.O.O. All authors have read and agreed to the published version of the manuscript.
Funding
This research received no external funding.
Institutional Review Board Statement
Not applicable.
Informed Consent Statement
Not applicable.
Data Availability Statement
The data that support the findings of this study are available from the author upon reasonable request.
Conflicts of Interest
The authors declare no conflict of interest.
Appendix A

Table A1.
Country-specific results with control [nominal GDP–remittance].
| Country | Constant | Gamma | |
|---|---|---|---|
| Bangladesh | 0.3346 | 0.0656 ** | 0.9332 *** |
| (0.4287) | (0.0266) | (0.0378) | |
| China | 0.3387 | 0.0347 | 0.9647 *** |
| (0.4422) | (0.0243) | (0.0342) | |
| Egypt | 0.6080 | 0.1488 *** | 0.8509 *** |
| (0.5748) | (0.0477) | (0.0507) | |
| Germany | 2.5497 ** | 0.0558 * | 0.8651 *** |
| (1.2388) | (0.0325) | (0.0648) | |
| India | 1.5503 ** | 0.1043 ** | 0.8569 *** |
| (0.7295) | (0.0382) | (0.0563) | |
| Indonesia | 5.2008 *** | 0.1332 *** | 0.7042 *** |
| (0.7873) | (0.0272) | (0.0484) | |
| Myanmar | 0.0496 | −0.0338 | 1.0122 *** |
| (0.6113) | (0.0219) | (0.0387) | |
| Mexico | 7.5447 *** | 0.1692 *** | 0.5825 *** |
| (1.6139) | (0.0586) | (0.1006) | |
| Pakistan | 9.4216 *** | 0.0644 * | 0.5576 *** |
| (3.2639) | (0.0349) | (0.1498) | |
| Philippines | 0.1806 | 0.0556 | 0.9434 *** |
| (0.7485) | (0.0469) | (0.0592) | |
| UK | 2.0086 * | 0.0295 | 0.9071 *** |
| (1.1390) | (0.0443) | (0.0592) |
Note: This table presents the results of time-series analyses for the remittance–nominal GDP nexus in the top emigrating countries. The table reports the constant, Beta-adjusted (), and gamma coefficients. Standard errors are in brackets “(…)”. ***, **, * indicate 1%, 5%, and 10% statistical significance, respectively.
Table A2.
Country-specific results with control [real GDP–remittance].
| Country | Constant | Gamma | |
|---|---|---|---|
| Bangladesh | 2.2427 ** | −0.0068 | 0.9152 *** |
| (0.9689) | (0.0082) | (0.0388) | |
| China | 0.7119 | 0.0187 ** | 0.9644 *** |
| (2.0234) | (0.0093) | (0.0771) | |
| Egypt | −0.0285 | −0.0095 | 1.0109 *** |
| (0.0294) | (0.0068) | (0.0129) | |
| Germany | 2.8489 ** | 0.0155 | 0.8887 *** |
| (1.2535) | (0.0113) | (0.0511) | |
| India | 1.6687 *** | 0.0416 ** | 0.9067 *** |
| (0.6019) | (0.0169) | (0.0355) | |
| Indonesia | 1.7884 *** | 0.0132 ** | 0.9258 *** |
| (0.3958) | (0.0053) | (0.0186) | |
| Myanmar | 0.0809 | 0.0031 | 0.9964 *** |
| (0.5082) | (0.0096) | (0.0265) | |
| Mexico | 11.0575 *** | 0.0127 | 0.5835 *** |
| (3.7248) | (0.0219) | (0.1429) | |
| Pakistan | 0.9446 *** | 0.0145 ** | 0.9532 *** |
| (0.3343) | (0.0063) | (0.0177) | |
| Philippines | 0.7500 | 0.0206 | 0.9543 *** |
| (0.6461) | (0.0202) | (0.0397) | |
| UK | 11.3698 *** | 0.0309 * | 0.5743 *** |
| (3.8897) | (0.0164) | (0.1474) |
Note: This table presents the results of time-series analyses for the remittance–real GDP nexus in the top emigrating countries. The table reports the constant, Beta-adjusted (), and gamma coefficients. Standard errors are in brackets “(…)”. ***, **, * indicate 1%, 5%, and 10% statistical significance, respectively.
Table A3.
Country-specific results with control [nominal GDP per capita—remittance].
| Country | Constant | Gamma | |
|---|---|---|---|
| Bangladesh | −0.8273 *** | 0.0609 ** | 0.9330 *** |
| (0.2564) | (0.0222) | (0.0388) | |
| China | 0.1790 | 0.0380 | 0.8381 *** |
| (0.4517) | (0.0232) | (0.0751) | |
| Egypt | −1.6950 ** | 0.1452 *** | 0.8053 *** |
| (0.6251) | (0.0444) | (0.0626) | |
| Germany | 0.0888 | 0.0572 | 0.8623 *** |
| (0.3262) | (0.0342) | (0.0702) | |
| India | −1.1139 ** | 0.0911 *** | 0.8538 *** |
| (0.4414) | (0.0326) | (0.0584) | |
| Indonesia | −0.0130 | 0.1153 *** | 0.6903 *** |
| (0.2556) | (0.0246) | (0.0513) | |
| Myanmar | 0.6780 ** | −0.0323 | 1.0118 *** |
| (0.2552) | (0.0219) | (0.0416) | |
| Mexico | 1.2169 ** | 0.1233 ** | 0.5456 *** |
| (0.5653) | (0.0471) | (0.1064) | |
| Pakistan | 1.1196 | 0.0826 ** | 0.5143 *** |
| (0.6781) | (0.0361) | (0.1450) | |
| Philippines | −0.7481 | 0.0523 | 0.9370 *** |
| (0.5970) | (0.0388) | (0.0631) | |
| UK | 0.4860 | 0.0363 | 0.8788 *** |
| (0.6410) | (0.0459) | (0.0689) |
Note: This table presents the results of time-series analyses for the remittance–nominal GDP per capita nexus in the top emigrating countries. The table reports the constant, Beta-adjusted (), and gamma coefficients. Standard errors are in brackets “(…)”. ***, ** indicate 1% and 5% statistical significance, respectively.
Table A4.
Country-specific results with control [real GDP per capita–remittance].
| Country | Constant | Gamma | |
|---|---|---|---|
| Bangladesh | −0.2227 *** | 0.0138 ** | 0.9928 *** |
| (0.0315) | (0.0065) | (0.0204) | |
| China | 0.3872 | 0.0228 ** | 0.8870 *** |
| (0.4795) | (0.0094) | (0.0840) | |
| Egypt | 0.0663 | −0.0107 | 1.0247 *** |
| (0.0857) | (0.0069) | (0.0239) | |
| Germany | 0.9047 ** | 0.0183 | 0.8740 *** |
| (0.4322) | (0.0133) | (0.0649) | |
| India | −0.0904 | 0.0347 ** | 0.9015 *** |
| (0.1089) | (0.0142) | (0.0401) | |
| Indonesia | 0.4879 *** | 0.0097 ** | 0.9175 *** |
| (0.0953) | (0.0047) | (0.0233) | |
| Myanmar | −0.0011 | 0.0044 | 0.9942 *** |
| (0.1250) | (0.0096) | (0.0297) | |
| Mexico | 3.2725 *** | 0.0312 * | 0.5598 *** |
| (1.0028) | (0.0153) | (0.1447) | |
| Pakistan | 1.3749 * | 0.0175 * | 0.7474 *** |
| (0.7889) | (0.0066) | (0.1196) | |
| Philippines | 0.0088 | 0.0171 | 0.9505 *** |
| (0.2283) | (0.0154) | (0.0474) | |
| UK | 1.0672 ** | 0.0086 | 0.8837 *** |
| (0.0402) | (0.0151) | (0.0579) |
Note: This table presents the results of time-series analyses for the remittance–real GDP per capita nexus in the top emigrating countries. The table reports the constant, Beta-adjusted (), and gamma coefficients. Standard errors are in brackets “(…)”. ***, **, * indicate 1%, 5%, and 10% statistical significance, respectively.
Table A5.
Literature review on the remittance–macroeconomic performance relationship.
| Author(s) | Title | Scope | Methods | Findings |
|---|---|---|---|---|
| Agyei (2021) | The Dynamics of Remittances Impact: A Mixed-Method Approach to Understand Ghana’s Situation and the Way Forward | Ghana | Ordinary Least Square (OLS), Household Survey Data | Remittance positively contributes to macroeconomic performance. However, it only reaches a few well-off homes in Ghana. |
| Anyanwu and Erhijakpor (2010) | Do International Remittances Affect Poverty in Africa? | Africa | OLS, Instrumental Variable GMM | Remittances reduces the depth and size of poverty in Africa. |
| Blouchoutzi and Nikas (2014) | Emigrants’ remittances and economic growth in small transition economies: The cases of Moldova and Albania. | Albania and Moldova | OLS, Time Series Regressions | The findings suggest that the role of remittance on consumption and investment is inconclusive. |
| Comes et al. (2018) | The Impact of Foreign Direct Investments and Remittances on Economic Growth: A Case Study in Central and Eastern Europe | Central and Eastern Europe | OLS with Dummy Variables | Remittances and FDI positively contribute to GDP. |
| Datta and Sarkar (2014) | Relationship between remittances and economic growth in Bangladesh: an econometric study | Bangladesh | Auto Regressive Distributed Lag (ARDL) | No short-run and long-run effect of remittance on economic growth in Bangladesh. |
| Dridi et al. (2019) | The Impact of Remittances on Economic Activity: The Importance of Sectoral Linkages. | Sub-Saharan African countries | Scatter Plots, Weighted-Out degree of the Scatter Plots, OLS regressions, Fixed Effects | The empirical findings indicate that the degree of intersectoral linkages increases the impact of remittances on recipient economies. |
| Ebaidalla and Edriess (2015) | Flow of migrants’ remittances into Sudan: the role of macroeconomic environment | Sudan | ARDL, Impulse Response Functions (IRSs) and Variance Decomposition (VDC) | Macroeconomic policy variables significantly influence the flow of remittances through official avenues. |
| Eggoh et al. (2019) | Do remittances spur economic growth? Evidence from developing countries | 49 Developing Countries | Panel Smooth Transition Regression (PSTR), difference and system generalized methods of moment (GMM) models | Remittance positively contributes to macroeconomic performance. |
| Kannan and Hari (2020) | Revisiting Kerala’s Gulf Connection: Half a Century of Emigration, Remittances and Their Macroeconomic Impact, 1972–2020 | India | Trend Analysis, Kerala Migration Survey (KMS) | Remittance positively contributes to macroeconomic performance. |
| Koczan et al. (2021) | The Impact of International Migration on Inclusive Growth: A Review. | Top 20 Migrant Destination Countries | Trend Analysis and Charts | International migration increases the income of poor families in the emigrating countries. |
| Meyer and Shera (2017) | The impact of remittances on economic growth: An econometric model. | Albania, Bulgaria, Macedonia, Moldova, Romania, and Bosnia and Herzegovina | Fixed Effects, Random Effects, Ljung–Box test | Remittance positively contributes to macroeconomic performance. |
| Qutb (2022) | Migrants’ remittances and economic growth in Egypt: an empirical analysis from 1980 to 2017. | Egypt | VECM Granger causality | Remittance negatively contributes to macroeconomic performance in Egypt in the long term. |
| Kudaisi et al. (2022) | Financial liberalization, remittances and economic growth in Nigeria (1990–2018). | Nigeria | System GMM | Remittance negatively contributes to the economic growth of Nigeria. |
| Olayungbo et al. (2020) | Asymmetric Effects of Remittances on Economic Growth in Nigeria: Evidence From Non-linear ARDL Analysis | Nigeria | Non-linear ARDL | Both positive and negative changes in remittance negatively contribute to the economic growth of Nigeria in the long term, while in the short term, positive remittance changes weaken the economy but negative remittance changes or a fall in remittances strengthen economic growth. |
| Olayungbo and Quadri (2019) | Remittances, financial development and economic growth in sub-Saharan African countries: evidence from a PMG-ARDL approach. | Sub-Saharan Africa | Pooled mean Group-ARDL | Remittance positively contributes to macroeconomic performance. |
| Ojeyinka and Ajide (2022) | Remittance and financial development in Africa: A multidimensional analysis | Africa | Augmented Mean Group (AGM) | Remittances have no significant effect on financial development in Africa |
Table A6.
Panel results [with remittance as a ratio of GDP].
| Full Sample | Less China | Less India | Less China and India | Less Germany | Less UK | Less Germany and UK | |
|---|---|---|---|---|---|---|---|
| Nominal GDP | 0.8352 *** | 0.7138 *** | 0.9372 *** | 0.8137 *** | 0.8634 *** | 0.8892 *** | 0.9265 *** |
| [21.70] | [23.94] | [33.06] | [46.83] | [ 19.45] | [22.14] | [20.00] | |
| Real GDP | 0.50430 *** | 0.4184 *** | 0.5698 *** | 0.4817 *** | 0.5312 *** | 0.5449 *** | 0.5793 *** |
| [15.81] | [16.42] | [22.53] | [27.91] | [15.03] | [16.82] | [16.31] | |
| Nominal GDP per Capita | 0.6931 *** | 0.5676 *** | 0.7757 *** | 0.6455 *** | 0.7070 *** | 0.7324 *** | 0.7523 *** |
| [18.79] | [26.84] | [26.28] | [56.11] | [16.12] | [18.27] | [15.63] | |
| Real GDP per Capita | 0.3621 *** | 0.2722 *** | 0.4083 *** | 0.3135 *** | 0.3748 *** | 0.3880 *** | 0.4050 *** |
| [10.70] | [14.53] | [13.47] | [23.18] | [9.51] | [10.63] | [9.46] |
Note: This table presents the Dynamic Common Correlated Effect (DCCE) model results to check the effect of remittances on the four macroeconomic performance indicators in 11 emigrating countries. The table reports the Beta-adjusted coefficients. F-statistics obtained from the joint test of the lagged coefficients of remittance are in square brackets “[…]”. *** indicate 1% statistical significance, respectively.
| 1 | This action follows valuable comments received from two anonymous reviewers to that effect. |
References
- Adediran, Idris A., and Raymond Swaray. 2023. Carbon trading amidst global uncertainty: The role of policy and geopolitical uncertainty. Economic Modelling 123: 106279. [Google Scholar] [CrossRef]
- Adediran, Idris A., Kazeem O. Isah, Ahamuefula E. Ogbonna, and Sheriff K. Badmus. 2023a. A Global Analysis of the Macroeconomic Effects of Climate Change. Asian Economics Letters. Peer-Reviewed Research 4: 1–6. [Google Scholar] [CrossRef]
- Adediran, Idris A., Olalekan D. Yinusa, and Kanwal H. Lakhani. 2021. Where lies the silver lining when uncertainty hang dark clouds over the global financial markets? Resources Policy 70: 101932. [Google Scholar] [CrossRef]
- Adediran, Idris A., Phebian N. Bewaji, and Olajide O. Oyadeyi. 2023b. Climate Risk and Stock Markets: Implications for Market Efficiency and Return Predictability. Emerging Markets Finance and Trade. [Google Scholar] [CrossRef]
- Aggarwal, Reena, Asli Demirguc-Kunt, and Martinez Peria. 2006. Do Workers’ Remittances Promote Financial Development? Policy Research Working Paper Series 3957. Washington, DC: The World Bank, pp. 1–41. [Google Scholar]
- Agyei, Stephen A. 2021. The Dynamics of Remittances Impact: A Mixed-Method Approach to Understand Ghana’s Situation and the Way Forward. Social Sciences 10: 410. [Google Scholar] [CrossRef]
- Anyanwu, John C., and Andrew E. O. Erhijakpor. 2010. Do International Remittances Affect Poverty in Africa. African Development Review 22: 51–91. [Google Scholar] [CrossRef]
- Bidawi, Hussein, Paola A. F. Domingues, Chiara Fratto, and Nicole Laframboise. 2022. The Propensity to Remit: Macro and Micro Factors Driving Remittances to Central America and the Caribbean. IMF Working Paper No. 203. Washington, DC: International Monetary Fund, pp. 1–32. [Google Scholar] [CrossRef]
- Blouchoutzi, Anastasia, and Christos Nikas. 2014. Emigrants’ remittances and economic growth in small transition economies: The cases of Moldova and Albania. East-West Journal of Economics and Business 17: 97–117. [Google Scholar]
- Carling, Jørgen. 2008. The determinants of migrant remittances. Oxford Review of Economic Policy 24: 581–98. [Google Scholar] [CrossRef]
- Chudik, Alexander, and M. Hashem Pesaran. 2015. Common correlated effects estimation of heterogeneous dynamic panel data models with weakly exogenous regressors. Journal of Econometrics 188: 393–420. [Google Scholar] [CrossRef]
- Chudik, Alaxender, Kamiar Mohaddes, M. Hashem Pesaran, and Mehdi Raissi. 2016. Long-Run Effects in Large Heterogeneous Panel Data Models with Cross-sectionally Correlated Errors. Essays in Honor of AmanUllah 36: 85–135. [Google Scholar] [CrossRef]
- Comes, Calin-Adrian, Elena Bunduchi, Valentina Vasile, and Daniel Stefan. 2018. The impact of foreign direct investments and remittances on economic growth: A case study in Central and Eastern Europe. Sustainability 10: 238. [Google Scholar]
- Datta, Kanchan, and Bimal Sarkar. 2014. Relationship between remittances and economic growth in Bangladesh: An econometric study. Bangladesh Development Research 19: 1–11. [Google Scholar] [CrossRef]
- Dridi, Jemma, Tunc Gursoy, Hector Perez-Saiz, and Mounir Bari. 2019. The Impact of Remittances on Economic Activity: The Importance of Sectoral Linkages. IMF Working Paper No. 175. Washington, DC: International Monetary Fund, pp. 1–37. [Google Scholar] [CrossRef]
- Ebaidalla, Ebaidalla M., and Abdalla A. Edriess. 2015. Flow of migrants’ remittances into Sudan: The role of macroeconomic environment. Middle East Development Journal 7: 70–88. [Google Scholar] [CrossRef]
- Eggoh, Jude, Chrysost Bangake, and Gervasio Semedo. 2019. Do remittances spur economic growth? Evidence from developing countries. The Journal of International Trade & Economic Development 28: 391–418. [Google Scholar] [CrossRef]
- Haas, Hein D. 2005. International Migration, Remittances and Development: Myths and facts. Third World Quarterly 26: 1269–84. [Google Scholar] [CrossRef]
- Iqbal, Javed, Misbah Nosheen, and Ammara Javed. 2013. The Nexus between Foreign Remittances and Inflation: Evidence from Pakistan. Pakistan Journal of Social Sciences (PJSS) 33: 331–42. [Google Scholar]
- Kamuleta, Karine. 2014. The impact of remittances on developing countries. In Policy Department DG External Policies. pp. 1–80. Available online: https://www.europarl.europa.eu/RegData/etudes/etudes/join/2014/433786/EXPO-DEVE_ET(2014)433786_EN.pdf (accessed on 13 March 2023).
- Kannan, K. P., and K. S. Hari. 2020. Revisiting Kerala’s Gulf Connection: Half a Century of Emigration, Remittances and Their Macroeconomic Impact, 1972–2020. The Indian Journal of Labour Economics 63: 941–67. [Google Scholar] [CrossRef]
- Koczan, Zsoka, Giovanni Peri, Magali Pinat, and Dmitriy Rozhkov. 2021. The Impact of International Migration on Inclusive Growth: A Review. IMF Working Paper No. 88. Washington, DC: International Monetary Fund, pp. 1–33. Available online: https://www.imf.org/en/Publications/WP/Issues/2021/03/19/The-Impact-of-International-Migration-on-Inclusive-Growth-A-Review-50169 (accessed on 13 March 2023).
- Kubo, Koji. 2017. Evolving informal remittance methods among Myanmar migrant workers in Thailand. Journal of the Asia Pacific Economy 22: 396–413. [Google Scholar] [CrossRef]
- Kudaisi, Bosede V., Titus A. Ojeyinka, and Tolulope T. Osinubi. 2022. Financial liberalization, remittances and economic growth in Nigeria (1990–2018). Journal of Economic and Administrative Sciences 38: 562–80. [Google Scholar] [CrossRef]
- Lucas, Robert E. B. 2006. Migration and Economic Development in Africa: A Review of Evidence. Journal of African Economies 15: 337–95. [Google Scholar] [CrossRef]
- Lucas, Robert E. B. 2008. International Labor Migration in a Globalizing Economy. Trade, Equity, and Development Program, No. 92. Washington, DC: Carnegie Endowment for International Peace. [Google Scholar]
- Meyer, Dietmar, and Adela Shera. 2017. The impact of remittances on economic growth: An econometric model. EconomiA 18: 147–55. [Google Scholar] [CrossRef]
- Ojeyinka, Titus A., and Folorunso M. Ajide. 2022. Remittance and financial development in Africa: A multidimensional analysis. Remittances Review 7: 71–89. [Google Scholar] [CrossRef]
- Olayungbo, David O., and Ahmod Quadri. 2019. Remittances, financial development and economic growth in sub-Saharan African countries: Evidence from a PMG-ARDL approach. Financial Innovation 5: 1–25. [Google Scholar] [CrossRef]
- Olayungbo, David O., Clement O. Olaniyi, and Titus A. Ojeyinka. 2020. Asymmetric Effects of Remittances on Economic Growth in Nigeria: Evidence From Non-linear ARDL Analysis. Preprint. [Google Scholar] [CrossRef]
- Oyadeyi, Olajide. 2023a. Banking Innovation, Financial Inclusion and Economic Growth in Nigeria. Available online: https://link.springer.com/article/10.1007/s13132-023-01396-5 (accessed on 31 January 2024).
- Oyadeyi, Olajide. 2023b. Financial Development, Real Sector, and Economic Growth in Nigeria. Available online: https://link.springer.com/article/10.1007/s43546-023-00526-0 (accessed on 31 January 2024).
- Oyadeyi, Olajide. 2023c. Financial Inclusion, E-Payments and Economic Growth in Nigeria. Available online: https://www.inderscience.com/info/ingeneral/forthcoming.php?jcode=ijfib#114592 (accessed on 31 January 2024).
- Oyadeyi, Olajide. 2023d. Financial Development, Interest Rate Pass-through and the Interest Rate Channel of Monetary Policy. Available online: https://www.tandfonline.com/doi/full/10.1080/23322039.2023.2209952 (accessed on 31 January 2024).
- Oyadeyi, Olajide, and Temidayo Akinbobola. 2022. Financial Development and the Current Account in Nigeria. IOSR Journal of Economics and Finance 13: 65–74. [Google Scholar]
- Oyadeyi, Olajide O. 2024. Monetary Integration across West Africa: Is the Region Ripe for a Monetary Union? SageOpen 14: 1–21. [Google Scholar] [CrossRef]
- Oyadeyi, Olajide O., Olayode W. Agboola, Solomon O. Okunade, and Tolulope T. Osinubi. 2024. The Debt-Growth Nexus and Debt Sustainability in Nigeria: Are There Reasons to be Concerned? Journal of Policy Modelling 46: 129–52. [Google Scholar] [CrossRef]
- Qutb, Rasha. 2022. Migrants’ remittances and economic growth in Egypt: An empirical analysis from1980 to 2017. Review of Economics and Political Science 7: 154–76. [Google Scholar] [CrossRef]
- Rao, Bhaskara, and Gazi Hassan. 2012. Are the direct and indirect growth effects of remittances significant? The World Economy 35: 351–71. [Google Scholar] [CrossRef]
- Ratha, Dilip. 2003. Workers’ Remittances: An Important and Stable Source of External Development Finance. Global Development Finance 2003, Striving for Development Finance. Washington, DC: The World Bank, pp. 1–19. Available online: https://documents1.worldbank.org/curated/en/698051468128113998/310436360_20050014094932/additional/multi0page.pdf (accessed on 31 January 2024).
- Rivera, John Paulo, and Tereso S. Tullao, Jr. 2020. Investigating the link between remittances and inflation: Evidence from the Philippines. South East Asia Research 28: 301–26. [Google Scholar] [CrossRef]
- Salisu, Afees A., Ahamuefula E. Ogbonna, and Idris A. Adediran. 2021. Stock-induced Google trends and the predictability of sectoral stock returns. Journal of Forecasting 40: 327–45. [Google Scholar] [CrossRef]
- Salisu, Afees A., Idris Adediran, Philip C. Omoke, and Jean P. Tchankam. 2023. Gold and tail risks. Resources Policy 80: 103154. [Google Scholar] [CrossRef]
- Salisu, Afees A., Jean P. Tchankam, and Idris A. Adediran. 2022. Out-of-Sample Stock Return Predictability of Alternative COVID-19 Indices. Emerging Markets Finance and Trade 58: 3739–50. [Google Scholar] [CrossRef]
- Sharma, Susan S. 2021. Westerlund and Narayan predictability test: Step-by-step approach using COVID-19 and oil price data. MethodsX 8: 101201. [Google Scholar] [CrossRef]
- Stojanov, Robert, Daniel Nemec, and Libor Žídek. 2019. Evaluation of the Long-Term Stability and Impact of Remittances and Development Aid on Sustainable Economic Growth in Developing Countries. Sustainability 11: 1538. [Google Scholar] [CrossRef]
- Taylor, J. Edward. 1999. The new economics of labour migration and the role of remittances in the migration process. International Migration 37: 63–88. [Google Scholar]
- UNDESA (United Nations Department of Economic and Social Affairs, Population Division). 2020. International Migration 2020 Highlights. Available online: https://www.un.org/development/desa/pd/sites/www.un.org.development.desa.pd/files/undesa_pd_2020_international_migration_highlights.pdf (accessed on 23 March 2023).
- Ustubici, Aysen, and Darja Irdam. 2012. The Impact of Remittances on Human Development: A Quantitative Analysis and Policy Implications. Economics & Sociology 5: 74–95. [Google Scholar]
- Westerlund, Joakim, and Paresh K. Narayan. 2015. Testing for predictability in conditionally heteroscedasticity stock returns. Journal of Financial Econometrics 13: 342–75. [Google Scholar] [CrossRef]
- World Bank Group. 2006. Global Economic Prospects: Economic Implications of Remittances and Migration. pp. 1–182. Available online: https://thedocs.worldbank.org/en/doc/4aa0b654ecdbaf8302d5901aaada3fbf-0350012021/related/Global-Economic-Prospects-2006.pdf (accessed on 4 April 2023).
- World Development Indicator. 2023. World Development Indicator. Washington, DC: World Bank. Available online: https://databank.worldbank.org/source/world-development-indicators (accessed on 28 March 2023).
- World Population Review. 2023. Immigration by Country. Available online: https://worldpopulationreview.com/country-rankings/immigration-by-country (accessed on 18 March 2023).
Figure 1.
Top emigrating countries and the percentage of migrant population. Source: UNDESA (2020); World Population Review (2023); World Development Indicator (2023).
Figure 1.
Top emigrating countries and the percentage of migrant population. Source: UNDESA (2020); World Population Review (2023); World Development Indicator (2023).

Figure 2.
Remittances by region. Source: World Development Indicator (World Development Indicator 2023).
Figure 2.
Remittances by region. Source: World Development Indicator (World Development Indicator 2023).

Figure 3.
Remittances received by the selected recipient countries. Source: World Development Indicator (2023).
Figure 3.
Remittances received by the selected recipient countries. Source: World Development Indicator (2023).

Figure 4.
(a) Remittance vs. other inflows. (b) Remittance vs. other inflows. Source: World Development Indicator (2023).
Figure 4.
(a) Remittance vs. other inflows. (b) Remittance vs. other inflows. Source: World Development Indicator (2023).


Figure 5.
(a) Growth rate in remittance and income. (b) Growth rate in remittance and income. Source: World Development Indicator (2023).
Figure 5.
(a) Growth rate in remittance and income. (b) Growth rate in remittance and income. Source: World Development Indicator (2023).


Table 1.
Preliminary results.
| Bangladesh | China | Egypt | Germany | India | Indonesia | Myanmar | Mexico | Pakistan | Philippines | UK | |
|---|---|---|---|---|---|---|---|---|---|---|---|
| Panel A: Nominal GDP | |||||||||||
| Mean | 117’Bn | 4890’Bn | 154’Bn | 2810’Bn | 1150’Bn | 473’Bn | 26’Bn | 797’Bn | 148’Bn | 164’Bn | 2090’Bn |
| SD | 112’Bn | 5280’Bn | 113’Bn | 865’Bn | 926’Bn | 382’Bn | 27.2’Bn | 373’Bn | 107’Bn | 116’Bn | 782’Bn |
| CV | 0.956 | 1.080 | 0.736 | 0.307 | 0.803 | 0.808 | 1.047 | 0.468 | 0.718 | 0.703 | 0.374 |
| I(0) | 2.202 | −0.239 | −0.745 | −1.777 | 0.584 | −0.826 | −1.531 | −3.097 ** | −0.647 | −0.663 | −2.284 |
| I(1) | −4.608 *** | −3.211 ** | −4.30 *** | −5.131 *** | −5.38 *** | −5.912 *** | −3.490 ** | −5.06 *** | −5.461 *** | −5.057 *** | −4.67 *** |
| Panel B: Real GDP | |||||||||||
| Mean | 124’Bn | 5810’Bn | 229’Bn | 2920’Bn | 1250’Bn | 564’Bn | 33.5’Bn | 918’Bn | 190’Bn | 201’Bn | 2440’Bn |
| SD | 70’Bn | 4690’Bn | 99.3’Bn | 425’Bn | 754’Bn | 261’Bn | 26.3’Bn | 214’Bn | 76.5’Bn | 94.5’Bn | 476’Bn |
| CV | 0.562 | 0.806 | 0.434 | 0.145 | 0.602 | 0.463 | 0.783 | 0.233 | 0.402 | 0.470 | 0.195 |
| I(0) | 5.109 | −0.938 | −0.372 | −2.492 | −0.596 | −0.957 | −2.401 | −1.756 | −1.308 | 0.297 | −1.540 |
| I(1) | −5.994 *** | −2.763 * | −3.74 *** | −4.534 *** | −5.47 *** | −4.218 *** | −3.949 ** | −5.91 *** | −4.676 *** | −5.274 *** | −6.09 *** |
| Panel C: Nominal GDP Per Capita | |||||||||||
| Mean | 789.46 | 3582.47 | 1840.80 | 34,374.1 | 936.96 | 1935.43 | 501.47 | 7239.84 | 838.65 | 1780.06 | 33,664.6 |
| SD | 650.95 | 3747.51 | 1056.71 | 10,371.0 | 644.04 | 1377.09 | 506.20 | 2689.00 | 434.72 | 963.58 | 11,292.5 |
| CV | 0.824 | 1.046 | 0.570 | 0.301 | 0.687 | 0.711 | 1.009 | 0.374 | 0.518 | 0.541 | 0.335 |
| I(0) | 2.579 | −0.127 | −0.931 | −1.669 | 0.680 | −0.869 | −1.493 | −3.187 ** | −0.547 | −0.527 | −2.464 |
| I(1) | −4.585 *** | −3.168 ** | −4.30 *** | −5.216 *** | −5.30 *** | −5.921 *** | −3.501 ** | −5.11 *** | −5.421 *** | −5.035 *** | −4.64 *** |
| Panel D: Real GDP Per Capita | |||||||||||
| Mean | 875.34 | 4321.58 | 2887.66 | 35,725.5 | 1045.23 | 2410.02 | 659.54 | 8630.18 | 1156.76 | 2266.35 | 39,675.6 |
| SD | 366.04 | 3275.57 | 697.16 | 4851.86 | 487.63 | 795.67 | 474.36 | 831.41 | 193.45 | 639.40 | 5787.0 |
| CV | 0.418 | 0.757 | 0.241 | 0.135 | 0.466 | 0.330 | 0.719 | 0.096 | 0.167 | 0.282 | 0.145 |
| I(0) | 6.903 | −0.627 | −0.408 | −1.980 | 0.055 | −0.754 | −2.360 | −1.812 | −0.453 | 0.686 | −1.944 |
| I(1) | −5.484 *** | −2.776 * | −3.447 ** | −5.374 *** | −5.42 *** | −4.298 *** | −3.992 ** | −6.14 *** | −0.453 *** | −5.049 *** | −6.02 *** |
| Panel E: Remittances | |||||||||||
| Mean | 7.0’Bn | 9.28’Bn | 10.1’Bn | 9.3’Bn | 34.1’Bn | 4.34’Bn | 0.64’Bn | 17.2’Bn | 8.17’Bn | 15.2’Bn | 3.92’Bn |
| SD | 6.6’Bn | 10.3’Bn | 8.79’Bn | 5.8’Bn | 29.9’Bn | 4.03’Bn | 0.97’Bn | 12.6’Bn | 8.09’Bn | 12’Bn | 1.74’Bn |
| CV | 0.938 | 1.113 | 0.868 | 0.623 | 0.876 | 0.929 | 1.522 | 0.728 | 0.990 | 0.786 | 0.444 |
| I(0) | −0.457 | −1.400 | 0.038 | −0.092 | −1.143 | −2.019 | −1.226 | −1.963 | 0.189 | −3.799 *** | −1.949 |
| I(1) | −2.454 ** | −5.98 *** | −5.76 *** | −4.528 *** | −6.26 *** | −5.231 *** | −5.935 *** | −3.94 *** | −4.748 *** | −6.088 *** | −6.82 *** |
| Panel F: Inflation | |||||||||||
| Mean | 6.238 | 4.853 | 10.706 | 1.791 | 7.305 | 8.706 | 17.838 | 16.311 | 8.368 | 5.871 | 2.681 |
| SD | 6.106 | 6.203 | 6.304 | 0.249 | 3.031 | 9.397 | 14.033 | 28.167 | 3.826 | 3.953 | 1.685 |
| CV | 0.354 | 1.278 | 0.588 | 0.628 | 0.414 | 1.079 | 0.786 | 1.726 | 0.457 | 0.673 | 0.628 |
| I(0) | −4.411 *** | −2.411 | −2.931 * | −2.786 * | −2.826 * | −4.516 *** | −2.105 | −4.56 *** | −2.825 * | −2.846 * | −1.992 |
| I(1) | −7.642 *** | −5.26 *** | −7.44 *** | −5.087 *** | −7.36 *** | −7.064 *** | −5.378 *** | −8.72 *** | −6.944 *** | −7.669 *** | −4.31 *** |
Note: This table presents the summary statistics for the macroeconomic performance indicators (nominal, real, nominal per capita, real per capita gross domestic product, and inflation) and remittances. The table reports the mean, standard deviation (SD), and coefficient of variance (CV) for the selected top emigrating countries. The variables are expressed in billion USD. Also, this table presents the Augmented Dickey–Fuller (ADF) unit root test results to check nonstationarity in the variables at level [I(0)] and first difference [I(1)]. ***, **, * indicate 1%, 5%, and 10% statistical significance, respectively.
Table 2.
Panel results [without control variable].
| Full Sample | Less China | Less India | Less China and India | Less Germany | Less UK | Less Germany and UK | |
|---|---|---|---|---|---|---|---|
| Nominal GDP | 0.6067 *** | 0.5916 *** | 0.5879 *** | 0.5691 *** | 0.6058 *** | 0.6087 *** | 0.6080 *** |
| [286.29] | [270.22] | [303.18] | [329.12] | [233.71] | [236.64] | [188.92] | |
| Real GDP | 0.3496 *** | 0.3341 *** | 0.3422 *** | 0.3242 *** | 0.3463 *** | 0.3560 *** | 0.3532 *** |
| [122.73] | [120.55] | [101.78] | [101.55] | [99.62] | [108.76] | [86.22] | |
| Nominal GDP per Capita | 0.5019 *** | 0.4801 *** | 0.4923 *** | 0.4671 *** | 0.5071 *** | 0.5001 *** | 0.5057 *** |
| [257.77] | [373.64] | [223.75] | [389.63] | [221.46] | [210.10] | [176.51] | |
| Real GDP per Capita | 0.2447 *** | 0.2226 *** | 0.2466 *** | 0.2223 *** | 0.2476 *** | 0.2474 *** | 0.2509 *** |
| [55.52] | [68.82] | [46.29] | [54.89] | [46.84] | [46.74] | [38.80] |
Note: This table presents the Dynamic Common Correlated Effect (DCCE) model results to check the effect of remittances on the four macroeconomic performance indicators in 11 emigrating countries. The table reports the Beta-adjusted coefficients. F-statistics obtained from the joint test of the lagged coefficients of remittance are in square brackets “[…]”. *** indicate 1% statistical significance, respectively.
Table 3.
Panel results [with control variable].
| Full Sample | Less China | Less India | Less China and India | Less Germany | Less UK | Less Germany and UK | |
|---|---|---|---|---|---|---|---|
| Nominal GDP | 0.5925 *** | 0.5774 *** | 0.5656 *** | 0.5458 *** | 0.5815 *** | 0.5982 *** | 0.5866 *** |
| [141.89] | [121.50] | [149.60] | [136.52] | [117.56] | [119.89] | [96.57] | |
| Real GDP | 0.3450 *** | 0.3300 *** | 0.3343 *** | 0.3165 *** | 0.3363 *** | 0.3547 *** | 0.3462 *** |
| [95.52] | [87.14] | [80.79] | [75.13] | [79.00] | [89.35] | [71.78] | |
| Nominal GDP per Capita | 0.4871 *** | 0.4650 *** | 0.4707 *** | 0.4443 *** | 0.4826 *** | 0.4882 *** | 0.4833 *** |
| [132.92] | [136.34] | [119.53] | [136.23] | [107.98] | [109.35] | [86.68] | |
| Real GDP per Capita | 0.2395 *** | 0.22177 *** | 0.2394 *** | 0.2151 *** | 0.2374 *** | 0.2447 *** | 0.2429 *** |
| [51.46] | [60.87] | [42.05] | [47.95] | [41.52] | [45.01] | [35.56] |
Note: This table presents the Dynamic Common Correlated Effect (DCCE) model results to check the effect of remittances on the four macroeconomic performance indicators in 11 emigrating countries. The table reports the Beta-adjusted coefficients. F-statistics obtained from the joint test of the lagged coefficients of remittance are in square brackets “[…]”. *** indicate 1% statistical significance.
Table 4.
Country-specific results [nominal GDP–remittance].
| Country | Constant | Gamma | |
|---|---|---|---|
| Bangladesh | 0.3067 *** | 0.0634 ** | 0.9361 *** |
| (0.3970) | (0.0233) | (0.0340) | |
| China | 3.4950 * | 0.0498 * | 0.8344 *** |
| (2.0356) | (0.0498) | (0.0842) | |
| Egypt | 0.1363 | 0.0524 | 0.9504 *** |
| (0.6761) | (0.0491) | (0.0528) | |
| Germany | 3.8980 *** | 0.0729 ** | 0.8059 *** |
| (1.2335) | (0.0349) | (0.0665) | |
| India | 1.4970 * | 0.1104 *** | 0.8526 *** |
| (0.7342) | (0.0379) | (0.0566) | |
| Indonesia | 3.2268 ** | 0.1069 ** | 0.7950 *** |
| (1.4450) | (0.0516) | (0.0904) | |
| Myanmar | 0.0627 | −0.0387 * | 1.0330 *** |
| (0.4969) | (0.0220) | (0.0350) | |
| Mexico | 5.2983 *** | 0.1408 ** | 0.6878 *** |
| (1.3333) | (0.0610) | (0.0945) | |
| Pakistan | 9.3798 *** | 0.0645 * | 0.5593 *** |
| (3.1539) | (0.0347) | (0.1461) | |
| Philippines | 0.3072 | 0.0392 | 0.9540 *** |
| (0.7158) | (0.0364) | (0.0562) | |
| UK | 2.2369 ** | 0.0295 | 0.8993 *** |
| (0.9385) | (0.0444) | (0.0551) |
Note: This table presents the results of time-series analyses for the remittance–nominal GDP nexus in the top emigrating countries. The table reports the constant, Beta-adjusted (), and gamma coefficients. Standard errors are in brackets “(…)”. ***, **, * indicate 1%, 5%, and 10% statistical significance, respectively.
Table 5.
Country-specific results [real GDP–remittance].
| Country | Constant | Gamma | |
|---|---|---|---|
| Bangladesh | 2.2613 ** | −0.0029 | 0.9114 *** |
| (0.9811) | (0.0071) | (0.0391) | |
| China | 0.8581 | 0.0200 ** | 0.9583 *** |
| (2.0201) | (0.0091) | (0.0769) | |
| Egypt | 0.0453 | −0.0067 | 1.0058 *** |
| (0.1836) | (0.0057) | (0.0108) | |
| Germany | 3.2638 *** | 0.0174 | 0.8729 *** |
| (1.1459) | (0.0111) | (0.0474) | |
| India | 1.4077 ** | 0.0375 ** | 0.9191 *** |
| (0.5793) | (0.0170) | (0.0349) | |
| Indonesia | 1.2698 | 0.0130 | 0.9442 *** |
| (0.9615) | (0.0131) | (0.0453) | |
| Myanmar | 0.1985 | 0.0036 | 0.9914 *** |
| (0.4329) | (0.0096) | (0.0240) | |
| Mexico | 3.2521 | 0.0265 | 0.8601 *** |
| (1.9912) | (0.0234) | (0.0913) | |
| Pakistan | 0.7607 ** | 0.0115 | 0.9623 *** |
| (0.3654) | (0.0070) | (0.0194) | |
| Philippines | 0.7730 | 0.0250 | 0.9494 *** |
| (0.6430) | (0.0148) | (0.0366) | |
| UK | 10.6208 *** | 0.0312 * | 0.5999 *** |
| (4.0250) | (0.0171) | (0.1527) |
Note: This table presents the results of time-series analyses for the remittance–real GDP nexus in the top emigrating countries. The table reports the constant, Beta-adjusted (), and gamma coefficients. Standard errors are in brackets “(…)”. ***, **, * indicate 1%, 5%, and 10% statistical significance, respectively.
Table 6.
Country-specific results [nominal GDP per capita–remittance].
| Country | Constant | Gamma | |
|---|---|---|---|
| Bangladesh | −0.8194 *** | 0.0601 *** | 0.9344 *** |
| (0.2379) | (0.0197) | (0.0354) | |
| China | 0.0683 | 0.0496 * | 0.8277 *** |
| (0.4855) | (0.0245) | (0.0811) | |
| Egypt | −0.7454 | 0.0611 | 0.9186 *** |
| (0.7007) | (0.0474) | (0.0677) | |
| Germany | 0.3669 | 0.0759 ** | 0.7986 *** |
| (0.3379) | (0.0367) | (0.0721) | |
| India | −1.2385 *** | 0.0970 *** | 0.8479 *** |
| (0.4098) | (0.0318) | (0.0583) | |
| Indonesia | −0.4066 | 0.0969 ** | 0.7802 *** |
| (0.4756) | (0.0463) | (0.0951) | |
| Myanmar | 0.6029 ** | −0.0374 * | 1.0349 *** |
| (0.2523) | (0.0220) | (0.0376) | |
| Mexico | 0.5137 | 0.1034 ** | 0.6738 *** |
| (0.5207) | (0.0501) | (0.0992) | |
| Pakistan | 1.1070 * | 0.0828 ** | 0.5162 *** |
| (0.6489) | (0.0360) | (0.1419) | |
| Philippines | −0.4587 | 0.0371 | 0.9482 *** |
| (0.3314) | (0.0288) | (0.0604) | |
| UK | 0.5532 | 0.0366 | 0.8721 *** |
| (0.5830) | (0.0459) | (0.0637) |
Note: This table presents the results of time-series analyses for the remittance–nominal GDP per capita nexus in the top emigrating countries. The table reports the constant, Beta-adjusted (), and gamma coefficients. Standard errors are in brackets “(…)”. ***, **, * indicate 1%, 5%, and 10% statistical significance, respectively.
Table 7.
Country-specific results [real GDP per capita–remittance].
| Country | Constant | Gamma | |
|---|---|---|---|
| Bangladesh | −0.2235 *** | 0.0145 ** | 0.9908 *** |
| (0.0313) | (0.0058) | (0.0185) | |
| China | 0.3712 | 0.0236 ** | 0.8876 *** |
| (0.4809) | (0.0093) | (0.0844) | |
| Egypt | 0.0746 | −0.0091 | 1.0195 *** |
| (0.0835) | (0.0058) | (0.0203) | |
| Germany | 1.0331 ** | 0.0206 | 0.8576 *** |
| (0.3820) | (0.0129) | (0.0597) | |
| India | −0.1279 | 0.0327 ** | 0.9118 *** |
| (0.1058) | (0.0144) | (0.0398) | |
| Indonesia | 0.3221 | 0.0126 | 0.9275 *** |
| (0.2254) | (0.0112) | (0.0555) | |
| Myanmar | 0.0268 | 0.0049 | 0.9894 *** |
| (0.0992) | (0.0095) | (0.0267) | |
| Mexico | 2.8093 *** | 0.0339 ** | 0.6031 *** |
| (1.0124) | (0.0159) | (0.1492) | |
| Pakistan | 2.0075 *** | 0.0165 ** | 0.6552 *** |
| (0.6563) | (0.0067) | (0.1014) | |
| Philippines | −0.0309 | 0.0204 * | 0.9452 *** |
| (0.1822) | (0.0102) | (0.9452) | |
| UK | 0.6384 * | 0.0065 | 0.9272 *** |
| (0.3416) | (0.0158) | (0.0552) |
Note: This table presents the results of time-series analyses for the remittance–real GDP per capita nexus in the top emigrating countries. The table reports the constant, Beta-adjusted (), and gamma coefficients. Standard errors are in brackets “(…)”. ***, **, * indicate 1%, 5%, and 10% statistical significance, respectively.
Disclaimer/Publisher’s Note: The statements, opinions and data contained in all publications are solely those of the individual author(s) and contributor(s) and not of MDPI and/or the editor(s). MDPI and/or the editor(s) disclaim responsibility for any injury to people or property resulting from any ideas, methods, instructions or products referred to in the content. |
© 2024 by the authors. Licensee MDPI, Basel, Switzerland. This article is an open access article distributed under the terms and conditions of the Creative Commons Attribution (CC BY) license (https://creativecommons.org/licenses/by/4.0/).
Share and Cite
MDPI and ACS Style
Oyadeyi, O.O.; Adediran, I.A.; Kabir, B.A. Remittance and Macroeconomic Performance in Top Migrating Countries. Soc. Sci. 2024, 13, 239. https://doi.org/10.3390/socsci13050239
AMA Style
Oyadeyi OO, Adediran IA, Kabir BA. Remittance and Macroeconomic Performance in Top Migrating Countries. Social Sciences. 2024; 13(5):239. https://doi.org/10.3390/socsci13050239
Chicago/Turabian StyleOyadeyi, Olajide O., Idris A. Adediran, and Balikis A. Kabir. 2024. "Remittance and Macroeconomic Performance in Top Migrating Countries" Social Sciences 13, no. 5: 239. https://doi.org/10.3390/socsci13050239
Note that from the first issue of 2016, this journal uses article numbers instead of page numbers. See further details here.