Article

Banishment in Public Housing: Testing an Evolution of Broken Windows

1
Department of Sociology, Louisiana State University, Baton Rouge, LA 70803, USA
2
Department of Behavioral Sciences, City University of New York, York College, Jamaica, NY 11451, USA
3
Department of Sociology, Virginia Tech, Blacksburg, VA 24060, USA
*
Author to whom correspondence should be addressed.
Soc. Sci. 2016, 5(4), 61; https://doi.org/10.3390/socsci5040061
Submission received: 9 June 2016 / Revised: 27 September 2016 / Accepted: 8 October 2016 / Published: 14 October 2016

Abstract

:
Banishment policies grant police the authority to formally ban individuals from entering public housing and arrest them for trespassing if they violate the ban. Despite its widespread use and the social consequences resulting from it, an empirical evaluation of the effectiveness of banishment has not been performed. Understanding banishment enforcement is an evolution of broken windows policing, this study explores how effective bans are at reducing crime in public housing. We analyze crime data, spanning the years 2001–2012, from six public housing communities and 13 surrounding communities in one southeastern U.S. city. Using Arellano-Bond dynamic panel models, we investigate whether or not issuing bans predicts reductions in property and violent crimes as well as increases in drug and trespass arrests in public housing. We find that this brand of broken windows policing does reduce crime, albeit relatively small reductions and only for property crime, while resulting in an increase in trespass arrests. Given our findings that these policies have only a modest impact on property crime, yet produce relatively larger increases in arrests for minor offenses in communities of color, and ultimately have no significant impact on violent crime, it will be important for police, communities, and policy makers to discuss whether the returns are worth the potential costs.

1. Introduction

The broken windows theory of crime suggests that physical disorder in neighborhoods leads to social disorder and eventually serious crime [1]. In efforts to reduce serious crime, proponents of the theory have developed a broken windows policing strategy, which was made famous by New York City’s “quality-of-life policing” strategy [2,3]. Broken windows policing targets low-level misdemeanor crimes to prevent serious crime [4,5]. While the effectiveness of the strategy has been debated and its use is controversial (see [6]), within public housing, an evolution of broken windows policing has made its way into the lives of residents through a process of legal banishment. Banishment policies grant police the authority to formally prohibit individuals from entering public housing properties and arrest them for trespassing if they then violate the ban.
Public housing agencies (PHAs) justify banishment by arguing that it is a strategy for reducing serious crime in public housing. In addition to attempting to stymie social disorder through the issuing of formal bans, this policy grants police the opportunity to more easily control drug possession and potential sales since banned individuals can be arrested for trespassing and subsequently searched if they enter public housing. In this way, banishment serves two purposes for police: it allows them to remove potential criminals and makes it easier to enforce drug laws.
Despite the widespread use of banishment policies (see [7]) and the evaluation of policing efforts in public housing [8,9,10,11,12,13,14,15,16], an empirical evaluation of the impact of banishment on reducing crime or making drug arrests has not been performed. This study is the first to explore the effect these bans have on crime and drug arrests in public housing. As will be explained below, this strategy, which has been shown to be disproportionately used in disenfranchised communities [17], empowers the police [7] and can result in citizens being permanently excluded from spaces even if they have been invited. The result of these policies can have serious social consequences for the banned individuals, their families, and the communities in which it is used. Given the potential social costs, understanding the effectiveness of banishment enforcement in public housing is therefore critical. Thus, the current study adds to the extant literature on broken windows policing broadly, the policing of public housing generally, and banishment in public housing specifically.
More precisely, we extend on the work done by Torres [18] which investigated the perceived effectiveness of banishment and police in Kings Housing Authority (KHA) and found that public housing residents are more likely to find banishment and police effective if they trusted the police. Notwithstanding the significance of perceptions toward banishment’s effectiveness, we turn our attention here to address whether issuing bans predicts reductions in property and violent crimes in KHA.1 We also explore whether issuing bans predicts increases in drug and trespass arrests. We rely on crime data from 19 communities in one southeastern U.S. city: six public housing communities and 13 surrounding communities. We find that this brand of broken windows policing does work to reduce crime, albeit relatively small reductions and only for property crime. Furthermore, we find that banishment results in an increase in trespass arrests. Both of these findings raise questions about whether or not PHAs and police departments should continue to use banishment. On the one hand, banishment has been shown to modestly reduce property crime. However, it generates a significant increase in trespass arrests, which brings into question its usefulness as a deterrent, increases the number of low level arrests in neighborhoods that are disproportionately composed of people of color, and does not significantly reduce violent crime.

2. Background

2.1. Banishment in Public Housing

In the wake of the War on Drugs and specifically the Anti-Drug Abuse Act of 1988, PHAs took considerable measures to stem the proliferation of drugs and violence within their communities.2 One logical strategy was banishment or “no-trespass policies” [20,21,22,23]. Under banishment policies, PHAs can ask their local police department to warn nonresidents that they may be banned if they engage in criminal and civil behaviors, past or present, that PHAs consider worthy of banishment. Banned persons are placed on a no-trespass list maintained by PHAs or police. Once banned, individuals found on the property can be arrested for trespassing [18,21,22,23]. For an idea of how critical PHAs have felt that banishment is vital to crime suppression, a survey of PHAs was conducted in 2003 by the Council of Large Public Housing Authorities, the National Association of Housing and Redevelopment Officials, and the Public Housing Authorities Directors Association. Results from the survey indicate that 85 percent (307 out of 368) of PHAs had adopted no-trespass policies, 97 percent had adopted these policies “in whole or in part as a measure to protect residents from crime or illegal drugs,” and over 98 percent felt that no-trespass policies were “essential to controlling crime and drugs in [their] developments” (as cited in [20]).
The re-emergence of banishment policies grew as cities took measures to combat social disorder through civility codes. During the 1960s and 1970s, vagrancy statutes were invalidated by the Supreme Court due to their racially biased enforcement and vague interpretation that led to wide discretion in vagrancy enforcement [24,25]. In the 1980s, with police departments feeling the need for a law enforcement response to social disorder, courts responded in support of the police through the enactment of civility codes. Instead of the vague loitering and vagrancy statutes of the 1960s and 1970s, newly established civility codes required localities to specify the exact behaviors that can result in an arrest [7]. Through civility codes, police can now target the socially undesirable, such as homeless or publicly intoxicated individuals, by enforcing codes that outlaw their behaviors (e.g., public urination, sleeping on a park bench, panhandling).
Banishment in public housing is based on the enforcement of such civility codes by codifying into PHA policy the prohibition of specific civil and criminal acts, past or present, that when observed by PHA officials and law enforcement can result in banishment and potentially an arrest for trespassing. Due to civility codes, the banning of non-residents by PHAs follows strict guidelines that have been specifically detailed. While many initial banishment policies in public housing failed to delineate the behaviors that could qualify for banishment, the courts did not abolish banishment altogether in cases that questioned the legality of banishment stops—they simply required PHAs to specify the criteria for banishment [26].
Despite these court mandates, the current criteria for banning in PHAs sometimes involve vague, broad, and numerous acts, allowing the possibility for any non-resident to get banned [21]. For example, the following reasons, taken from publicly available PHA banishment policies, have been cited for instituting bans: having no legal right or legitimate purpose to be on the property; not being an invited guest of a resident; having a prior criminal history; engaging in activities that interfere with the quiet and peaceful enjoyment of residents; and involvement in drug activity or violence on public housing property [27,28,29,30]. Not surprisingly, the ability of these policies to ban nearly anyone has received much criticism from scholars [7,17,21,31]. However, since such policies are civil in nature they are beyond judicial review [32].

2.2. Policing and Banishment in Kings Housing Authority

The following section describes how KHA is policed and the creation of its banishment policy. It is drawn from the Torres [18] study since both studies use the same PHA. This information is based on KHA’s banishment policy and a face-to-face interview with a local police Captain overseeing KHA [33]: As Torres ([18], pp. 4–6) states:
  • Enforcement of banishment and use of community policing in KHA was a process dating to 1995 when the local police department adopted its own KHA community policing initiative. After a department-wide request for officers to participate, eight were chosen and each assigned to one of the eight neighborhoods. One sergeant heads the KHA community policing unit and reports to a precinct captain, bypassing a lieutenant. KHA public housing officers (PHOs) have no assigned shifts and are given their own discretion as to how they want to fulfil their required work hours. However, supervisors strongly encourage PHOs to work hours typically associated with higher levels of crime (i.e., nights and weekends), and PHOs are encouraged to work longer than the department minimum eight-and-a-half hour shift.
  • KHA’s community policing crime enforcement strategy extends beyond assigned communities and flexible schedules. PHOs utilize geographic crime statistics to report to their sergeant about trends and patterns of crime within their assigned neighborhoods. The crime statistics are also used for follow-up investigations with residents, to problem-solve emerging criminal issues, and to establish responsibility for a PHOs community. When on the street, PHOs are also given discretion as to how they choose to patrol: vehicle patrol, bicycle patrol, or foot patrol. PHOs are expected to handle only calls for service in public housing and nowhere else during their shifts. Finally, PHOs are given work cell phones, provided by KHA, to allow for residents to call them for non-emergencies.
  • KHA PHOs work closely with KHA security and KHA property managers as well. First, when either of these parties encounters residents violating their lease or involved in crime, an Incident Report is generated and communicated amongst these groups. Should non-PHOs encounter lease violations or crime among residents while PHOs are not available, they may communicate the issue with the appropriate PHO who would determine if an Incident Report is necessary. KHA property managers then hold monthly grounds to appear (GTA) meetings with residents involved in Incident Reports. During GTA meetings, KHA security, KHA property managers, and PHOs all collectively review the incident with the resident to determine whether some action against the resident will be taken. The possible actions range from a warning to lease cancellation.
  • During the early years of the community policing program in KHA, PHOs concluded that the majority of the problems plaguing their neighborhoods involved non-residents [33]. Through guidance of the local judge, PHOs were able to establish the initial criteria to begin its enforcement of trespassing, to include: posting visible no-trespass signs; giving a warning to a non-resident on their first encounter; having prior knowledge a non-resident has been given warning before arresting them for trespassing; [and warning residents that the KHA PHOs would begin enforcing banishment] [33]. It was not until suspects began to contest trespassing charges, stating they were never issued a warning to stay off the property, that the local courts mandated the police department and KHA to begin utilizing a formal ban notice. The formal use of banishment began in 2004.
  • The procedure for issuing, maintaining, and enforcing ban notices on public housing property is similar to what has been detailed in the literature (see [21,31,34,35]). First, ‘non-residents who are discovered on any KHA property and who engage in [activities punishable by banishment] will be determined to be trespassers and will receive a written trespass notice banning them from the premises’ [36]. After an individual has been issued a ban notice, the person is then entered into a no-trespass list maintained by the police department, specifically by KHA PHOs, and updated bimonthly. If the person is caught back on the property, they can then be arrested for trespassing. While PHOs maintain full responsibility for the enforcement of banishment, non-PHOs are trained in enforcing banishment in the event PHOs are not available [33].
  • Like other cities, the criteria for banning are broad [21]. Any non-resident involved in any crime on KHA property can be banned. Non-criminal activity on the property that qualifies for banishment includes: grouping for the purpose of threatening or intimidating; ‘prior involvement of narcotic activity/violations’; not demonstrating a legitimate business or social purpose for being on the premises; and ‘engaging in any conduct which interferes with the enjoyment of the premises by adversely affecting the health safety, or welfare of residents, guests, employees, communities, and/or properties of [KHA]’ [36]. Once a ban notice is served to a non-resident, it is effective at that time and “remains in effect indefinitely” [36]. Furthermore:
    If such non-resident maintains that he or she is a guest or invitee of a resident of KHA property, a copy of this notice will also be served upon the tenant via mail, hand-delivery, or by posting it on the door at the tenant’s last known place of residence.
    [36]
  • Notification of an individual banned may also be discussed with the tenant at GTA meetings [36]. Leases may be terminated should banned individuals return to the property with the tenant’s consent or knowledge.
  • However, appealing banishment is allowed in this city under some guidelines. The head of household that the banned individual was visiting are the only person that can appeal a ban notice. An appeal process begins with the head of household contacting the head of KHA security and stating they want to appeal a ban notice [33]. Furthermore, ‘such an appeal must be in writing and filed within ten days of receipt of the ban notice’ [36]. Appeals are not applicable to: (1) any criminal activity that threatens the health, safety, or right to peaceful enjoyment of the premises of other tenants or employees of the authority; (2) any violent or drug-related criminal activity on or off the premises; (3) disputes between tenants; or (4) ‘class grievances’ [35]. Should KHA security decided to lift the ban, the head of household is notified, and KHA PHOs are advised to remove the banned individual from the ban list. Finally, while the information for appeal appears on the back of the ban notice, officers (PHOs and non-PHOs) routinely inform banned individuals verbally the steps in making an appeal when issuing ban notices [33].
The use of banishment tactics in public housing can be seen as an outgrowth of broader policing strategies. Specifically, banishment is a logical extension of broken windows policing. The next sections detail the logic of broken windows theory and the policing strategies that emerged from it, and how banishment relates to this broader tactic.

2.3. Broken Windows

In 1982, James Q. Wilson and George Kelling published an Atlantic Monthly article introducing the broken windows theory of crime. The broken windows theory of crime posits that physical disorder, such as graffiti, may not only change the physical character of an area but may lead to social disorder and ultimately to serious crime [1]. Specifically, the theory argues that serious crime may be the final outcome, because physical decay conveys to criminals that informal social controls in the area are weak as local residents become more fearful of the ensuing social disorder and withdraw from the community [1,4,37]. The theory was instrumental for a 1980s era that was synonymous with “get tough” on crime measures focused mainly on sentencing regimes [38].
While the major theoretical foundation of broken windows relies on the link between physical disorder and crime, the idea that social disorder can manifest into more serious crime became the ideology behind broken windows policing [4]. Here, law enforcement concentrates on the second aspect of broken windows, social disorder. If social disorder leads to more serious crime, then arrests should be targeted at low-level offenses that visibly convey social disorder, such as loitering, drinking in public, public urination, panhandling, and prostitution (see [39,40]). This style of policing would later take center stage in New York City during the 1990s under Mayor Giuliani and Police Commissioner William Bratton. Together they introduced an aggressive form of broken windows policing that targeted low-level misdemeanor offenses, sometimes called “quality-of-life policing” [2,4].

2.4. Banishment and Broken Windows

By allowing police to formally ban non-residents from public housing by issuing them a ban notice and arresting them for trespassing if they violate the ban, banishment theoretically expands on broken windows theory and broadens broken windows policing. Theoretically, banishment and broken windows share a concern over social disorder; however, they diverge on their understandings of what triggers social disorder. Broken windows argues that physical disorder (i.e., graffiti, broken windows, etc.) welcomes social disorder (i.e., homelessness, drinking in public, etc.). In turn, the presence of social disorder indicates to potentially dangerous criminals that policing is limited, informal social control is weak, and the community does not care. This lack of social control leads to serious crime. Thus, the causal path to crime under broken windows theory is as follows (see [1]):
Physical disorder → Social disorder → Serious crime.
Since banishment is used in a variety of spaces, its assumptions about physical disorder are not necessarily associated with instances of vandalism, graffiti, or literal broken windows.3 After all, banishment is used in areas that are now physically aesthetic, including some public housing neighborhoods.4 To understand how banishment policies reframe the broken windows theory within public housing, one must understand that public housing authorities assert that non-residents are the source of crime in public housing [18,21,22,42]. Thus, a non-resident’s mere presence in public housing conveys a “disorder” that must be addressed. The remainder of the conceptual path to serious crime remains the same. Thus, with banishment policies in public housing, the path towards crime is as follows:
Non-residents → Social disorder → Serious crime.
Banishment enforcement also expands the focus of traditional broken windows policing on aggressively enforcing low-level offenses to reduce social disorder. Traditionally, the broken windows policing strategy works as follows:
Increase in low-level offense arrests → Decrease in social disorder → Decrease in serious crime.
With banishment policing, however, since non-residents represent the source of serious crime, enforcement targets them. Under traditional broken windows policing, law enforcement would harshly enforce low-level offenses on non-residents within public housing while still allowing them to enter public housing. PHAs have instead decided to completely remove non-residents from public housing by issuing them with a formal ban notice in hopes that being banned can independently reduce social disorder and crime by preventing banned individuals from returning to public housing. As explained above, bans can be issued to anyone committing a crime on the property or anyone entering the property who is deemed by the police to have no legitimate reason to be there. As such, these broad criteria allow nearly any non-resident to be targeted for banishment, thereby ensuring the problem with non-residents is addressed. In sum, banishment, as a logical extension of broken windows policing, is based on the assertion that simply banning non-residents from public housing can reduce serious crime. Under this logic, the causal argument works as follows:
Increase in bans → Decrease in non-residents → Decrease in social disorder → Decrease in serious crime.
Incidents of social disorder are not neglected under banishment policing. Police still enforce low-level offenses, but these offenses, along with any other offense, can also lead to the additional sanction of being banned from public housing. Moreover, banishment naturally amplifies a significant type of social disorder offense: trespassing. By amplifying trespassing laws, banishment provides substantial benefits to law enforcement and expands police powers far more than traditional broken windows policing does. First, even if officers do not observe crimes on public housing property, banishment policies create reasonable suspicion that the crime of trespassing is, has, or is about to occur. If an officer observes an individual on public housing property and does not know that individual, the officer can stop the individual under reasonable suspicion that he or she is trespassing. Therefore, banishment allows police to stop and approach anyone on public housing property to inquire about their residency, under the guise of a trespass investigation [16].5 Second, should someone who is stopped not be a resident of public housing and not be previously banned, they are subject to the broad banishment criteria [21]. Third, should someone who is stopped be identified as someone who was previously banned, the person can be subject to an arrest for trespassing. Finally, providing a steadfast approach to gaining trespass arrests provides an easy way to search for guns and drugs that bypasses traditional approaches to combatting drugs and guns such as undercover buy-busts [7,17].
This expansion of police powers is important considering that the reduction of drugs and violence is one of the primary justifications PHAs provide for banishment. As might be expected, police have lauded this particular benefit afforded by banishment [7], and PHA officials and residents often support banishment as an effective means of combatting drugs (see [18,20]) because it provides additional tactics for law enforcement to penetrate the drug trade [7,16,34,44]. By granting officers the ability to arrest for trespassing, they can circumvent the need for undercover drug operations, and with search-incident-to-arrest for trespassing, they can search potential drug offenders. Figure 1 depicts how banishment works to generate drug arrests.
Under this framework, it is possible that banishment is capable of reducing both property and violent crime. There is already evidence that broken windows strategies, outside of banishment, are associated with reductions in crime [45]. While many disorder-related studies explore the relationship between some form of misdemeanor arrests and different types of crime (see [46,47]), the application of banishment works with the intention of reducing serious crime by removing non-residents. By banning individuals, PHAs believe that crime can be reduced because banned individuals will not return to the property to commit crime.
While banishment appears to have become a staple for public housing, empirical studies have been minimal. One study pointed to its racially disparate enforcement [17]. Using crime data from New York City, the authors found that the percentage of public housing residents that are black or Hispanic predicted trespass arrests, even after accounting for socioeconomic conditions, crime, and police-related variables. This is significant considering New York City has a substantial number of buildings outside public housing that allow police to arrest for trespassing. Thus, in New York City, despite the fact that many buildings are eligible for the use of no-trespass policies, trespass enforcement is overwhelmingly concentrated in public housing disproportionately populated by people of color.
Another studying of banishment policies in public housing surveyed residents to assess their perceptions of banishment’s effectiveness [18]. The results indicated that, while residents were generally favorable toward the policy, banishment enforced without the guidance of community policing can threaten police legitimacy and community trust of the police [18]. Collectively, these studies highlight that banishment has the potential to subject already disadvantaged public housing communities, specifically public housing communities of color, to a policy that other communities do not experience and that may undermine policing efforts by jeopardizing their legitimacy unless community policing strategies are also in place.
Other than these studies, an empirical evaluation of the effectiveness of banishment tactics in reducing crime has not been performed. This study is the first to explore how effective bans are at reducing violent and property crime in public housing. Under broken windows, banishment is arguably capable of reducing property and violent crime by removing people from public housing. Further, given the potential of banishment laws to generate trespass and drug arrests, we should also expect increases in these forms of arrests due to bans. The above leads us to two pairs of substantive and testable hypotheses, the first addressing the impact of bans on serious crimes, the second addressing the impact of bans on arrests:
Hypothesis 1A:
Bans significantly reduce property crime in public housing independent of the enforcement of trespass arrests and drug arrests.
Hypothesis 1B:
Bans significantly reduce violent crime in public housing independent of the enforcement of trespass arrests and drug arrests.
Hypothesis 2A:
Bans lead to an increase in trespass arrests in public housing.
Hypothesis 2B:
Bans lead to an increase in drug arrests in public housing.

3. Method

3.1. Sample

Our analyses are based on a sample of 19 neighborhoods located within a southeastern U.S. city. These neighborhoods include six public housing neighborhoods and 13 non-public housing neighborhoods. The six public housing neighborhoods represent the population of all public housing neighborhoods in the city except three elderly assisted living public housing buildings. The non-public housing neighborhoods were selected based on their proximity to the public housing communities. All non-public housing neighborhoods within a half-mile radius of the public housing communities were used. Data were collected at the neighborhood level over a 12-year period (2001–2012). Banishment policies were introduced to the city in 2004.

3.2. Measures

This study relies on data comprised of bans (2004–2012), trespass arrests, drug arrests, FBI Part I property and violent crimes, and measures of concentrated disadvantage (2001–2012). All relevant crime data were provided by neighborhood and year and came from the local police department.
Our crime models predict property crime and violent crime. Property crime is measured as the total incidents of reported Part I property crime by neighborhood and year. Similarly, violent crime is the total incidents of reported Part I violent crime by neighborhood and year. We also generated two sets of arrest models that predict drug arrests and trespass arrests. Both arrest variables are measured as the total number of each type of arrest by neighborhood and year. All crime and arrest variables came from the police department overseeing the public housing neighborhoods in this city and were log transformed to reduce positive skewness.
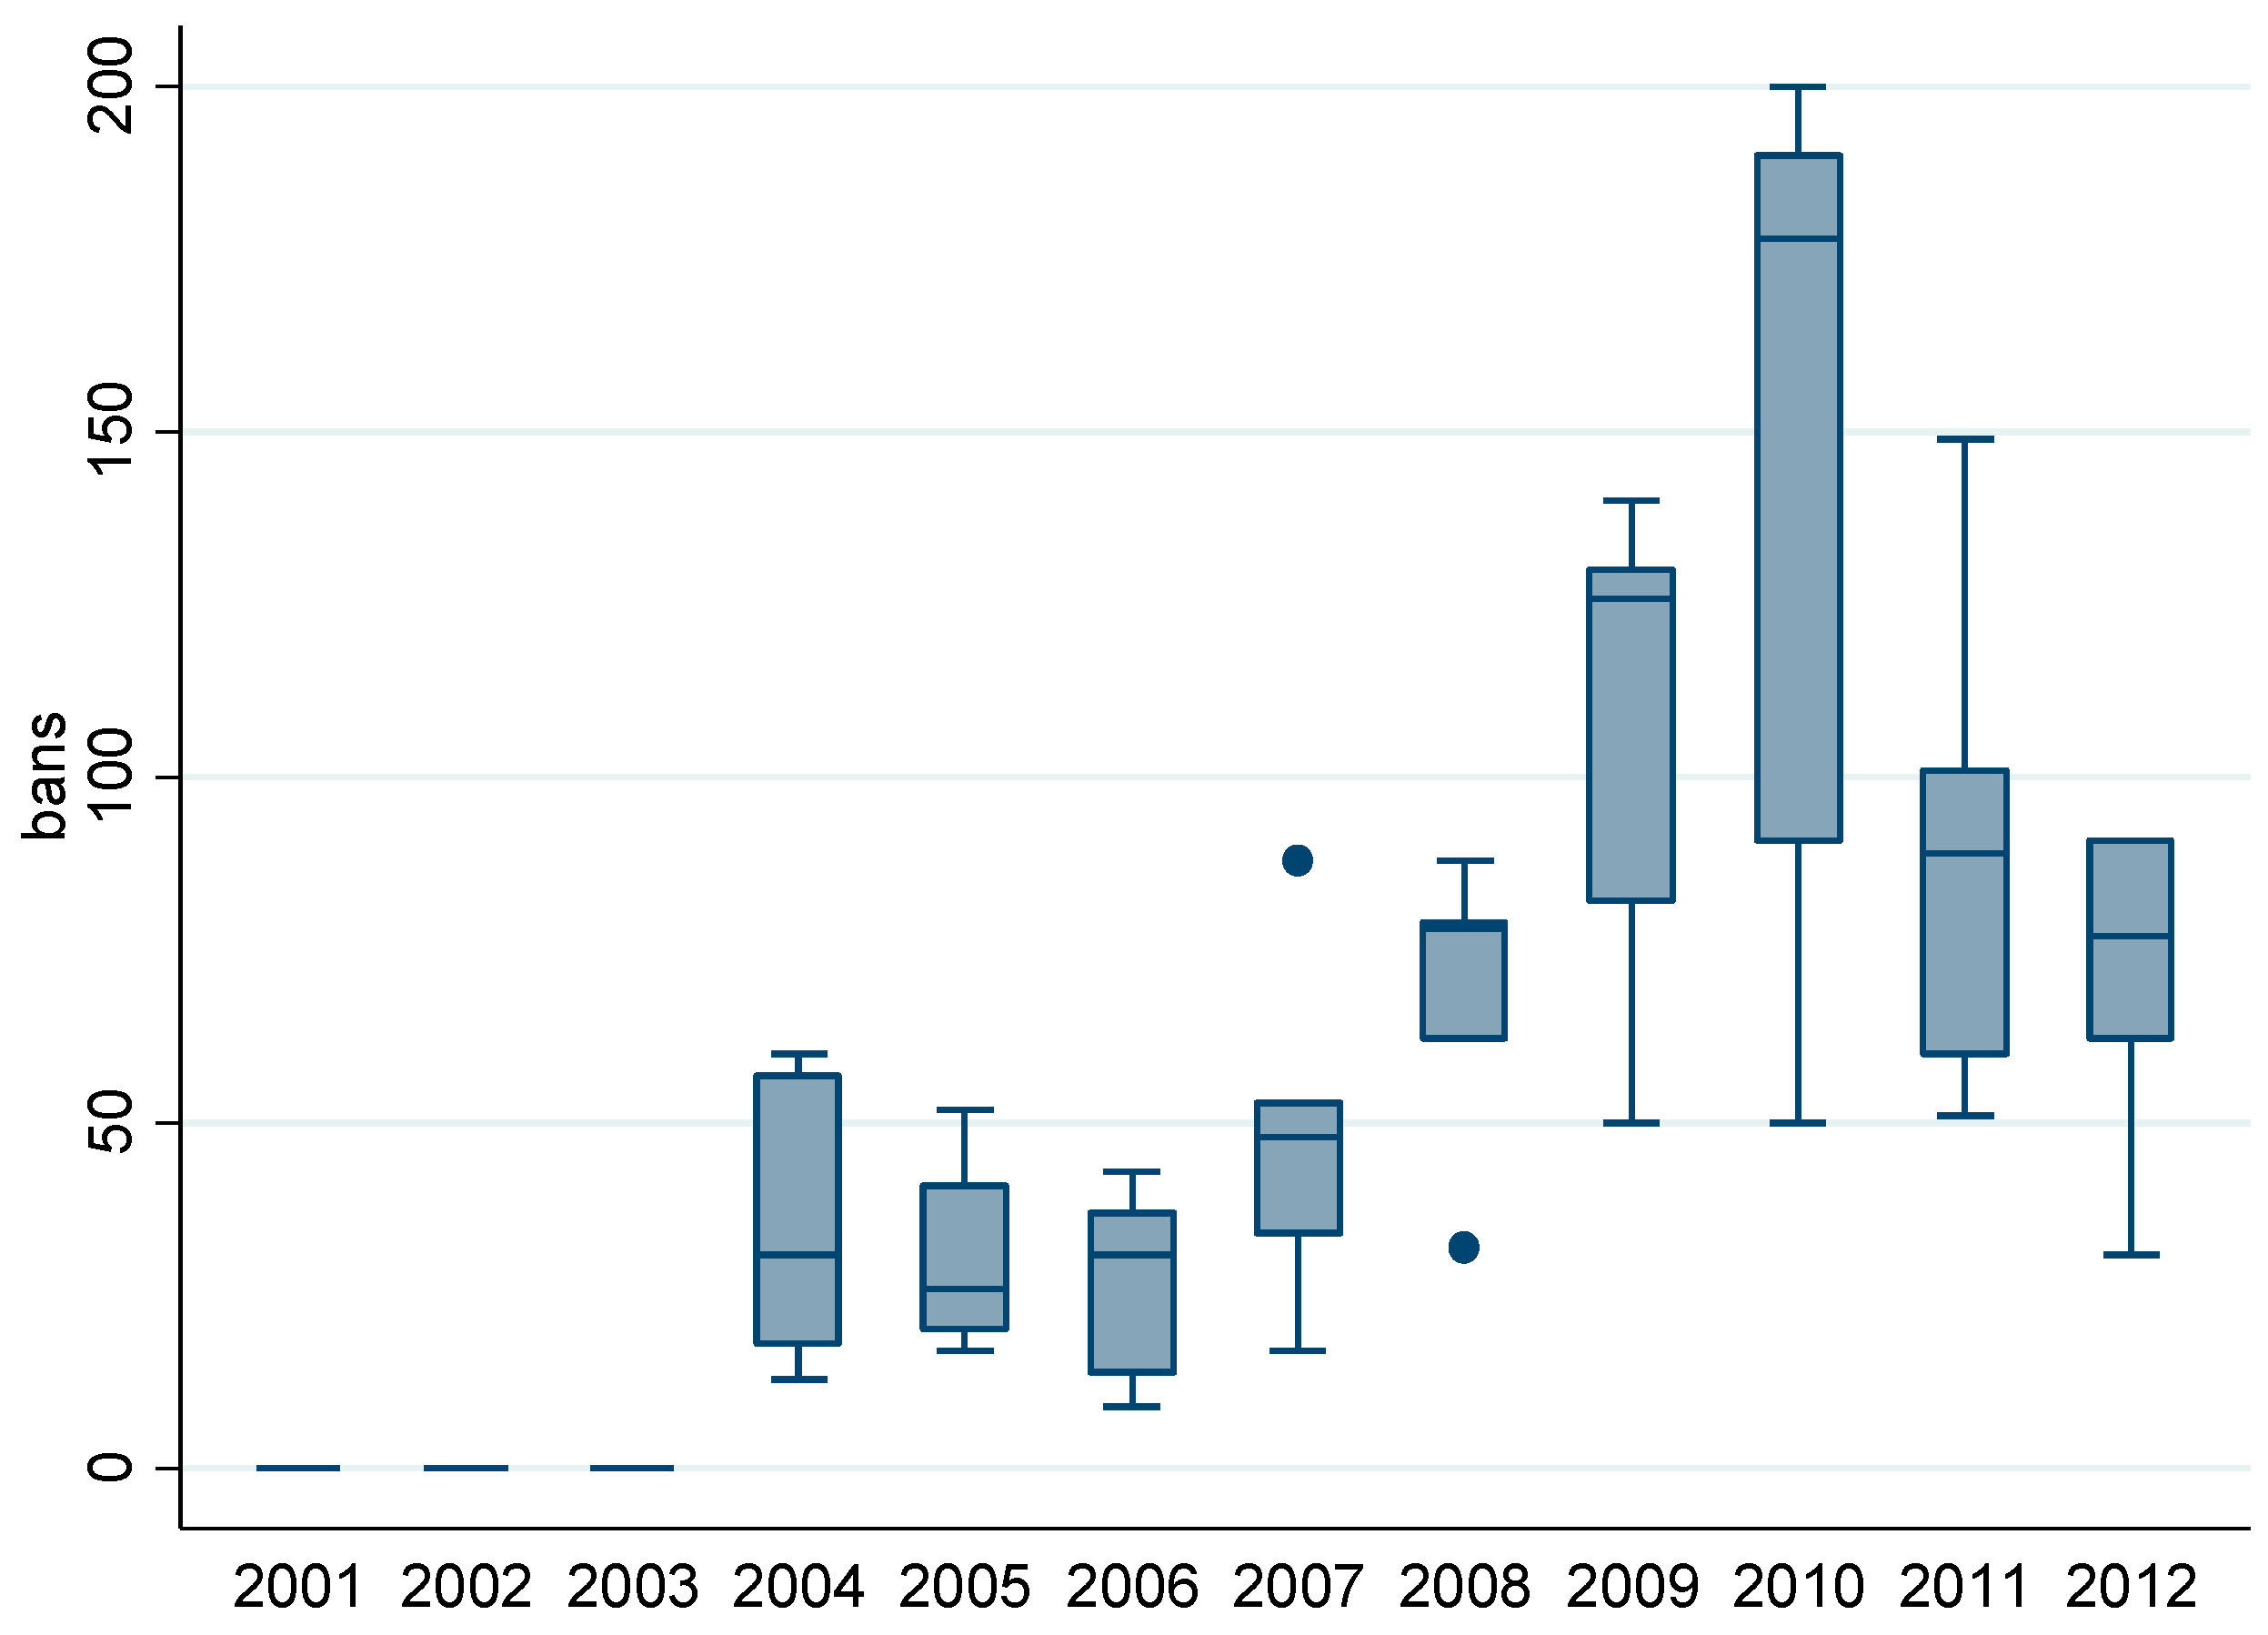
We measured the number of bans issued in public housing neighborhoods by year. Because the formal use of banishment began in 2004, ban data were collected for the years 2004 through 2012. Only bans issued within one of the six public housing neighborhoods chosen for the study were recorded. This city has various public housing neighborhoods, including assisted living developments for the elderly. Bans issued to these properties were excluded from the study, as were bans issued to a now demolished public housing property. This resulted in excluding a maximum of 13 percent of total bans in 2008 and a minimum of 1 percent in 2012. Two of the public housing communities were combined due to the inability to obtain separate socio-demographic variables for each within the 2000 Census and 2008–2012 American Community Survey 5-Year Estimates (ACS), as each survey places both communities under the same block group. This is explained by the fact that the two public housing communities are physically adjacent. For non-public housing neighborhoods, the number of bans was set to zero for all years. Bans for each public housing neighborhood by year are found in Table 1.
Our full regression models controlled for concentrated disadvantage, which refers to the geographic concentration of poverty and associated social conditions (see [48]). Concentrated disadvantage has been found to influence crime in low-income communities (see [46,47,49,50,51,52]). The following neighborhood-level socio-demographic variables were used as indicators of concentrated disadvantage: (1) median family income; (2) percentage of families with income below the poverty line; (3) percentage of population with less than a high school education; (4) percentage of households on public assistance; (5) unemployment rate; (6) percentage of female single parent households; (7) percentage of households with income below $30,000. These data came from the 2000 and 2010 U.S. Census [53,54] and the 2008–2012 American Community Survey (ACS) 5-year Estimates [55]. Since annual data for these variables could not be obtained, linear interpolation was used to generate yearly estimates. Principal component analysis was conducted to generate a component score for concentrated disadvantage using a single extracted component. Four of the variables were transformed to reduce skewness prior to extraction. The first component explained 84 percent of the joint variance and was the only component with an eigenvalue greater than one. All of the component loadings for the single component were larger than 0.74 with five of the seven loading higher than 0.90.
Ideally, a measure of neighborhood instability should be included as an additional control variable. Neighborhood instability is thought to lead to a neighborhood’s inability to police itself because of high residential turnover. Neighborhoods with more stability therefore should have lower crime rates, while neighborhoods with a more transitory population—more neighborhood change—should have greater crime and disorder because the higher rates of residential turnover disrupt social networks. There is some evidence for the association between neighborhood instability and crime (for example, see [56,57]). Typical measures of neighborhood instability such as the proportion of renters/owners and the proportion of vacant homes are problematic with our data because 100 percent of public housing residents are renters, by definition. We therefore did not use a measure of neighborhood instability given the inability to construct an efficient measure.
Table 2 presents descriptive statistics for the variables used in our models. The within neighborhood minimum and maximum values have been de-meaned (i.e., the group mean is subtracted and the grand mean is added), which is why some of the variables have negative values. We also controlled for the year of the study in our regression models.

3.3. Models

To test our hypotheses, we used sets of Arellano–Bond dynamic panel models to predict the crime and arrest variables of interest. In the full crime models, meant to test our first set of hypotheses, we separately predicted property and violent crime as a function of bans issued net of covariates. These models are beneficial when the data has more panels than years, when one or more of the explanatory variables are expected to be endogenous, and when issues of autocorrelation are likely to be present [47,58].
The following equation was used to estimate the full crime models:
Δ y i t = β 1 Δ y i , t 1 + β 2 Δ B i , t 1 + β 3 Δ C i t + β 4 Δ Y t + β 5 Δ T i , t 1 + β 6 Δ D i , t 1 + Δ u i t ,
where y i t represents the dependent variable (property or violent crime) for neighborhood i at time t , B i t is the number of bans, C i t is the concentrated disadvantage, Y t is the year, T i t is the number of trespass arrests, D i t is the number of drug arrests, u i t is the error term (composed of the unobserved neighborhood effects and the residual errors such that u i t = ν i + e i t ), and the β values are the regression coefficients. By taking first differences, the Arellano–Bond estimator eliminates the fixed unobserved neighborhood specific effects along with any endogeneity issues they might potentially introduce. To deal with issues of autocorrelation, the models use a lagged dependent variable (LDV) as well as additional lags of the dependent variable, which act as instruments to eliminate potential endogeneity introduced by the first-differenced LDV. Notice that the ban, trespass arrest, and drug arrest variables have been lagged by one time unit. We are interested in determining whether crime levels are influenced by the number of bans and amount of low-level enforcement from the previous year.
Bans, drug arrests, and trespass arrests have the same goal of reducing crime. We caution that this suggests the potential for multiple treatments at work; however, our analysis allows us to isolate the effect of each type of treatment. Both drug arrests and trespass arrests were used before the start of banishment in public housing. Since bans are set to 0 in public housing from 2001–2003 and 0 for all non-public housing sites, we are able to determine if bans influence crime, once implemented, independent of drug and trespass enforcement. It is necessary here to reiterate the uniqueness of issuing bans as a policing tool. Bans are civil punishments, not criminal punishments that prohibit individuals from returning to the property. This is a more proactive approach to deterrence than arresting individuals for committing a criminal act such as possessing drugs or trespassing. Because all of these policing tactics can potentially influence crime but do so in different fashions, we control for drug and trespass arrests so we can estimate the independent effect of bans on crime. Unlike the majority of program evaluative studies, which assume a dichotomous treatment (a ban law is either present or absent for each neighborhood in a given year), our regression models treat bans as a continuous measure that enhances precision and provides a better look at the impact of bans. If two different public housing neighborhoods for which the ban law is in effect enforce and issue bans differently, our models will capture this.
We tested Hypothesis 2A by predicting trespass arrests as a function of lagged ban variables (the equation shows only the first difference of bans as a predictor, but second, third, and fourth differences were tested as well in separate models). The following equation for the full trespass arrest model was used:
Δ T i t = β 1 Δ T i , t 1 + β 2 Δ B i , t 1 + β 3 Δ C i t + β 4 Δ Y t + Δ u i t .
Similarly, we tested Hypothesis 2B by predicting drug arrests as a function of lagged ban variables. The following equation for the full drug arrest model was used, which included lagged trespass arrest variables to determine if trespass arrests potentially mediate a relationship between bans and drug arrests:
Δ D i t = β 1 Δ D i , t 1 + β 2 Δ B i , t 1 + β 3 Δ C i t + β 4 Y t + β 5 Δ T i , t 1 + Δ u i t .
It should be noted that only two additional lags of the dependent variable were used to create instruments to avoid over-identifying the models. Though Arellano–Bond models typically use all possible lags of the dependent variable to ensure that autocorrelation is removed, tests for autocorrelation show that any autocorrelation has been sufficiently removed from our models. Also, the variance inflation factors for the variables used in our models all had values lower than three, indicating that multi-collinearity was not an issue.

4. Results

We begin by looking at the trend in bans (see Figure 2). As discussed above, bans were formally introduced in 2004 to public housing communities, but as we can see from the figure, their usage by officers varied in the decade following their introduction. The use of bans generally rose in public housing after being formally introduced in 2004, peaking in 2010.
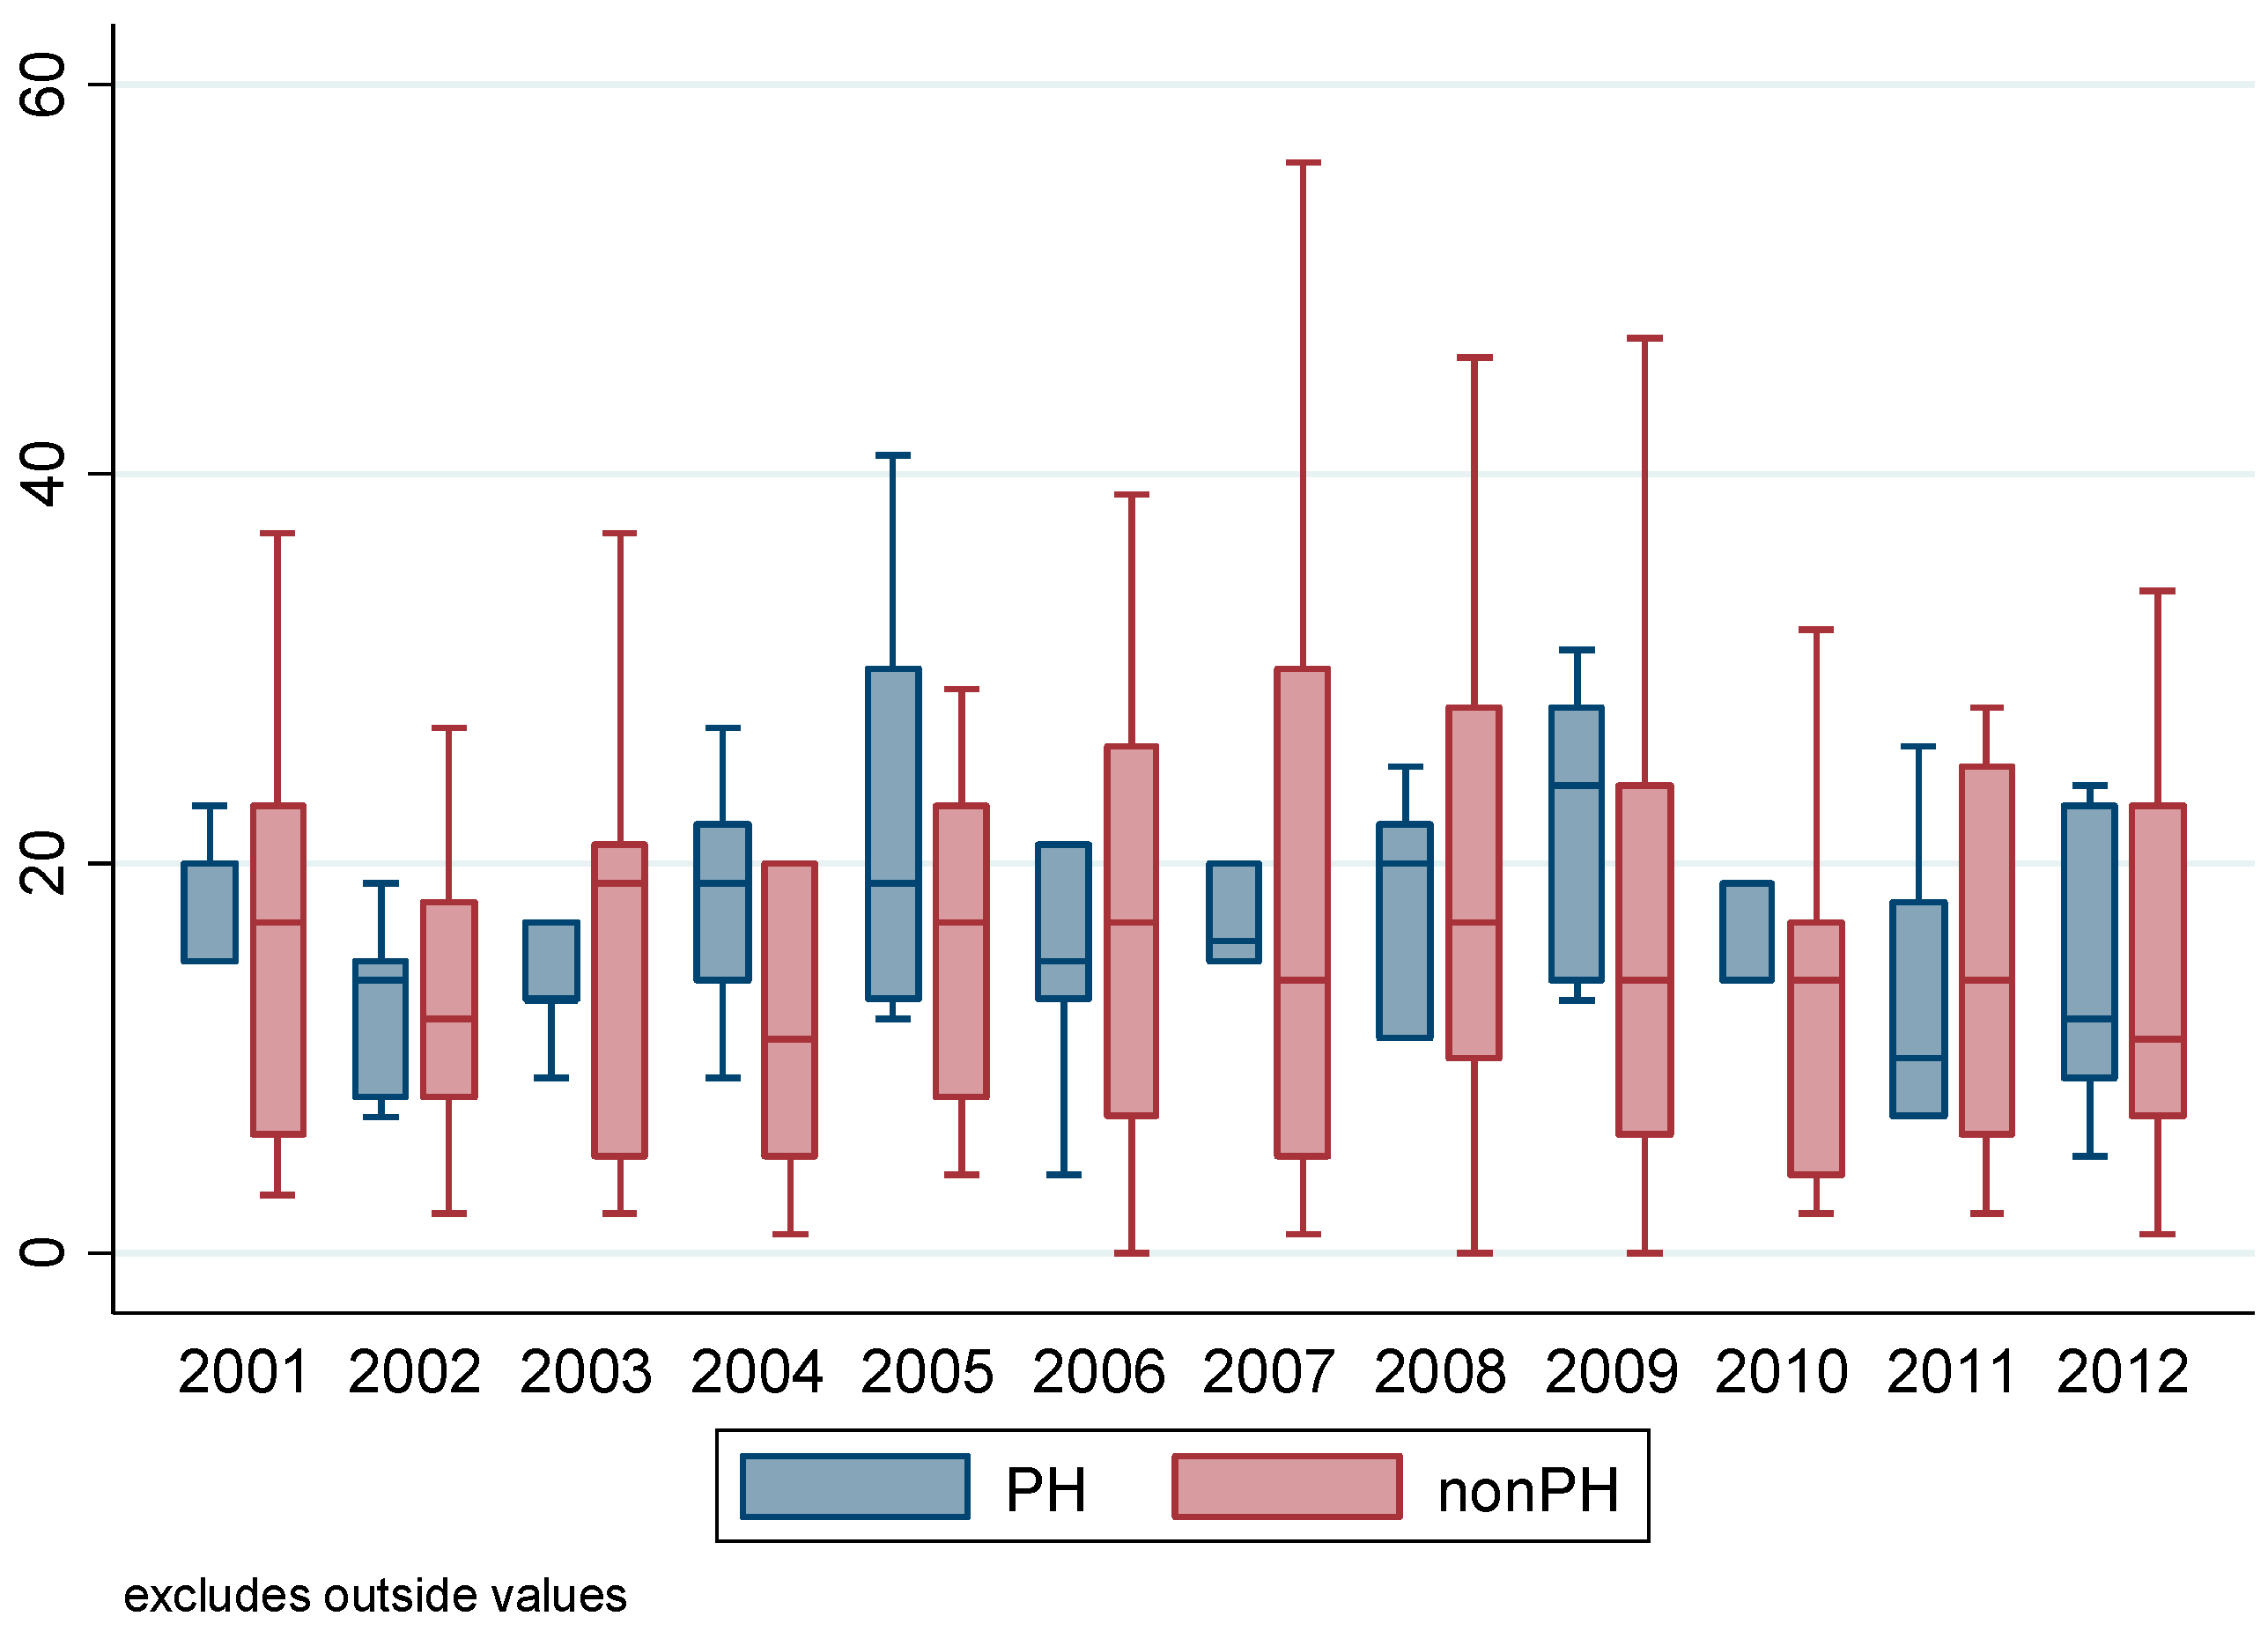
Figure 3 looks at property crimes over time in public and non-public housing communities. Though it is generally lower in public housing, it appears to have decreased in public housing in the period after 2004, especially when compared to non-public housing communities. To test if this apparent effect is significantly due to bans, we used three separate regression models presented in Table 3, all three of which are nested in the model presented as Equation (1) above.
As we can see, the number of bans issued in a given year significantly reduces property crime, even after the covariates are added. This finding supports Hypothesis 1A (additional support for H1A using the synthetic control method for counterfactual analysis can be found in Appendix A). Notice, however, that doubling the number of bans issued in a given year only reduces the number of property crimes by approximately five percent in the following year ( 2 0.076 = 0.95 ). Surprisingly, we do not find an effect of disadvantage or drug and trespass enforcement on property crime independent of the other effects. Though tests for autocorrelation show that second order and larger autocorrelated errors have been removed, it should be noted that when placebo controls were added in the form of leads of the ban variable, a significant lead effect was discovered. Models including up to four leads found that a two-year lead in bans significantly predicts a decrease in property crime. This calls into question the causal claims that can be made regarding bans and property crime. Though we find that significant independent negative correlation exists between number of bans issued and subsequent property crime with the Arellano–Bond models, we cannot claim that bans cause a reduction in property crime and not the other way around. That being said, our synthetic control models in Appendix A demonstrate that a divergence in property crime between public housing neighborhoods and a synthetic control case does occur in the expected direction after the institution of bans, supporting our causal claim from H1A.
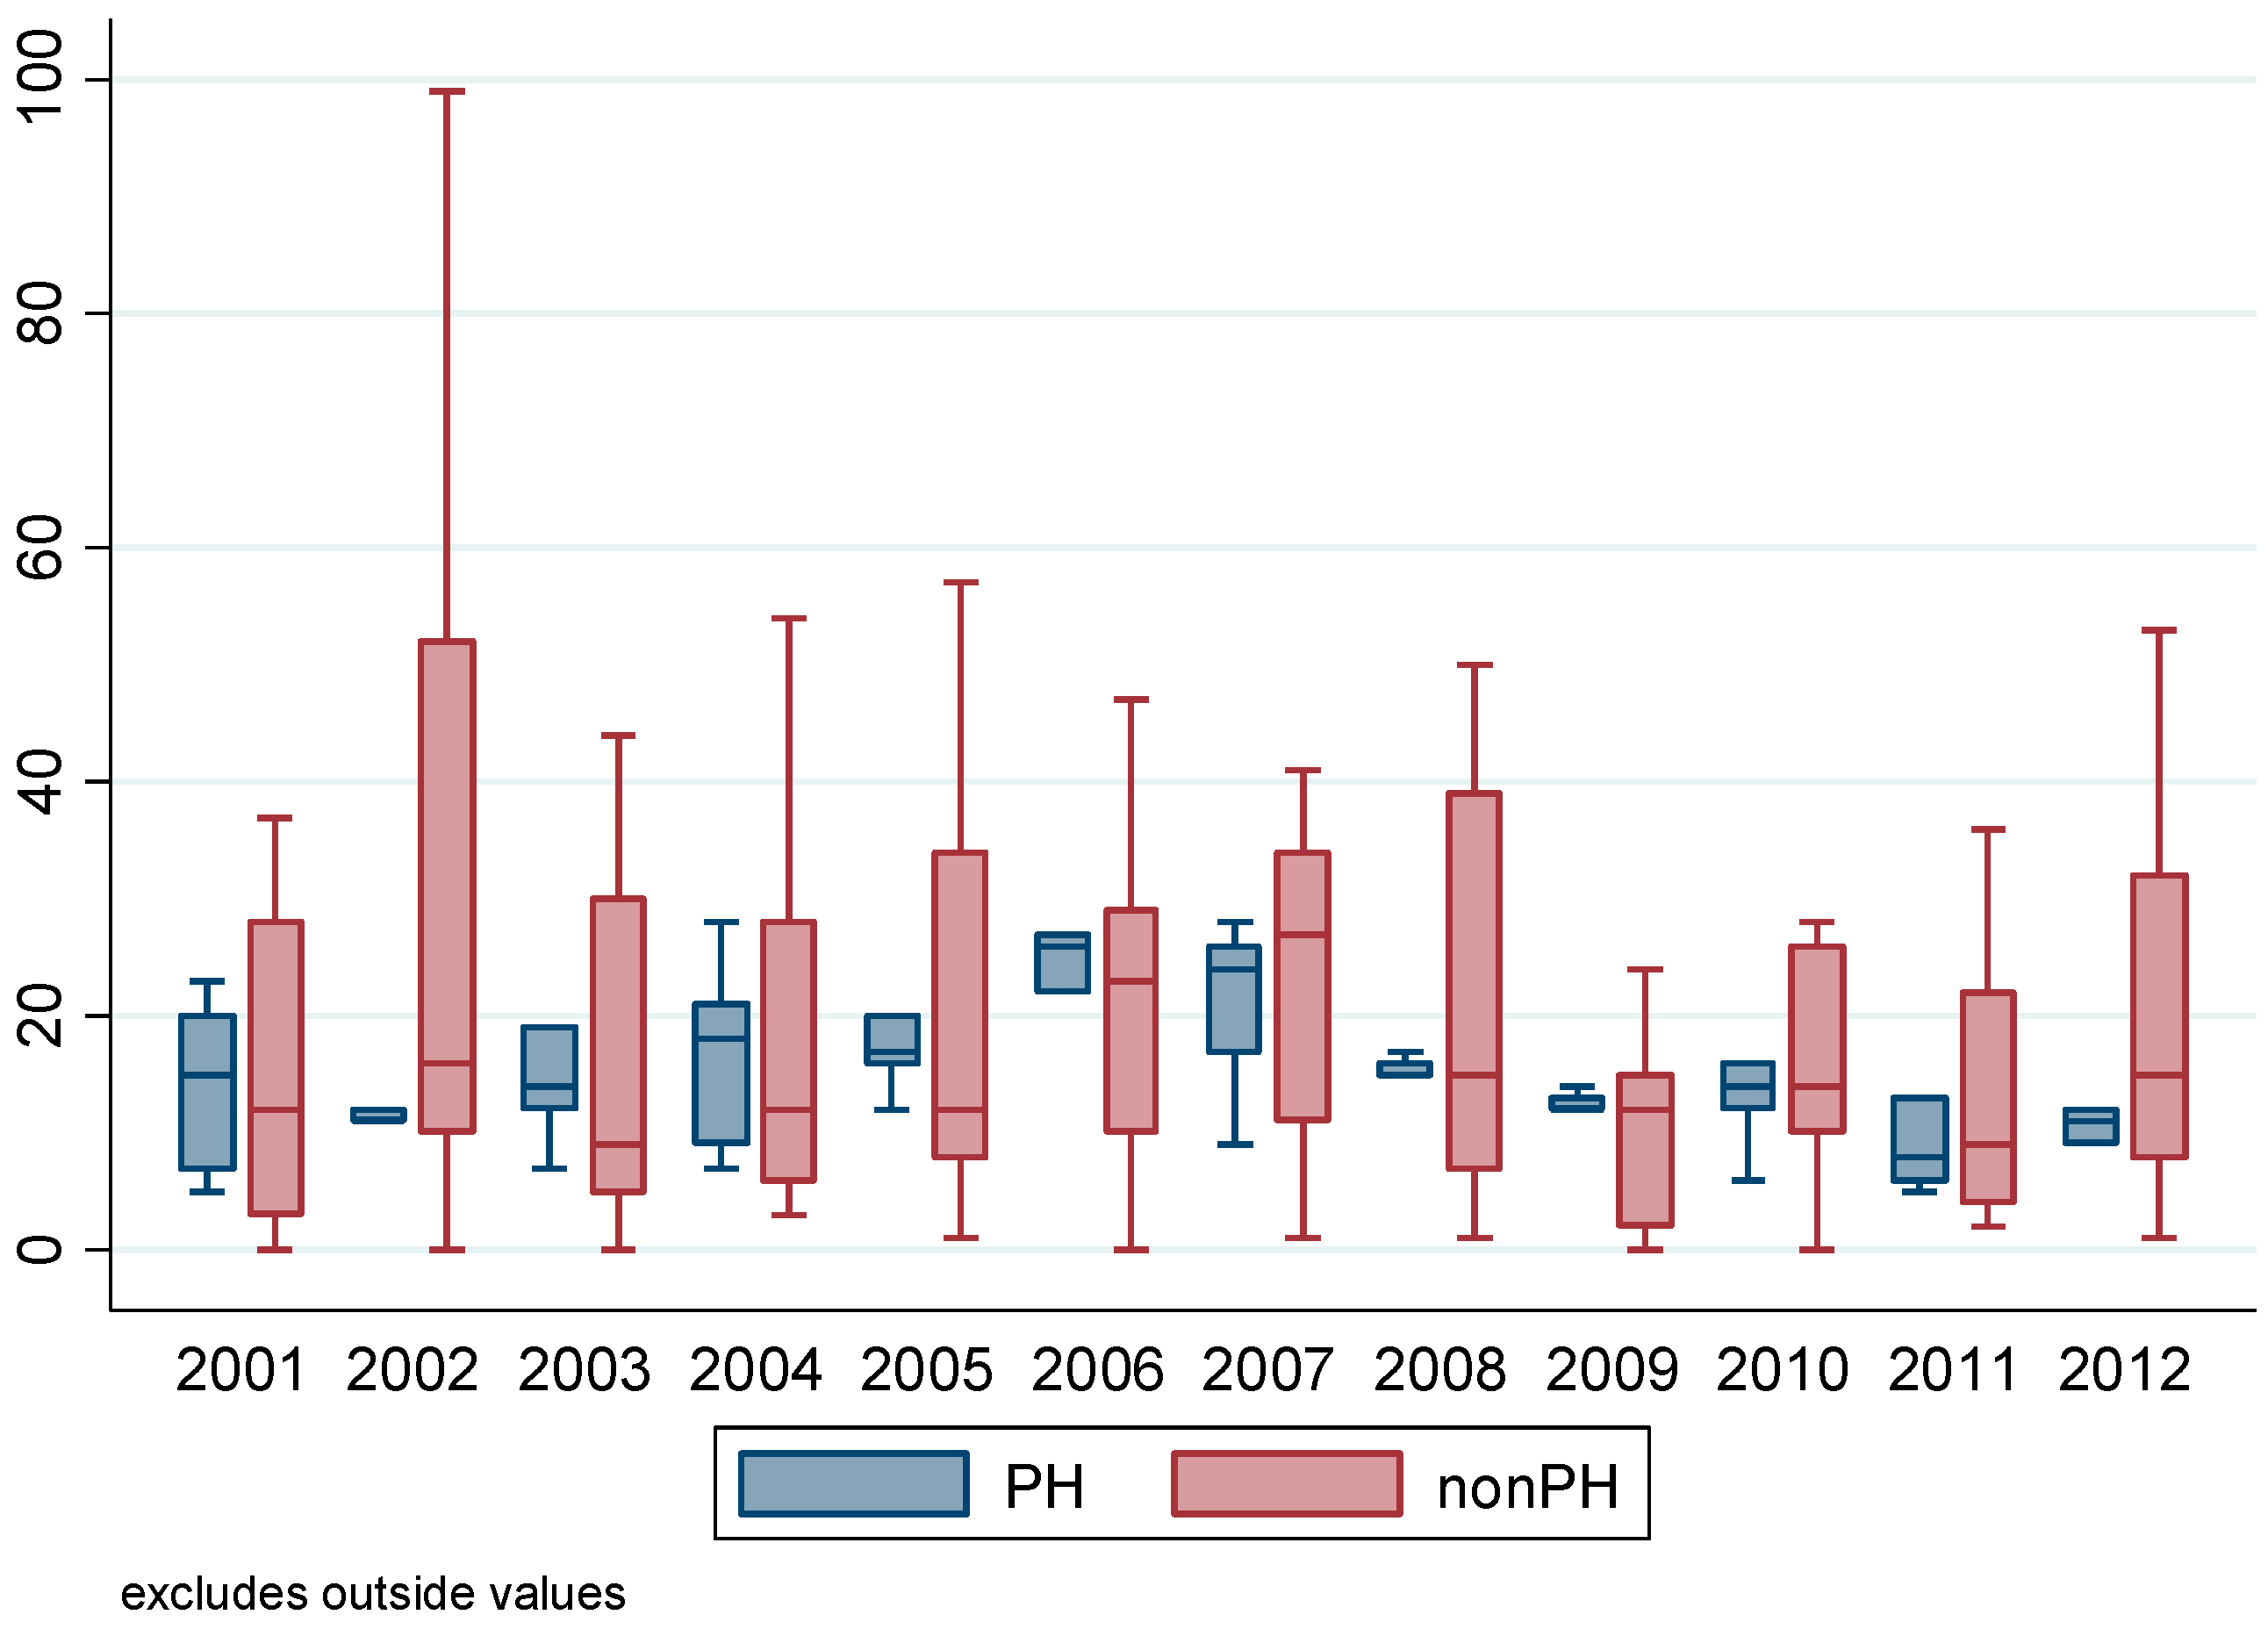
When we turn our attention to violent crime (see Figure 4), there does not appear to be an obvious trend, inside or outside of public housing, despite the general decrease in violent crime experienced by the nation as a whole during this time. Using the Arellano–Bond models to predict violent crime, we find that the number of bans in a given year does not significantly predict violent crime in the following year (or two, three, or four years later) in any of our models (see Table 4). Given this result, we do not find support for Hypothesis 1B. As it turned out, none of the variables significantly predicted violent crime in our models.
To test Hypothesis 2A, we examine trespass arrests over time. From Figure 5 we can see that trespass arrests appear to grow during the years following the institution of the ban legislation in public housing neighborhoods. The trespass arrest regression models in Table 5 demonstrate that though trespass arrests are not significantly correlated with bans in the previous year, they are significantly influenced by the number of bans two years prior, even when we account for a general independent trend of increasing trespass arrests (this relationship does not exist for other lagged ban variables: third-differenced, fourth-differenced, etc., and holds when placebo controls are added in the form of leads; no significant placebo controls were found in models including up to four leads for the ban variable). Notice that in the third model, which predicts trespass arrests using only the LDV and second differenced bans as explanatory variables, the effect of lagged bans is stronger than in the final model. The coefficient for bans is being inflated by a general trend of trespass arrests increasing over time (both in public and in non-public housing, though the trend is stronger in public housing). However, when we control for this trend, Model 4 shows that bans still have a positive significant (p < 0.10, two-tail) impact on trespass arrests. These models provide support for Hypothesis 2A (additional support can be found in Appendix A).
Finally, we examine drug arrests in Figure 6 and Table 6. Though the variability in drug arrests appears to be higher in non-public housing, according to Figure 6, there does not appear to be much of a difference between the trends across housing types, and there does not appear to be a consistent change in public housing after the institution of ban legislation. However, when we examine the Arellano–Bond regression models (see Table 6), we find that just like for trespass arrests, drug arrests are significantly influenced by the bans issued two years prior. In Model 4, which predicts drug arrests using only an LDV and second-differenced bans as explanatory variables, it appears that lagged bans do not influence drug arrests. However, this is because a suppression effect is present due to a general decrease in drug arrests over the period in these neighborhoods. Once we control for this time trend (Models 5 and 6), we see that drug arrests are significantly increased by the bans issued two years prior. Interestingly, lagged trespass arrests do not predict drug arrests independent of lagged bans. Various combinations of lagged trespass variables were included independently and together. Model 6 shows the effects of first and second-differenced trespass arrests on drug arrests in the same model, but the coefficients and standard errors are nearly identical when only one or the other is included by itself. Just like in the property crime models, we need to add a word of caution. Though tests for autocorrelation show that second order and larger autocorrelated errors have been removed, when placebo controls were added in the form of leads of the ban variable, a significant lead effect was discovered. Models including up to four leads found that a one-year lead in bans significantly predicts a decrease in drug arrests. This calls into question the findings regarding a causal relationship between bans and drug arrests given the contradiction in direction of the relationship between the significant lag and significant lead of bans. Additionally, our synthetic control models in Appendix A do not find a consistent divergence in drug arrests between public housing neighborhoods and a synthetic control case after the institution of bans. Because of these issues, we cannot conclude with confidence that there is a causal connection between bans and drug arrests in public housing.

5. Discussion

Our regression models indicate that bans negatively predict property crime. In the context of other broken windows policing strategies, such a finding adds to the research showing that policing disorder can reduce crime [45]. However, we also found that bans did not predict decreases in violent crime or drug arrests. In fact, bans appear to independently increase drug arrests in subsequent years, but we remain wary of these findings given the significance of a lead placebo control and the lack of findings using a synthetic control (see Appendix A). Despite support for bans predicting reductions in property crime, the magnitude of such reductions appear to be relatively small. Our models found that police must double the amount of bans issued to see a return of only a 5% reduction in property crime. This finding is consistent with other research such as Braga and colleagues’ [45] meta-analysis of 30 broken windows strategies, which found that such strategies tend to have modest returns.
Under deterrence and opportunity theories, reductions in property crime would not be surprising given the argument concerning how property offenders take into account the threat of sanctions [59,60,61]. If property offenders wish to offend in public housing, being banned would limit the opportunity to commit such offenses should offenders feel as though there is an increased likelihood of being caught on the property and arrested for trespassing. Still, reductions in property crime could be a function of the incarceration of a handful of offenders who committed the disproportionate share of property offenses in public housing. This would be supported by research that suggests that a small fraction of the population accounts for a very high percentage of crime [62,63,64]. Beyond incarceration, should a property offender be a resident of public housing, there would be grounds for an immediate eviction, which would remove the offender from public housing in the same manner as incarceration would. Though the significance of a placebo control (number of bans at time t+1) undermines claims to causal direction, we remain confident that a causal relationship between bans and property crime exists, especially given the supporting evidence in Appendix A.
This study did not find support for bans predicting reductions in violent crime. There are several plausible reasons for this. First, much violent crime is spontaneous and “expressive” rather than “instrumental” (see [65,66,67]). As such, one may be less likely to be deterred from violent crime by the threat of trespass arrests. In addition, assuming these neighborhoods are similar to other high-crime neighborhoods, much of the violence in these neighborhoods is likely a result of a very small percentage of residents. For example, studies have found that as little as 0.3 percent of a city’s population can account for over 60 percent of the city’s homicides (for a review, see [65]). More specifically, one study on homicides in Los Angeles public housing communities found that residents contributed more to the violence in public housing than non-residents [42]. If a few residents are contributing a significant proportion of the violence, banning outsiders might not affect violent crime. It is only when these individuals are removed from the network (either through incarceration, aging-out, or death) that violence will decrease. This insight results in the underlying logic of focused deterrence strategies. Focused deterrence strategies attempt to locate chronic violent offenders and maximize the risks of offending by providing them with incentives and disincentives [68,69]. The violent crime-reduction benefits of this tactic have been well established (see [70,71,72,73]). Not only is it possible to reduce violent crime under this approach, but police legitimacy may increase as well, as police use more procedural justice tactics in focused deterrence strategies [74].
Given the ability of bans to aid in generating drug arrests, we hypothesized that bans would increase drug arrests as it becomes easier for officers to investigate individuals on public housing property, even without probable cause for drug possession or distribution. We found mixed support for this and cannot conclude with confidence that a causal relationship between bans and drug arrests exists. While there is evidence that bans increase drug arrests in subsequent years, the fact that a two-year lead of bans is also statistically significant in our model raises doubts about the true relationship between bans and drug arrests.
Still, the results indicating that bans can lead to an increase in trespass arrests poses concern. We find that an increase in bans that leads to a 5 percent reduction in property crime the following year corresponds to an 8 percent increase in trespass arrests in two years, even though trespass arrests do not appear to reduce either property or violent crime independently. Therefore, increasing trespass arrests appear to be a necessary byproduct of ban legislation. Additionally, the high level of trespass arrests that emerge post-legislation in public housing may challenge any claims that banishment acts as a deterrent. For a policy that is intended to keep banned individuals away, the message is quite clear that many come back to public housing, whether it is to offend or not, and are arrested for trespassing. Ultimately, PHAs, police departments, and residents will have to decide whether the returns are worth the potential legal and social costs. We certainly should expect that the social consequences are most felt by banned individuals and those they know within public housing; however, these consequences should not be ignored for a number of reasons. Socially, it is well documented that banishment can disrupt families [75,76]. For example, Torres [18] found that 40 percent of public housing households know at least one friend or family member that has been arrested for trespassing. Furthermore, processing trespassing offenses can clog an already over-burdened criminal justice system. In addition, court cases dealing with banishment in public housing involve disputing the legality of banishment when it is used on those with intent to see family (see [21,31]).
Moreover, the findings of this study need to be understood in the context of who resides in these public housing communities. African-Americans make up over 97 percent of the public housing population in this study [54]. Therefore, in this southern city, communities of color are disproportionately affected by ban policies. One clear consequence of these policies is an increase in trespass arrests. It follows that policies like banishment, that operate in communities disproportionately comprised of racial and ethnic minorities, contribute to the persistent racial disparities in the criminal justice system, including imprisonment (see [38,77,78]). Thus, our findings that banishment produces only meager benefits in terms of reductions in property crimes while generating trespass and drug arrests must be considered in light of the work of Fagan and colleagues [17] that found racially selective enforcement of banishment in New York City public housing. Still, despite the already tense relationship between police and many disadvantaged communities of color, there has been evidence that even in predominantly African-American public housing communities using banishment, residents can find the police to be effective [18]. Ultimately, future studies should consider whether banishment builds or hinders collective efficacy and whether it decreases or increases fear of crime.
We should acknowledge some of the limitations of the current study. First, we want to emphasize that this study involves a limited number of neighborhoods from a single city and therefore suffers from lack of power and is sensitive to noise. We attempted to increase the power by using dynamic panel models that rely on multiple differences and by treating the stimulus (ban legislation) as a continuous variable that varies dramatically within the treatment cases (public housing neighborhoods) from panel to panel. Nevertheless, we are relying on repeated measures of a panel consisting of data from only 19 neighborhoods, and we fully recognize this limitation. Yet, maybe even surprisingly given the small sample, we find significant effects that support two of our four hypotheses. In addition, in these cases, several different analytic strategies—albeit each with their own sets of problems and limitations—produce consistent findings. Therefore, while we recognize the small sample size to be a serious limitation, we are confident these data tell an interesting and consistent story, especially with respect to the influence of bans on trespass offenses and property crimes.
Second, we did not control for spatial lag whereby contiguous areas influence adjacent areas’ levels of crime and arrests (see [46,47,79,80,81,82,83]). Spatial lags could be used to determine if bans displace crime. However, under the context of public housing, this may not be important; the goal of banishment is to keep crime out of public housing, so if crime increases in non-public housing communities as a result of banishment, it is of no concern to PHAs. However, while public housing officials may not care if banishment displaces crime, police departments do. Knowing such information may be useful in developing strategies for dealing with displacement. With that, this study could merely offer speculative support of any displacement effects. In looking at Figure 3, it appears that non-public housing neighborhoods experienced a period of increased property crime following the start of banishment. However, the average amount of property crime experienced in non-public housing neighborhoods after banishment began is not clearly above the average amount of property crime experienced by non-public housing neighborhoods before banishment began. Further, while we might expect that this displacement could vary by crime types (i.e., robbery versus aggravated assaults), we looked at additional plots (not shown) and found similar results. Thus, there were no consistent patterns of heightened levels crime in non-public housing neighborhoods following the implementation of banishment above what these neighborhoods experienced before banishment was implemented. While future studies will need to address displacement explicitly, these descriptive results suggest that banishment does not displace crime in the long term. It is possible that banishment is ineffective at totally displacing the criminally active who have ties to the public-housing community; thus, there may be some displacement, but crime is not totally displaced (see [84]). Again, we found definitive evidence that bans lead to increases in trespass arrests, which implies that a number of people are not deterred by the ban itself and return to public housing. Thus, there may be a number of offenders who are tied to the public-housing community and not willing to offend elsewhere. The literature suggests this situation would result in a lack of displacement because of the inability of potential offenders to seek alternative opportunities (see [85,86,87]) or their preference for committing offenses close to their home or previous home [88,89,90,91], which in this case would be public housing.
Third, we did not use calls-for-service, police-initiated or citizen-initiated, which could help determine both the proactivity of police officers and their visibility in the community. In a study of the consequences of assigned beats, Kane [92] found that officers on a permanent beat increase police-initiated calls-for-service. Since the studied communities have strong community policing components and community policing requires officers be accountable to their assigned beats, one would expect the studied communities to have more proactive officers and more police-initiated calls for service. Citizen-initiated calls-for-service may also be higher in public housing if residents know community police officers are likely to respond, therefore increasing police presence in public housing communities only. Still there is no reason to suspect that police visibility dramatically influenced crime levels in these neighborhoods. The neighborhoods had community policing initiatives implemented in them for years prior to enacting the banishment policy, and permanently assigned officers routinely made foot patrols in the neighborhoods. The frequency of the patrols did not increase after the banishment policy was enacted; however, the police now had a new strategy to pursue when trying to prevent crime. Finally, while PHAs may be more concerned with long-term reductions in crime that come from banishment, building models with monthly data would help solve the endogeneity issues from aggregate, within-year models and help determine the short-term effects of banishment.
Despite our limitations, this is an important first step in understanding the logic and merits of banishment in public housing. Of importance for the sake of this test of broken windows theory is that it utilized variables capturing the context of local conditions. In the case of banishment, it calls forth a civil punishment, bans, that are unique to the policy and to the site. Attempts to address crime reduction strategies where public housing communities are included must account for differences in how public housing communities are policed compared to how non-public housing communities are policed. The use of bans in this study is something exclusive to public housing, and this can only be explained by banishment.

6. Conclusions

Broken windows policing has garnered national attention since its rise in New York City in the 1990s. In a post-Ferguson society, broken windows policing has reignited debates surrounding its efficacy and constitutionality. PHAs have instituted their own style of broken windows policing, banishment, which targets non-residents by banning them and arresting them for trespassing if they violate their bans. In the first study to measure the efficacy of banishment, it was evidenced that this brand of broken windows policing does work to reduce crime, albeit relatively small reductions and only property crimes. Meanwhile, these policies generate an increase in trespass arrests that disproportionately and unintentionally affect people of color. While PHAs, police, and residents may view these the small crime control benefits as a victory, the inability of banishment to prevent people from returning to public housing, reduce violent crime, and produce observable drug control benefits must be weighed to determine whether such benefits are worth the costs.

Acknowledgments

This project was funded in part by the Center for Peace Studies and Violence Prevention at Virginia Tech.

Author Contributions

Jose Torres, Jacob Apkarian, and James Hawdon conceived and designed the experiments; Jose Torres and Jacob Apkarian performed the experiments; Jose Torres, Jacob Apkarian, and James Hawdon analyzed the data; Jose Torres, Jacob Apkarian, and James Hawdon wrote the paper.

Conflicts of Interest

The authors declare no conflict of interest.

Appendix A

In addition to Arellano–Bond dynamic panel models, we employed the synthetic control method for counterfactual analysis, which takes advantage of the discontinuity that the banishment legislation produced during our period of study. The drawbacks of this approach are that the data from the six public housing neighborhoods are averaged and treated as a single case, and that the explanatory variable of interest (bans) is treated as dichotomous despite the fact that bans were issued differently by neighborhood over time. Regardless of these limitations, this approach is an effective way to estimate the impact that bans have on our crime and arrest variables, and findings in this appendix support Hypotheses 1A and 2A.
The synthetic control method uses the control cases (the 13 non-public housing neighborhoods not subject to banishment legislation) to generate a “synthetic” control case in order to demonstrate what would have happened to our treatment case (the average across public housing neighborhoods) if it (they) had never been subject to the intervention of banishment legislation. The synthetic control case is produced using factor analysis. It is composed of a weighted average of scores on the variables relevant to the study from non-public housing neighborhoods prior to the intervention such that the synthetic case is as close to the treatment case on these variables as possible (the RMS error is minimized). The synthetic and treatment cases are assumed to be equivalent prior to the intervention, and therefore any difference occurring after the intervention is likely to have been caused by the intervention itself.
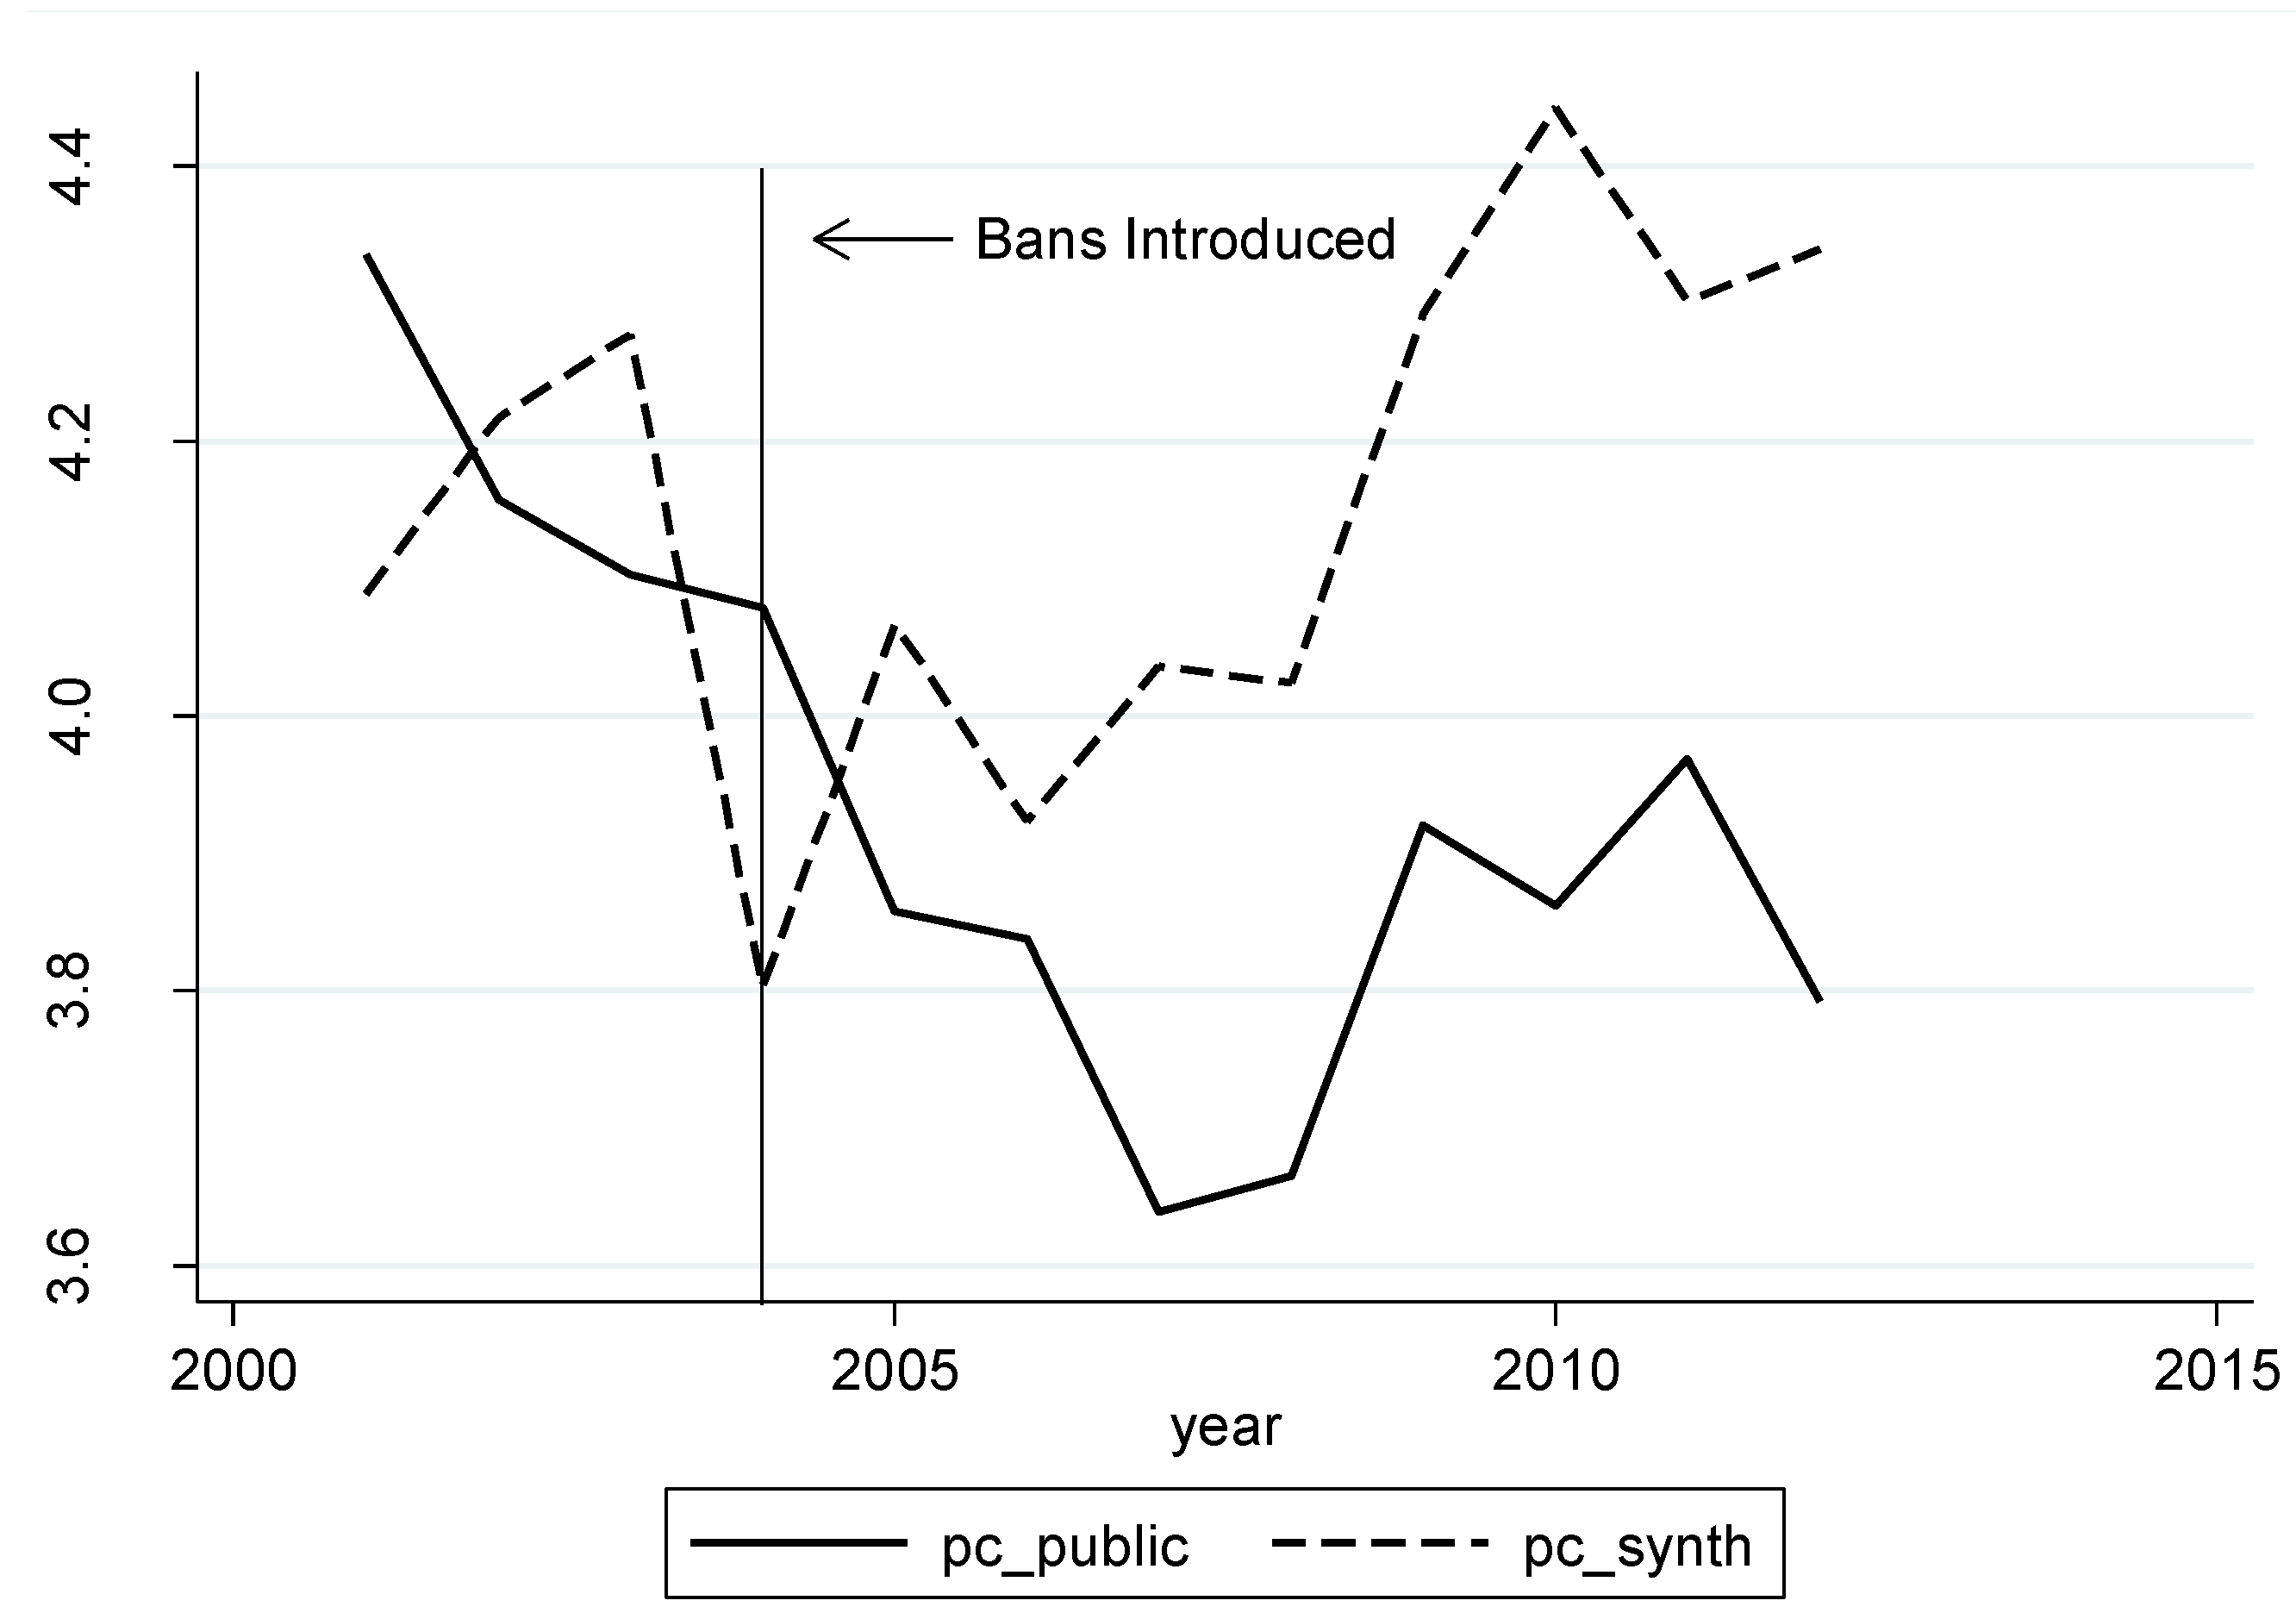
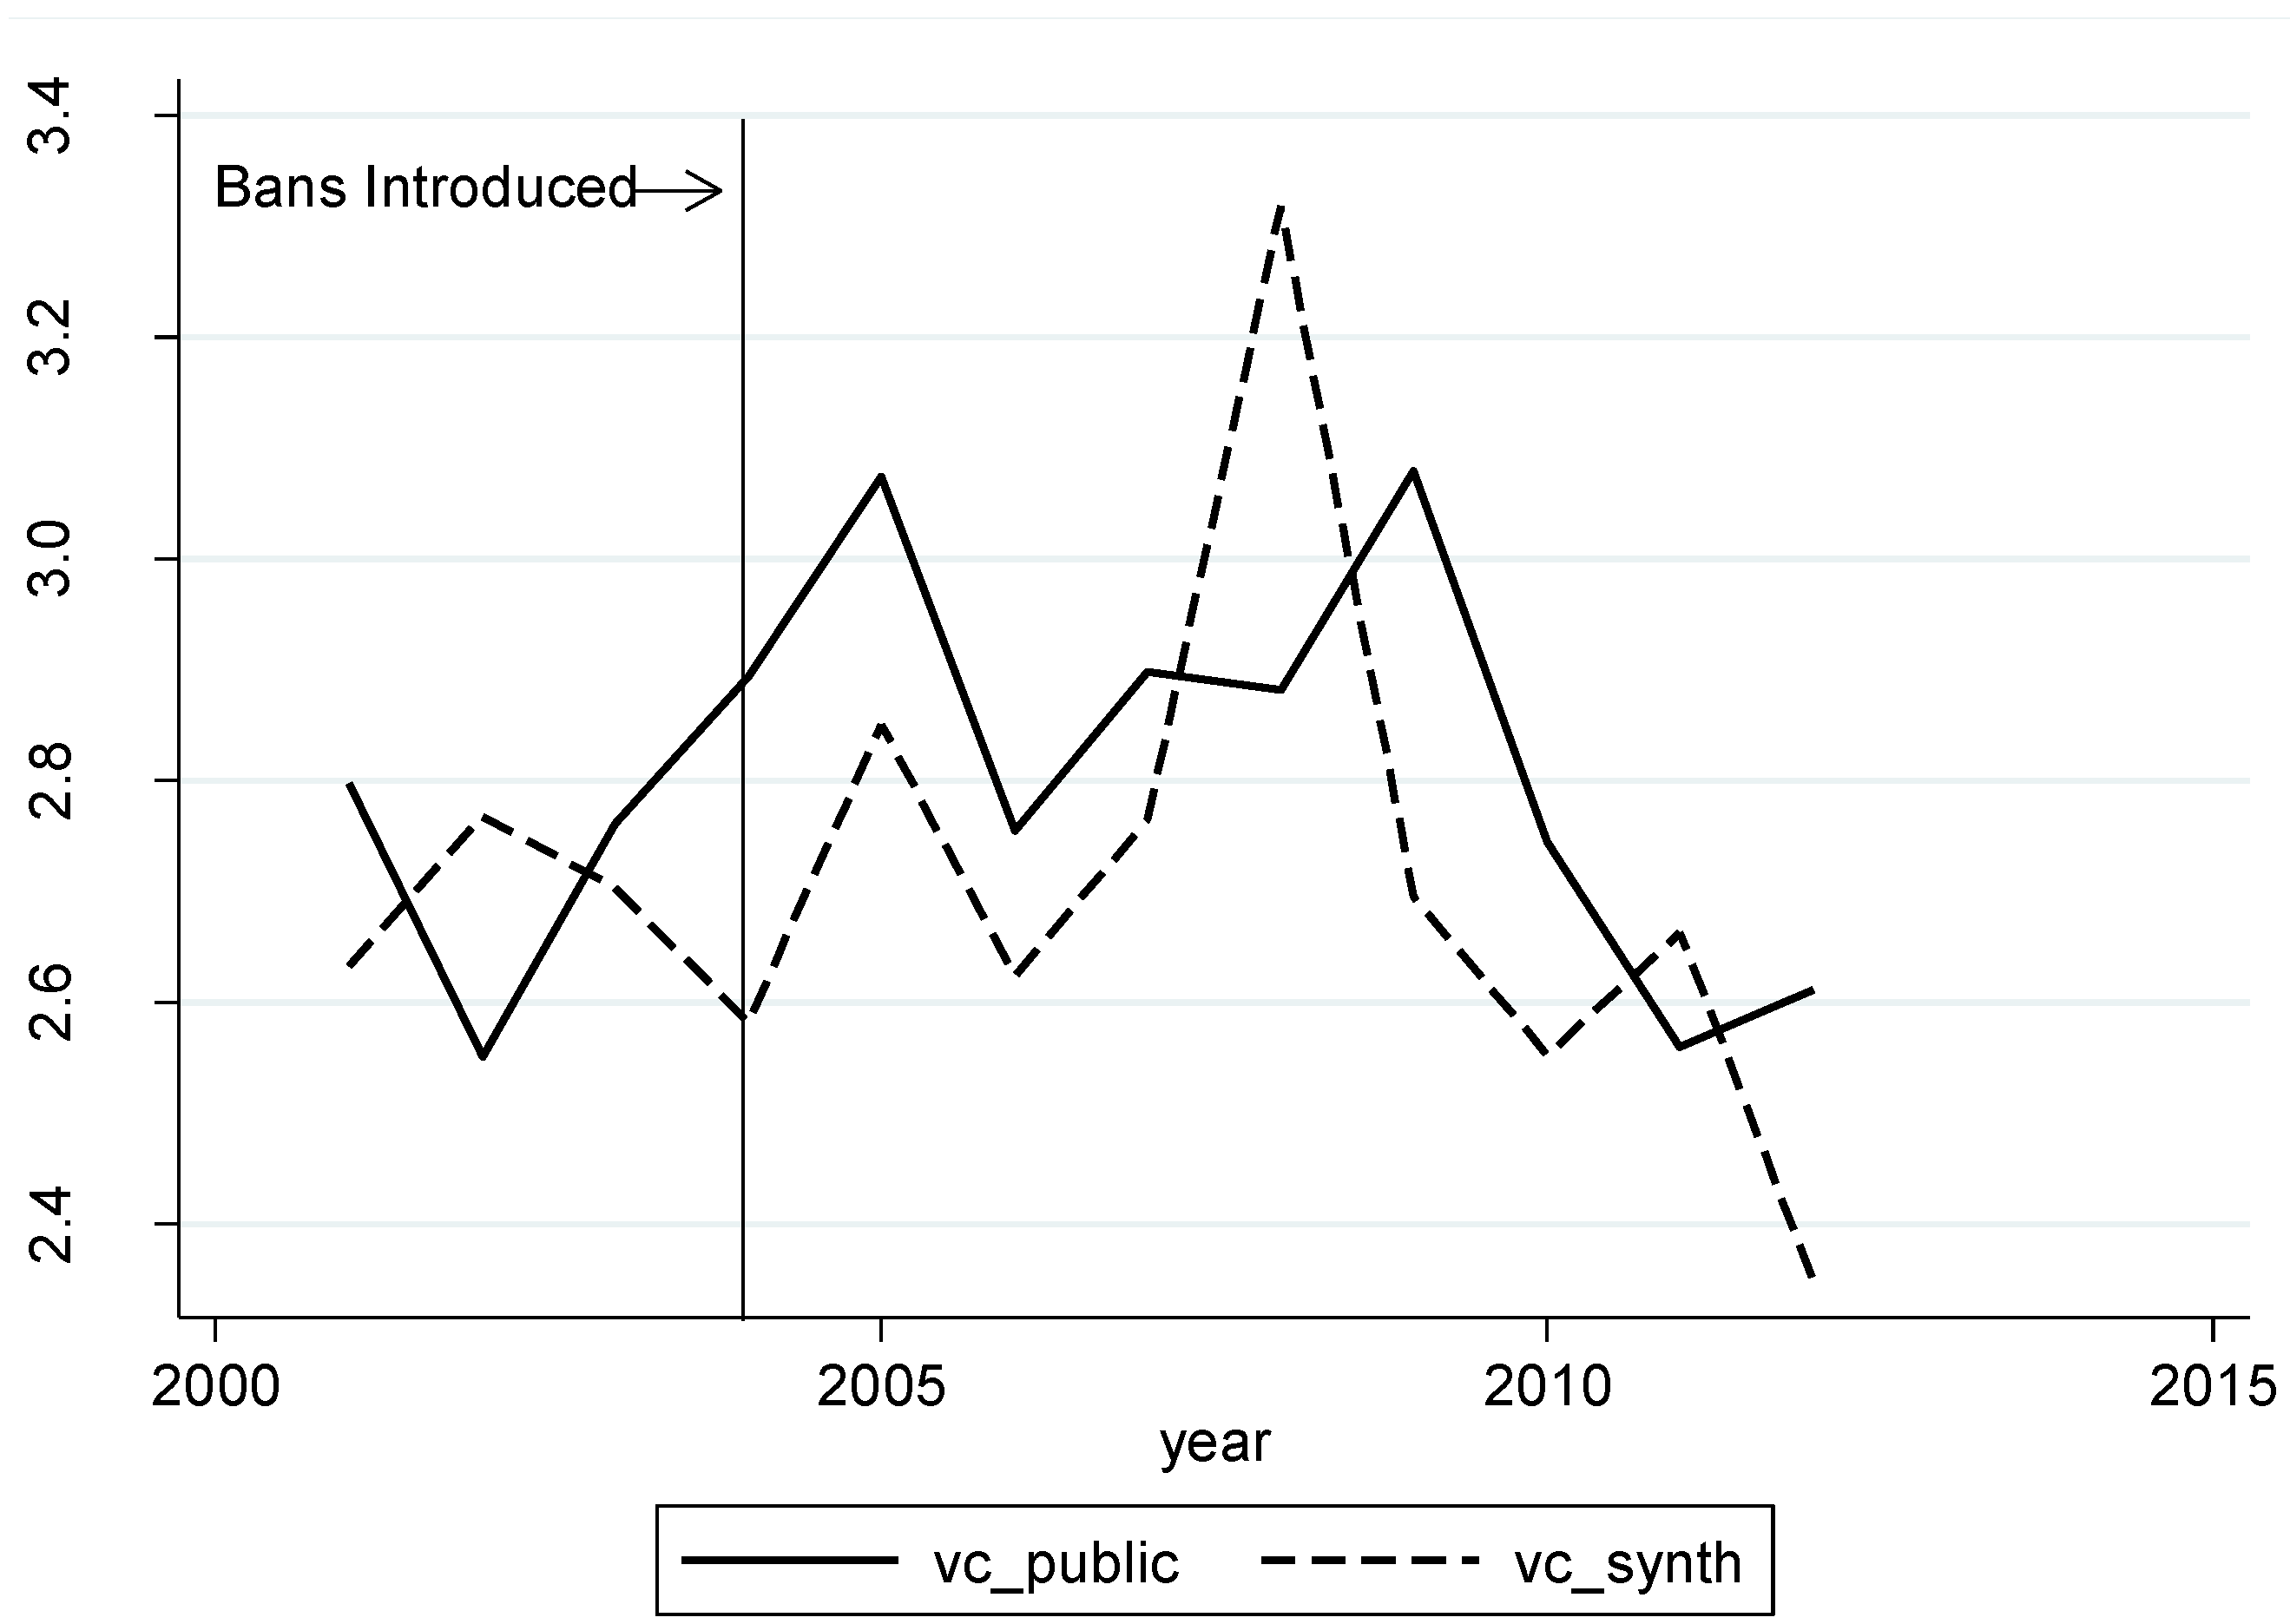
For this analysis, the synthetic case was generated using the crime and arrest variables that were logged to reduce skewness prior to factor analysis. Only four non-public housing neighborhoods were ultimately utilized (i.e., assigned factor weights) to generate the optimal synthetic control case. The factor algorithm decided that nine of the non-public housing neighborhoods were too different from public housing and therefore were not assigned weights. We included the variable measuring concentrated disadvantage, but the variable was dropped due to the program not being able to generate equivalent synthetic and treatment cases. The similarity of synthetic and treatment cases varied from dependent variable to dependent variable with a less than one percent discrepancy on all variables used in the factor analysis for the property crime variable (i.e., high equivalency of cases) and a less than eight percent discrepancy on all variables used for factor analysis for the violent crime variable (i.e., lower equivalency of cases).
Figure A1 plots the natural log of property crime by year for both the synthetic control case and the treatment case. We can see from the figure that during the period prior to the intervention, the synthetic and treatment cases have similar behavior (despite some obvious noise), but then clearly diverge after the intervention. Once bans are introduced, property crime for the synthetic control is consistently higher than in the treatment case that is composed of actual public housing crime data. Despite a very small number of years, a two-tailed t-test finds the change in difference between synthetic and treatment across the intervention to be significant at a 90% confidence level. This supports our results from the Arellano–Bond models that bans significantly reduce property crime in public housing.
Figure A1. Trends in property crime: public housing vs. synthetic public housing.
Socsci 05 00061 g007
Figure A2 plots the natural log of violent crime by year for both the synthetic control case and the treatment case. We can see from the figure that violent crime behaves erratically for both cases, and that they track each other relatively closely during the period of study despite the heavy amount of year-to-year noise. This implies that ban legislation does not influence violent crime, and this fact is supported by testing the difference between the cases before and after the intervention. The difference is not found to be statistically significant.
Figure A2. Trends in violent crime: public housing vs. synthetic public housing.
Socsci 05 00061 g008
Figure A3 plots the natural log of trespass arrests by year for both the synthetic control case and the treatment case. Despite some pre-intervention noise, the two cases are relatively close in trespass arrests and only greatly diverge once bans are introduced. For all time periods after the intervention, the synthetic case has a lower number of trespass arrests than the treatment case which experiences ban legislation which supports hypothesis 2A. Despite a very small number of years, a two-tailed t-test finds the change in difference between synthetic and treatment across the intervention to be significant at a 95% confidence level.
Figure A3. Trends in trespass arrests: public housing vs. synthetic public housing.
Socsci 05 00061 g009
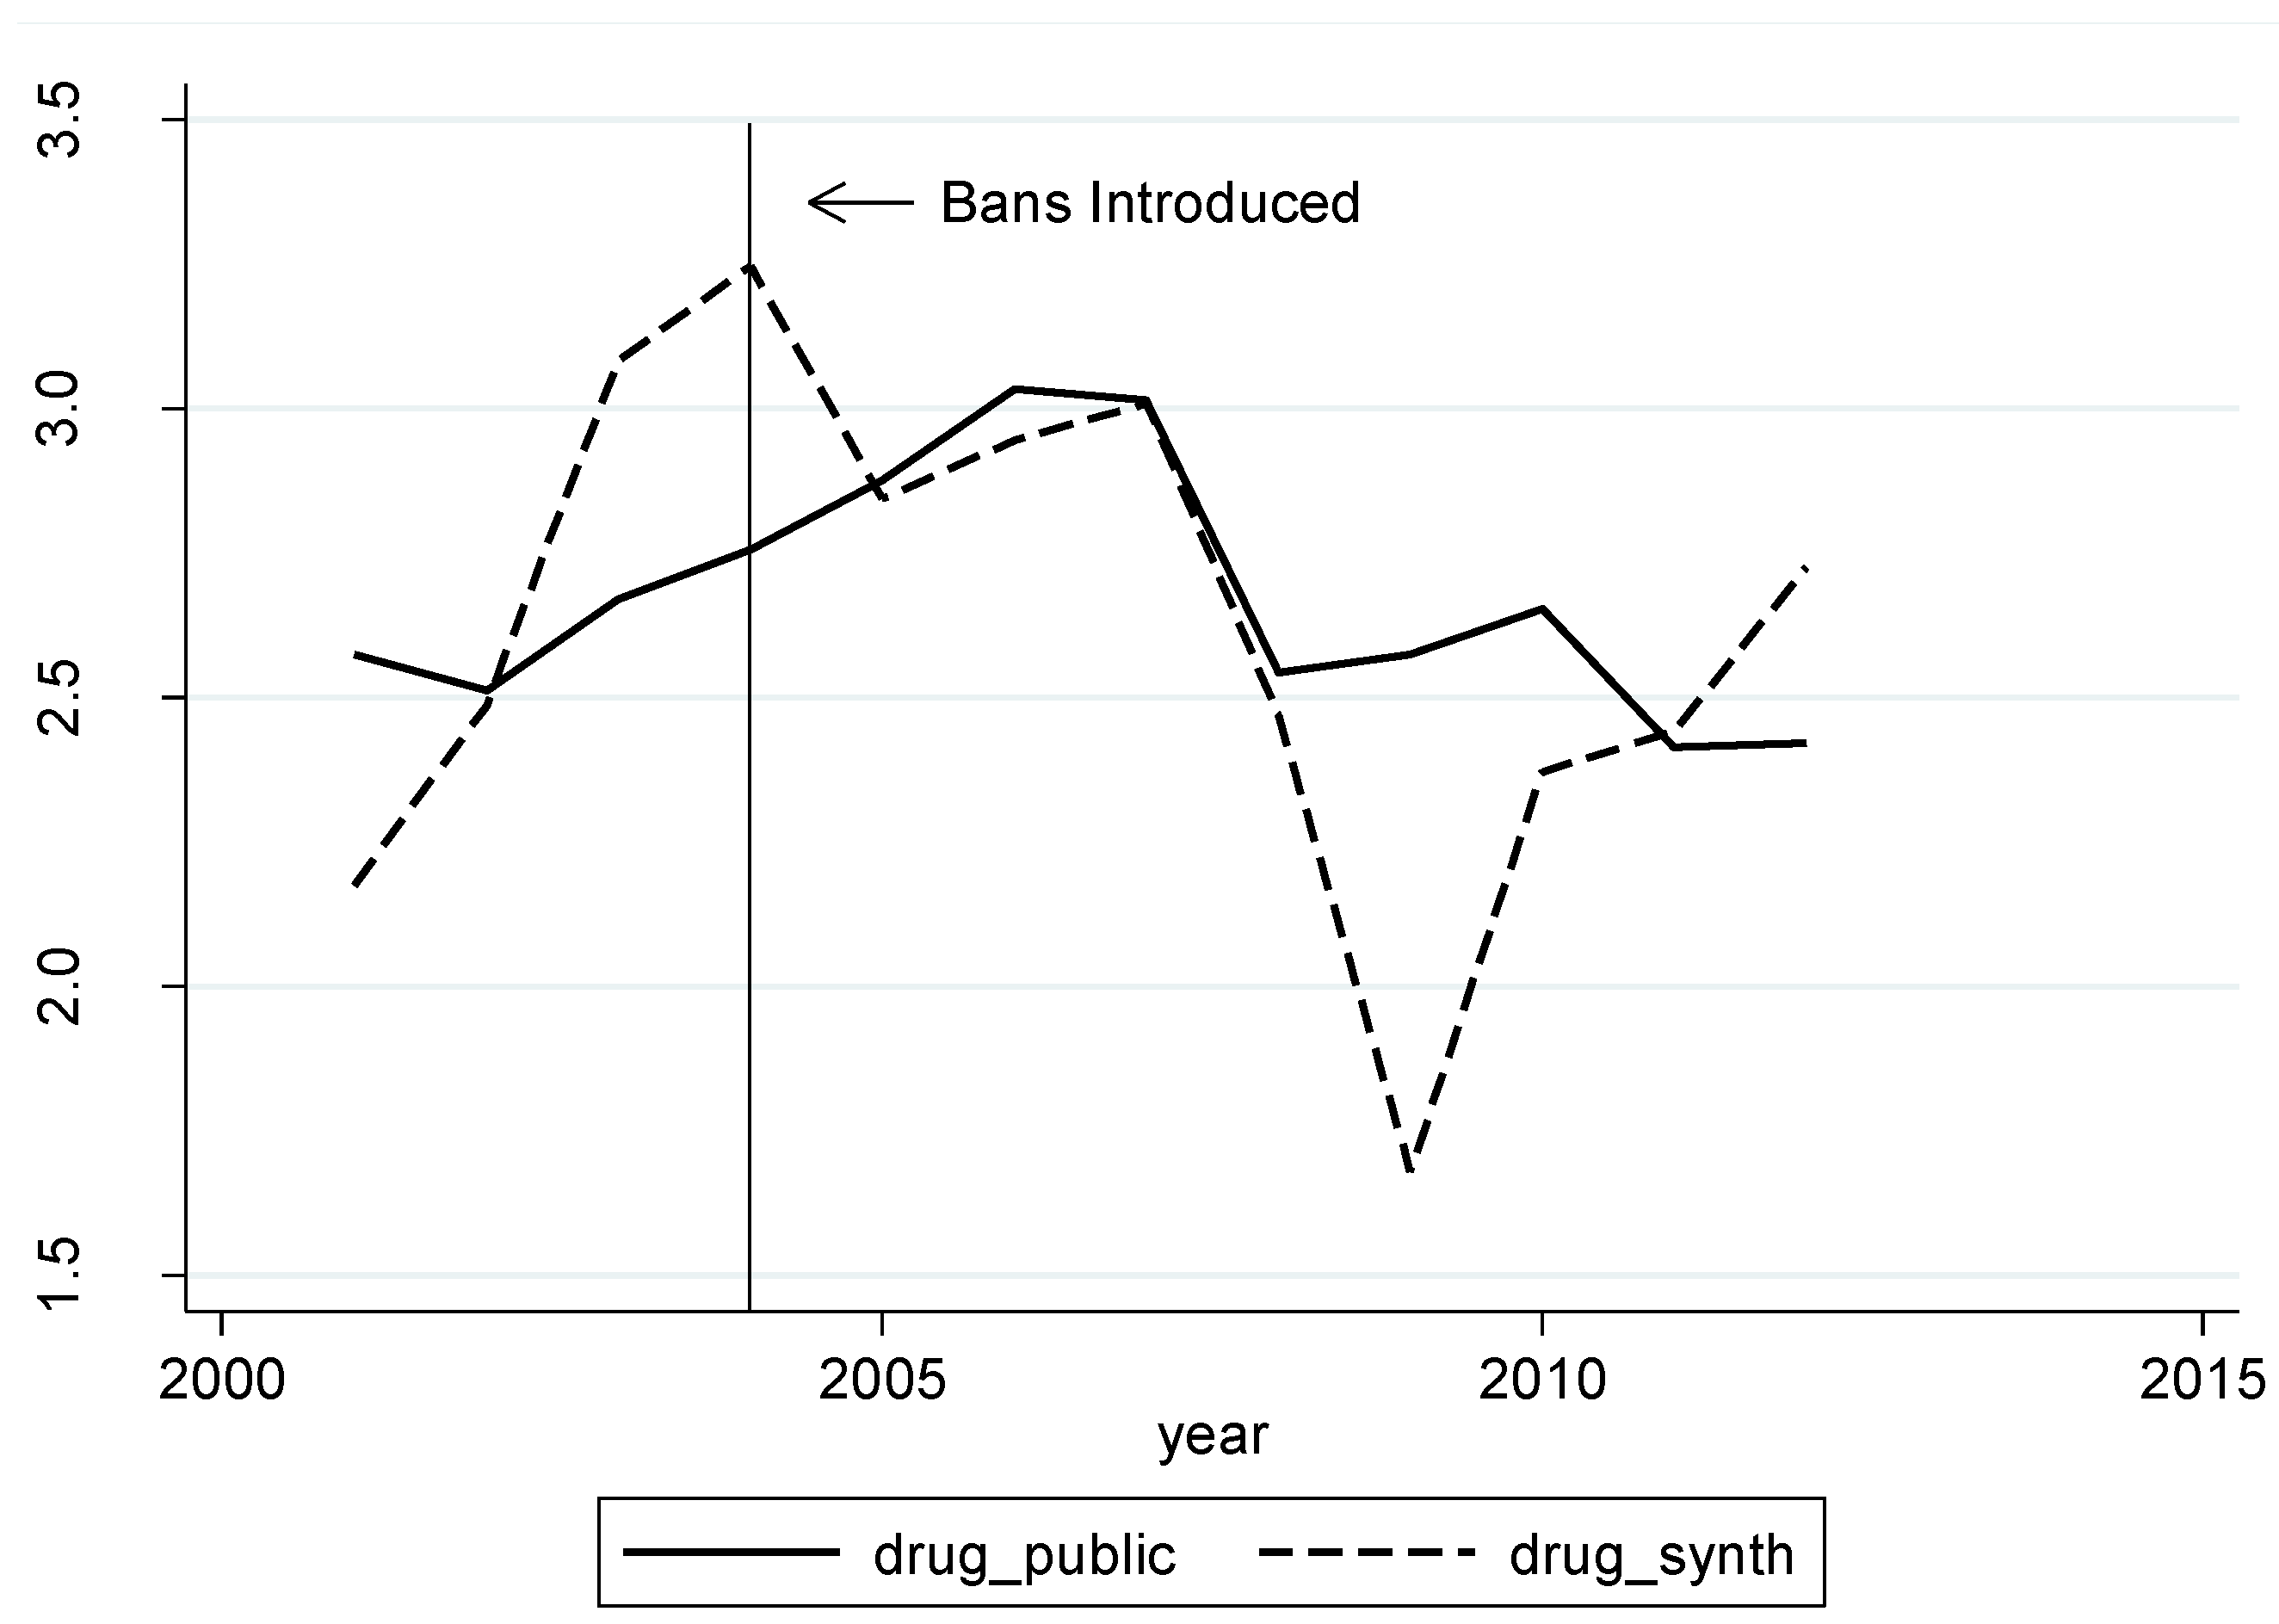
Figure A4 plots the natural log of drug arrests by year for both the synthetic control case and the treatment case. Despite a few occasionally large discrepancies, the two cases track one another very closely over the duration of the period implying that there is no relationship between ban legislation and drug arrests. The difference between synthetic and treatment cases before and after the intervention is not found to be statistically significant.
Figure A4. Trends in drug arrests: public housing vs. synthetic public housing.
Socsci 05 00061 g010

References and Notes

  1. James Q. Wilson, and George Kelling. “The Police and Neighborhood Safety: Broken Windows.” Atlantic Monthly. 1982. Available online: http://www.theatlantic.com/magazine/archive/1982/03/broken-windows/304465/ (accessed on 4 August 2014).
  2. William Bratton, and Peter Knobler. The Turnaround: How America’s Top Cop Reversed the Crime Epidemic. New York: Random House, 1998. [Google Scholar]
  3. Elliot Spitzer. “The New York City Police Department’s ‘Stop and Frisk’ Practices.” Office of the New York State Attorney General. 1999. Available online: www.oag.state.ny.us/press/reports/stop _frisk/stop_frisk.html (accessed on 30 August 2014).
  4. George L. Kelling, and Catherine Cole. Fixing Broken Windows: Restoring Order and Reducing Crime in Our Communities. New York: Martin Kessler Books, 1996. [Google Scholar]
  5. Eli Silverman. The NYPD Battles Crime: Innovative Ideas in Policing. Boston: Northeastern University Press, 1999. [Google Scholar]
  6. Bernard E. Harcourt. Illusion of Order: The False Promise of Broken Windows Policing. Cambridge: Harvard University Press, 2009. [Google Scholar]
  7. Katherine Beckett, and Steven Kelly Herbert. Banished: The New Social Control in Urban America. Oxford: Oxford University Press, 2010. [Google Scholar]
  8. Annan O. Sampson, and Wesley G. Skogan. Drug Enforcement in Public Housing: Signs of Success in Denver. Washington: Police Foundation, 1993. [Google Scholar]
  9. Lorraine Green Mazerolle, and William Terrill. “Problem-oriented policing in public housing: Identifying the distribution of problem places.” Policing: An International Journal of Police Strategies & Management 20 (1997): 235–55. [Google Scholar] [CrossRef]
  10. Jack R. Greene, Alex R. Piquero, Patricia Collins, and Robert J. Kane. “Doing research in public housing: Implementation issues from Philadelphia’s 11th street corridor community policing program.” Justice Research and Policy 1 (1999): 67–95. [Google Scholar] [CrossRef]
  11. Edmund F. McGarrell, Andrew L. Giacomazzi, and Quint C. Thurman. “Reducing disorder, fear, and crime in public housing: A case study of place-specific crime prevention.” Justice Research and Policy 1 (1999): 61–88. [Google Scholar] [CrossRef]
  12. Susan J. Popkin, Victoria E. Gwiasda, Dennis P. Rosenbaum, Jean M. Amendolia, Wendell A. Johnson, and Lynn M. Olson. “Combating crime in public housing: A qualitative and quantitative longitudinal analysis of the Chicago Housing Authority’s anti-drug initiative.” Justice Quarterly 16 (1999): 519–57. [Google Scholar] [CrossRef]
  13. Robert J. Kane. “Permanent beat assignments in association with community policing: Assessing the impact on police officers’ field activity.” Justice Quarterly 17 (2000): 259–80. [Google Scholar] [CrossRef]
  14. William F. Walsh, Gennaro F. Vito, Richard Tewksbury, and George P. Wilson. “Fighting back in Bright Leaf: Community policing and drug trafficking in public housing.” American Journal of Criminal Justice 25 (2000): 77–92. [Google Scholar] [CrossRef]
  15. John W. Barbrey. “Measuring the effectiveness of crime control policies in Knoxville’s public housing using mapping software to filter Part I crime data.” Journal of Contemporary Criminal Justice 20 (2004): 6–32. [Google Scholar] [CrossRef]
  16. Jeffrey Fagan, Garth Davies, and Jan Holland. “The paradox of the Drug Elimination Program in New York City public housing.” Georgetown Journal on Poverty Law & Policy 13 (2006): 415–60. [Google Scholar]
  17. Jeffrey Fagan, Garth Davies, and Adam Carlis. “Race and selective enforcement in public housing.” Journal of Empirical Legal Studies 9 (2012): 697–728. [Google Scholar] [CrossRef]
  18. Jose Torres. “Predicting Perceived Police Effectiveness in Public Housing: Police Contact, Police Trust, and Police Responsiveness.” Policing and Society. 2015. Available online: http://dx.doi.org/10.1080/10439463.2015.1077837 (accessed on 4 August 2014).
  19. Department of Housing and Urban Development v. Rucker, 535 U.S. 125, 122 S. Ct. 1230, 152 L. Ed. 2d 258 (2002).
  20. Robert A. Graham, Lisa Walker, William F. Maher, Ricardo L. Gilmore, and Raymond K. James. “Brief of Amici Curiae Council of Large Public Housing Authorities, Housing and Development Law Institute, Housing Authority Risk Retention Group, National Association of Housing and Redevelopment Officials, National Organization Of African-Americans in Housing, and Public Housing Authorities Directors Association.” 2003. Available online: http://www.phada.org/amicus03.pdf (accessed on 5 February 2016).
  21. Elena Goldstein. “Kept out: Responding to public housing no-trespass policies.” Harvard Civil Rights-Civil Liberties Journal 38 (2003): 215–45. [Google Scholar]
  22. Captain C. G. Hunter, and Judi Frist-Riutort. “No-Trespassing.” Problem Solving Quarterly 2 (1989): 1–2. [Google Scholar]
  23. Kimberly E. O’Leary. “Dialogue, perspective and point of view as lawyering method: A new approach to evaluating anti-crime measures in subsidized housing.” Washington University Journal of Urban & Contemporary Law 49 (1996): 133–214. [Google Scholar]
  24. Papachristou v. Jacksonville, 405 U.S. 156, 92 S. Ct. 839, 31 L. Ed. 2d 110 (1972).
  25. Shuttlesworth v. Birmingham, 382 U.S. 87, 86 S. Ct. 211, 15 L. Ed. 2d 176 (1965).
  26. Commonwealth v. Hicks, 563 SE 2d. 674 Va: Supreme Court, (2002).
  27. Allen Park Housing Commission. “Trespass Policy.” Michigan: Allen Park, 2014, Available online: http://allenparkhousing.com/wp-content/uploads/2013/01/Trespass-Policy.pdf (accessed on 30 August 2014).
  28. Charlotte Housing Authority. “Limited Access and Banning Policy and Procedures.” 2014. Available online: http://www.cha-nc.org/documents/BANNING%20POLICY%20AND%20PROCEDURES%20-%20Appendix%20J.pdf (accessed on 30 August 2014).
  29. Portsmouth Housing Authority. “Portsmouth Redevelopment Housing Authority Trespass-Barment Policy.” 2014. Available online: http://www.prha.org/prha/images/documents/home/Trespass%20Barment%20Policy.pdf (accessed on 30 August 2014).
  30. Winder Housing Authority. “Trespass and Barring Policy of the Housing Authority of the City Of Winder.” 2014. Available online: http://www.winderhousing.com/policies/Trespass-and-Ban-policy-of-WHA.pdf (accessed on 30 August 2014).
  31. Gary A. Beck. “Ban lists: Can public housing authorities have unwanted visitors arrested? ” University of Illinois Law Review 24 (2004): 1223–60. [Google Scholar]
  32. Mary M. Cheh. “Constitutional limits on using civil remedies to achieve criminal law objectives.” Hastings Law Journal 42 (1991): 1325–48. [Google Scholar]
  33. Captain John Doe (Kings Housing Authority). Interview, 2013.
  34. Adam Carlis. “The illegality of vertical patrols.” Columbia Law Review 109 (2009): 2002–43. [Google Scholar]
  35. Don Mitchell. “Property rights, the first amendment, and judicial anti-urbanism: The strange case of Virginia v. Hicks.” Urban Geography 26 (2005): 565–86. [Google Scholar] [CrossRef]
  36. Kings Housing Authority Security Managers Office. “KHA Trespass/Ban Policy.” Hanford, CA, USA: Kings Housing Authority Security Managers Office, 2004. [Google Scholar]
  37. Wesley G. Skogan. Disorder and Decline: Crime and the Spiral of Decay in American Neighborhoods. New York: Oxford University Press, 1990. [Google Scholar]
  38. Micelle Alexander. The New Jim Crow: Mass Incarceration in the Age of Colorblindness. New York: The New Press, 2010. [Google Scholar]
  39. Amanda Geller, and Jeffrey Fagan. “Pot as pretext: Marijuana, race, and the new disorder in New York City street policing.” Journal of Empirical Legal Studies 7 (2010): 591–633. [Google Scholar] [CrossRef]
  40. Scott Levy. “The collateral consequences of seeking order through disorder: New York’s narcotics eviction program.” Harvard Civil Rights-Civil Liberties Law Review 43 (2008): 539–80. [Google Scholar]
  41. Janet Smith. “Public Housing Transformation: Evolving National Policy.” In Where are Poor People to Live?: Transforming Public Housing Communities. Edited by Larry Bennett, Janet L. Smith and Patricia Wright. Armonk: M.E. Sharpe, 2006, pp. 19–40. [Google Scholar]
  42. Elizabeth Griffiths, and George Tita. “Homicide in and around public housing: Is public housing a hotbed, a magnet, or a generator of violence for the surrounding community? ” Social Problems 56 (2009): 474–93. [Google Scholar] [CrossRef]
  43. Nicolás Medina Mora. “NYPD Tells Cops To Stop Questioning People Just For Hanging Out In Housing Projects.” BuzzFeed News. 16 March 2015. Available online: https://www.buzzfeed.com/nicolasmedinamora/nypd-will-no-longer-stop-people-just-for-being-present-in-pu?utm_term=.kvDD5K3oA#.jdGBLbgDP (accessed on 10 February 2016).
  44. William Stuntz. “Privacy’s problem and the law of criminal-procedure.” Michigan Law Review 93 (1995): 1016–78. [Google Scholar] [CrossRef]
  45. Anthony A. Braga, Brandon C. Welsh, and Cory Schnell. “Can policing disorder reduce crime? A systematic review and meta-analysis.” Journal of Research in Crime and Delinquency 52 (2015): 567–88. [Google Scholar] [CrossRef]
  46. Richard Rosenfeld, Robert Fornango, and Andres F. Rengifo. “The impact of order-maintenance policing on New York City homicide and robbery rates: 1988–2001.” Criminology 45 (2007): 355–84. [Google Scholar] [CrossRef]
  47. Richard Rosenfeld, and Robert Fornango. “The impact of police stops on precinct robbery and burglary rates in New York City, 2003–2010.” Justice Quarterly 31 (2014): 96–122. [Google Scholar] [CrossRef]
  48. Kenneth Land, Patricia McCall, and Lawrence Cohen. “Structural covariates of homicide rates: Are there any invariances across time and space? ” American Journal of Sociology 95 (1990): 922–63. [Google Scholar] [CrossRef]
  49. James Hawdon, and John Ryan. “Social capital, social control and crime.” Crime and Delinquency 55 (2009): 526–49. [Google Scholar] [CrossRef]
  50. Karen F. Parker, Brian J. Stults, and Stephen K. Rice. “Racial threat, concentrated disadvantage and social control: Considering the macro-level sources of variation in arrests.” Criminology 43 (2005): 1111–34. [Google Scholar] [CrossRef]
  51. Robert J. Sampson, and Dawn Jeglum Bartusch. “Legal cynicism and (subcultural?) tolerance of deviance: The neighborhood context of racial differences.” Law & Society Review 32 (1998): 777–804. [Google Scholar] [CrossRef]
  52. Robert J. Sampson, Stephen W. Raudenbush, and Felton Earls. “Neighborhoods and violent crime: A multilevel study of collective efficacy.” Science 277 (1997): 918–24. [Google Scholar] [CrossRef] [PubMed]
  53. U.S. Census Bureau. “2000 U.S Census.” 2014. Available online: http://factfinder.census.gov/ (accessed on 20 September 2014). [Google Scholar]
  54. U.S. Census Bureau. “2010 U.S Census.” 2014. Available online: http://factfinder.census.gov/ (accessed on 20 September 2014). [Google Scholar]
  55. U.S. Census Bureau. “2008–2012 American Community Survey 5-Year Estimates.” 2014. Available online: http://factfinder.census.gov/ (accessed on 20 September 2014). [Google Scholar]
  56. Rodney Stark. “Deviant places: A theory of the ecology of crime.” Criminology 25 (1987): 893–910. [Google Scholar] [CrossRef]
  57. Jeffrey D. Morenoff, and Robert J. Sampson. “Violent crime and the spatial dynamics of neighborhood transition: Chicago, 1970–1990.” Social Forces 76 (1997): 31–64. [Google Scholar] [CrossRef]
  58. David Roodman. “How to do Xtabond2: An Introduction to Difference and System GMM in Stata.” Center for Global Development Working Paper No. 103; Washington, DC, USA: Center for Global Development, December 2016. [Google Scholar]
  59. Scott Decker, Richard Wright, and Robert Logie. “Perceptual deterrence among active residential burglars: A research note.” Criminology 31 (1993): 135–47. [Google Scholar] [CrossRef]
  60. Ross L. Matsueda, Derek A. Kreager, and David Huizinga. “Deterring delinquents: A rational choice model of theft and violence.” American Sociological Review 71 (2006): 95–122. [Google Scholar] [CrossRef]
  61. Alex Piquero, and George F. Rengert. “Studying deterrence with active residential burglars.” Justice Quarterly 16 (1999): 451–71. [Google Scholar] [CrossRef]
  62. David P. Farrington, and Donald J. West. The Cambridge Study in Delinquent Development: A Long-Term Follow-Up of 411 London Males. Berlin: Springer, 1990. [Google Scholar]
  63. David Farrington, Alex R. Piquero, and Wesley G. Jennings. Offending from Childhood to Late Middle Age: Recent Results from the Cambridge Study in Delinquent Development. New York: Springer Science & Business Media, 2013. [Google Scholar]
  64. Marvin E. Wolfgang, Robert M. Figlio, and Thorsten Sellin. Delinquency in a Birth Cohort. Chicago: University of Chicago Press, 1972. [Google Scholar]
  65. David Kennedy. “Violence and street groups: Gangs, groups, and violence.” In The Causes and Consequences of Group Violence. Edited by James Hawdon, John Ryan and Marc Lucht. New York: Lexington, 2014, pp. 49–70. [Google Scholar]
  66. Andrew V. Papachristos. “Murder by structure: Dominance relations and the social structure of gang homicide.” American Journal of Sociology 115 (2009): 74–128. [Google Scholar] [CrossRef]
  67. Scott H. Decker. “Collective and normative features of gang violence.” Justice Quarterly 13 (1996): 243–64. [Google Scholar] [CrossRef]
  68. David Kennedy. “Pulling levers: Chronic offenders, high-crime settings, and a theory of prevention.” Valparaiso University Law Review 31 (1997): 449–84. [Google Scholar]
  69. David Kennedy. Deterrence and Crime Prevention: Reconsidering the Prospect of Sanction. London: Routledge Press, 2008. [Google Scholar]
  70. Anthony A. Braga, and David L. Weisburd. “The effects of ‘pulling levers’ focused deterrence strategies on crime.” Campbell Systematic Reviews 6 (2012): 1–90. [Google Scholar]
  71. Rod K. Brunson. “Focused deterrence and improved police–community relations.” Criminology & Public Policy 14 (2015): 507–14. [Google Scholar] [CrossRef]
  72. Nicholas Corsaro, and Robin S. Engel. “Most challenging of contexts.” Criminology & Public Policy 14 (2015): 471–505. [Google Scholar] [CrossRef]
  73. Andrew V. Papachristos, Tracey L. Meares, and Jeffrey Fagan. “Attention felons: Evaluating Project Safe Neighborhoods in Chicago.” Journal of Empirical Legal Studies 4 (2007): 223–72. [Google Scholar] [CrossRef]
  74. Anthony Braga. “Getting deterrence right? ” Criminology & Public Policy 11 (2012): 201–10. [Google Scholar] [CrossRef]
  75. Corinne Ramey. “Permanent-Ban Policy in Public Housing under Review.” The Wall Street Journal. 27 May 2016. Available online: http://www.wsj.com/articles/permanent-ban-policy-in-public-housing-under-review-1464343201 (accessed on 1 June 2016).
  76. American Civil Liberties Union. “Families Untied: Public Housing Banning Policy Tears Families Apart.” YouTube. 2009. Available online: https://www.youtube.com/watch?v=wHFCUr_Lc6s (accessed on 10 January 2015).
  77. Michael Tonry. Punishing Race: A Continuing American Dilemma. New York: Oxford University Press, 2011. [Google Scholar]
  78. Loïc Wacquant. Deadly Symbiosis: Race and the Rise of the Penal State. Cambridge: Polity, 2011. [Google Scholar]
  79. Robert D. Baller, Luc Anselin, Steven F. Messner, Glenn Deane, and Darnell F. Hawkins. “Structural covariates of U.S. county homicide rates: Incorporating spatial effects.” Criminology 39 (2003): 561–88. [Google Scholar] [CrossRef]
  80. Jacqueline Cohen, and George Tita. “Diffusion in homicide: Exploring a general method for detecting spatial diffusion processes.” Journal of Quantitative Criminology 15 (1999): 451–93. [Google Scholar] [CrossRef]
  81. Steven F. Messner, Luc Anselin, Robert D. Baller, Darnell F. Hawkins, Glenn Deane, and Stewart E. Tolnay. “The spatial patterning of county homicide rates: An application of exploratory spatial data analysis.” Journal of Quantitative Criminology 15 (1999): 423–50. [Google Scholar] [CrossRef]
  82. Robert J. Sampson, and Stephen W. Raudenbush. Disorder in Urban Neighborhoods: Does It Lead to Crime; Washington: US Department of Justice, 2001.
  83. David Weisburd, Shawn Bushway, Cynthia Lum, and Sue-Ming Yang. “Trajectories of crime at places: A longitudinal study of street segments in the city of Seattle.” Criminology 42 (2004): 283–322. [Google Scholar] [CrossRef]
  84. Robert T. Guerette, and Kate J. Bowers. “Assessing the extent of crime displacement and diffusion of benefits: A review of situational crime prevention evaluations.” Criminology 47 (2009): 1331–68. [Google Scholar] [CrossRef]
  85. Trevor Bennett, and Richard Wright. Burglars on Burglary: Prevention and the Offender. Brookefield: Gower, 1984. [Google Scholar]
  86. P. Jeffrey Brantingham, and Patricia Brantingham. Environmental Criminology. Beverly Hills: Sage, 1981. [Google Scholar]
  87. John E. Eck. “The threat of crime displacement.” Criminal Justice Abstracts 25 (1993): 527–46. [Google Scholar]
  88. Wim Bernasco, and Paul Nieuwbeerta. “How do residential burglars select target areas?: A new approach to the analysis of criminal location choice.” British Journal of Criminology 45 (2005): 296–315. [Google Scholar] [CrossRef]
  89. Wim Bernasco, and Richard Block. “Where offenders choose to attack: A discrete choice model of robberies in Chicago.” Criminology 47 (2009): 93–130. [Google Scholar] [CrossRef]
  90. Wim Bernasco. “Modeling micro-level crime location choice: Application of the discrete choice framework to crime at places.” Journal of Quantitative Criminology 26 (2010): 113–38. [Google Scholar] [CrossRef]
  91. Shane D. Johnson, and Lucia Summers. “Testing ecological theories of offender spatial decision making using a discrete choice model.” Crime & Delinquency 61 (2015): 454–80. [Google Scholar] [CrossRef] [PubMed]
  92. Robert J. Kane. “Policing in public housing: Using calls for service to examine incident-based workload in the Philadelphia Housing Authority.” Policing: An International Journal of Police Strategies & Management 21 (1998): 618–31. [Google Scholar] [CrossRef]
  • 1KHA is a pseudonym for the actual PHA used for this and the Torres [18] study.
  • 2For an understanding of how concerned the federal government was about issues of drugs and violence in public housing see Dep’t of Hous. and Urban Dev. v. Rucker [19] and Graham et al. [20].
  • 3Banishment has been used on public and private property, residential and business properties, and areas handpicked by local judges [7].
  • 4As a result of the National Commission on Severely Distressed Public Housing, Congress created HOPE VI, which called for many of the nation’s public housing communities to undergo physical revitalizations or be demolished altogether (see [41]).
  • 5As of 2016, only the NYPD has publicly denounced the practice of stopping anyone in public housing under the guise of a trespass investigation (see [43]).
Figure 1. Theoretical path model between bans and drug arrests.
Socsci 05 00061 g001
Figure 2. Bans in public housing by year*. Notes: *Ban legislation only covered public housing neighborhoods from 2004 onward; non-public housing neighborhoods had zero bans for all years.
Socsci 05 00061 g002
Figure 3. Property crimes by public housing by year.
Socsci 05 00061 g003
Figure 4. Violent crimes in public housing by year.
Socsci 05 00061 g004
Figure 5. Trespass arrests in public housing by year.
Socsci 05 00061 g005
Figure 6. Drug arrests in public housing by year.
Socsci 05 00061 g006
Table 1. Bans and population by public housing neighborhood by year.
Neighborhood 200420052006200720082009201020112012
Public Housing 1Bans572043887914017810191
(32%)(13%)(32%)(37%)(23%)(27%)(25%)(22%)(26%)
Pop.171517321749176617831800181718341851
Public Housing 2Bans314137487813019014991
(17%)(26%)(28%)(20%)(23%)(25%)(27%)(33%)(26%)
Pop.193919501961197319841995200620182029
Public Housing 3Bans131714348882915177
(7%)(11%)(10%)(14%)(26%)(16%)(13%)(11%)(22%)
Pop.852858865871878884891897904
Public Housing 4 *Bans60523153621262008962
(34%)(33%)(23%)(22%)(18%)(24%)(28%)(20%)(18%)
Pop.221622162216221722172217221722172217
Public Housing 5Bans18269173250506031
(10%)(17%)(7%)(7%)(9%)(9%)(7%)(13%)(9%)
Pop.125212471243123812341229122412201215
Public Housing TotalBans179156134240339528709450352
(100%)(100%)(100%)(100%)(100%)(100%)(100%)(100%)(100%)
Pop.797480038034806580968125815581868216
Note: * Two KHA communities were combined since they are both under the same block group in the ACS and Census.
Table 2. Summary statistics.
Variable MeanStandard DeviationMinMax
Property CrimeOverall100.6134.816.0776.0
Between 136.527.5631.4
Within 21.932.2245.2
Violent CrimeOverall17.412.80.064.0
Between 11.71.944.1
Within 5.8–5.337.9
Trespass ArrestOverall11.722.00.0194.0
Between 17.51.272.3
Within 13.9–25.2165.8
Drug ArrestOverall20.623.10.0174.0
Between 18.51.277.5
Within 14.4–44.9117.1
Concentrated DisadvantageOverall0.01.0–2.11.7
Between 1.0–2.11.5
Within 0.2–0.60.6
Notes: N = 216; n = 18; t = 12.
Table 3. Arellano–Bond dynamic panel-data models predicting property crime.
Effect/Model123
Property Crime(t-1)0.274 **0.326 **0.288 **
(0.089)(0.094)(0.100)
Bans(t-1)–0.054 *–0.083 *–0.076 *
(0.024)(0.032)(0.033)
Concentrated Disadvantage –0.011–0.019
(0.330)(0.345)
Year 0.0090.008
(0.018)(0.019)
Trespass Arrests(t-1) –0.015
(0.039)
Drug Arrests(t-1) –0.053
(0.052)
N180180180
n181818
Wald chi-square19.9 **43.0 **46.4 **
Notes: * p < 0.05; ** p < 0.01, two tail; Robust standard errors in parentheses.
Table 4. Arellano–Bond dynamic panel-data models predicting violent crime.
Effect/Model123
Violent Crime(t-1)0.2470.0770.025
(0.153)(0.085)(0.097)
Bans(t-1)0.0130.0530.053
(0.029)(0.047)(0.044)
Concentrated Disadvantage 0.1390.119
(0.452)(0.413)
Year –0.009–0.004
(0.024)(0.022)
Trespass Arrests(t-1) –0.047
(0.030)
Drug Arrests(t-1) 0.102
(0.066)
N180180180
n181818
Wald chi-square3.53.215.8 *
Notes: * p < 0.05, two tail; Robust standard errors in parentheses.
Table 5. Arellano–Bond dynamic panel-data models predicting trespass arrests.
Effect/Model1234
Trespass Arrests(t-1)0.1960.3370.2720.242
(0.228)(0.206)(0.188)(0.159)
Bans(t-1)0.116–0.077
(0.096)(0.084)
Bans(t-2) 0.248 **0.106
(0.083)(0.061)
Concentrated Disadvantage 0.012 0.711
(0.771) (0.471)
Year 0.079 0.081 **
(0.050) (0.025)
N180180180180
n18181818
Wald chi-square3.727.3 **13.0 **63.0 **
Notes: p < 0.10; ** p < 0.01, two tail; Robust standard errors in parentheses.
Table 6. Arellano-Bond dynamic panel-data models predicting drug arrests.
Effect/Model123456
Drug Arrests(t-1)0.1590.1320.0860.1640.0870.090
(0.131)(0.155)(0.136)(0.143)(0.134)(0.136)
Bans(t-1)–0.0840.0260.044
(0.075)(0.041)(0.045)
Bans(t-2) –0.0440.084 0.097 *
(0.084)(0.044)(0.048)
Concentrated Disadvantage –0.261–0.348 –0.444–0.445
(0.748)(0.444) (0.399)(0.408)
Year –0.041–0.051 –0.062 *–0.064 *
(0.037)(0.030) (0.027)(0.029)
Trespass Arrests(t-1) 0.022 0.028
(0.071) (0.071)
Trespass Arrests(t-2) –0.014 –0.020
(0.057) (0.058)
N180180180180180180
n181818181818
Wald chi-square2.89.9 *12.7 *2.110.5 *13.3 *
Notes: p < 0.10; * p < 0.05, two tail; Robust standard errors in parentheses.