Contrasting the Effect of Risk- and Non Risk-Based Capital Structure on Insurers’ Performance in Nigeria


1
Putra Business School, University Putra Malaysia, 43400 Serdang, Selangor, Malaysia
2
Department of Accounting and Finance, University Putra Malaysia, 43400 Serdang, Selangor, Malaysia
*
Author to whom correspondence should be addressed.
Soc. Sci. 2017, 6(4), 143; https://doi.org/10.3390/socsci6040143
Submission received: 25 October 2017
/
Revised: 17 November 2017
/
Accepted: 20 November 2017
/
Published: 22 November 2017
Abstract
:Literature on capital-based regulation and performance of insurers in emerging market is not only limited; it is incomplete, particularly on a comparative basis. This has continuously attracts researchers’ interest and concerns for practitioners and policy makers. This paper therefore examines the effect of capital structure on performance of insurers comparatively before and after the implementation of risk-based capital (RBC) policy in Nigeria to determine which policy regime enables insurers to perform better. Descriptive statistics are employed to describe the characteristics of the data while the hypotheses are tested using two-stage estimation procedure of fixed and random effect models. Results reveal that insurance capital structure (measured by technical provision ratio) has a significant positive effect on insurance performance (measured by earnings per share and return on asset) during non-RBC regime when compared to RBC regime. Based on these findings, it is concluded that insurers in Nigeria performed better under non-RBC than RBC era. This finding provides important insight to managers, regulators and investors by fostering more understanding of how to manipulate and regulate insurance capital for performance optimization under RBC scenarios.
1. Introduction
The practice of predicting future organizational behaviour and decision making based on historical information and past performance indices is commonplace in social and management sciences. One of the areas with increased interest is capital structure and firm performance. Capital structure is considered the foundation of corporate existence and has been studied extensively in corporate finance and related fields (Dhaene et al. 2015). Consequently, it has become an important area where policies and regulations are targeted. The current risk-based capital (RBC) policy is one of such policies that have attracted attentions and criticisms. RBC basically focuses on capital structure manipulations to achieve desired performance. But critics doubt the anticipated efficacy of RBC at guaranteeing insurers’ solvency and ultimately, better performance (Yusof et al. 2016). Under RBC policy, insurers are required to hold higher capital in line with the level of risk assumed, whereas under non risk-based capital (NRBC) regime, they are not. Thus, in either regime, capital structure is affected; and because capital and its allocation are linked to insurance […] and performance management (Zec 2012), there is reasonable justification for investigating measures of capital structure in relation to performance under these different policy regimes
Capital structure theories and empirical evidences describe capital structure as principally comprising of equity and debt. However, capital structure of insurance firms comprises equity and technical provisions (Florio and Leoni 2017; Eling and Marek 2014). Equity is ownership contribution whereas technical provision is the combination of interest-bearing liabilities (financial debt or insurance funds) and non interest-bearing liabilities (creditors, accruals and, outstanding claims) (Dhaene et al. 2015). The non interest-bearing liabilities have enormous opportunity costs such as loss of business, loss of premium, loss of profit, loss of credit worthiness, loss of investible fund and high rental costs. These have important performance implications for insurance firms and deserve empirical investigation especially, in the face of the divergent arguments in past empirical studies. For instance, recent study explicitly stated that these liabilities are capable of influencing insurance performance negatively (Akpan et al. 2017a). This goes in agreement with some authors who have argued that capital structure affect firm performance negatively (Avci 2016; Foo et al. 2015). On the contrary, other scholars said capital structure and firm performance shares a positive relationship (Fosu 2013; Majumdar and Sen 2010). Still, there are those who argued that there is no relationship (Chaudhuri et al. 2016; Davydov 2016; Chadha and Sharma 2015). As insurers’ capital structure differs, its effect on performance is largely uncertain, particularly under different capital regimes, hence this investigation.
The scope of this study thus covers capital structure, measured by technical provision ratio (TPR), and performance of insurance firms measured by return on asset (ROA) and earnings per share (EPS). TPR demonstrates the relationship between total liabilities and total assets (Shim 2010; De Haan and Kakes 2010). The choice of TPR is informed by the fact that it is different from the conventional measurement of capital structure in past studies as well as from theoretical explanations. Again, we assume that the observed inconclusiveness in past studies may either relate to inappropriate measurement or omission of some other important variables. ROA represent how efficient the management of insurance firm have been at managing the firm’s asset while EPS represent how much profit a share has generated with shareholders’ fund and its consideration is important in many fronts. Aside from the fact that EPS is the least examined performance measure in empirical studies, scholars describe it as the linchpin that undergirds strategic decision-making in the areas of share valuations, incentive schemes and Mergers and Acquisitions (M&As) negotiations (Berger and Di Patti 2006; Margaritis and Psillaki 2007).
From the perspective of tradeoff theory, a firm’s capital structure influences its performance (Abdeljawad et al. 2013; Dang et al. 2012; etc.). Past studies concentrates on non insurance firms in developed markets (Pervan and Kramarić 2010); few focused on emerging markets (Pervan et al. 2012; Kyereboah-Coleman 2007; Zeitun and Tian 2014; Abor 2005, 2007). Generally, studies involving insurers capital structure are particularly limited, but results from a few studies suggest a positive link between capital structure (measured conventionally) and insurance performance (Cheng and Weiss 2012a, 2012b; Lai 2011). We argue that such link is conjectural under different measurement as well as different capital regimes, hence the need for further investigation. Based on the proposition that borrowed capital (TPR inclusive) can create wealth and that, higher capital requirements are important to small insurers (Muhlnickel et al. 2016; Muscettola 2013), we expect a positive association between TPR and insurance performance. On this basis the following hypotheses will be tested in this study:
H1a.
There is a positive relationship between TPR and EPS of insurance firms in NRBC era in Nigeria.
H1b.
There is a positive relationship between TPR and EPS of insurance firms in RBC era in Nigeria.
H2a.
There is a positive relationship between TPR and ROA of insurance firms in NRBC era in Nigeria.
H2b.
There is a positive relationship between TPR and ROA of insurance firms in RBC era in Nigeria.
Nevertheless, it is noteworthy that the above hypothesized relationships may change due to regional factors (developed or emerging market), or types of firms (insurance or non insurance) (Shyu 2013). It is also on record “[…] that global, regional and national financial structures are complex, which by intuition, would be inaccurate to characterize financial markets ‘analogously’ with other simple markets” (Khan 2004). This informed the choice of Nigeria and her insurance firms as the setting and relevant sector respectively for this study. As part of the characteristics of developing market which Nigeria is, Khan (2004) further explained that volatility and crisis in financial markets are eminent due most likely to nonlinear structures, asymmetric information, fundamental uncertainties and, different types of risk among other market frictions. Apart from the fact that these features present better ground for testing the validity of some fundamental theories in finance, they make it cautionary that in any phenomenal investigation, these factors must be considered within specific settings or country to avoid spuriousness in empirical outcome. The primary objective is to determine which capital-based policy regime favours profitable insurance operation in Nigeria. This study contributes markedly to: (i) Defining capital structure of insurance firms beyond interest-bearing liabilities (financial debt) to other non-interest bearing liabilities; (ii) Theory extension by applying the theory of risk capital to explain if the transition to a higher capital era results in higher performance; (iii) ascertaining if capital-based regulations have less desired subtle consequences on insurance performance. The paper is presented in five sections namely: introduction, literature review, methodology, results and discussion and finally concluding remarks.
2. Literature Review
2.1. A Brief X-ray of the Nigerian Insurance Sector
Nigeria is an emerging country considered to have the biggest insurance market in Africa with huge potentials. Insurance in Nigeria began with the traditional social and mutual schemes which were culturally practiced prior to the arrival of British rule and system of governance. These schemes worked by collective cash donations for purposes of giving financial assistance to any contributing member who, either suffered a loss from any mishap or had a need to start a new business (Usman 2009). Thenceforth, insurance has grown to become one of the sectors that contribute remarkable to the development of Nigerian economy. As at 2014, the Nigerian Insurance sector became the second largest African country contributing reasonably to world premium growth as presented in Figure 1.
Currently, the domestic insurance industry is not only poised to penetrating the domestic market deeply, but also to expand to other regions of the continent. As insurers grew, some aberrational and unethical practices seem to be the norm in the industry partly due to the absence of laws guiding transactions, actions and sanctions in the industry (Ujunwa and Modebe 2011). Such practices make the industry highly inefficient, unstable, unsafe and incapable of protecting policy holders. These characterized weaknesses have become chronic and have caused large insurance businesses to be underwritten by foreign firms. Consequently, intervention in the sector became necessary with the enactment of the Nigeria Insurance Act in 2003 to repeal the Insurance Decree No. 2 of 1997. The Act served as the legislative origin of RBC which was implemented under the aegis of Solvency 1. As part of RBC policy, recapitalization exercise of 2004, merger and acquisitions of 2005, consolidation exercise of 2006, etc. were all implemented almost contemporaneously as strategies for strengthening the capacity of insurers; but these policies are also viewed as making capital structure decisions of insurers to be very challenging (El-Sayed Ebaid 2009). Significant researches have been carried out on some of the specific reforms like recapitalization, M&A, etc., but research on RBC and insurance performance is limited, hence this investigation.
2.2. The Concept of RBC and NRBC as Investigation Scenarios
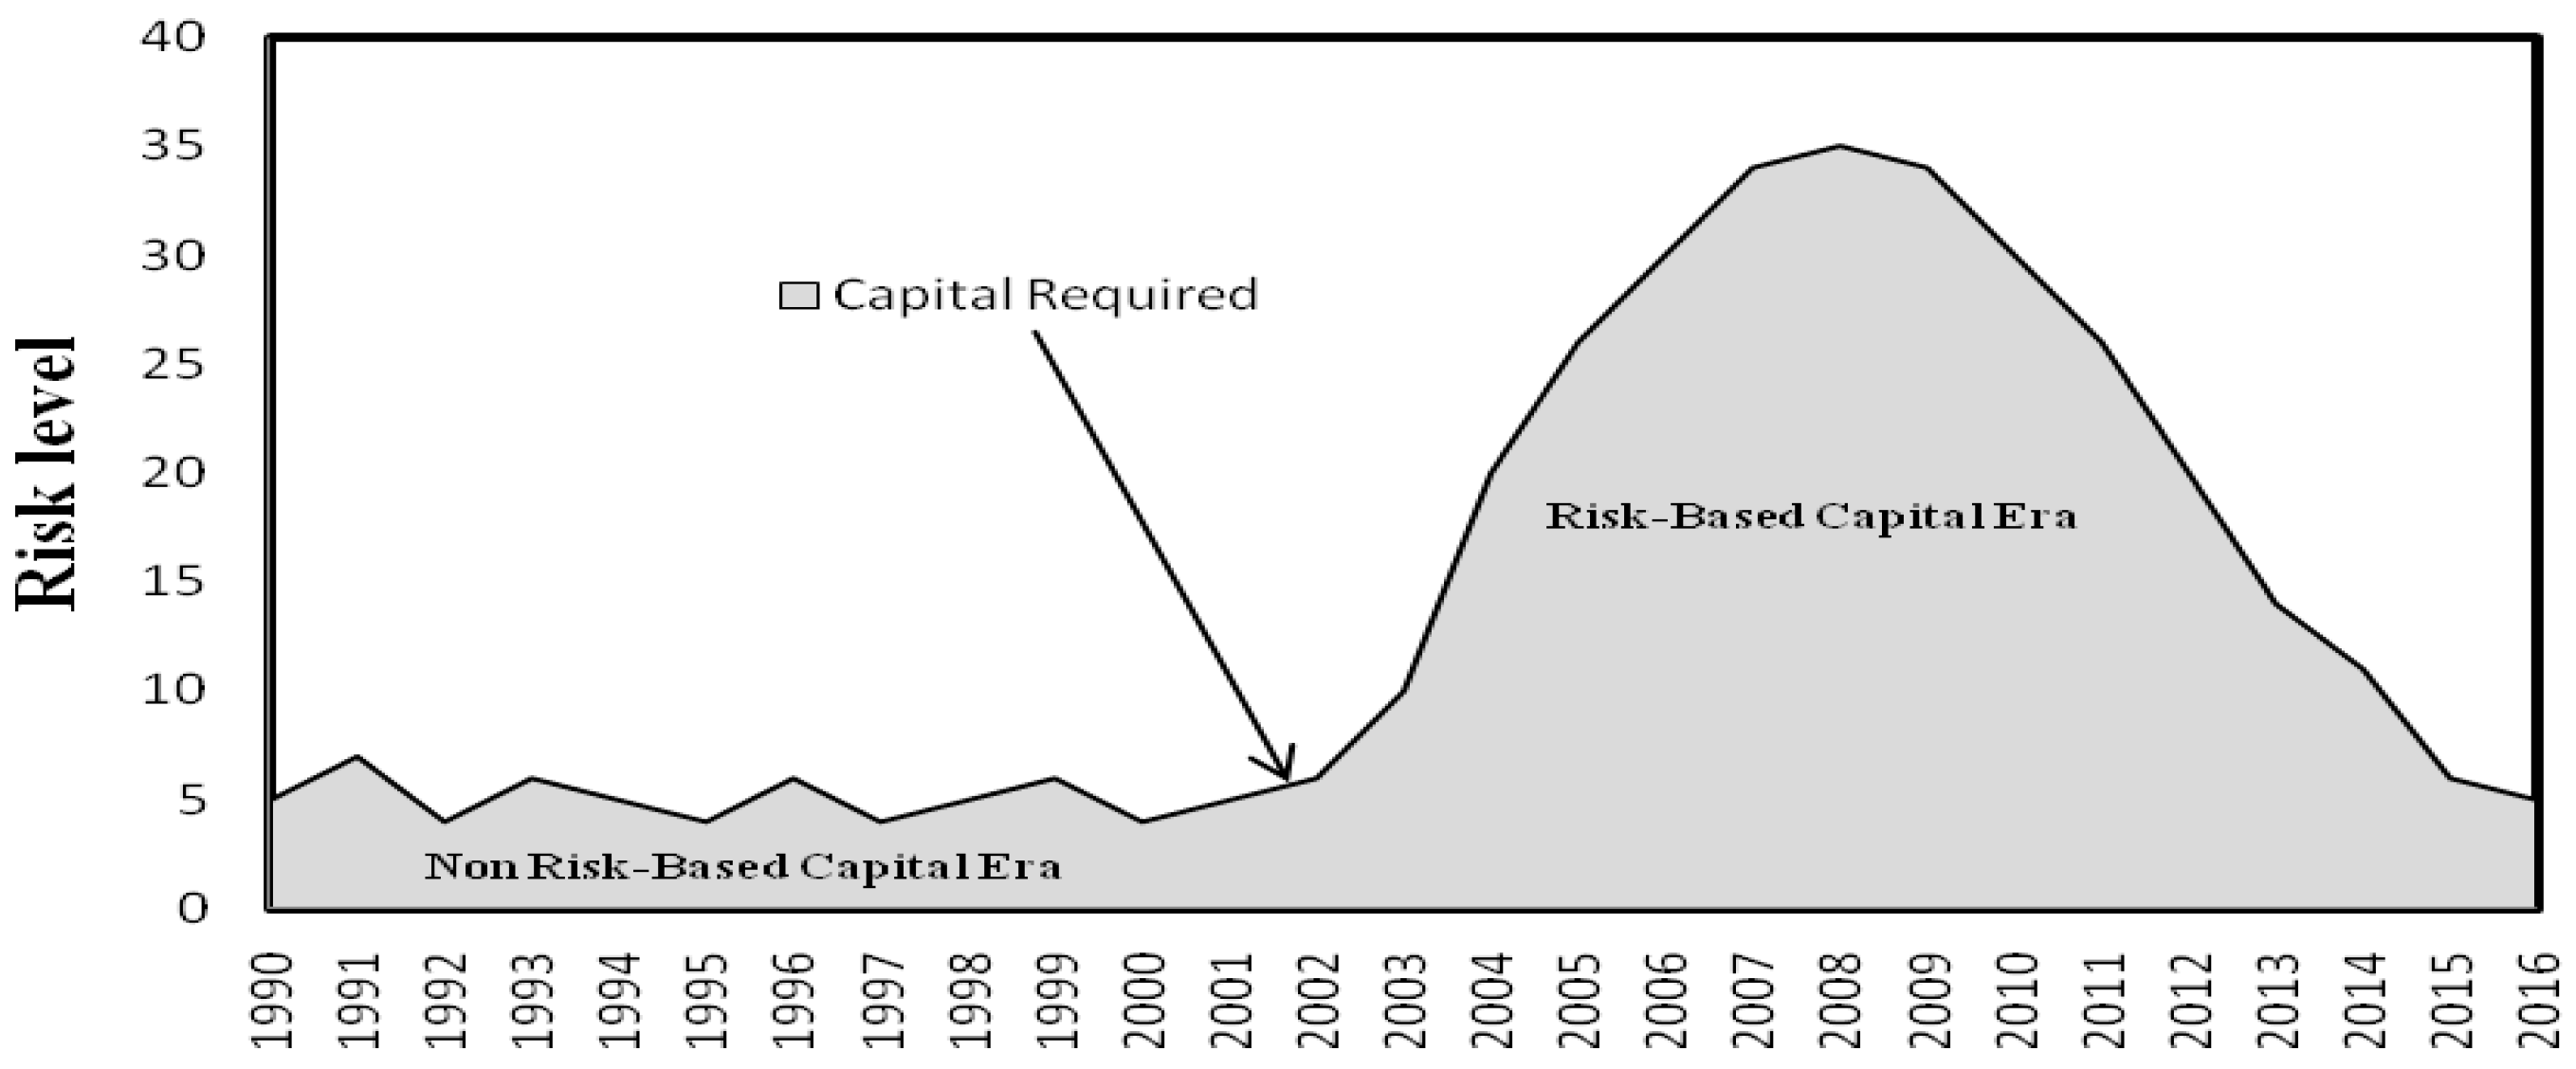
RBC is defined as the amount of capital required by a company to protect itself against adverse movements in its risk profile, (Oyugi and Mutuli 2014). RBC implies that firms having high risk level must correspondingly have high capital to provide cushion for the high risk. It basically restricts the volume of risk a firm can assume. In contrast, NRBC otherwise called fixed capital standard (FCS) does not take into account insurer’s risk exposure level. NRBC requires an insurer to hold certain fixed amount of capital regardless of their risk exposure or volume of risk assumed. Explaining the difference between RBC and NRBC regime, Hartman et al. (1992, p. 214) said, “…a risk-based capital requirement represents a potentially significant improvement over current capital requirements, which do not effectively respond to the changing riskiness of an insurance company”. For clarity, Figure 2 illustrates an outlook of capital structure under NRBC and RBC regimes.
Until 2003, all insurers were required to hold a fixed capital of about N0.02 billion (i.e., N200,000,000) which was fixed in 1997. Beginning from 2003 through to 2005, Figure 3 shows that life and non-Life insurers held different volumes of capital in line with volume of risks assumed as was specified in Solvency I. According to African Business (2007, p. 53), “[by RBC…], regulators had sounded the death knell for many insurers;… many of whom were not only concerned at the magnitude of the capitalization, but also felt that the timing was unfair as it came during the final period of the banking sector’s reform, at which time, the capital markets had been repeatedly drawn upon by the banks”.
In retrospect, we argue that RBC policy may leave some confounded effect on performance of insurers. At present, there are cases of ‘unjustified’ liquidation and litigations between regulators and practitioners (Duru 2008). Investigating this phenomenon may be timely for both players in the nation’s insurance industry.
2.3. Theoretical and Empirical Review
Studies involving capital structure and firm performance have always been rooted on the predictions of capital structure theories among which are the trade off theory (static or dynamic), perking order theory and, free cash flow theory. In this study, we adopt the dynamic tradeoff theory which explains that every firm has a target capital which it would attempt to achieve by weighing the associated costs and benefits. For insurance firms, some scholars explained the trade-off logic to mean the balancing of equity and technical provision costs based on speed of adjustment (SoA) required to attain target capital (Dhaene et al. 2015; Eling and Marek 2014); and in this process, performance might be affected (Onaolapo and Kajola 2010). This paper also applies risk capital theory, which states that firms that are unprepared to bear significant default risk must hold enough capital to cover any undesired financial consequences of their business risks (Erel et al. 2015). In this study, we test to ascertain the nature of the association between insurance-based capital structure measure (TPR) and insurance performance as predicted by tradeoff theory and to find out if higher capital holding guarantees superior performance as predicted by risk capital theory, given that, holding high capital attracts costs (e.g., agency and rental costs) and could lead to idle fund vis-à-vis unproductive asset (Toporowski 2008).
Empirically, Insurers’ leverage ratio which is a measure of capital structure was found to affect profitability negatively (Öner Kaya 2015). On the contrary, a highly levered and, low liquid insurers and reinsurers were found to perform better than their counterparts (Adams and Buckle 2003); this implies that capital structure positively affects insurance performance. In another study, results show that capital structure did not directly influence insurers’ performance (Muhlnickel et al. 2016). Tacitly, the authors concluded that higher capital requirement were less important for big insurers. In another study, a positive association between marginal allocation of risk-capital and probability distribution of returns was found within insurers (Perold 2005). This means that capital and returns (or performance) relate positively. Recently, findings from empirical study reveal that technical provision and equity relates positively and negatively respectively to insurance performance (Akpan et al. 2017b). However, in this study, some theoretically relevant variables were excluded and the model may have been under-fitted and this may have affected the results obtained. Moreover, the study was conducted using a 15-year old data set, which could be considered stale and too old to guarantee generalization.
In another study, these authors used a dependent sample and Wilcoxon signed-rank t-tests; a parametric and non-parametric method respectively to analyze the difference (if any) in performance before and after RBC policy implementation. Findings reveal significant reduction in ROA, ROE and EPS in post-RBC regime, whereas, prior to this period, there was relative improvement in these performance measures (Akpan et al. 2017c). Also, in their study, the effect of capital structure was not considered in the analysis probably due to the methodology adopted. It is therefore, necessary to further investigate the association between capital structure using a single and different proxy in an expanded model and different methodology. This study thus fits into this gap. We expect that the findings will complement the result of earlier studies and provide a robust outcome for proper understanding of the thrust of this investigation, while adding to the stock of literature in this domain.
3. Materials and Methods
3.1. Sample and Variables
This study used 15 out of 26 listed insurance firms that are currently trading on the Nigerian Stock Exchange (NSE). From the NSE Factbook and, the Nigerian Insurance Statistics and Directory 2010, these 15 insurers have relevant information and data for the period reviewed. The NRBC regime covers 8 years (1995–2002) while RBC regime covers 8 years (2008–2015), giving a balanced panel data with 120 observations each period. The dependent variable in this study is insurance performance measured by earnings per share (EPS) and returns on asset (ROA) while the independent variable is capital structure represented by technical provision ratio (TPR). Asset growth, asset tangibility, interest rate, risk-taking behaviour, business risk, inflation rate, gross domestic product (GDP) serves as controlled variables in the model. Table 1 shows the operational definition of the variables and expected signs. However, the original data (see Table S1a and Table S2a in Supplementary Materials) used for this study were transformed into standardized data (see Table S2B and Table S2B in Supplementary Materials) using standardization procedure which is among other methods of data transformation recommended by earliest researchers (Emerson and Stoto 1983; Emerson 1983; Tukey 1957), while the model adopted is similar to that used by Cox (2007) and is given below:
where: X = a named variable; min(X) = least value of the named variable; max(X) = largest value of the named variable; 1 = constant (added to eliminate zeros and negative values).
[X − min(X)/max(X) − min(X)] + 1
3.2. Model and Estimation Method
Following recommendations and application by past author (Abata and Migiro 2016; Olokoyo 2013; Semykina and Wooldridge 2010), the present study employed a fixed effect (FE) and random effect (RE) models. We adopt two stage least square (2SLS) estimation procedures to account for endogeneity problem among our variables. Therefore, the baseline panel data regression models for this study are as follows:
where = adjusted treatment technical provision ratio, δ = constant term, α = beta coefficient for regressors and controlled variables, μ = stochastic error term. All other variables in the models are as defined in Table 1. Model 2 is used to test for the first stage effect of instrument-treatment correlation via regression of performance on capital structure and controlled variables. Model 3 is used at second stage to test for estimated direct effect of the treatment on EPS and ROA.
3.3. Data Description
The quality and characteristics of data used in this study were ascertained using descriptive statistics along with graph of the trend of only three key panel variables; correlation statistics and panel unit root test.
3.3.1. Descriptive Statistics
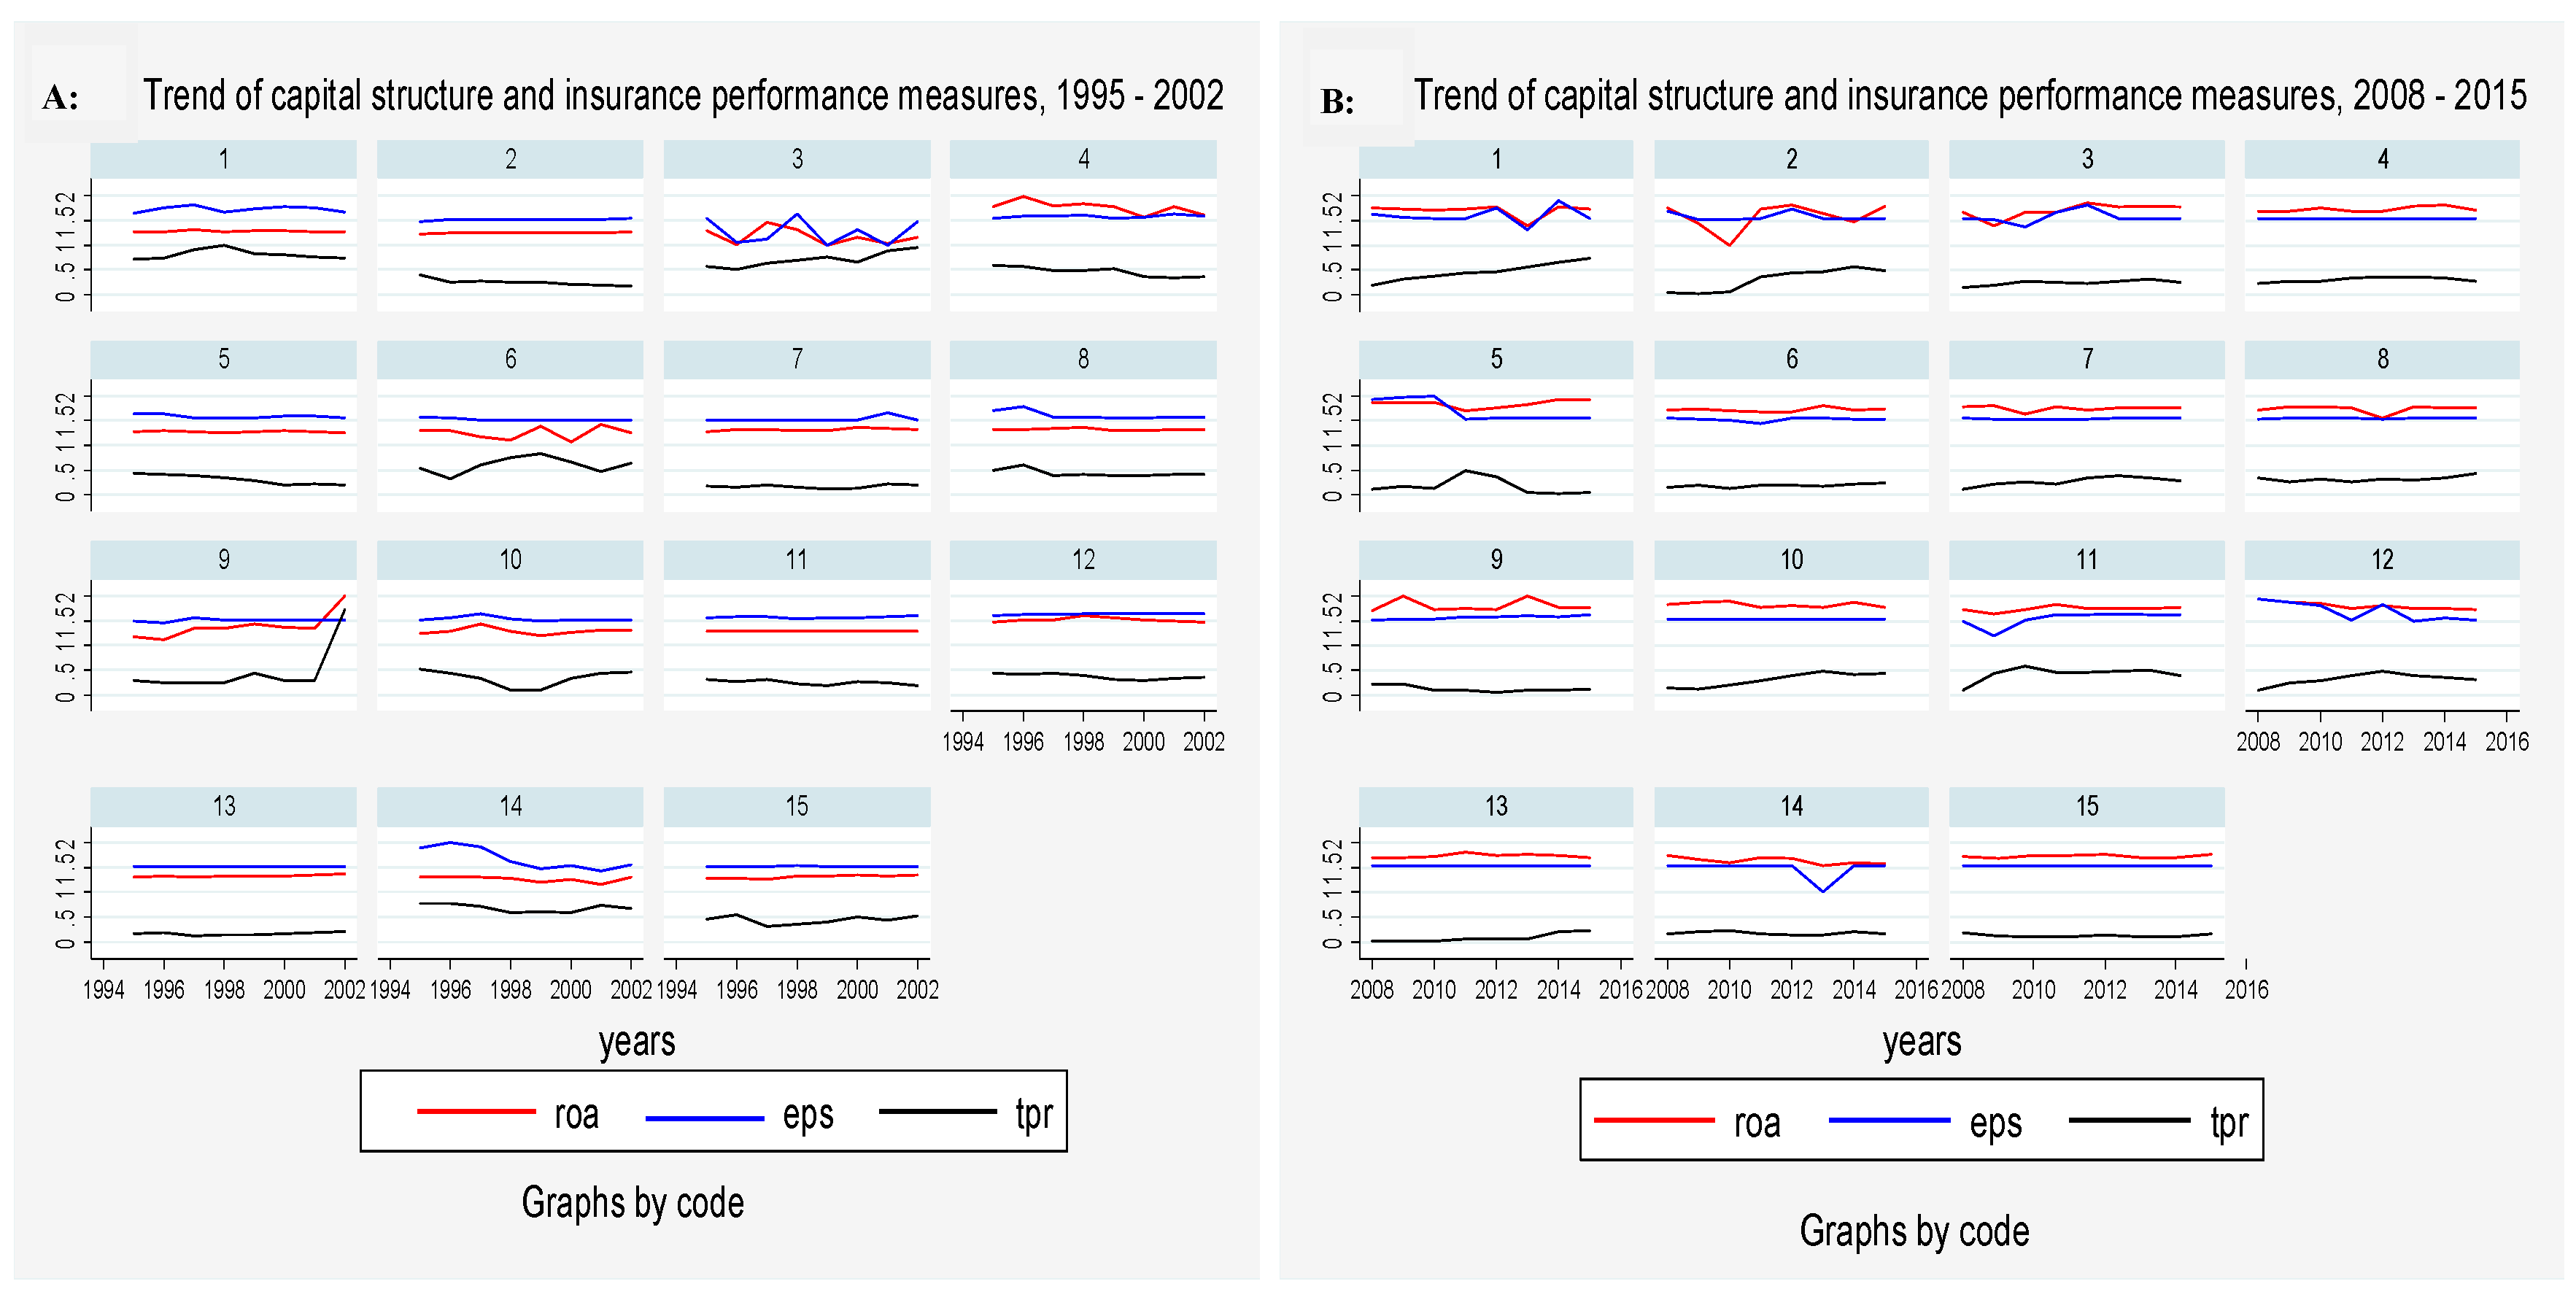
The descriptive statistical techniques employed in describing the characteristics of the data used are basically mean and graphs. Table 2 presents the summary of descriptive statistics of variables, while Figure 4 presents a graph showing the trend of panel variables for both regimes.
For conciseness, we desire to limit discussions on descriptive statistics to core variables of the study. As shown in Table 2, during NRBC regime, the mean value for ROA and EPS are 1.3346 and 1.5520 respectively while for RBC regime the values are 1.7365 and 1.5632 respectively. On average, this means that in both regimes, all insurers recorded strong performance in all indices. However, during NRBC, the firms recorded more increase in EPS than in ROA and a reverse under RBC regime. By implication, shareholders appear to benefit more than equity stakeholders during NRBC while equity investors gained more than other shareholders during RBC regime. In like manner, the mean values of capital structure variable (TPR) are 0.4306 during NRBC and 0.2548 during RBC regime. This means that, on average, 43.06% and 25.48% of fund in insurers’ capital structures were from technical provision during NRBC and RBC regime respectively. This implies that during RBC regime insurers raised more fund internally probably through equity to boost their capital so as to meet the RBC requirement than they do through technical provision. This shifts insurers more towards a mutual than stock form of ownership, and this has some implications for agency problems.
From the above figure, panel trend indicating relative stationarity of key variables: ROA, EPS and TPR during NRBC regime (1995–2002) and RBC regime (2008–2015) are illustrated in Figure 4A,B respectively. Comparatively, during NRBC regime, we observed a downward parallel trend with less volatility in ROA and EPS, whereas both measures moved interactively upward with relative high frequency during RBC regime. Concerning TPR, in NRBC regime, the variable trended downward to the right with high volatility and far below RAO and EPS. In RBC regime, it trended upward to the right with less volatility and far below ROA and EPS. The implication of the analysis is that during NRBC regime, insurance performance seems to maintain relative stability in growth whereas in RBC, it shows instability. It may follow that the different volumes of TPR held by insurers during NRBC allows for a stable growth in performance while it cause fluctuations in performance during RBC regime. In both scenarios, TPR exhibited some changes that tend to reflect the stationary property or nature of our research variables which is common among panel data (see Hlouskova and Wagner 2006).
3.3.2. Correlations
Table 3 contains correlation between variables. Interest rate (INR) was excluded from the model as it highly correlated with Inflation rate (INF). From the table, the direction of the correlation between key variables of the study (ROA, EPS and TPR) is positive, which means that, more technical provision funds led to more ROA and EPS in both regimes. The controlled variables have also exhibited expected signs except oar, tan, and igw in NRBC and oar, tan, and gdp in the RBC era. Overall, at 70% threshold, there were no significant correlations among the variables used for this study. The unobserved multicollinearity was further tested using variance inflation factor (VIF) in each regression model.
3.3.3. Panel Unit Root
In Table 4, results of the panel unit root test are reported for four different methods namely the LLC—Levin-Lin-Chu (Levin et al. 2002), the IPS—Im-Pesaran-Shin (Im et al. 2003), the Augmented Dickey and Fuller (1979), and PP-Fisher Chi-square (Phillips and Perron 1988). Based on the results of each variable for both periods, we observed that our research variables exhibit significant stationary behaviour and as such all the null hypothesis that our data has unit root are, on average, rejected at a level except for some few variables which are stationary at firs difference.
4. Results and Discussions
4.1. The Effect of Insurance Performance on Capital Structure
Regression result model 2, which tests the above relationship is not part of the objectives of this study, but it reported in Table 5 to confirm if our key variables are endogenoue. In the table, the Hausman test shows that RE model is more relevant in NRBC and FE in RBC regime given an insignificant value of 1.15 and a significant value of 5952.79 respectively. The diagnostic tests return VIF value of 1.73, which ndicates lack of multicollinearity. Based on RE model, ROA significantly influences TPR in NRBC with a coefficient of 0.712. Although EPS is insignificant in the model, it has, however, shown a theoretically expected negative sign with TPR in both eras, and so has ROA in RBC era. We thus conclude that insurance performance and capital structure are endogenous as foud in many other studies (Oino and Ukaegbu 2015; Nakhaei and Jafari 2015). Therefore, the predicted TPR was obtained and used as explanatory variable in the second stage regression analysis. This way, the problem of endogeneity is resolved.
4.2. The Effect of Capital Structure on Earnings per Share (EPS)
Table 6 and Table 7 contain results of regression model 3, which is TPR regression on EPS. FE corrected model is used for NRBC given a statistically significant Hausman Chi2 (10) value of 52.70 and Wald chi2 (15) value of 3566.75, which indicates the presence of heteroscedasticity while RE model is appropriate for RBC era. Both models have no autocorrelation and multicollinearity problems and their F-test/Wald X2 (10) values are significant, thus indicating goodness of fit. From the table, the FE model shows that TPR is positively related to EPS at a significant coefficient of 0.453 during NRBC, thus we fail to reject the hypothesis (H1a) that there is a positive relationship between TPR and EPS of insurance firms in NRBC era in Nigeria. This finding is in line with empirical findings (Fosu 2013; Majumdar and Sen 2010).
During RBC period, the RE model reveals a negative coefficient value of −0.002, which is not significant. So, we do not accept the hypothesis (H1b) that there is a positive relationship between TPR and EPS of insurance firms in RBC era in Nigeria. Though insignificant, we would however, deduce that the deployment of technical provision fund leads to a marginal decrease in EPS and this finding is supported by tradeoff theory and other empirical studies. Holding the controlled factors constant, we interpret that under RBC, it does not pay to finance projects with technical provision fund. Therefore, this represents a scenario where borrowed capital, as a major component of TPR, destroys wealth especially when firms have high TPR financing with insufficient income (Muscettola 2013). Such financing exposes the firm to bankruptcy and ultimately failure (Nadaraja et al. 2011).
4.3. The Effect of Capital Structure on Returns on Assets (ROA)
The result of the above relationship is presented in Table 7. The model diagnostic results return Wald chi2 (15) values of 3553.31 and 827.61 for NRBC and RBC regimes respectively. These values are statistically significant at 0.01 level. Again the presence of heteroscedasticity in our model is confirmed while there are no autocorrelation and multicollinearity problems. Thus, a FE model corrected for heteroscedasticity was estimated as the final regression result for TPR and ROA in both regimes. In all, the F-test/Wald X2(10) are significant, which indicate that the models are good. In relation to ROA, the model shows that TPR is positively and significantly related to ROA with a coefficient of 1.513 during NRBC regime. We thus refuse to reject the hypothesis (H2a) that there is a positive relationship between TPR and ROA of insurance firms in NRBC era in Nigeria. The finding is supported by empirical studies (Muhlnickel et al. 2016; Muscettola 2013), although it goes against the prediction of the dynamic tradeoff theory.
Considering the result for RBC regime, the FE-robust model returns a positive and insignificant coefficient of 1.084. This means that in RBC, technical provision has not contributed to ROA although both variables relate positively. Majority of the controlled variables have reasonable coefficients with expected signs but none is significant. Based on the expected sign of the coefficient, though insignificant, we do not reject the corresponding hypothesis (H2b) that there is a positive relationship between TPR and ROA of insurance firms in RBC era in Nigeria. However, when compared with NRBC regime, it is assumed that under RBC period, technical provision fund has not contributed to ROA, but it does under NRBC period.
4.4. Discussion of Findings
From the results, the use of technical provision has a significant positive effect on insurance performance during NRBC when compared with RBC regime. In fact, the technical provision fund has a positive but marginal contribution to insurance performance during the RBC regime. It thus follows that the transition to the RBC regime with focus on technical provision results in a less desired outcome in terms of ROA in particular. This means that the policy led insurers to holding less capital in terms of TPR. Recall that during RBC, the descriptive statistics showed that the technical provision fund makes up only 25.48% of the capital structure against 43.06% during the NRBC regime. Thus, the marginal contribution of TPR during RBC should not be surprising because by risk capital theory that should be expected. On the contrary, the positive association found during NRBC means that insurers generated more returns and this is against the tradeoff theory. Invariably, the high returns could have led to low speed of adjustment (SoA) and its associated cost, hence more returns. Our finding is supported by other empirical studies (Avci 2016; Nwude et al. 2016; Shyu 2013), and is contrary to others (Bandyopadhyay and Barua 2016; Vătavu 2015; Fosu 2013).
However, while we may not attribute poor EPS under the RBC regime to the negative effect of factors like inflation and risk taking, we could hold such reason for ROA since other variables like age, growth and tax rate all influence ROA negatively along with inflation and risk taking. This means that low profits, in terms of ROA, may be caused by high inflation, tax, poor growth and age of the firm. Overall, when compared with the volume of technical fund in the capital structure during NRBC and RBC eras, this finding is supported by risk capital theory, that holding large capital vide technical provision (as it is in NRBC rather than in RBC regime) does preclude the firm from bankruptcy. Therefore, the assumption that a high technical provision fund increases the likelihood of bankruptcy may only be valid where there are more such funds without commensurate profit, in which case, it increases the liability and risk that the firms face.
5. Concluding Remarks
In this paper, we have investigated the effect of capital structure measured by technical provision ratio on insurance performance under two policy regimes of NRBC and RBC. During the NRBC regime insurers were more profitable in both ROA and EPS than during RBC. In the RBC regime insurers significantly recorded losses in EPS while there was no significant improvement in ROA. Comparatively therefore, we conclude based on our results that insurers in Nigeria performed better during NRBC than the RBC regime with technical provision being the preferred funding option. The poor performance during the RBC regime is probably due to the negative influence of some firm specific and macroeconomic factors like age, poor growth, inflation and tax. Unfortunately, RBC is an unavoidable regulatory policy and its implementation would be difficult to halt. Thus, it is imperative to look at various implications of this study for available strategic options for profitable compliance.
Theoretically, analysis and decision on an insurer’s capital structure should transcend beyond interest-bearing to non-interest-bearing liabilities, in which case technical provision could be considered adequate measure. This way, an alternative theoretical analysis is necessary as tradeoff predictions have failed. Therefore, when linking capital structure to insurance performance, a combination of capital structure theories could holistically explain such relationships better. Practically, financial decisions of insurance managers would involve an insightful analysis of the opportunity costs associated with the non-interest-bearing liability component of the capital structure for better tradeoffs. As our result reveals, insurers seem to benefit more in terms of EPS and ROA when using technical provision under a less regulated regime. Practically, it does appear that as their career depends on operating the company in regular conditions (probably in the NRBC scenario), managers prefer not to use the technical fund under RBC during which the operational condition is irregular and greater control makes it difficult for them to pursue their own interest. This may also account for why performance is poor during the RBC regime. The use of incentives and compensation could dissuade managers from such aptitude and encourage them to work effortlessly under irregular conditions for the growth of the firm. The policy implication is the need to integrate the technical provision fund with a focus on non-interest-bearing proportion into further capital-based related reform.
For future studies, it would be expedient to explore other measures of capital structure variables like equity ratio in relation to insurance performance, especially as our models exhibit marginal explanatory power. This indicates that our variable of interest may not be a key determinant of ROA in an RBC scenario. The sample size used for this study is relatively small due to data unavailability; future studies should consider, where possible, the inclusion of more firms.
Supplementary Materials
The following are available online at www.mdpi.com/2076-0760/6/4/143/s1.
Author Contributions
Sunday S. Akpan conceived, wrote, designed and analyzed the data; Fauziah Mahat supervised the process of conception and writing of the manuscript focusing on theoretical and empirical compliance of the research propositions; Bany Ariffin Amin Noordin assisted in drafting the methodology and design and contributed to model development and specification for data analysis; Annuar Bin Md A. Nassir inspected and vetted the overall manuscript writing language and arrangements to ensure its compliance with academic research writing conventions and traditions.
Conflicts of Interest
The authors declare no conflict of interest.
References
- Abata, Matthew Adeolu, and Stephen Oseko Migiro. 2016. Corporate governance and management of earnings: empirical evidence from selected Nigerian-listed companies. Journal of Economics and Behavioural Studies 8: 54–74. [Google Scholar]
- Abdeljawad, Islam, Fauzias Mat-Nor, Izani Ibrahim, and Ruzita Abdul-Rahim. 2013. Dynamic capital structure trade-off theory: Evidence from Malaysia. International Review of Business Research Papers 9: 102–10. [Google Scholar]
- Abor, Joshua. 2005. The effect of capital structure on profitability: an empirical analysis of listed firms in Ghana. The Journal of Risk Finance 6: 438–45. [Google Scholar] [CrossRef]
- Abor, Joshua. 2007. Debt policy and performance of SMEs: Evidence from Ghanaian and South African firms. The Journal of Risk Finance 8: 364–79. [Google Scholar] [CrossRef]
- Adams, Mike, and Mike Buckle. 2003. The determinants of corporate financial performance in the Bermuda insurance market. Applied Financial Economics 13: 133–43. [Google Scholar] [CrossRef]
- African Business. 2007. Insurance in Nigeria. An African Business Special Report. Available online: http://newafricanmagazine.com/archive/images/pdfs/Nigeria/ab_nigeria_insurance_0407.pdf (accessed on 23 May 2016).
- Akpan, Sunday S., Fauziah Mahat, Bany-Ariffin A. Nordin, and Annuar Nassir. 2017a. Another look at risk-based capital regime, capital structure, insurer’s risk profile and performance: A conceptual paper. Paper presented at Global Conference on Business and Economics Research (GCBER), Universiti Putra Malaysia, Serdang, Malaysia, August 14–15. [Google Scholar]
- Akpan, Sunday S., Fauziah Mahat, Bany-Ariffin A. Nordin, and Annuar Nassir. 2017b. Revisiting Insurance Capital Structure, Risk-Taking Behaviour and Performance between 1995–2002. Asian Social Science 13: 128–41. [Google Scholar] [CrossRef]
- Akpan, Sunday S., Fauziah Mahat, Bany-Ariffin A. Nordin, and Annuar Nassir. 2017c. Are these periods the same? Comparing insurance performance under risk-and non risk-based capital regime in Nigeria. The Empirical Economic Letters. forthcoming. [Google Scholar]
- Avci, Emin. 2016. Capital structure and firm performance: An application on manufacturing industry. İktisadi ve İdari Bilimler Dergisi 38: 15–30. [Google Scholar] [CrossRef]
- Bandyopadhyay, Arindam, and Nandita Malini Barua. 2016. Factors determining capital structure and corporate performance in India: Studying the business cycle effects. The Quarterly Review of Economics and Finance 61: 160–72. [Google Scholar] [CrossRef]
- Berger, Allen N., and Emilia B. Di Patti. 2006. Capital structure and firm performance: A new approach to testing agency theory and an application to the banking industry. Journal of Banking & Finance 30: 1065–102. [Google Scholar] [CrossRef]
- Chadha, Saurabh, and Anil K. Sharma. 2015. Capital structure and firm performance: Empirical evidence from India. Vision 19: 295–302. [Google Scholar] [CrossRef]
- Chaudhuri, Kausik, Subal C. Kumbhakar, and Lavanya Sundaram. 2016. Estimation of firm performance from a MIMIC model. European Journal of Operational Research 255: 298–307. [Google Scholar] [CrossRef]
- Cheng, Jiang, and Mary A. Weiss. 2012a. The Role of RBC, Hurricane Exposure, Bond Portfolio Duration, and Macroeconomic and Industry-wide Factors in Property–Liability Insolvency Prediction. Journal of Risk and Insurance 79: 723–50. [Google Scholar] [CrossRef]
- Cheng, Jiang, and Mary A. Weiss. 2012b. Capital Structure in the property-liability insurance industry: Tests of the tradeoff and pecking order theories. Journal of Insurance Issues 35: 1–43. Available online: http://www.jstor.org/stable/41946324 (accessed on 23 April 2016).
- Cox, Nicholas J. 2007. Transformations: An introduction. Boston College Faculty Microcomputer Resource Center. Available online: http://fmwww.bc.edu/repec/bocode/t/transint.html (accessed on 23 April 2016).
- Dang, Viet A., MInjoo Kim, and Yongcheol Shin. 2012. Asymmetric capital structure adjustments: New evidence from dynamic panel threshold models. Journal of Empirical Finance 19: 465–82. [Google Scholar] [CrossRef]
- Davydov, Denis. 2016. Debt structure and corporate performance in emerging markets. Research in International Business and Finance 38: 299–311. [Google Scholar] [CrossRef]
- De Haan, Leo, and Jan Kakes. 2010. Are non-risk based capital requirements for insurance companies binding? Journal of Banking & Finance 34: 1618–27. [Google Scholar] [CrossRef]
- Dhaene, Jan, Cynthia Hulle, Gunther Wuyts, Frederiek Schoubben, and Wim Schoutens. 2017. Is the capital structure logic of corporate finance applicable to insurers? Review and analysis. Journal of Economic Surveys 31: 169–89. [Google Scholar] [CrossRef]
- Dickey, David A., and Wayne A. Fuller. 1979. Distribution of the estimators for autoregressive time series with a unit root. Journal of the American Statistical Association 74: 427–31. [Google Scholar] [CrossRef]
- Duru, N. 2008. NAICOM’s Unending Liquidation Exercise. Thisday. Available online: https://www.proshareng.com/news/Archives/NAICOMs-Unending-Liquidation-Exercise/3553 (accessed on 2 February 2008).
- Eling, Martin, and Sebastian D. Marek. 2014. Corporate governance and risk taking: Evidence from the UK and German insurance markets. Journal of Risk and Insurance 81: 653–82. [Google Scholar] [CrossRef]
- El-Sayed Ebaid, Ibrahim. 2009. The impact of capital-structure choice on firm performance: empirical evidence from Egypt. The Journal of Risk Finance 10: 477–87. [Google Scholar] [CrossRef]
- Emerson, John D. 1983. Mathematical aspects of transformation. In Understanding Robust and Exploratory Data Analysis. Edited by David Caster Hoaglin, Frederick Mosteller and John Tukey. New York: John Wiley, pp. 247–82. [Google Scholar]
- Emerson, John D., and Michal A. Stoto. 1983. Transforming data. In Understanding Robust and Exploratory Data Analysis. Edited by David Caster Hoaglin, Frederick Mosteller and John Tukey. New York: John Wiley, pp. 97–128. [Google Scholar]
- Erel, Isil, Stewart C. Myers, and James A. Read. 2015. A theory of risk capital. Journal of Financial Economics 118: 620–35. [Google Scholar] [CrossRef]
- Florio, Cristina, and Giulia Leoni. 2017. Enterprise risk management and firm performance: The Italian case. The British Accounting Review 49: 56–74. [Google Scholar] [CrossRef]
- Foo, Varian, Amer Azlan A. Jamal, Mohd Rahimie A. Karim, and Zatul Karamah Ahmad B. Ulum. 2015. Capital structure and corporate performance: panel evidence from oil and gas companies in Malaysia. International Journal of Business Management and Economic Research 6: 371–79. [Google Scholar]
- Fosu, Samuel. 2013. Capital structure, product market competition and firm performance: Evidence from South Africa. The Quarterly Review of Economics and Finance 53: 140–51. [Google Scholar] [CrossRef]
- Hartman, David G., Paul Braithwaite, Robert P. Butsic, Patricia A. Furst, Allan M. Kaufman, Stephen P. Lowe, Daniel K. Lyons, Walter J. Fitzgibbon Jr., Michael G. McCarter, Sholom Feldblum, and et al. 1992. Property-Casualty Risk-Based Capital Requirement—A Conceptual Framework. A paper prepared by the Actuarial Advisory Committee to the NAIC Property and Casualty Risk-Based Capital Working Group; New York: Actuarial Society, pp. 211–80. [Google Scholar]
- Hlouskova, Jaroslava, and Martin Wagner. 2006. The performance of panel unit root and stationarity tests: results from a large scale simulation study. Econometric Reviews 25: 85–116. [Google Scholar] [CrossRef]
- Im, Kyung So, M. Hashem Pesaran, and Yongcheol Shin. 2003. Testing for unit roots in heterogeneous panels. Journal of Econometrics 115: 53–74. [Google Scholar] [CrossRef]
- Khan, H. A. 2004. Global Markets and Financial Crises in Asia: Towards a New Theory for the 21st Century. London: Palgrave. [Google Scholar]
- Kyereboah-Coleman, Anthony. 2007. The impact of capital structure on the performance of microfinance institutions. The Journal of Risk Finance 8: 56–71. [Google Scholar] [CrossRef]
- Lai, Iris. 2011. Malaysia Looks to Risk-Based Capital Model for Takaful. Best Week Asia/Pacific. Available online: www3.ambest.com/ambv/bestnews/presscontent.aspx?altsrc=0&refnum=17718 (accessed on 25 May 2016).
- Levin, Andrew, Chien-Fu Lin, and Chia-Shang James Chu. 2002. Unit root tests in panel data: Asymptotic and finite-sample properties. Journal of Econometrics 108: 1–24. [Google Scholar] [CrossRef]
- Majumdar, Sumit, and Kunal Sen. 2010. Corporate borrowing and profitability in India. Managerial and Decision Economics 31: 33–45. [Google Scholar] [CrossRef]
- Margaritis, Dimitris, and Maria Psillaki. 2007. Capital structure and firm efficiency. Journal of Business Finance & Accounting 34: 1447–69. [Google Scholar] [CrossRef]
- Muhlnickel, Janina, Gregor N. Weiss, and Anne-Christine Schmidt. 2016. Capital and the Performance of Insurance Companies. Working Paper 16-05. Leipzig, Germany: University of Leipzig, April 18. [Google Scholar]
- Muscettola, Marco. 2013. Leverage risk. The weight of borrowed capital distinguishes the solvency of firms: An empirical analysis on a sample of 4500 Italian SMEs. International Journal of Economics and Finance 5: 24. [Google Scholar] [CrossRef]
- Nadaraja, Punitharaja, Abdul H. Zulkafli, and Tajul A. Masron. 2011. Family ownership, firm’s characteristics and capital structure: Evidence from public listed companies in Malaysia. Economia Seria Management 14: 141–55. [Google Scholar]
- Nakhaei, Maryam, and Seyedeh Mahbobeh Jafari. 2015. Survey of the relationship between capital structure and free cash flow with financial performance of companies listed in Tehran stock exchange. Indian Journal of Science and Technology 8: 1–11. [Google Scholar] [CrossRef]
- Nwude, E. Chuke, Idam O. Itiri, Bamidele O. Agbadua, and Sergius N. Udeh. 2016. The Impact of Debt Structure on Firm Performance: Empirical Evidence from Nigerian Quoted Firms. Asian Economic and Financial Review 6: 647. [Google Scholar] [CrossRef]
- Oino, Isaiah, and Ben Ukaegbu. 2015. The impact of profitability on capital structure and speed of adjustment: An empirical examination of selected firms in Nigerian Stock Exchange. Research in International Business and Finance 35: 111–21. [Google Scholar] [CrossRef]
- Olokoyo, Felicia. O. 2013. Capital structure and corporate performance of Nigerian quoted firms: A panel data approach. African Development Review 25: 358–69. [Google Scholar] [CrossRef]
- Onaolapo, Adekunle. A., and Sunday O. Kajola. 2010. Capital structure and firm performance: evidence from Nigeria. European Journal of Economics, Finance and Administrative Sciences 25: 70–82. [Google Scholar]
- Öner Kaya, Emine. 2015. The effects of firm-specific factors on the profitability of non-life insurance companies in Turkey. International Journal of Financial Studies 3: 510–29. [Google Scholar] [CrossRef]
- Oyugi, Margaret, and Moses Mutuli. 2014. An approach to Risk Based Capital for African Life Insurers. Paper presented at the International Congress of Actuaries, Washington, DC, USA, March 30–April 4. [Google Scholar]
- Perold, Andre. 2005. Capital allocation in financial firms. Journal of Applied Corporate Finance 17: 110–18. [Google Scholar] [CrossRef]
- Pervan, Maja, and Tomislava P. Kramarić. 2010. Determinants of insurance companies’ profitability in Croatia. The Business Review, Cambridge 16: 209–16. [Google Scholar]
- Pervan, Maja, M. Curak, and I. Mariajnovic. 2012. Dynamic panel analysis of B&H insurance companies’ profitability. Recent Researches in Business and Economics, 158–63. [Google Scholar]
- Phillips, Peter C. B., and Pierre Perron. 1988. Testing for a unit root in time series regression. Biometrika 75: 335–46. [Google Scholar] [CrossRef]
- Semykina, Anastasia, and Jeffrey M. Wooldridge. 2010. Estimating panel data models in the presence of endogeneity and selection. Journal of Econometrics 157: 375–80. [Google Scholar] [CrossRef]
- Shim, Jeungbo. 2010. Capital-based regulation, portfolio risk and capital determination: Empirical evidence from the US property–liability insurers. Journal of Banking and Finance 34: 2450–61. [Google Scholar] [CrossRef]
- Shyu, Jonchi. 2013. Ownership structure, capital structure, and performance of group affiliation: Evidence from Taiwanese group-affiliated firms. Managerial Finance 39: 404–20. [Google Scholar] [CrossRef]
- Toporowski, Jan. 2008. Excess Capital and Liquidity Management. Working Paper No. 549. Annandale-on-Hudson, NY, USA: Levy Economics Institute of Bard College. [Google Scholar]
- Tukey, John W. 1957. On the comparative anatomy of transformations. The Annals of Mathematical Statistics 28: 602–32. [Google Scholar] [CrossRef]
- Ujunwa, K., and N. Modebe. 2011. Repositioning Insurance Industry for Operational Efficiency: The Nigerian Case. Journal of Applied Finance & Banking 1: 15–32. [Google Scholar]
- Usman, O. A. 2009. Scale economies and performance evaluation of insurance market in Nigeria. The Social Sciences 4: 1–11. [Google Scholar]
- Vătavu, Sorana. 2015. The impact of capital structure on financial performance in Romanian listed companies. Procedia Economics and Finance 32: 1314–22. [Google Scholar] [CrossRef]
- Yusof, Aida Y., Wee-Yeap Lau, and Ahmad F. O. Osman. 2016. A Critical Analysis of the Malaysian Risk-Based Capital Framework: A Comparison between General Insurance and Takaful. Institutions and Economies 8: 23–41. [Google Scholar]
- Zec, Nicolas. 2012. Use of an Internal Model in a General Insurance Company: Focus on Economic Capital Allocation. Available online: https://ssrn.com/abstract 2161308 (accessed on 23 May 2016).
- Zeitun, Rami, and Gary G. Tian. 2014. Capital structure and corporate performance: evidence from Jordan. Australasian Accounting, Business and Finance Journal 1: 3. [Google Scholar] [CrossRef]
Figure 1.
Premium contribution to world by Nigeria and other countries. Source: Computed from IMF data on insurance industry report for Nigeria.
Figure 1.
Premium contribution to world by Nigeria and other countries. Source: Computed from IMF data on insurance industry report for Nigeria.
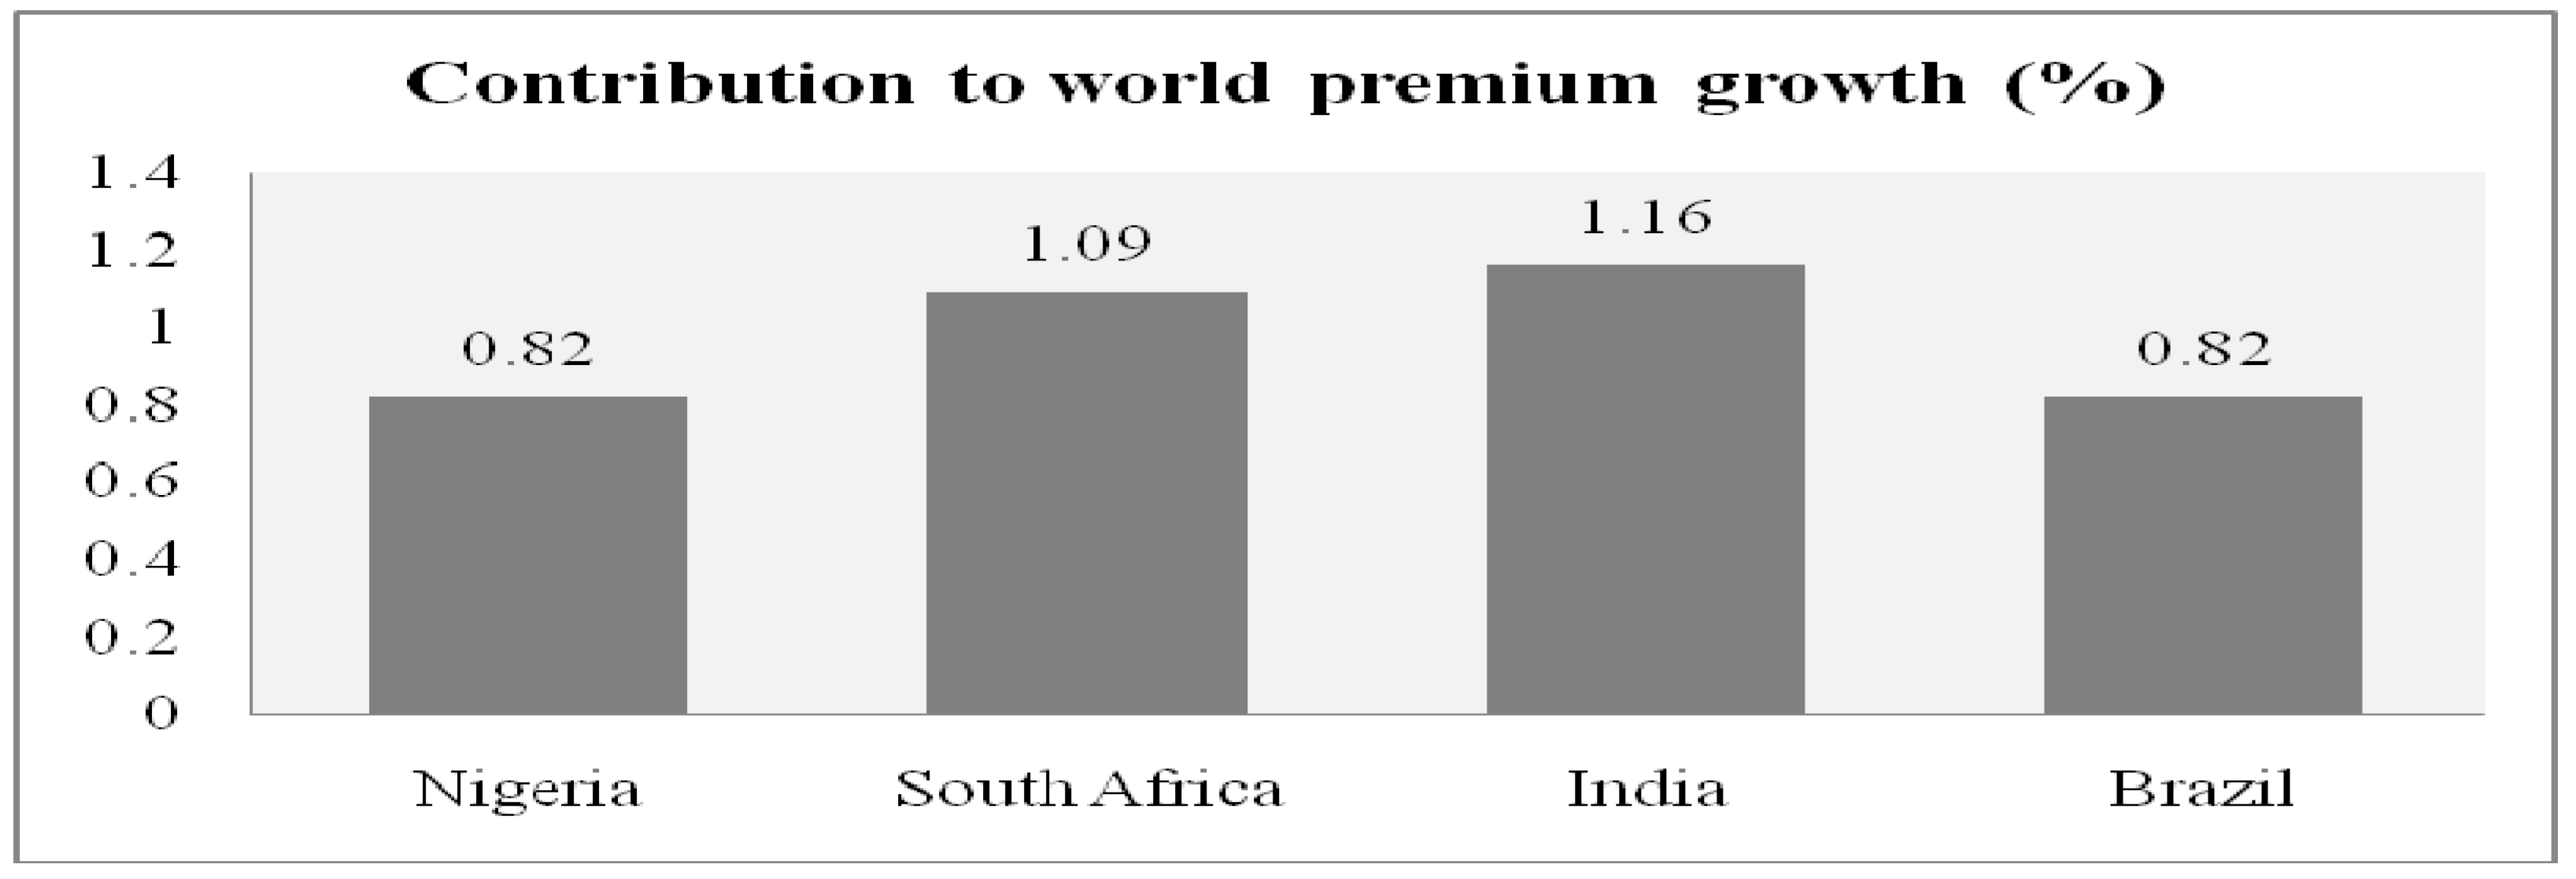
Figure 2.
Simulation of a firm’s capital requirement. Source: Inference from Shimpi & Re (2002).

Figure 3.
Trend of capital requirement for Nigerian Insurers, 1997, 2003, 2005. Source: NAICOM, 2015.
Figure 3.
Trend of capital requirement for Nigerian Insurers, 1997, 2003, 2005. Source: NAICOM, 2015.
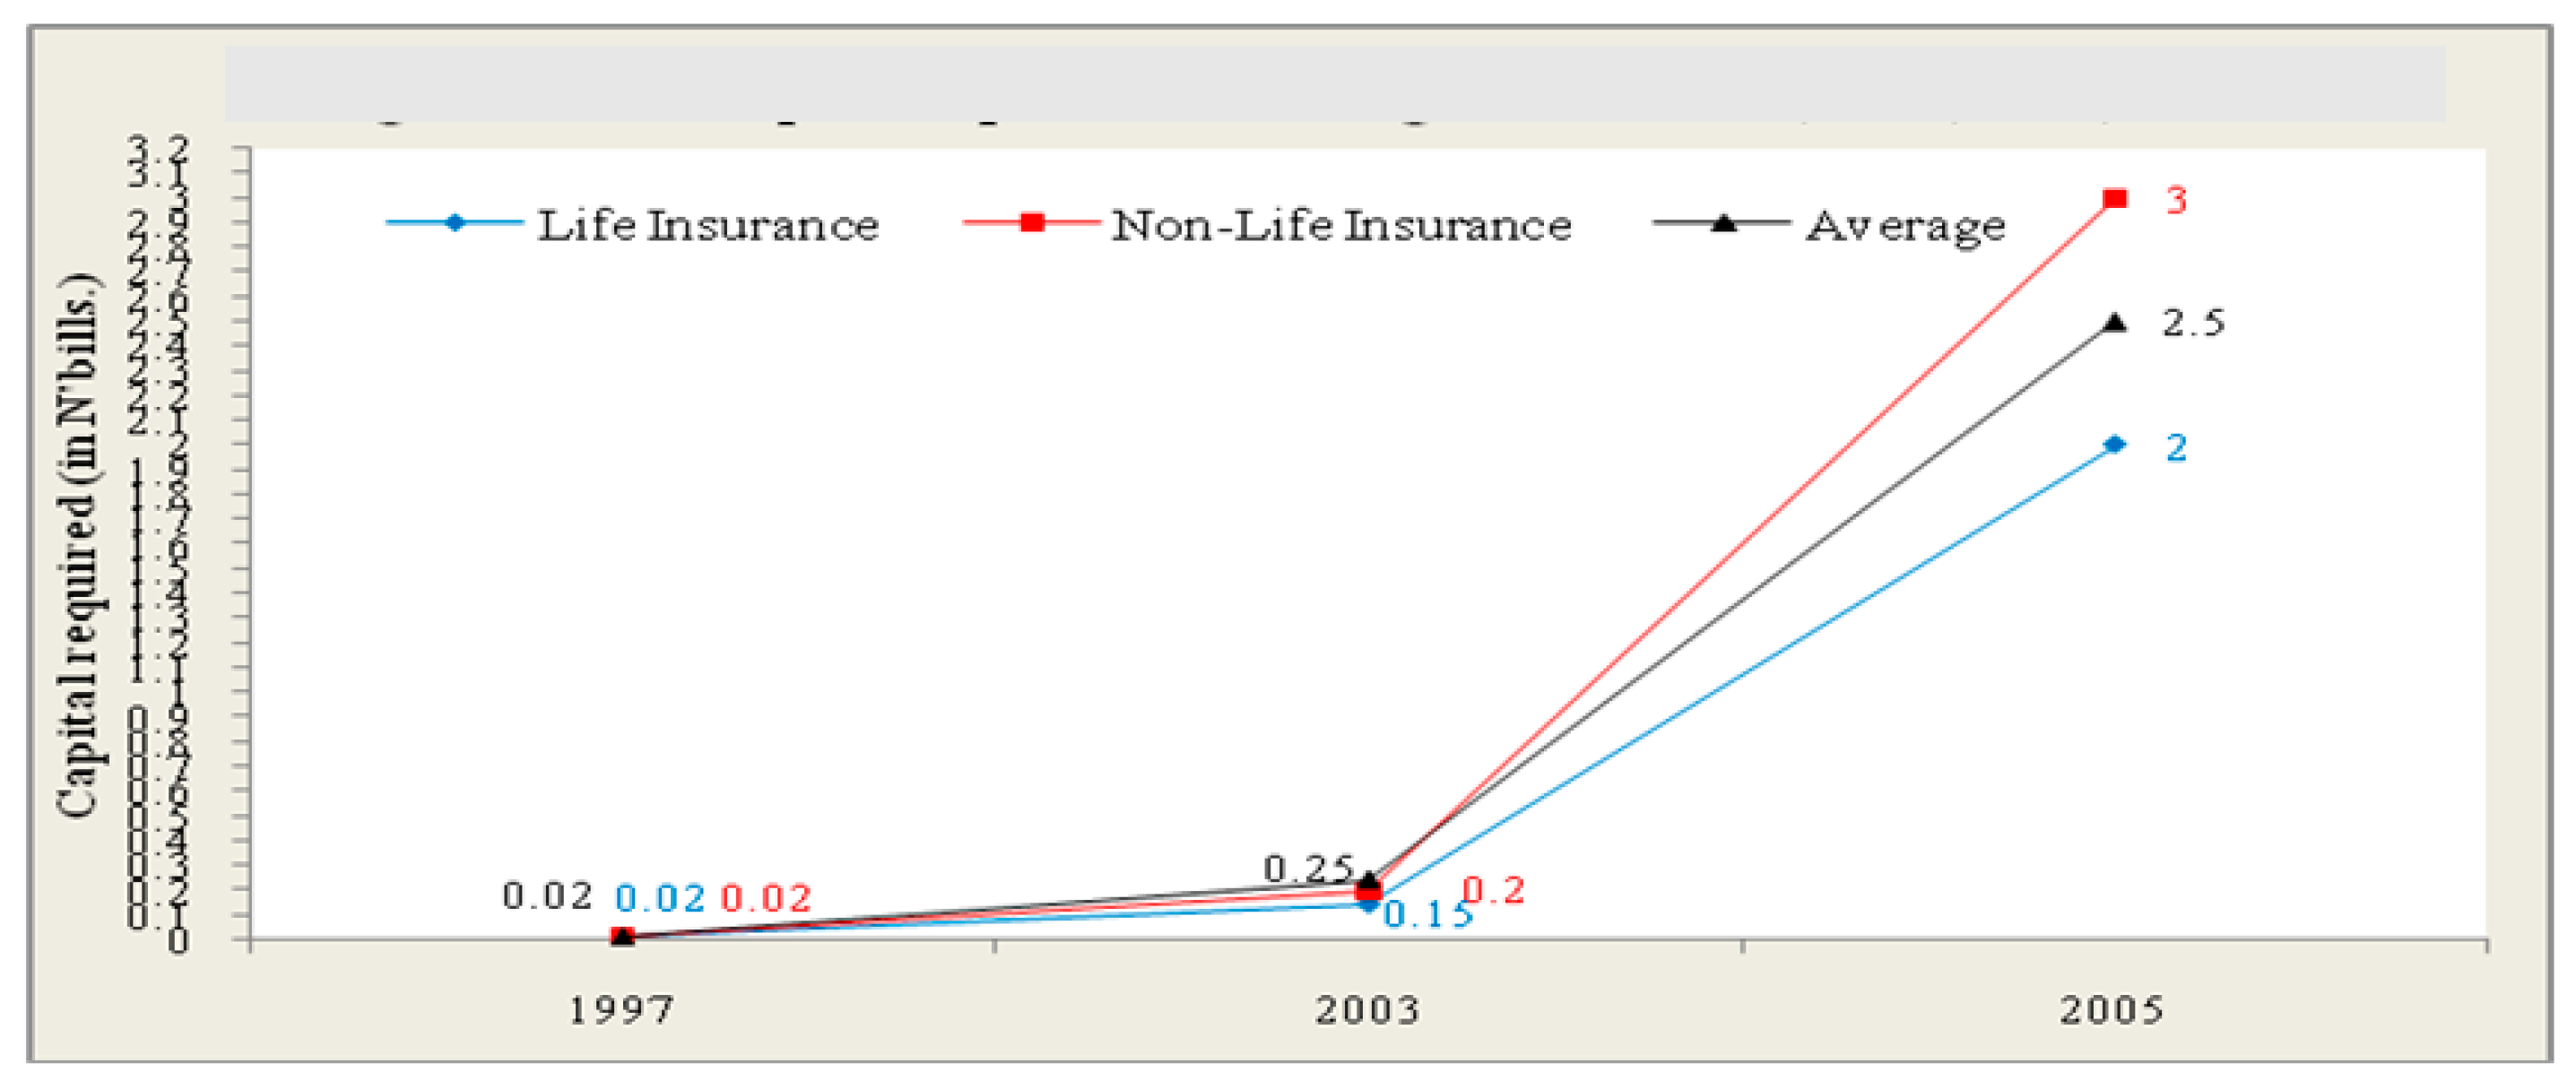
Figure 4.
Graphs of the trend of panel variables between 1995–2002 and 2008–2015.


Table 1.
Variables operationalization and expected signs.
| Variables | Description | Code | Expected Signs |
|---|---|---|---|
| Dependent | eps, roa | (+/−) | |
| Earnings per share | Ratio of net profit to number of equity shares | eps | |
| Returns on assets | Ratio of net profit to total asset | roa | |
| Independent | |||
| Technical provision ratio | Ratio of total technical reserves to total assets | tpr | + |
| Controlled | |||
| Risk-taking behaviour | Dummy variable 1 for risk-taker and 0 otherwise | crb | + |
| Insurer age | Natural log. of current less incorporation year | lag | − |
| Insurer size | logarithm of total asset | lsz | + |
| Asset tangibility | Ratio of fixed asset to total asset | tan | + |
| Insurer’s growth | Ratio of change in total asset to total asset | igw | + |
| Tax rate | Ratio of current year’s tax to EBIT | tar | − |
| Interest Rate | Yearly nominal interest rate | inr | − |
| Inflation rate | Annual consumer price index | inf | − |
| Growth rate of GDP | Value of gross total annual output | gdp | + |
| Opportunity asset risk | Variance in ROA | oar | + |
Table 2.
Descriptive statistics of research variables between 1995–2002 and 2008–2015.
| Non Risk-Based Capital Regime (NRBC) | Risk-Based Capital Regime (RBC) | |||||||||
|---|---|---|---|---|---|---|---|---|---|---|
| Variable | Obs | Mean | Std. Dev. | Min | Max | Obs | Mean | Std. Dev. | Min | Max |
| roa | 120 | 1.3346 | 0.1647 | 1.0004 | 2.0004 | 120 | 1.7365 | 0.1180 | 0.9998 | 1.9996 |
| eps | 120 | 1.5520 | 0.1334 | 1 | 2 | 120 | 1.5632 | 0.1226 | 1 | 2 |
| tpr | 120 | 0.4306 | 0.2453 | 0.098 | 1.719 | 120 | 0.2548 | 0.1502 | 0.01 | 0.743 |
| crb | 120 | 0.5833 | 0.4950 | 0 | 1 | 120 | 0.4666 | 0.5009 | 0 | 1 |
| lag | 120 | 1.3943 | 0.2344 | 0.602 | 1.643 | 120 | 1.5921 | 0.1263 | 1.23 | 1.756 |
| lsz | 120 | 5.7982 | 0.7181 | 4.052 | 8.883 | 120 | 7.0034 | 0.2482 | 6.573 | 7.9 |
| tan | 120 | 0.2687 | 0.2409 | 0.005 | 1.131 | 120 | 0.1081 | 0.1266 | 0.001 | 1.077 |
| igw | 120 | 1.5024 | 0.1455 | 0.9998 | 2.2278 | 120 | 1.0781 | 0.0880 | 1 | 2 |
| tar | 120 | 1.5040 | 0.1798 | 1.0003 | 2.0004 | 120 | 1.5212 | 0.0874 | 1 | 2 |
| inr | 120 | 1.6221 | 0.3137 | 1 | 2 | 120 | 1.4716 | 0.2716 | 1 | 2 |
| inf | 120 | 1.2135 | 0.3176 | 1 | 2 | 120 | 1.4597 | 0.3191 | 1 | 2 |
| gdp | 120 | 1.6138 | 0.3653 | 1 | 2 | 120 | 1.6133 | 0.3270 | 1 | 2 |
| oar | 120 | 1.6038 | 0.2301 | 0.9997 | 1.9973 | 120 | 1.6051 | 0.2066 | 1.0001 | 2.0004 |
Source: Stata output of relevant input variables.
Table 3.
Simple correlation matrix of research variables between 1995–2002 and 2008–2015.
| roa | eps | tpr | oar | crb | lag | lsz | tan | igw | tar | inr | inf | gdp | |
|---|---|---|---|---|---|---|---|---|---|---|---|---|---|
| Panel A: Non risk-based capitalization regime | |||||||||||||
| roa | 1.000 | ||||||||||||
| eps | 0.268 | 1.000 | |||||||||||
| tpr | 0.119 | 0.084 | 1.000 | ||||||||||
| oar | −0.074 | 0.046 | 0.306 | 1.000 | |||||||||
| crb | 0.053 | 0.360 | −0.052 | −0.241 | 1.000 | ||||||||
| lag | −0.516 | 0.023 | 0.055 | −0.196 | −0.028 | 1.000 | |||||||
| lsz | 0.118 | 0.148 | 0.195 | 0.157 | 0.017 | 0.046 | 1.000 | ||||||
| tan | −0.162 | −0.325 | 0.199 | 0.332 | −0.284 | −0.006 | −0.297 | 1.000 | |||||
| igw | −0.040 | 0.050 | −0.262 | −0.209 | 0.167 | −0.130 | 0.108 | −0.190 | 1.000 | ||||
| tar | −0.626 | −0.192 | 0.078 | 0.255 | −0.141 | 0.359 | 0.110 | 0.185 | −0.191 | 1.000 | |||
| inr | 0.043 | −0.064 | −0.068 | −0.003 | −0.115 | 0.087 | 0.153 | 0.034 | −0.109 | 0.086 | 1.000 | ||
| inf | −0.039 | 0.098 | 0.048 | 0.006 | 0.166 | −0.141 | −0.278 | −0.024 | 0.156 | −0.115 | −0.749 | 1.000 | |
| gdp | 0.013 | 0.000 | −0.008 | −0.002 | −0.144 | 0.098 | 0.190 | −0.027 | 0.001 | 0.070 | 0.296 | −0.454 | 1.000 |
| Panel B: Risk-based capitalization regime | |||||||||||||
| roa | 1.000 | ||||||||||||
| eps | 0.375 | 1.000 | |||||||||||
| tpr | 0.024 | 0.046 | 1.000 | ||||||||||
| oar | −0.166 | 0.104 | 0.337 | 1.000 | |||||||||
| crb | 0.001 | −0.042 | 0.285 | 0.309 | 1.000 | ||||||||
| lag | −0.082 | −0.035 | 0.090 | −0.067 | −0.171 | 1.000 | |||||||
| lsz | 0.071 | 0.189 | 0.310 | 0.240 | 0.252 | −0.069 | 1.000 | ||||||
| tan | −0.189 | −0.134 | 0.164 | −0.069 | 0.195 | 0.181 | −0.300 | 1.000 | |||||
| igw | 0.083 | 0.313 | 0.226 | 0.172 | 0.104 | 0.010 | 0.351 | −0.050 | 1.000 | ||||
| tar | −0.108 | −0.031 | −0.143 | 0.042 | 0.089 | 0.014 | −0.070 | −0.039 | −0.018 | 1.000 | |||
| inr | 0.058 | −0.057 | 0.036 | −0.001 | 0.103 | 0.034 | 0.050 | 0.022 | 0.011 | 0.027 | 1.000 | ||
| inf | −0.132 | 0.133 | −0.194 | 0.034 | −0.265 | −0.149 | −0.150 | −0.126 | −0.114 | 0.017 | −0.486 | 1.000 | |
| gdp | −0.104 | 0.019 | −0.234 | 0.031 | −0.256 | −0.163 | −0.172 | −0.116 | −0.011 | 0.131 | −0.114 | 0.463 | 1.000 |
Source: Stata output of relevant input variables.
Table 4.
Panel unit root tests for 15 listed insurers in Nigeria, 1995–2002 and 2008–2015.
| Method/Variables | LLC | IPS | ADF-Fisher Chi-Square | PP-Fisher Chi-Square |
|---|---|---|---|---|
| Panel A: Non risk-based regime (1995–2002) | ||||
| eps | −13.9233 *** 1(0) | −5.96048 *** 1(0) | 90.6172 *** 1(0) | 105.430 *** 1(0) |
| roa | −4.69969 *** 1(0) | −1.36441 * 1(0) | 51.2116 ** 1(0) | 51.6790 ** 1(0) |
| tprhat | −6.95449 *** 1(0) | −2.13483 ** 1(0) | 57.3998 *** 1(0) | 61.1900 *** 1(0) |
| oar a | −6.44628 *** 1(1) | −2.72810 ** 1(1) | 60.8717 *** 1(1) | 71.1240 *** 1(1) |
| crb a | −4.16016 *** 1(1) | −1.43647 * 1(1) | 10.1289 ** 1(1) | 16.1345 ** 1(1) |
| lag | −110.628 *** 1(0) | −110.628 *** 1(0) | 228.921 *** 1(0) | 230.601 *** 1(0) |
| lsz a | −9.59416 *** 1(1) | −2.92196 *** 1(1) | 60.8828 *** 1(1) | 75.4218 *** 1(1) |
| tan | −193.971 *** 1(0) | −32.7480 *** 1(0) | 60.5429 *** 1(0) | 34.0184 *** 1(0) |
| igw | −14.1790 *** 1(0) | −5.44805 *** 1(0) | 86.2712 *** 1(0) | 118.779 *** 1(0) |
| tar | −18.1655 *** 1(0) | −7.27756 *** 1(0) | 103.949 *** 1(0) | 123.914 *** 1(0) |
| Inf | −34.6710 *** 1(0) | −17.6842 *** 1(0) | 226.385 *** 1(0) | 227.264 *** 1(0) |
| gdp | −13.6048 *** 1(0) | −5.46277 *** 1(0) | 94.7918 *** 1(0) | 91.0034 *** 1(0) |
| Panel B: Risk-based regime (2008–2015) | ||||
| eps | −7.62033 *** 1(0) | −2.48707 ** 1(0) | 56.0860 ** 1(0) | 67.6379 *** 1(0) |
| roa | −8.65688 *** 1(0) | 2.87189 ** 1(0) | 60.8518 *** 1(0) | 68.9595 *** 1(0) |
| tprhat a | −11.9489 *** 1(1) | 3.99242 *** 1(1) | 74.9348 *** 1(0) | 94.6088 *** 1(0) |
| oar a | −10.0913 *** 1(1) | −2.25092 ** 1(1) | 52.3259 ** 1(1) | 62.2243 *** 1(1) |
| crb a | −4.90511 *** 1(1) | −2.04861 ** 1(1) | 16.6562 ** 1(1) | 16.6938 ** 1(1) |
| lag | −11.0415 *** 1(0) | −54.8973 *** 1(0) | 55.2620 *** 1(0) | 55.2620 *** 1(0) |
| lsz | −4.18215 *** 1(0) | −1.43982 ** 1(0) | 52.9620 ** 1(0) | 38.6868 *** 1(0) |
| tan | −9.41401 *** 1(0) | −1.96724 ** 1(0) | 54.5782 ** 1(0) | 60.3332 *** 1(0) |
| igw | −5.83109 *** 1(0) | −2.97256 *** 1(0) | 61.6599 *** 1(0) | 100.054 *** 1(0) |
| tar | −17.9173 *** 1(0) | −5.52394 *** 1(0) | 88.7083 *** 1(0) | 101.377 *** 1(0) |
| inf a | −14.3301 *** 1(1) | −5.62922 *** 1(1) | 97.7708 *** 1(1) | 101.741 *** 1(1) |
| gdp a | −7.72265 *** 1(1) | 2.11397 ** 1(1) | 51.5041 ** 1(1) | 73.3478 *** 1(1) |
Notes: *, ** and, *** indicate significance at 0.05, 0.01 and 0.001 respectively; a indicate variables is stationary at first difference.
Table 5.
Insurance performance regressions on capital structure for 1995–2002 and 2008–2015.
| Regressand | Technical Provision (tpr) | |||
|---|---|---|---|---|
| Policy Regimes | NRBC Regime | RBC Regime | ||
| Regressors | RE | FE | RE | FE |
| roa | 0.712 *** (4.10) | 0.764 *** (4.02) | −0.254 (−1.20) | −0.346 (−1.62) |
| roe | −0.0872 (−0.67) | −0.0837 (−0.62) | 0.308 (1.72) | 0.337 (1.88) |
| eps | −0.0516 (−0.35) | −0.0913 (−0.55) | −0.0854 (−0.76) | −0.0973 (−0.89) |
| oar | −0.0395 (−1.06) | −0.0466 (−1.17) | 0.171 (1.81) | −0.474 (−1.19) |
| crb | 0.233 (0.91) | −0.0367 (−0.08) | 0.0351 (1.19) | 0.0270 (0.81) |
| lag | 0.216 (0.83) | −0.0764 (−0.17) | 0.107 (0.73) | 1.338 (1.93) |
| lsz | 0.0496 (1.58) | 0.0619 (1.59) | 0.0751 (1.07) | −0.0953 (−0.90) |
| tan | 0.0942 (0.99) | 0.0804 (0.79) | 0.435 * (2.44) | 0.344 (1.49) |
| igw | −0.276 ** (−2.83) | −0.285 ** (−2.78) | 0.175 (1.27) | 0.208 (1.60) |
| tar | 0.0156 (0.14) | 0.00770 (0.07) | −0.0654 (−0.50) | 0.0493 (0.37) |
| inf | 0.143 ** (3.06) | 0.129 * (2.55) | −0.0260 (−0.63) | 0.00439 (0.10) |
| gdp | 0.00800 (0.22) | 0.0145 (0.37) | −0.0495 (−1.27) | −0.00984 (−0.22) |
| _cons | −1.064 (−1.44) | −0.269 (−0.22) | −0.705 (−1.10) | −0.619 (−0.43) |
| N | 120 | 120 | 120 | 120 |
| F-test/Wald X2 (12) | 70.91 *** | 5.51 *** | 2.83 ** | |
| R2 | 0.2041 | 0.0662 | 0.3200 | 0.0012 |
| Hausman Chi2 (12) | 1.15 | 5952.79 *** | ||
| Mean VIF | 1.73 | 1.93 | ||
t statistics in parentheses; * p < 0.05, ** p < 0.01, *** p < 0.001. Source: Stata output of relevant input variables.
Table 6.
TPR and EPS regression result for NRBC: 1995–2002 and RBC: 2008–2015.
| Regressand | Earnings per Share (EPS) | ||||
|---|---|---|---|---|---|
| Policy Regime | Non Risk-Based Capital (NRBC) Regime | Risk-Based Capital (RBC) Regime | |||
| Regressors | RE | FE | FE-Robust | RE | FE |
| tprhat | 0.301 * | 0.453 ** | 0.453 * | −0.00156 | −3.380 *** |
| (1.98) | (2.87) | (2.92) | (−0.01) | (−3.44) | |
| oar | −0.0711 | −1.123 *** | −1.123 * | 0.00578 | −3.114 *** |
| (−0.67) | (−4.02) | (−2.27) | (0.08) | (−3.76) | |
| crb | 0.0882 *** | 0.0901 *** | 0.0901 * | −0.0125 | 2.497 * |
| (3.59) | (3.62) | (2.40) | (−0.45) | (2.23) | |
| lag | 0.0612 | −0.474 | −0.474 | −0.0139 | 0.136 |
| (0.61) | (−1.69) | (−1.45) | (−0.12) | (1.37) | |
| lsz | −0.0228 | −0.0100 | −0.0100 | 0.0512 | −0.978 ** |
| (−0.99) | (−0.36) | (−0.51) | (0.83) | (−3.18) | |
| tan | −0.0260 | −0.0156 | −0.0156 | −0.113 | 0.991 *** |
| (−0.40) | (−0.23) | (−0.48) | (−1.09) | (4.60) | |
| igw | 0.0875 | 0.107 | 0.107 | 0.414 ** | 0.166 |
| (0.94) | (1.18) | (2.03) | (3.19) | (1.30) | |
| tar | −0.0988 | −0.0877 | −0.0877 | 0.0546 | 0.0711 |
| (−1.36) | (−1.24) | (−1.03) | (0.44) | (1.73) | |
| inf | 0.000373 | −0.0430 | −0.0430 | 0.0749 * | −0.135 * |
| (0.01) | (−1.07) | (−1.58) | (1.99) | (−2.61) | |
| gdp | 0.0266 | 0.0378 | 0.0378 | −0.0296 | 1.317 |
| (1.02) | (1.53) | (2.09) | (−0.78) | (1.07) | |
| _cons | 1.513 *** | 3.789 *** | 3.789 ** | 0.645 | −3.380 *** |
| (5.35) | (5.37) | (3.52) | (1.26) | (−3.44) | |
| N | 120 | 120 | 120 | 120 | 120 |
| F-test/Wald X2(10) | 3.87 *** | 8.68 *** | 23.75 ** | 4.11 *** | |
| R2 | 0.1809 | 0.0021 | 0021 | 0.1729 | 0.0016 |
| Hausman Chi2(10) | 52.70 *** | 9.04 | |||
| Wald chi2 (15) | 3566.75 *** | ||||
| Wooldridge f-test | 0.722 | 2.855 | |||
| Mean VIF | 1.83 | 1.38 | |||
t statistics in parentheses; * p < 0.05, ** p < 0.01, *** p < 0.001. Source: Stata output of relevant input variables.
Table 7.
TPR and ROA regression result for NRBC and RBC era.
| Regressand | Returns on Assets (ROA) | |||||
|---|---|---|---|---|---|---|
| Non Risk-Based Capital (NRBC) Regime | Risk-Based Capital (RBC) REGIME | |||||
| Regressors | RE | FE | FE-Robust | RE | FE | FE-Robust |
| tprhat | 1.490 *** | 1.513 *** | 1.513 *** | 0.189 | 1.084 | 1.084 |
| (68.57) | (54.13) | (42.24) | (1.15) | (1.15) | (0.42) | |
| oar | −0.328 *** | −0.406 *** | −0.406 *** | −0.197 * | −0.137 | −0.137 |
| (−35.23) | (−8.20) | (−5.06) | (−2.24) | (−0.17) | (−0.07) | |
| crb | 0.0721 *** | 0.0725 *** | 0.0725 *** | 0.0354 | 0.0462 | 0.0462 |
| (20.30) | (16.44) | (16.94) | (1.30) | (0.92) | (0.47) | |
| lag | −0.301 *** | −0.336 *** | −0.336*** | −0.104 | −2.339 * | −2.339 |
| (−38.22) | (−6.74) | (−6.47) | (−0.74) | (−2.18) | (−0.79) | |
| lsz | −0.0697 *** | −0.0700 *** | −0.0700 *** | −0.0216 | 0.164 | 0.164 |
| (−22.74) | (−14.06) | (−20.53) | (−0.33) | (1.73) | (1.28) | |
| tan | −0.152 *** | −0.124 *** | −0.124 *** | −0.248 * | 0.176 | 0.176 |
| (−18.86) | (−10.28) | (−7.91) | (−2.37) | (0.60) | (0.22) | |
| igw | 0.408 *** | 0.417 *** | 0.417 *** | 0.0722 | −0.143 | −0.143 |
| (27.56) | (25.83) | (25.37) | (0.60) | (−0.70) | (−0.33) | |
| tar | −0.0529 *** | −0.0638 *** | −0.0638 * | −0.0903 | −0.212 | −0.212 |
| (−4.55) | (−5.09) | (−2.34) | (−0.77) | (−1.74) | (−1.21) | |
| inf | −0.210 *** | −0.215 *** | −0.215 *** | −0.0255 | −0.0445 | −0.0445 |
| (−33.63) | (−30.04) | (−25.54) | (−0.73) | (−1.13) | (−1.51) | |
| gdp | −0.0119 * | −0.0104 * | −0.0104 * | −0.000522 | 0.00785 | 0.00785 |
| (−2.57) | (−2.38) | (−2.15) | (−0.01) | (0.16) | (0.14) | |
| _cons | 1.783 *** | 1.947 *** | 1.947 *** | 2.430 *** | 4.748 *** | 4.748 |
| (54.02) | (15.58) | (11.34) | (4.46) | (4.03) | (2.01) | |
| N | 120 | 120 | 120 | 120 | 120 | 120 |
| F-test/ Wald X2 (10) | 452.80 *** | 14,886.80 *** | 2.98 ** | 26.40 *** | ||
| R2 | 0.9909 | 0.9821 | 0.9821 | 0.1762 | 0.0162 | 0.0162 |
| Hausman Chi2 (10) | 21.23 ** | 32.89 *** | ||||
| Wald chi2 (15) | 3553.31 *** | 827.61 *** | ||||
| Wooldridge f-test | 1.516 | 1.775 | ||||
| Mean VIF | 1.83 | 1.38 | ||||
t statistics in parentheses; * p < 0.05, ** p < 0.01, *** p < 0.001. Source: Stata output of relevant input variables.
© 2017 by the authors. Licensee MDPI, Basel, Switzerland. This article is an open access article distributed under the terms and conditions of the Creative Commons Attribution (CC BY) license (http://creativecommons.org/licenses/by/4.0/).
Share and Cite
MDPI and ACS Style
Akpan, S.S.; Mahat, F.; Noordin, B.-A.; Nassir, A. Contrasting the Effect of Risk- and Non Risk-Based Capital Structure on Insurers’ Performance in Nigeria. Soc. Sci. 2017, 6, 143. https://doi.org/10.3390/socsci6040143
AMA Style
Akpan SS, Mahat F, Noordin B-A, Nassir A. Contrasting the Effect of Risk- and Non Risk-Based Capital Structure on Insurers’ Performance in Nigeria. Social Sciences. 2017; 6(4):143. https://doi.org/10.3390/socsci6040143
Chicago/Turabian StyleAkpan, Sunday S., Fauziah Mahat, Bany-Ariffin Noordin, and Annuar Nassir. 2017. "Contrasting the Effect of Risk- and Non Risk-Based Capital Structure on Insurers’ Performance in Nigeria" Social Sciences 6, no. 4: 143. https://doi.org/10.3390/socsci6040143
Note that from the first issue of 2016, this journal uses article numbers instead of page numbers. See further details here.