Interdependence Evaluation between the Home Neighborhood and the City: How Socio-Spatial Categorization Impacts upon Residential Segregation


School of Geography Politics and Sociology, Newcastle University, Newcastle upon Tyne NE1 7RU, UK
Soc. Sci. 2018, 7(10), 178; https://doi.org/10.3390/socsci7100178
Submission received: 13 July 2018
/
Revised: 28 August 2018
/
Accepted: 26 September 2018
/
Published: 28 September 2018
(This article belongs to the Special Issue Social Inequality and Residential Segregation in Urban Neighborhoods and Communities)
Abstract
:This paper proposes a socio-cognitive approach to how people assess the different neighborhoods of a city. The main objective is to show that beyond the meanings associated with each neighborhood, the way in which residents relate to and evaluate their own neighborhood and the city center influence how residents perceive and assess the other remaining neighborhoods of the city. The assessment of one neighborhood cannot be analyzed separately from the other neighborhoods. Cognitive processes of assimilation, contrast, contagion, and non-contagion contribute to the conceptualization of a city’s neighborhoods from the two main emotional and symbolic anchorages of residents. However, the implementation of these processes is conditioned by the socio-spatial situation of the interviewees. In this regard, a field survey of 320 residents was conducted in different neighborhoods of Besançon (in France), and allows us to show that the geographical anchorages of a resident’s own neighborhood and the city center are systematically more positively assessed than the other neighborhoods. The more these geographical anchorages are appreciated, the more the other neighborhoods are also positively assessed. The fact that it is impossible for a city’s neighborhoods to be autonomous is discussed in this paper in terms of socio-cognitive constructions of urban segregations.
1. Introduction
This contribution seeks to better understand the process by which residents assess neighborhoods, and thus to describe the relationships between residents’ home neighborhoods, the city center and the other socio-spatial neighborhoods in the construction of their opinion scale. Whether we are researchers, observers, urban planners, or users of a geographical space, it is difficult to grasp it without some form of subdivision or clustering, whether subdivisions are made according to urban form or scale (places, neighborhoods, districts, municipalities, etc.). As explained by Laponce (2001): “it is not possible for us not to use spatial categories to situate ourselves in our physical environment”. The significance of the “neighborhood” in social sciences shows its essential importance in the understanding of urban facts and processes, and more generally the relationships between residents and the city. In other words, the neighborhood is not only a cognitive concept, it also articulates a set of social concepts. Therefore, it is not a coincidence that this spatial categorization of the city has been used since the early American work of the Chicago School, especially to analyze urban segregation and population dynamics. Subsequent studies in geography (Tuan 1975) seeking an alternative to the notion of terroir (i.e., a French word highlighting the specific man/physical environment relationship), or in psychology (Canter 1977) investigating the geographical anchorage of the individual, do not really seem to address the analysis in terms of socio-spatial segregation. The psycho-geographical relationships and the socio-geographical issues are rarely considered as two dimensions that feed each other. The originality of our study is to discuss the relationship between the social and mental structures in connection with the urban space, to bring significant insights to the analysis of spatial segregation and neighborhood representation/reputation.
To do this, we consider the neighborhoods of a city as spatial categories which are socially constructed, whether by means of administrative subdivisions, or the result of a toponymy conveyed by common consensus, because it is difficult to dissociate the political dimension from the vernacular dimension. In other words, the actors involved into the development or dissemination of the spatial category in itself do not interest us in this paper, nor do the issues of its geographical boundaries, even though the analysis of boundaries can provide important information on the construction or maintenance of spatial segregations (Ramadier 2002; Najib 2013). This paper seeks to identify how the residents assess the city’s neighborhoods, and in particular how much they value them in a context of a segregated city (Najib 2017). These assessments cause cognitive processes of assimilation and contrasts on which the conceptualization of all categories is based, whether they concern physical objects (Tajfel and Wilkes 1963) or people (McGarty and Turner 1992). “Assimilation” entails the accentuation of the resemblances between objects of a category regarding the most significant characteristics of the category; while “contrast” entails the accentuation of the differences between objects that are associated with different categories. Schwarz and Bless (1992) have also shown that assimilation and contrast are coupled with processes of inclusion (or contagion) and exclusion (or non-contagion). These processes are applied to the geographical space. For example, and following many researches on geographical distance assessment (Wilton 1979; McNamara 1986; Holding 1994), Mishra and Mishra (2010) show that spatial categorization processes bias the risk assessment: judgments depend on the spatial categories involved in the assessment, whether they are part of the same superordinate category (assimilation-inclusion) or different categories (contrast-exclusion). Finally, the environmental values follow the spatial categories order (Hirtle and Jonides 1985), and in this sense, we make the general assumption that these categorization processes, when applied to space, contribute to the maintenance of existing social segregation in the geographical space.
A significant change in the social composition of a space is almost systematically accompanied by a change of meanings granted to the space, as well as a change in its physical and functional organization (or even in its boundaries). Conversely, when the representation of a space evolves, these changes are concomitant with the evolution of the practices and populations present in the place. In other words, the close relationship between social and geographical spaces is partly the result of correspondences between social and cognitive structures (Durkheim and Mauss 1903) as identified by sociologists (Bourdieu and Wacquant 1992) or psychologists (Doise 1985; Lorenzi-Cioldi 2002). Cognitive structures resulting from the process of assimilation/contrast persist beyond socio-spatial dynamics. The maintenance of social segregation is less based on the configuration of a geographical space than on the mental and social structures that construct the spatial configuration. For example, the city center is not in itself dedicated to the dominant sections of the population, but the values and practices that these sections defend can lead them to foster this geographical space when they stabilize their hegemony over the other social groups.
One element of permanence in the socio-cognitive relationship to space is shown by Tabernero et al. (2010) who state that residential satisfaction remains stable over time, while attachment to the place is strengthened. However, the latter is subject to conflicting results. Bahi-Fleury (1996) shows that the degree of satisfaction with the social context and the anchorage of the relationship network in the neighborhood are the two main dimensions that are positively correlated with neighborhood attachment. Besides, Lally (1992) states that social relationships do not cause a particular attachment to the neighborhood. Is it because—as Fried (1982) points out—the distinctions between minimal good neighborliness (keeping others at a distance to maintain privacy), cooperation between neighbors, and the deeper friendship relationships are not considered, that the empirical results are so unequivocal? In addition, the contribution of the neighborhood remains difficult to isolate because the choice of its neighbors is involved upstream (i.e., prior to the existing interactions) of residential location decisions (ibid.). Concerning residents of deprived neighborhoods, Permentier et al. (2009, 2011) explain that their neighborhood satisfaction is directly linked to the perceived reputation of their home neighborhood (by the other city residents). Because reputations are interactive, an improvement in the reputation of one group or area may cause a decline in the reputation of another. The negative reputation of a neighborhood can therefore push its residents to leave it. As for the processes of elitist transformation of the residential population, the “pioneers” of gentrification are able, notably through political engagement in the neighborhood, to alter social practices with reference to public spaces, so that those which are no longer desired are replaced by those which are sought (Tissot 2011). In other words, attachment and satisfaction vis-à-vis the residential neighborhood is part of the more general socio-spatial processes related to socio-spatial segregations. Therefore, these psycho-sociological variables do not only define individuals separately, but they also participate in the construction of their relations and positioning in the physical and social space, as well as in the emergence of a socio-spatial structure at the city scale.
Peter and Rodney (1974) have already shown that the favorite area of residence for students, regardless of their geographical location in the world, is their current area of residence. The same authors more generally find that spaces that are not appreciated are conceptualized with reference to the preferred spaces, that is to say that the assessment of a specific space depends on the assessment of other spaces. Thus, preference is not contrasted with indifference because each space is part of a values system that prioritizes spaces between themselves (Hirtle and Jonides 1985). Meanwhile, this opposition between preferred and less preferred spaces also concerns a geographical opposition between the proximal and the distal (i.e., the nearest and the furthest away): on a global scale, the favorite places are significantly closer to the student’s area of residence than the less preferred places. Carpentier (2007) makes the same observation at the regional scale: “the areas preferred by the individuals often correspond to their residential neighborhood” (p. 290), while residential satisfaction is affected by the distance to the city center. Therefore, the geographical dimension already established regarding the space of personal anchorage (spaces close to oneself) and the space of collective and symbolic anchorage (the distance to the city center) also helps to organize the assessment of spaces. Finally, the social, spatial, and cognitive locations that are involved in the process of geographical assessment are highly interdependent and reinforce the hypothesis that they maintain the existing system of socio-spatial categories.
Because the symbolic (the city center) and practical (the own residential neighborhood) geographical anchorages are the most significant ones at the city scale, we make the general assumption that assessment of neighborhoods in a city is not done separately neighborhood by neighborhood, but relies heavily on the assessment of the city center and home neighborhood. This phenomenon would then confirm the cognitive theory of contagion (Galak et al. 2009) that is, that the significant qualities of a concept (here the home neighborhood) are transferred to concepts belonging to the same class (the city’s neighborhoods). However, this contagion does not challenge the hierarchy of neighborhoods in terms of how they are valued. The proximity of the assessor to the social dimension of the neighborhood, and on the other hand to the other relevant neighborhoods contribute to the establishment of an assimilation/contrast process between inclusive spatial categories (the home neighborhood of the resident and the city center) and exclusive spatial categories (the other neighborhoods). The latter is then dependent on the assimilation/contrast process more directly related to the important social groups that compose them. To sum up, residential assessment seems to depend on a socio-geographical construction that, at least, maintains the existing socio-spatial segregation, rather than on a strict personal construction.
2. The Study and Research Context
To better analyze the neighborhoods assessment in an urban space, we use data from a field survey on the residential behaviors of the inhabitants of the city of Besançon, including their opinion and evaluation of different areas of the city. Besançon is a medium-sized city located in Eastern France (close to Switzerland), and is composed of 14 large districts. The city contains more than 170,000 inhabitants and has a high rate of tertiary jobs due to its status as regional capital. Besançon contains some significant pockets of residential segregation but has not undergone major socio-spatial transformations between 1990 and 2006 according to the corresponding population censuses. The general evolutionary trend nevertheless reveals an improvement in its socioeconomic conditions at the city scale. At the neighborhood scale, there are more significant socio-spatial dynamics especially in peripheral areas due to specific urban renewal operations (Najib 2017). However, these dynamics do not entail any particular change in perception and representation of the city’s neighborhoods according to the inhabitants; the way they see the different neighborhoods of the city has not necessarily changed (Najib 2013).
The survey took place in a sample of neighborhoods of the city, but it addresses all areas of the city. More exactly, eight neighborhoods of Besançon were investigated and selected using a statistical classification1 that identifies four types of neighborhoods. Two neighborhoods were randomly picked in each of these four classes to compare similar neighborhoods as well as different neighborhoods. The differentiation criteria concern the characteristics of households and housing since these data are essential in the study on the socio-spatial categorization of urban spaces. They come from the French population census, and concern the social situation of the households (unemployment, lone parent families, etc.), the socio-occupational categories (executives/professionals, manual workers, retirees, etc.), the employment stability (fixed-term contract employees, partial-time contract employees, etc.), as well as the type of housing (collective housing, detached houses, etc.), the tenure status (tenants of private and social housing, owners), etc.
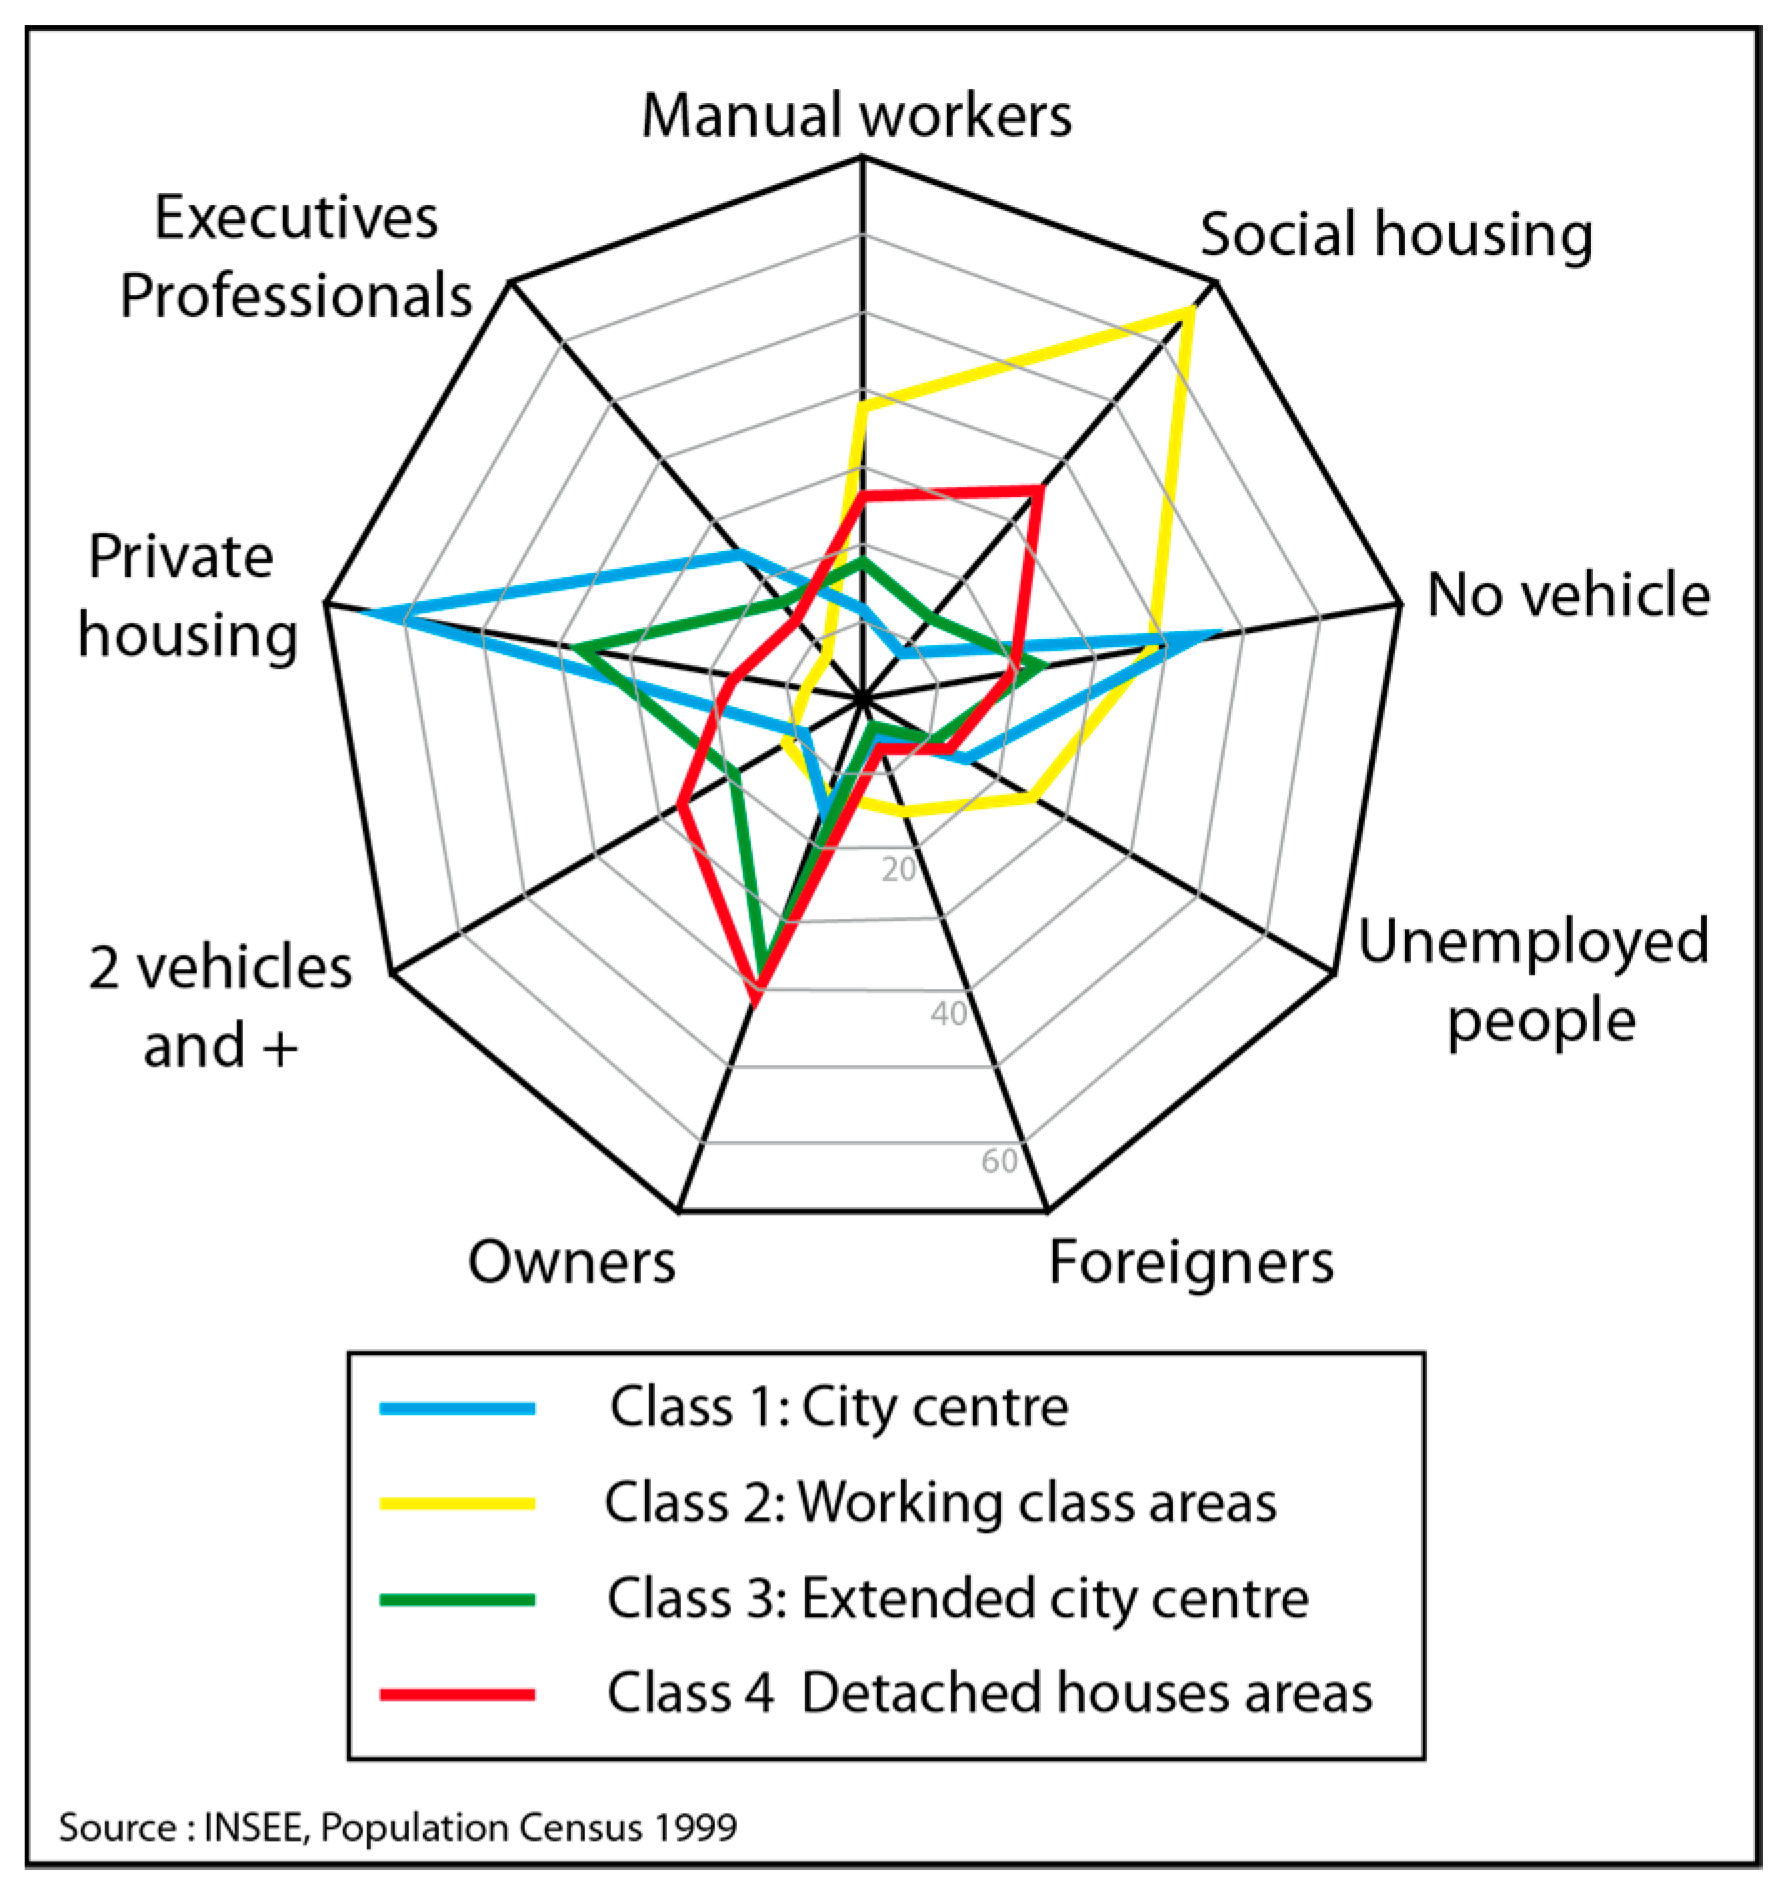
As the Figure 1 partly shows, the classification identified:
- (1)
- Central mixed neighborhoods (in blue) including a high rate of executives and professionals as well as students and fixed-term contract employees, with a low rate of car ownership. There are also important proportions of collective housing and tenants of private housing;
- (2)
- Peripheral working-class neighborhoods (in yellow) with high proportions of social housing, manual workers, foreigners, and unemployed people. Indeed, there is an important unemployment rate of more than 25% compared to 14.5% on average for all the studied neighborhoods (Figure 1);
- (3)
- Privileged pericentral neighborhoods (in green) consisting of desirable flats. There are high rates of owners and retirees in this class;
- (4)
- Modest to privileged peripheral neighborhoods (in red) made up in great majority of detached houses and owners. There is also a high rate of households owning more than two vehicles.
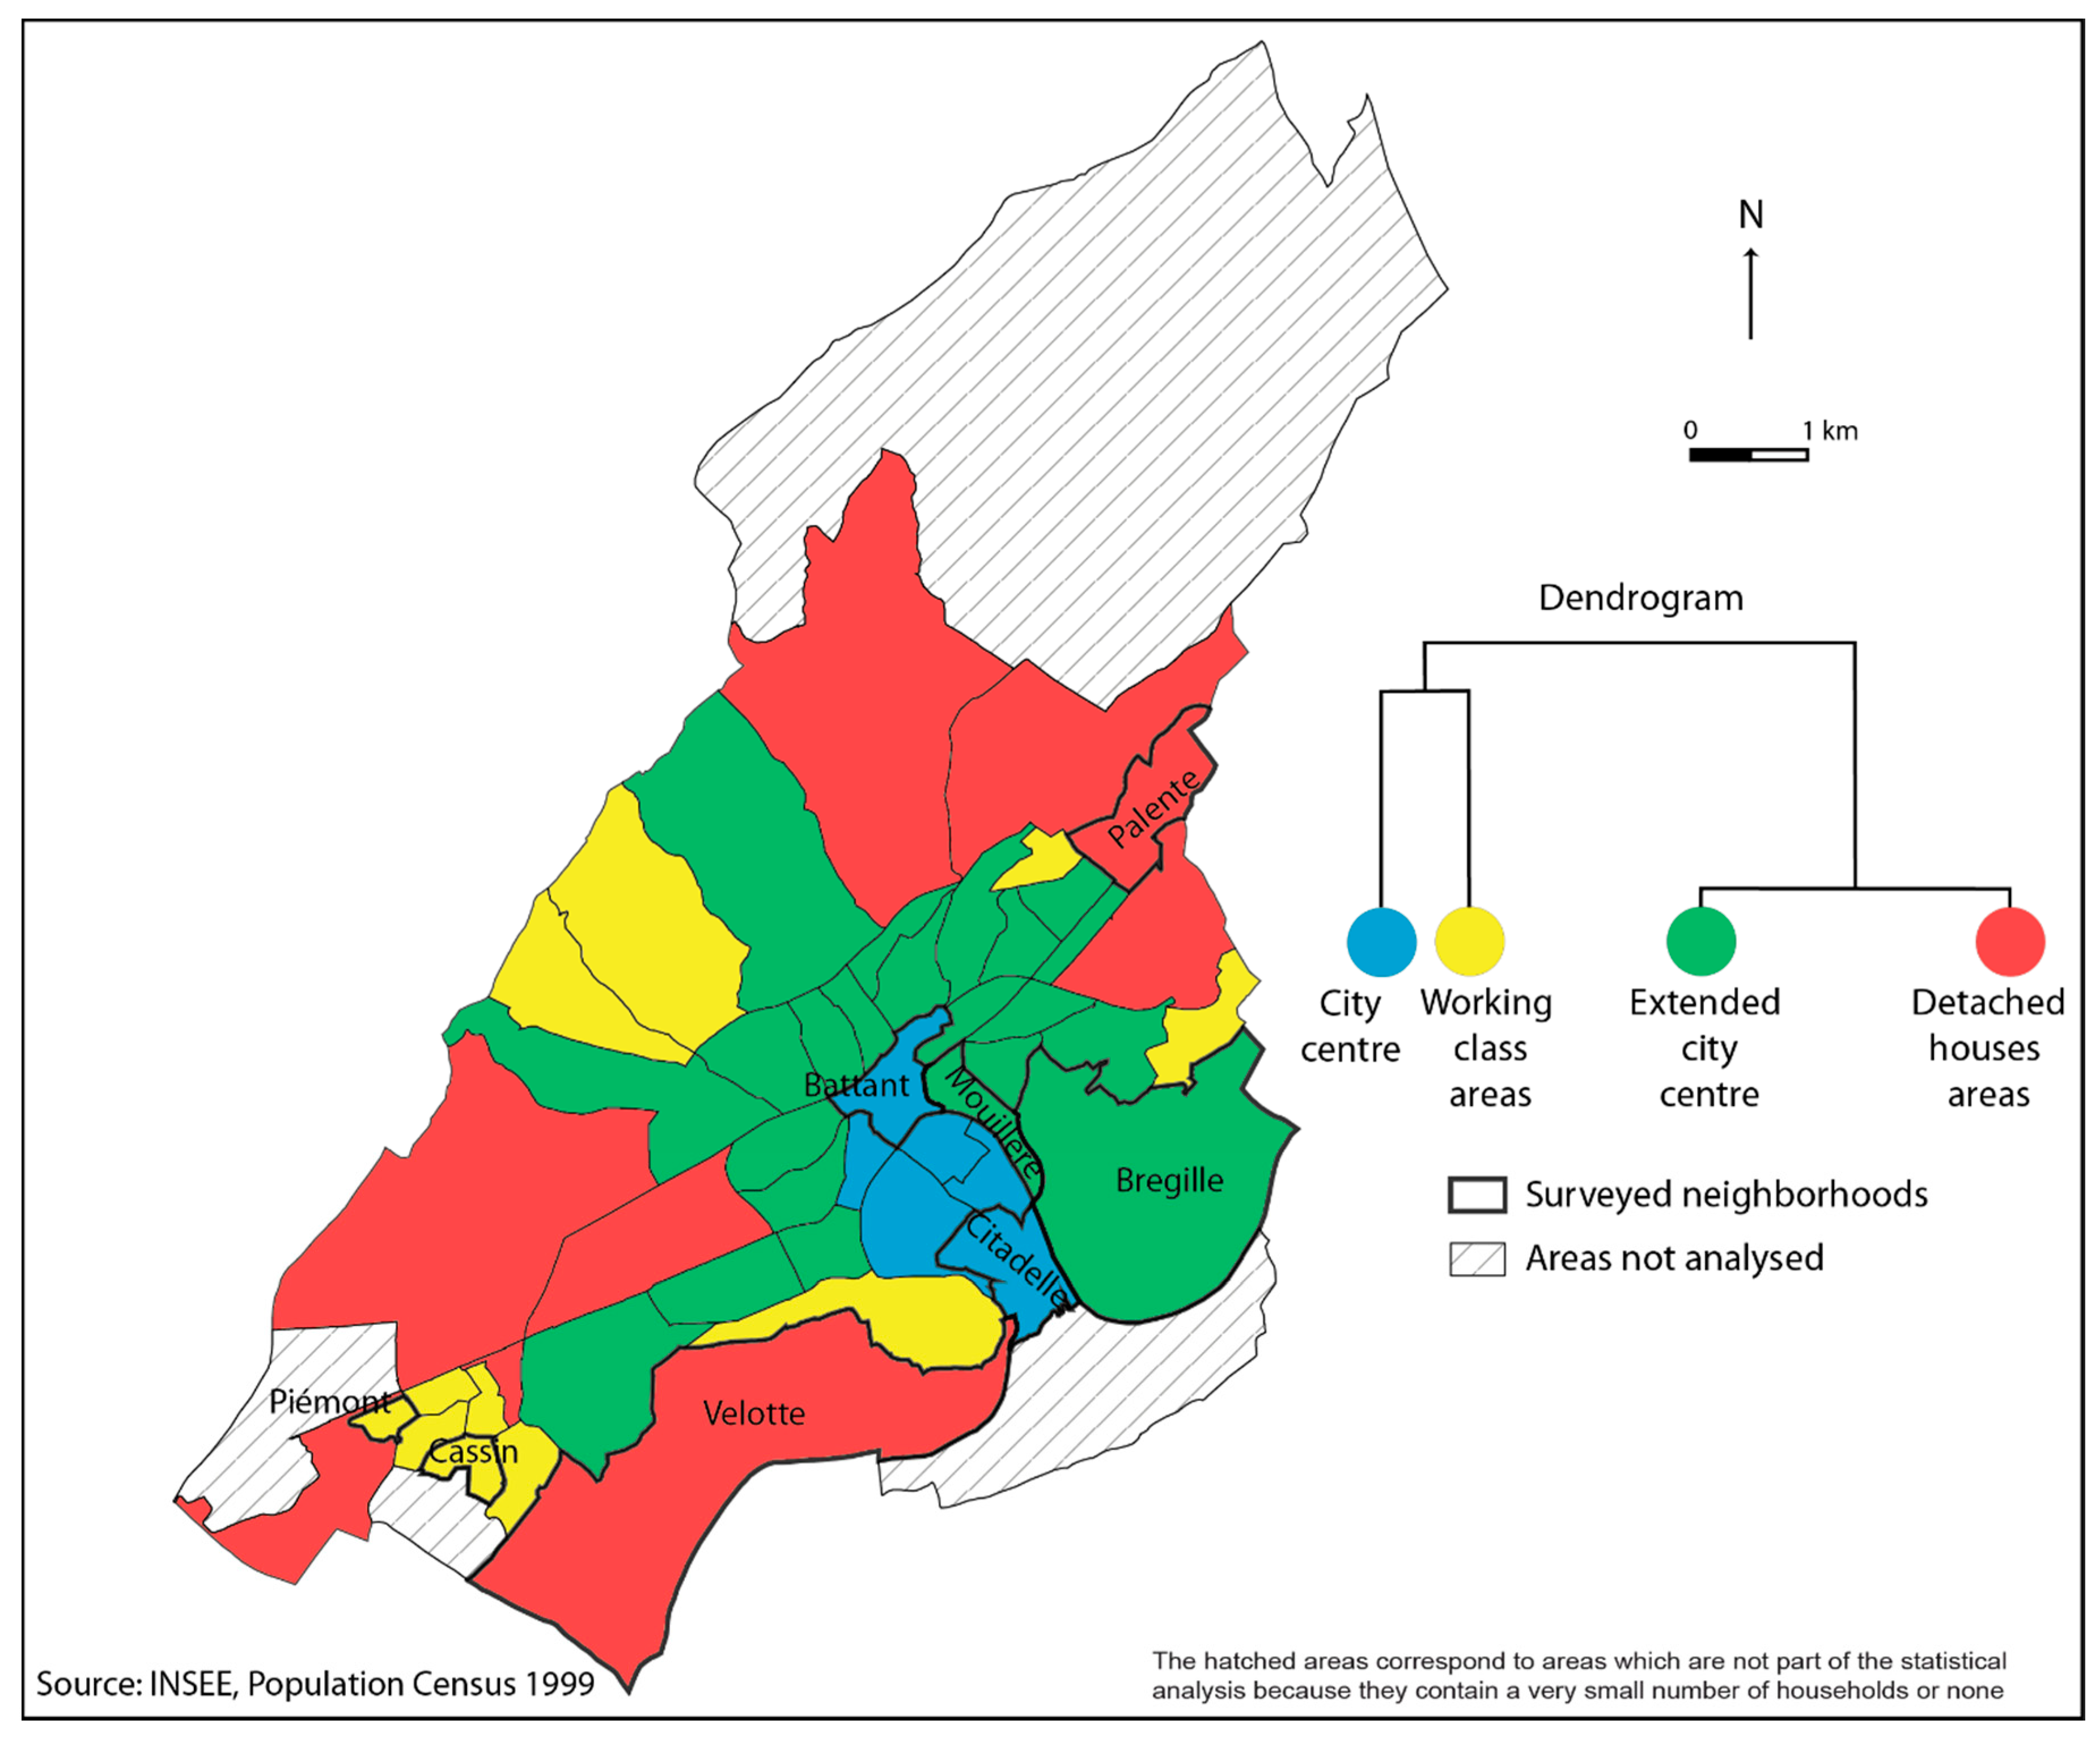
The results of the classification demonstrate, in the map of Figure 2, that the city of Besançon has a socio-spatial structure that follows a center-periphery urban model (Najib 2017). We can observe the historical center (of which the neighborhoods of Citadelle and Battant were randomly selected for the survey) and two belts that surround the center; first the extended city center (of which Bregille and Mouillère were selected) and then the peripheral detached houses neighborhoods (of which Velotte and Palente were selected). The working-class neighborhoods (of which Piémont and Cassin were surveyed) are scattered and isolated across the city.
Once the surveyed neighborhoods were defined, a first field observation work was conducted to better understand the social character of the eight selected neighborhoods and to better direct the investigation work. The chosen stratification in the sampling method of the survey is based on the criteria of housing differentiation (such as the type and size of housing, the quality of housing, and the property build period). Our analysis is, therefore, based on individual surveys conducted in the summer 2009. The surveys took place directly at the homes of residents willing to participate in the research project. 40 surveys were conducted in each of the eight selected neighborhoods; which represents a total of 320 surveys. The questionnaire includes 80 questions on various aspects such as the residential preference, neighborhoods, spatial practices and consumptions, opinions and use of all areas of the city, desire, and propensity to move, residential trajectories, housing structure and household characteristics. However, this study particularly focuses on resident’s opinions of different neighborhoods. We first asked the residents if they liked their neighborhood, and then we asked them to give their opinion on the other remaining neighborhoods of the city. The answers to these questions are positioned on an ordinal numerical scale ranging from −10 (for a very bad opinion) to +10 (for a very good opinion), 0 corresponds to the rating of those who have no opinion.
The main goal of this field survey was to investigate the relationship between residential behaviors and the socio-spatial profile of the neighborhoods (Najib 2013). We acknowledge that every interviewed resident does not systematically correspond to the socio-spatial category assigned to his or her residential neighborhood. That said, after measuring the sample representativeness, we observe that the interviewed residents, who therefore live in a predefined neighborhood, generally have the same sociodemographic and economic characteristics as identified in the studied classes (ibid.). For example, regarding socio-occupational categories, in the neighborhoods of Bregille and Mouillère there is a majority of executives and professionals both in the population census and the studied sample. Similarly, in the neighborhoods of Cassin and Piémont, manual laborers are in great majority both among the surveyed residents and the population as a whole. Retirees are overrepresented in the neighborhoods of Palente and Velotte, while the neighborhoods of Citadelle and Battant have a large student population according to the census results and among the interviewees.
Finally, we focus on households, with reference to housing type and location, to better understand the residential logics of the residents, and particularly their opinion and assessment of residential areas. By using the data from this field survey and analyzing them through statistical and cartographic tools, we consider whether residents’ opinions and assessments correspond or contrast with the characteristics of the socio-spatial groups they belong to. Thus, we superimpose upon a geographical space not only a social space but also a cognitive space; three different spaces in constant interaction and subject to specific constraints.
3. Opinions and Assessments on the Neighborhoods
Opinions of a neighborhood depend as much on the relationship that people have with it as on the socio-spatial category assigned to it among the other neighborhoods, which all together form the socio-geographical entity of Besançon (the studied city). In other words, the opinion of a neighborhood depends as much on the social and spatial position of the resident as on the position of the neighborhood in the hierarchical structure of all the neighborhoods in a city. This opinion is therefore a double social-cognitive construction. On the one hand, it depends on the geographical value system that allows the conceptualization of the neighborhoods as they are perceived, and their hierarchization via their development and population (social, functional segregation, etc.). On the other hand, it also depends on the processes of social identification of the residents from the geographical value system (socio-spatial positioning). Thus, these processes contribute to put the home neighborhood in its own spatial category when considering opinions on the city’s neighborhoods. In this paper, we present the general values of opinions and assessments on the city’s neighborhoods, while detailing the referential importance of the home neighborhood, the socio-spatial relevance of residential preference (choice) and finally the symbolic significance of the city center in residents’ opinion-forming processes.
3.1. General Opinion and Assessment on Neighborhoods
First, the interviewees systematically rate their home neighborhoods more highly than the other remaining neighborhoods of the city (Table 1), with the caveat that non-positioning (the so-called neutral value equal to 0) is very common in the collected values. Indeed, within the 320 interviewees, 52 only assess their residential neighborhood and not the other city’s neighborhoods (16.25%). In addition, among the 268 remaining interviewees, 50.32% of the assessments (n = 944) correspond to neutral opinion (i.e., to no opinion).
This non-positioning is not present when the interviewees assess their own neighborhood. Therefore, all respondents position themselves, and they largely assess their neighborhood positively. However, they do not always find it easy to express an opinion on the other neighborhoods of the city, except for the city center and the working-class neighborhoods: respectively 78.36% and 64.92% of the opinions. This reveals the significance of social issues associated with this assessment when it moves away from stereotypical judgment.
This finding that the neighborhood is a sort of socio-cognitive reference point (Sadalla et al. 1980) for all the neighborhoods is even more robust when the analysis focuses on the home neighborhood (in order to measure the assessment of the residents in comparison to the non-residents for each neighborhood) rather than the residents themselves (in order to measure the assessment of the home neighborhood in comparison to the other spatial categories for each interviewee). Indeed, whatever the home neighborhood, it is systematically and significantly higher valued by its own residents than by non-residents, as shown in the maps describing the average opinions of the eight studied neighborhoods of all the neighborhoods of the city (Figure 3). This tendency to rate the home neighborhood more positively can also be observed when it is possible to compare the opinions neighborhood by neighborhood. However, there is one exception related to the assessment of the city center by the residents of the adjacent neighborhoods of Battant, Mouillère, Bregille and Velotte. These residents do not necessarily view their home neighborhoods as more significant than the city center, as if—for these residents—their home neighborhoods are similar to the historical center, and all these areas together form an extended city center. In general, residents’ high opinion of the city center is very remarkable (Figure 3), as is their low opinion of some working-class neighborhoods. Also, the city center is obviously very busy, and therefore better known and appreciated than the rest of the city’s neighborhoods, while working-class areas generally have unfavorable reputations within Besançon.
The collected values—ranging from −10 to +10 on a Likert scale—are usually high values (that is to say higher than 5), regardless of the surveyed neighborhood. Most of the residents seek to promote their home neighborhoods. In this sense, the average valuation of the home neighborhood of the interviewees is always higher than the valuation of the other neighborhoods of the city. A simple physical distance effect (with reference to the home neighborhoods) is not observed concerning valuation of the other neighborhoods: in each case, we do not observe that the greater the physical distance from the home neighborhood, the more (or the less) the valuation of the neighborhood in question. In other word, positive valuation is not a simple spatial distance effect but rather a socio-spatial effect.
Indeed, these opinion values are generally in line with the statistical classification of the city’s neighborhoods. For example, the peripheral working-class neighborhoods of Piémont and Cassin show the lowest valuations, while the most privileged neighborhoods of Bregille, Mouillère and Velotte show very high valuations. However, beyond this socio-spatial contrast, we can observe that interviewees who generally have a good opinion of their own neighborhood seem also to have a good opinion of the other neighborhoods, and conversely, interviewees who generally have a lower opinion of their own neighborhood seem also to rate the other neighborhoods less positively. As a reminder, Table 1 shows that the interviewees who have an opinion on their own neighborhood higher than 7 (i.e., between 7.28 to 8.05) have an average opinion on the other neighborhoods higher than 1.60 (i.e., between 1.60 to 2.32); and conversely, interviewees who have an opinion on their own neighborhood lower than 7 (i.e., between 5.07 to 6.56) have an average opinion on the other neighborhoods lower than 1.47 (i.e., between 1.10 to 1.47).
Focusing only on the maps of Figure 3, we observe that the interviewees always have a positive opinion (even a very positive opinion) of their home neighborhoods. However, the maps also show that the interviewees have a very high opinion of the city center. Wherever they live, they seem to appreciate this historical center, probably because of the symbolic function of this social reference point.
These first general findings support the idea that the assessment of the city’s neighborhoods is caused by processes of categorization that influence the judgment on each category (Mishra and Mishra 2010). Geographically, the main influence is at first based on the home neighborhood, and then on the city center. These two categories are significantly contrasted from the others; they correspond to a system of spatial categories that are constructed from processes of assimilation, contrast, and contagion, both from the home neighborhood (socio-spatial practices) and the city center (socio-spatial representations). Indeed, from a psychological perspective, there is an influence of categorization processes of assimilation/contagion on the assessment of any items (ibid.). Besides processes of contrast, all the spatial categories are also considered as a part of a superordinate spatial category: the entire city. In addition, the assessment of the main categories (first the home neighborhood and then the city center) in the city has an impact on the assessment of the other remaining categories. The following in-depth analyses allow us below to better understand the functioning and the interactions of these processes of assimilation, contrast, and contagion.
3.2. The Home Neighborhood: A Socio-Cognitive Reference for Assessment
In general, the more positively the residents rate their home neighborhood, the more positively they tend to rate on average the other neighborhoods (r = 0.221, n = 268, p < 0.05). This finding is important to highlight and detail here using the figure below (Figure 4). Indeed, the residents of the highest valued neighborhoods (on average) also appreciate the other remaining neighborhoods of the city more positively. This finding is also robust when we remove, one by one, a studied neighborhood from the analysis, notably the city center (r = 0.218, n = 234, p < 0.05), which is the most positively rated neighborhood after the home neighborhood2 of the interviewees.
This result cannot be considered as a methodological bias related to the use of the Likert scale to rate a neighborhood. Indeed, if this correlation is generally positive and significant, we nevertheless observe important variations according to the sociodemographic characteristics of the sample. More exactly, we above all observe that the employees, the non-graduates, and BAC3 students are significantly more likely to rate another neighborhood more positively than their own. The other socio-occupational categories (executives, retirees, students, and other economically inactive persons) also show positive correlations although they are not statistically significant. Manual laborers are the social category most likely to have a negative opinion of other neighborhoods of the city when they positively assess their home neighborhood. This is particularly notable regarding the most degraded area of the city (the working-class and social housing area of Planoise, r = −0.603, n = 10). The proportion of manual laborers in all eight survey areas correlates negatively with the opinion of Planoise. Manual laborers rate Planoise significantly more negatively, while they rate Battant, a gentrified area of the historical center, more positively (Najib 2013). Regarding income stratification, residents in most income groups show a positive correlation between the valuation of the home neighborhood and the valuation of other neighborhoods, apart from the highest-earning group (i.e., 3000 to 4500€ per month) in which this correlation is almost zero. Finally, when residents are grouped by education level, all groups show a positive correlation between the valuation of the home neighborhood and the valuation of other neighborhoods.
According to Tabernero et al. (2010) findings, the length of residency has no significant effect on the home neighborhood assessment (Table 2) even if the trend is to have a higher opinion on residential neighborhoods over time (only residents of Palente and Mouillère have a significant relation). Table 2 below describes the distribution of the residents according to the opinion on their own neighborhood and the length of residency in their home neighborhood (X2 = 3.60; df = 1; p = 0.057).
Thus, it seems that the more the interviewees appreciate their neighborhood, the more they tend to appreciate the other city’s neighborhoods. However, this relationship is not necessarily robust for everybody, and it can even be reversed for manual laborers who do not live in working-class areas. In other words, the relationship between the social characteristics of the spatial categories and the geographical characteristics of the social categories of individuals has an impact on the neighborhood assessment, but this relationship is not univocal and systematic. It depends on the social and residential trajectory of the inhabitant (Chamboredon and Lemaire 1970). Therefore, it seems that issues of social reputation that each neighborhood represents according to the social position of the resident are the most important. Indeed, when some residents form opinions of certain poorly perceived areas, other than their home neighborhoods, which are often located in the periphery and carefully avoided, valuations of the environment are congruent with social reputations. Conversely, these areas can be more positively assessed by people who do not live there and especially people who are statistically less likely to live there. Meanwhile, despite their negative reputation, the residents of these areas assess them very positively since they live there. Thus, these assessments are socio-spatial. Indeed, this is not only because the geographical space is a univocal social construction for all the resident4, but this is also because the social categorization of the urban space is based on the socio-spatial characteristics of the resident. The image we have of ourselves is strongly affected by the way we believe that others see us and by what they think of the sociocultural and spatial group to which we belong (Permentier et al. 2009). The most explicit indicator of this point is the fact that the assessment of the own residential neighborhood is never neutral (unlike other neighborhoods). To be clearer, the assessment of a neighborhood by a specific socio-occupational category (for example, teachers) depends not only on their social position but also on their area of residence (i.e., their spatial position). In this example, a teacher living in the city center certainly does not have the same socio-spatial trajectory (and therefore the same cultural and economic capital) as a teacher who lives in suburbia or in a working-class area. Consequently, all the contrasting assessments appear as a lack of position while they are in fact highly differentiated. Thus, an investigation which considers both the geographical space and the social characteristics of residents requires a very large sample to better characterize the interviewees spatially and socially. This is not the case in our research study highlighting a high rate of non-response (i.e., people who have no opinion).
Sociodemographic characteristics can reflect the cultural and economic capital of the resident and seem to contribute asymmetrically to the evaluation of neighborhoods: high incomes and high education levels relate with the valorization of the city center, but low incomes and low education levels do not relate with the valorization or the devaluation of peripheral neighborhoods. Because the devaluations of the home neighborhood of the interviewee and the city center seem exceptional, the poorest classes living in the periphery rather focus on the valorization of their own neighborhood (as shown in the maps in Figure 3). As for the wealthiest classes with greater cultural capital, they reinforce the legitimacy of positive values of the neighborhoods they valorize and occupy. More exactly, they reinforce a generally positive opinion that does not depend on the spatial position of the resident.
Finally, this paper also seeks to analyze another criterion that seems to play an important role regarding the socio-spatial position of the resident. It is the significant notion of the choice or non-choice of the residential location whether at the neighborhood level or the housing level. We address this issue in the following section, since, in our example, only 7% of the reasons given by the studied sample for choosing their home neighborhood relate to its image and reputation, which is not necessarily the case regarding housing type (Najib 2013).
3.3. Feeling of Residential Choice: An Indicator of the Quality of the Socio-Spatial Position
For a link between the feeling of residential choice (or non-choice) and the neighborhood assessment to be considered, the analysis must focus, above all, on the spatial categorization of residential practices (neighborhood and housing type) and then on the socio-cognitive categorization of spaces (the distribution of opinions of neighborhoods). Indeed, it is difficult to simultaneously analyze opinions of neighborhoods (socio-cognitive positions) and residential locations (spatial positions) to understand their relationship with stated geographical choice (or non-choice) without neglecting the contribution of social positions.
To do this, Table 3 below shows the relationship between different neighborhood types and the proportion of respondents who reported having chosen (or not) both location and housing type, since this relationship allows us to identify the triple position (social, cognitive, and spatial) on which is based the notion of residential choice. We asked the interviewees whether they had chosen to live in their neighborhood or not, and whether they had chosen to live in their housing or if they had had no choice.
First, the spatial distribution of residential choice statement is not isotropic. If the neighborhood represents the basis of statistical differences in terms of choice, then a shared and efficient values system allows the construction of “preferences” and “choices” and does not only correspond to an individual and rational utility of the relationships with the geographical space. Indeed, we can understand resident’s relationship with their home neighborhood with reference to the relationship between this neighborhood and the other neighborhoods of the city. Here, we need to analyze more closely the correlation between the neighborhood assessment of the home neighborhood of the interviewees and the assessment of the other neighborhoods to better understand what the concept of residential choice really represents.
Starting from this principle, we can notice that the peripheral working-class neighborhoods (Piémont and Cassin) and the central neighborhoods (Citadelle and Battant) record a lower “choice rate” than the other studied neighborhoods, both at the neighborhood level and the housing level. Thus, neighborhoods with a higher proportion of renters seem to also have a higher level of residential constraints (i.e., the residential non-choice). Indeed, 84.4% of the interviewees living both in these working-class neighborhoods and in the city center are tenants (against 52.5% for the other studied neighborhoods). However, it is only in these neighborhoods that tenants are more likely to state not having chosen their home neighborhood than owners (X2 = 7.77, df = 1, p = 0.005) and to a lesser degree, not having chosen their housing type (X2 = 3.83, df = 1, p = 0.05)5. This link between tenure status and residential choice statement is more important at the neighborhood level than the housing level, for all the studied neighborhoods. Therefore, the economic rationale for a change of tenure (that is, the desirability of acquiring real estate property) appears only where it is the most difficult to obtain. It is particularly for this reason that the notion of residential choice rather corresponds to a satisfactory relationship with the area of residence at the time of the investigation than to a rational optimization of individual preferences at the moment of the action (a kind of indicator of residential satisfaction). Finally, geographical contrasts regarding choice are more important at the housing level than the neighborhood level (Table 4). Except in the neighborhoods of Piémont and Cassin, the notion of choice is more important at the neighborhood level than the housing level, that is to say at a less private geographical scale and more related to the dynamics of the social categorizations of the geographical space.
As we have already noticed, the general assessment of the home neighborhood differs very slightly but significantly according to the extent of the geographical margin of maneuver that is stated. Whatever the modalities of this margin on the housing (choice or non-choice) are, the difference in valuation of a neighborhood according its margins no longer appears. While they persist as soon as we compare the margins on the housing towards a better appreciation of the home neighborhood when the interviewees state making the choice of their housing. Therefore, the margins of maneuver felt on the housing seems to affect the appreciation of the home neighborhood more strongly than the margins of the neighborhood. However, valuations can have a cumulative effect, as far as the least positive opinions of a neighborhood are found when respondents have chosen neither home neighborhood nor housing type.
To conclude, as with residential satisfaction, it seems that the more intimate the geographical scale of residence, the less frequently respondents report a lack of choice, and the more the feeling of this constraint affects the valuation of the residential neighborhood. Concerning qualitative terms, respondents’ degree of flexibility regarding choice of neighborhood is highly correlated with the way in which the home neighborhood is described at the time of the investigation. The neighborhoods described as “chosen” are also described as “calm, clean, pleasant and friendly”, whereas those which were not chosen are described more negatively (Najib 2013). It is, therefore, not so much the interviewees’ general valuation of the neighborhood but its social meaning, that is related to residential choice. This finding seems to be the first indicator that shows that the notion of choice vis-à-vis the geographical space is not an individual, conscious, rational, and constructed preference based on known practices, but an indicator of the quality of the relationship between the resident and the geographical space.
Besides, the relationship to the city center clearly shows that the notion of choice cannot be reduced to a personal evaluation. Indeed, the city center is systematically the highest valued neighborhood according to the studied sample (just after the home neighborhood of the interviewees). However, the city center is also one of the areas (together with the peripheral working-class neighborhoods) that is the least frequently described as having been chosen by its residents, even though it is very much appreciated (average opinions of 6.58 and 6.33 out of 10 respectively for the neighborhoods of Citadelle and Battant), particularly because its evaluation is the most frequently given. Thus, just as the local bakery in a neighborhood can be appreciated by its residents even if they have not chosen this bakery, the residents of a specific neighborhood can appreciate their neighborhood at the moment of the investigation although they may not have chosen to live there. For example, the city center can be appreciated for the different amenities it offers (ambiance, shops, etc.), but not necessarily as a place of residence. One aspect of the city center can highlight socio-cognitive processes more difficult to define in other neighborhoods.
Finally, another element of analysis is important to understand the feeling of residential choice: it concerns the sociological structure detailed in Table 5. While 80.95% of executives and intermediate professions living in the city center state having chosen their neighborhood as well as their housing, only 62.75% of manual workers and employees state that they have chosen their neighborhood and housing. That is, the likelihood of executives and intermediate professions having chosen their neighborhood and housing is higher than that of the total sample (63.06%), while it is slightly lower among manual workers and employees. The same trend is observed when we compare people who have at least BAC equivalent qualifications with people who have not, or when we compare people who have low incomes with those who have high incomes. Also, the distance to the city center affects the geographical margins of maneuver. In the neighborhoods located near the city center, residents more frequently report having chosen their neighborhood and housing. Finally, residents who state having chosen their neighborhood as well as their housing and who live in their district for less than two years (66.04%) are as much numerous than those who live in their district for more than 10 years (67.01%). In this sense, the length of residency does not seem to play an important role in the understanding of the feeling of residential choice.
Far from being an individual preference detached from the socio-spatial environment, residential choice seems to be a socio-cognitive state that fits into the space of geographical positions (from the center). In other words, residential choice is a cognitive position organized from the social and spatial positions of the resident.
The socio-spatial analysis regarding the peripheral working-class neighborhoods of Cassin and Piémont and the central neighborhoods of Citadelle and Battant also confirms this socio-cognitive construction of residential choice. Indeed, in these two types of neighborhoods, there are the highest “non-choice rates”, but the total population is too small for a complete statistical treatment. For example, the interviewees of Citadelle and Battant with a high income (69.23%) more frequently report having chosen their neighborhood and housing than those who have a lower income (57.5%). Conversely, the residents of Piémont and Cassin who have the highest incomes (41.66%) less frequently state having chosen their neighborhood and housing than those who have lower incomes (46.87%). This can reveal a certain lack of satisfaction among higher-income people to live in a working-class area.
3.4. The Significance of the City Center, And the Relationship Between Positive Valuation and Residential Choice
The previous section has highlighted that the non-choice statement of the residents living in peripheral working-class neighborhoods is partly linked to their negative reputation (which also contributes to their process of devaluation from the inside). However, this does not explain the fact that the residents of the city center, despite its unanimous good image, report a lower “choice rate” than those who live in areas near the city center or in peripheral neighborhoods. A specific analysis of the city center shows us that this feeling of choice seems to be based on the respondent’s relationship with the space at the moment of the investigation rather than on preferences when looking for a place to live.
In this sense, the residents of the city center (more exactly of Citadelle and Battant) who state they have not chosen their neighborhood value the pericentral neighborhood of Mouillère much more (average opinion of 3) than those who stated living there by choice (average opinion of 1.43) (t = −2.01, df = 71, p = 0.04). A similar trend is observed for the working-class area of Planoise that includes the studied neighborhoods of Piémont and Cassin. As for the three other remaining neighborhoods of Velotte, Palente and Bregille, the residents do not assess them differently depending on whether they state having chosen their neighborhood or not. Also, there are no sociological differences depending on whether Mouillère or Planoise are favorably appreciated.
Finally, this finding highlighting a residential choice effect on the other neighborhoods of the city is more general. Indeed, the positive correlation between the valuation of the home neighborhood of the interviewees and of the other neighborhoods of the city seems to be a cognitive schema shared by the total sample. However, this correlation is no longer relevant when the interviewees are in a partial choice situation (i.e., when they state not having chosen either their neighborhood or their housing) as shown in Table 6. In other words, it seems that the transfer of valuation from the home neighborhood to the other neighborhoods takes place only when a resident’s social conditions do not go against their own choice (the feeling of creating one’s geographical destiny) or when they have not conceived a choice (the feeling that geographical destiny cannot be influenced). When the choice is possible but not fully satisfied, this seems to affect the cognitive schema in which valuation of the home neighborhood is transferred to other neighborhoods of the city.
A separate analysis of the neighborhood assessments according to the feeling of choice is not necessarily relevant in terms of new findings, except that those who have chosen their neighborhood and housing reinforce the contrast between the peripheral working-class neighborhoods and other peripheral neighborhoods. Those who have not experienced this feeling of choice either do not give their opinion on all the city’s neighborhoods (including the city center) or give a positive opinion and mention the peripheral working-class neighborhoods only secondarily. This strong opposition between peripheral neighborhoods (social housing versus detached houses) is also visible when the neighborhoods are reduced to the four socio-spatial categories previously identified in the statistical classification: the city center (Citadelle and Battant), the extended city center (Mouillère and Battant), the peripheral detached houses neighborhoods (Palente and Velotte) and the peripheral working-class and social housing neighborhoods (Cassin and Piémont).
To better understand this opposition, we present below a Multiple Correspondence Analysis (MCA)6 on the opinion of the neighborhoods by reducing them to these four categories.
Figure 5 allows us to characterize the interviewees by considering their social characteristics such as socio-occupational category or education level, with their residential location reduced to four categories to better isolate, for example, the opinion of an executive living in the city center compared to another one living in a peripheral neighborhood. This MCA was conducted from three modalities for the city center and the extended city center: (i) neutral opinions (0); (ii) positive opinions (1 to 6) and (iii) very positive opinions (7 to 10). Only two modalities were selected for the peripheral detached houses neighborhoods: (i) neutral opinions (0) and (ii) positive opinions (1 to 10). As for peripheral working-class and social housing neighborhoods, opinions were organized within four modalities: (i) negative opinions (−10 to −1); (ii) neutral opinions (0); positive opinions (1 to 6) and (iv) very positive opinions (7 to 10).
The additional statistical variables include: - the studied neighborhoods (8 modalities: Citadelle, Battant, Piémont, Cassin, Velotte, Palente, Mouillère and Bregille); the type of neighborhoods (4 modalities: city center, extended city center, peripheral working-class neighborhoods and peripheral detached houses neighborhoods); the distance to the city center (3 modalities: central location, pericentral location and peripheral location); socio-occupational categories (3 modalities: executives, employees and retirees); income (4 modalities: <1100€, 1100–2000€, 2000–3000€ and >3000€); education level (3 modalities: <BAC, BAC and >BAC); feeling of choice of the neighborhood and the housing (2 modalities for each variable: chosen and not chosen); tenure (3 modalities: tenants of private housing, tenants of social housing, owners).
The first factor or F1 (17.38%) describes a contrast between, on the one hand, a negative opinion of the peripheral working-class and social housing neighborhoods, a positive opinion of the peripheral detached houses neighborhoods and a neutral opinion of the city center; and on the other hand a very positive opinion or a neutral opinion of the peripheral working-class and social housing neighborhoods and a neutral opinion of the extended city center. This first factor is also concerned with the contrast between the different peripheral neighborhoods. The second factor (F2) of the factorial graph describes a contrast between a very positive opinion of the city center and a very positive opinion of the periphery.
The intersection of the social and spatial characteristics of the interviewees also allows us to spot specific socio-spatial configurations among the four groups of opinions highlighted by the MCA:
- The first group is characterized by a negative opinion of the peripheral working-class neighborhoods and a positive opinion of the peripheral detached houses neighborhoods and the extended city center. This group consists mostly of residents with at least a BAC equivalent qualification living in the peripheral detached houses neighborhoods, whatever their professional status and income. Palente and to a lesser degree Bregille are two neighborhoods dominated by this group.
- The second group is characterized by a very positive opinion of the city center of Besançon. This group consists mostly of residents with high education levels living in the extended city center, and particularly in Mouillère as well as on executives who live in the city center. Here, income is slightly more important than in the previous group.
- The third group is characterized by a neutral opinion of the periphery, both the working-class areas and the detached houses areas with a very positive opinion of the city center. It consists mostly of city center residents, some of whom have minimal education, some of whom are retirees or employees with high incomes.
- The fourth group is characterized by a very positive opinion of the peripheral working-class neighborhoods and a neutral opinion of the extended city center. The corresponding residents have a low educational level, regardless of their professional status and income, and live in Piémont and Cassin.
The first factor describing a contrast between the two types of periphery is based on their respective residents. While the residents of the peripheral detached houses neighborhoods have a negative perception of the peripheral working-class neighborhoods, the residents of these social housing areas do not have a negative perception of the detached houses periphery or the extended city center. That said, the city center is mostly positively assessed by the residents of adjacent neighborhoods (that is by residents of the extended city center). Therefore, this MCA allows us to show an important contrast between the different social classes (notably the “privileged classes” versus the “disadvantaged classes”) as well as an important spatial orientation based on the distance to the city center.
4. Conclusions
The way residents of Besançon assess the different neighborhoods of the city follows distinct socio-cognitive processes that would probably be possible to identify in other cities of France or even the world. Our study clearly shows the importance of the relationship to the neighborhood and the city center, as well as residents’ feeling of having chosen their own neighborhood (or not) in the processes by which residents evaluate neighborhoods, whether their home neighborhoods or all the neighborhoods of the city. It is, therefore, difficult to state that people can assess a specific neighborhood of the city without considering the other remaining neighborhoods of the city. The valuation of home neighborhoods cannot be analyzed separately from that of other neighborhoods (and especially the city center) and cannot neglect the impact of the socio-spatial construction of individuals in their relationships and positioning with their own residential environment. The influence of the socio-spatial characteristics of both the neighborhoods and the residents seems significant in the neighborhood assessment. More exactly, the socio-spatial characteristics of the residents bring more precisions to the evaluation of the neighborhoods than on the social characteristics or the spatial characteristics analyzed separately, because these socio-spatial characteristics consider the social trajectory of the resident and not only his/her position in the social or geographical space at a given time (Dias and Ramadier 2015). In addition, it is important to understand not only how residents themselves assess their neighborhood, but also how they think that other city residents see their neighborhood (Permentier et al. 2011).
First, the valuation of any neighborhood is related to the assessor’s valuation of his or her home neighborhood. Thus, it seems that part of the opinion of the home neighborhood is transferred towards the other neighborhoods of the city, so that the more positive a resident’s opinion of his or her own neighborhood, the more positive his or her opinion of the other remaining neighborhoods of the city. Second, the notion of residential choice allows us to better define the socio-spatial situation of residents at the time of the investigation: when residents report having chosen their residential neighborhood, they are more likely to demonstrate that they feel at home in their own neighborhood and that they are generally satisfied with their geographical conditions. Whether a resident has chosen his or her neighborhood or not affects the cognitive schema that links the opinion of the home neighborhood to the opinion of other neighborhoods. Indeed, the feeling of not having chosen one’s home neighborhood makes it less possible to transfer a resident’s relationship with his or her neighborhood to all areas of the city. Third, the assessment of the city center highlights the significance of this symbolic spatial category when considering the whole city. The city center is systematically the highest valued neighborhood by the interviewees (after their home neighborhood), but it is also one of the least chosen residential areas by its residents.
Certainly, by analyzing eight residential neighborhoods with their similarities and differences, this study allows us to highlight a socio-cognitive construction of opinions based on the spatial categorization of residents as well as on urban and population policies; two dimensions that are intrinsically correlated. This analysis of residential opinions and assessments as well as residential behaviors in general (Najib 2013) related to different neighborhoods in the studied city, also helps us to better understand the relationship between the categorization of spaces and the development of socializations of groups of residents. The unification of residential behaviors shows the processes of convergence and divergence regarding residents’ perceptions of neighborhoods. Indeed, the residents of different types of neighborhood according to the statistical classification used here, can show some of the same relationships to the home space, and conversely the residents of similar neighborhoods can present different relationships to their home neighborhoods. This is the case of Battant and Citadelle, two central neighborhoods belonging to the same socio-spatial category and whose ambiances are perceived as very distinct: popular and friendly for Battant, and calm and pleasant for Citadelle. That said, Cassin and Piémont, two working-class neighborhoods, very often have evaluative similarities (ibid.). This complex game of perceptive contrast and assimilation of the residential spatial categories is probably a means of reifying the process of social aggregations and distinctions (Bourdieu and Wacquant 1992).
Finally, the spatial categorization of the neighborhoods of Besançon allows us to observe how population dynamics and the resulting urban segregations are reinforced at the level of the individual resident, whereas other researchers have only demonstrated this process at the public policy level (Desage et al. 2014). The phenomena of residential segregation, gentrification, impoverishment, and social mixing are not only visible in US cities, although they are more marked in the US than elsewhere (Wacquant 1993; Musterd 2005; Pan Ké Shon 2010) due to their US’s history of institutionalized segregation. Indeed, these segregations are also important in France (Subra 2006; Wacquant 2015). The relationship between the “social” and the “spatial” as well as the analysis of representations and especially the processes of assessment and evaluation of neighborhoods bring significant insights on the conceptualization and the maintenance of these segregations. Subdividing the city into neighborhoods amounts to the division of the residents of the city into social groups based on spatial representations that exist at a given time in the urban space (Jodelet 1982). The aggregations, separations and limitations developed by the residents rely upon social distributions in urban space as much as they affect it. However, the studied space here is restricted (a medium-sized city). To better understand the processes of construction and maintenance of residential segregations beyond the study of residential mobility, it would be necessary to strengthen our results by conducting the same analysis on larger French cities.
Funding
This research was funded by the French National Research Agency, ANR-07-BLAN-0029.
Conflicts of Interest
The author declares no conflicts of interest.
References
- Bahi-Fleury, G. 1996. Histoire, identité résidentielles et attachement au quartier: Étude sur les habitants de la ville de Paris. Ph.D. thesis, University René Descartes, Paris, France. [Google Scholar]
- Bourdieu, Pierre, and Loïc Wacquant. 1992. Réponses. Paris: Seuil. [Google Scholar]
- Canter, David. 1977. The Psychology of Place. London: Architectural Press. [Google Scholar]
- Carpentier, Samuel. 2007. Mobilité quotidienne et ancrage résidentiel. Différenciation des pratiques spatiales et des représentations sociales selon la structure urbaine. L’exemple du Luxembourg. Ph.D. thesis, University Louis Pasteur, Strasbourg, France. [Google Scholar]
- Chamboredon, Jean-Claude, and Madeleine Lemaire. 1970. Proximité spatiale et distance sociale. Les grands ensembles et leur peuplement. Revue Française de Sociologie 11: 3–33. [Google Scholar] [CrossRef]
- Desage, Fabien, Christelle Morel-Journel, and Valérie Sala Pala. 2014. Le peuplement comme politique. Rennes: Presses Universitaires de Rennes. [Google Scholar]
- Dias, Pierre, and Thierry Ramadier. 2015. Social trajectory and socio-spatial representation of urban space: The relation between social and cognitive structure. Journal of Environmental Psychology 41: 135–44. [Google Scholar] [CrossRef]
- Doise, Willem. 1985. Représentations sociales chez les élèves: Effet du statut scolaire et de l’origine sociale. Revue Suisse de Psychologie 44: 67–78. [Google Scholar]
- Durkheim, Emile, and Mauss Marcel. 1903. De quelques formes de classification à l’étude des représentations collectives. Année Sociologique 6: 1–72. [Google Scholar]
- Fried, Marc. 1982. Residential attachment: source of residential and community satisfaction. Journal of Social Issues 38: 107–19. [Google Scholar] [CrossRef]
- Galak, Jeff, Justin Kruger, and Paul Rozin. 2009. Not in My Backyard: The Influence of Arbitrary Boundaries on Consumer Choice. In Advances in Consumer Research. Edited by McGill Ann and Shavitt Sharon. Duluth: Association for Consumer Research, vol. 36, pp. 79–81. [Google Scholar]
- Peter, Gould, and White Rodney. 1974. Mental Maps. London: Penguin Books. [Google Scholar]
- Hirtle, Stephen C., and John Jonides. 1985. Evidence of hierarchies in cognitive maps. Memory and Cognition 13: 208–17. [Google Scholar] [CrossRef] [PubMed]
- Holding, Carol S. 1994. Further evidence for hierarchical representation of spatial information. Journal of Environmental Psychology 14: 137–47. [Google Scholar] [CrossRef]
- Jodelet, Denise. 1982. Les représentations socio-spatiales de la ville. In Conception de l’espace. Edited by Derycke Pierre-Henri. Paris: Université de Paris X, pp. 145–77. [Google Scholar]
- Lally, Marco. 1992. Urban-related identity: theory, measurement, and empirical findings. Journal of Environmental Psychology 12: 285–303. [Google Scholar] [CrossRef]
- Laponce, Jean. 2001. Le centre du monde: Icône ou carrefour? Revue internationale de sociologie 11: 299–307. [Google Scholar] [CrossRef]
- Lorenzi-Cioldi, Fabio. 2002. Représentation des Groupes Dominants et ees Groupes Dominés: Collections et Agrégats. Grenoble: Presses Universitaires de Grenoble. [Google Scholar]
- McGarty, Craig, and John C. Turner. 1992. The effects of categorization on social judgement. British Journal of Social Psychology 31: 253–68. [Google Scholar] [CrossRef]
- McNamara, Timothy P. 1986. Mental representations of spatial relations. Cognitive Psychology 18: 87–121. [Google Scholar] [CrossRef]
- Mishra, Arul, and Himanshu Mishra. 2010. Border Bias: The Belief That State Borders Can Protect Against Disasters. Psychological Science 21: 1582–86. [Google Scholar] [CrossRef] [PubMed]
- Musterd, Sako. 2005. Social and ethnic segregation in Europe: Levels, causes, and effects. Journal of Urban Affairs 27: 331–48. [Google Scholar] [CrossRef]
- Najib, Kawtar. 2013. Dynamiques Socio-Spatiales et Modes D’habiter des Espaces Urbains. Ph.D. thesis, University of Franche-Comté, Besançon, France. [Google Scholar]
- Najib, Kawtar. 2017. Socio-spatial inequalities in the cities and their recent evolutions: Comparison between Besançon, Mulhouse, and Strasbourg. Cybergeo: European Journal of Geography. 808. Available online: https://journals.openedition.org/cybergeo/27975 (accessed on 28 September 2018).
- Pan Ké Shon, Jean-Louis. 2010. The ambivalent nature of ethnic segregation in France’s disadvantaged neighbourhoods. Urban Studies 47: 1603–23. [Google Scholar] [CrossRef]
- Permentier, Matthieu, Maarten Van Ham, and Gideon Bolt. 2009. Neighborhood Reputation and Intention to Leave the Neighborhood. Environment and Planning A 41: 2162–80. [Google Scholar] [CrossRef] [Green Version]
- Permentier, Matthieu, Gideon Bolt, and Maarten Van Ham. 2011. Determinants of neighbourhood satisfaction and perception of neighbourhood reputation. Urban Studies 48: 977–96. [Google Scholar] [CrossRef] [Green Version]
- Ramadier, Thierry. 2002. Rapport au quartier, représentation de l’espace et mobilité quotidienne: le cas d’un quartier périphérique de Québec-ville. Espace et société 108: 111–31. [Google Scholar] [CrossRef]
- Sadalla, Edward K., W. Jeffrey Burroughs, and Lorin J. Staplin. 1980. Reference points in spatial cognition. Journal of Experimental Psychology: Human Learning and Memory 6: 516–28. [Google Scholar] [CrossRef]
- Schwarz, Norbert, and Herbert Bless. 1992. Constructing reality and its alternatives: an inclusion/exclusion model of assimilation and contrast effects in social judgment. In The Construction of Social Judgment. Edited by Martin Leonard and Tesser Abraham. Erlbaum: Hillsdale, New York: Psychology Press, pp. 217–45. [Google Scholar]
- Subra, Philippe. 2006. Heurs et malheurs d’une loi anti-ségrégation: les enjeux géopolitiques de la loi Solidarité et Renouvellement Urbain (SRU). Hérodote 122: 138–71. [Google Scholar] [CrossRef]
- Tabernero, Carmen, Elena Briones, and Esther Cuadrado. 2010. Changes in residential satisfaction and place attachment over time. Psyecology 1: 403–12. [Google Scholar] [CrossRef]
- Tajfel, Henri, and Alan L. Wilkes. 1963. Classification and quantitative judgement. British Journal of Psychology 54: 101–14. [Google Scholar] [CrossRef] [PubMed]
- Tissot, Sylvie. 2011. De bons voisins. Enquête dans un quartier de la bourgeoisie progressiste. Paris: Raison d’Agir. [Google Scholar]
- Tuan, Yi-Fu. 1975. Place: An experiential perspective. Geographical Review 65: 151–65. [Google Scholar] [CrossRef]
- Wacquant, Loïc. 1993. Urban outcasts: Stigma and division in the Black American ghetto and the French urban periphery. International Journal of Urban and Regional Research 17: 366–83. [Google Scholar] [CrossRef]
- Wacquant, Loïc. 2015. Revisiting territories of relegation: Class, ethnicity and state in the making of advanced marginality. Urban Studies 53: 1077–88. [Google Scholar] [CrossRef]
- Wilton, Ronald N. 1979. Knowledge of spatial relations: the specification of the information used in making inferences. Quartely Journal of Experimental Psychology 31: 133–46. [Google Scholar] [CrossRef] [PubMed]
| 1 | The classification is a Hierarchical Cluster Analysis (HCA) that has identified neighborhood groups that are either relatively homogeneous (low intra-class inertia) or significantly different from one another (high inter-class inertia). |
| 2 | Especially because there is no correlation between the assessment on the home neighborhood and that of the city-center (r = 0.087, n = 234, p < 0.05). |
| 3 | The BAC (or Baccalauréat in French) represents the last degree that High School students need to pass in order to be able to persue in higher education (notably at the University). |
| 4 | A social construction both in act (because of the social segregations of the residential locations), and in representation (because of the spatial units variously assessed and hierarchized). |
| 5 | As for the neighborhoods of the extended center and the periphery, the feeling of choosing his/her neighborhood (77.5%) or housing (88.7%) is so important (compared to the working-class neighborhoods and the city center, respectively 66.2% and 70%) that tenants do not feel they have not chosen their neighborhood. |
| 6 | This method allows to analyze the association between the studied qualitative variables in order to highlight correspondences between the qualitative variables’ categories and the observations. |
Figure 1.
Comparative characteristics of the four studied classes.

Figure 2.
Typology of the studied neighborhoods of Besançon.

Figure 3.
Average opinions by surveyed neighborhoods on the city’s neighborhoods.

Figure 4.
Relationship between opinions on the home neighborhood and other neighborhoods.

Figure 5.
Factorial graph of opinions according to the four spatial classes.


Table 1.
Average opinion according to the surveyed neighborhoods.
| Classes | Selected Neighborhoods | Opinion on Neighborhoods by Its Residents | Other Neighborhoods with the Best Opinion | Opinion of Other Neighborhoods | Opinion on Neighborhoods by the Non-Residents |
|---|---|---|---|---|---|
| (1) Mixed city center | Battant | 6.31 (n = 39, s.d. = 1.38) | City center | 1.28 (n = 39, s.d. = 1.12) | 1.69 (n = 229, s.d. = 3.59) |
| Citadelle | 6.56 (n = 34, s.d. = 3.38) | Velotte | 1.35 (n = 34, s.d. = 1.09) | 4.95 (n = 234, s.d. = 3.78) | |
| (2) Peripheral working-class neighborhoods | Piémont | 5.07 (n = 28, s.d. = 4.47) | City center | 1.47 (n = 28, s.d. = 1.14) | 0.46 (n = 206, s.d. = 4.50) |
| Cassin | 6.15 (n = 34, s.d. = 1.96) | City center | 1.10 (n = 34, s.d. = 1.72) | 0.46 (n = 206, s.d. = 4.50) | |
| (3) Privileged extended city center | Bregille | 7.63 (n = 35, s.d. = 2.22) | City center | 1.60 (n = 35, s.d. = 1.43) | 2.05 (n = 233, s.d. = 3.59) |
| Mouillère | 7.28 (n = 36, s.d. = 1.11) | City center | 1.65 (n = 36, s.d. = 1.48) | 2.31 (n = 232, s.d. = 3.56) | |
| (4) Modest to privileged peripheral neighborhoods | Velotte | 8.05 (n = 36, s.d. = 0.95) | City center | 2.32 (n = 36, s.d. = 1.32) | 2.30 (n = 232, s.d. = 3.41) |
| Palente | 6.35 (n = 26, s.d. = 2.36) | Chaprais (Mouillère) | 1.11 (n = 26, s.d. = 1.26) | 1.79 (n = 268, s.d. = 3.19) |
Table 2.
Opinion on the home neighborhood according to the length of residency.
| A Length of Less Than 6 Years | A Length of More Than 6 Years | Total | |
|---|---|---|---|
| Opinion < 6 | 77 | 46 | 123 |
| Opinion ≥ 7 | 102 | 95 | 197 |
| Total | 179 | 141 | 320 |
Table 3.
Frequency of housing choice and neighborhood choice.
| (1) Mixed City Center | (2) Peripheral Working-Class Neighborhoods | (3) Privileged Extended City Center | (4) Modest to Privileged Peripheral Neighborhoods | |
|---|---|---|---|---|
| Stated choice of the neighborhood | 57 | 49 | 64 | 60 |
| Stated non-choice of the neighborhood | 23 | 31 | 16 | 20 |
| Stated choice of the housing | 61 | 51 | 70 | 72 |
| Stated non-choice of the housing | 19 | 29 | 10 | 8 |
Table 4.
Frequency of the geographical contrasts vis-à-vis the neighborhood and the housing.
| Neighborhood | Housing | |
|---|---|---|
| Choice | 191 | 216 |
| Non-choice | 77 | 52 |
Table 5.
Relationship between the residential choice and the socioeconomic profile of the sample.
| Chosen Neighborhood and Housing | Either Chosen Neighborhood or Housing | Not Chosen | |
|---|---|---|---|
| Executives, Intermediate Professions * | 80.95% (n = 34) | 14.29% (n = 6) | 4.76% (n = 2) |
| Employees * | 62.75% (n = 64) | 24.51% (n = 25) | 12.75% (n = 13) |
| BAC, higher education | 67.53% (n = 104) | 22.08% (n = 34) | 10.39% (n = 16) |
| No education, Professional degrees | 44.00% (n = 11) | 36.00% (n = 9) | 20.00% (n = 5) |
| Incomes > 1500€ | 68.50% (n = 87) | 22.05% (n = 28) | 9.45% (n = 12) |
| Incomes < 1500€ | 53.57% (n = 60) | 32.14% (n = 36) | 14.28% (n = 16) |
| Central location | 60.27% (n = 44) | 26.03% (n = 19) | 13.70% (n = 10) |
| Pericentral location | 73.24% (n = 52) | 22.53% (n = 16) | 4.23% (n = 3) |
| Peripheral location | 58.87% (n = 73) | 27.42% (n = 34) | 13.71% (n = 17) |
| Short length of residency (<2 years) | 66.04% (n = 70) | 22.64% (n = 24) | 11.32% (n = 12) |
| Medium length of residency (2–10 years) | 56.41% (n = 66) | 29.91% (n = 35) | 13.68% (n = 16) |
| Long length of residency (>10 years) | 67.01% (n = 65) | 22.68% (n = 22) | 10.31% (n = 10) |
* Only from the city center.
Table 6.
Average opinions of the neighborhoods according to the feeling of choice.
| Chosen Neighborhood | Neighborhood Not Chosen | |||
|---|---|---|---|---|
| Home Neighborhood | Other Neighborhoods | Home Neighborhood | Other Neighborhoods | |
| Chosen housing | 7.07 s.d. = 1.85 n = 169 | 20.27 s.d. = 19.00 n = 169 | 6.91 ** s.d. = 2.08 n = 47 | 20.02 ** s.d. = 21.11 n = 47 |
| Housing not chosen | 5.91 * s.d. = 4.01 n = 22 | 21.41 * s.d. = 19.55 n = 22 | 5.13 s.d. = 4.06 n = 30 | 26.40 s.d. = 17.31 n = 30 |
* and **: Non-significant correlations between the value distributions.
© 2018 by the author. Licensee MDPI, Basel, Switzerland. This article is an open access article distributed under the terms and conditions of the Creative Commons Attribution (CC BY) license (http://creativecommons.org/licenses/by/4.0/).
Share and Cite
MDPI and ACS Style
Najib, K. Interdependence Evaluation between the Home Neighborhood and the City: How Socio-Spatial Categorization Impacts upon Residential Segregation. Soc. Sci. 2018, 7, 178. https://doi.org/10.3390/socsci7100178
AMA Style
Najib K. Interdependence Evaluation between the Home Neighborhood and the City: How Socio-Spatial Categorization Impacts upon Residential Segregation. Social Sciences. 2018; 7(10):178. https://doi.org/10.3390/socsci7100178
Chicago/Turabian StyleNajib, Kawtar. 2018. "Interdependence Evaluation between the Home Neighborhood and the City: How Socio-Spatial Categorization Impacts upon Residential Segregation" Social Sciences 7, no. 10: 178. https://doi.org/10.3390/socsci7100178
Note that from the first issue of 2016, this journal uses article numbers instead of page numbers. See further details here.