Article

Minority High School Students in Non-Math-Science-Oriented and Math-Science-Oriented Majors: Do They View the Environment Differently?

by
Colmore S. Christian
1,*,
Santosh K. Ojha
1 and
Berneece S. Herbert
2
1
Department of Biological and Environmental Sciences, College of Agricultural, Life and Natural Sciences, Alabama Agricultural and Mechanical University, Normal, AL 35762, USA
2
Department of Urban and Regional Planning, College of Agricultural, Life and Natural Sciences Alabama Agricultural and Mechanical University, Normal, AL 35762, USA
*
Author to whom correspondence should be addressed.
Soc. Sci. 2018, 7(8), 130; https://doi.org/10.3390/socsci7080130
Submission received: 19 June 2018 / Revised: 2 August 2018 / Accepted: 3 August 2018 / Published: 7 August 2018

Abstract

:
The aim of the study was to investigate differences, if any, in environmental attitude, knowledge, experience and participation, between non-math-science (NMS) and math-science (MS) high school students from minority ethnic groups. A 16-item survey instrument was used for data collection. Participants were students at eight high schools in Madison County, Alabama, USA who were enrolled in North Alabama Center for Educational Excellence’s (NACEE’s) 2014 and 2015 summer programs. Eighty-six completed questionnaires were collected, the majority from Black/African-American and Hispanic minority ethnic groups. Pearson’s chi-square test and Spearman rho correlation were applied to assess differences and relationships between the groups. We found high level of positive attitude (NMS [95%] and MS [98%]) towards environmental protection among both groups; however, no statistically significant differences were evident. While both groups had low levels of participation and engagement in environmental protection and outdoor recreation activities, the MS group had comparatively higher participation than the NMS group. The relationship between participation and satisfaction was significantly positive for MS students and significantly negative for NMS students. To increase minority students’ knowledge and participation in pro-environmental activities in the future, Alabama’s Environmental Education Program should emphasize selective activities (e.g., involving students’ families and communities in environmental initiatives, providing opportunities to students to socialize and have fun with nature, and encouraging age-appropriate teaching and learning approaches).

1. Introduction

Ecological behaviors and decisions are correlated with environmental beliefs and attitudes (Kaiser et al. 1999; Makki et al. 2003). Behavior is the way in which one acts or conducts oneself to an action, environment, person, or stimulus, and most often expressed on the basis of perceived attitude (Chaiklin 2011). Environment education (EE) integrates principles of sustainable development that encompass a balance between social, economic, and environmental aspects of natural resource conservation and utilization (Bice 2013; Hassan et al. 2010; Wals 2009). EE is intended to impact affective, cognitive, and behavioral levels of students and ultimately influences decisions and behaviors (Makki et al. 2003).
It is essential to assess students’ environmental attitudes and associated behaviors in relation to their knowledge and understanding of environmental issues to evaluate the impacts of EE (Dillon and Gayford 1997). The term attitude is defined in social psychology as “an evaluative response towards something that could be favorable or unfavorable but expressed according to one’s beliefs, feelings, and behavior” (Ugulu et al. 2013). There is a thought that an individual’s actions are influenced by his/her personal attitudes and constructs, and interprets the issues accordingly. Personal attitudes, perceptions and behaviors are influenced by several cognitive, social, and personal factors which can change over time due to continuously gained new knowledge, exposure and experiences (Dillon and Gayford 1997; Ugulu et al. 2013). Knowledge is defined here as the facts, information or understanding acquired by someone through experience, awareness, participation, or education (Oxford online dictionary).
The school system’s EE programs are considered vital to reach and create awareness among the wider population because of the process of intergenerational influence (Ballantyne et al. 2001). In the United States, the Environmental Education Act of 1970 was one of the first major EE legislation that established the US Office of Environmental Education and was a foundation for developing state-wide EE programs (Stevenson et al. 2013). The Alabama EE program aims to produce informed citizens who have knowledge and awareness towards environment and can take part in addressing environmental challenges through positive attitudes, behaviors and informed actions, and decisions (Bice 2013). The program is designed to integrate learning across environmental disciplines, to promote critical thinking and problem solving of environmental challenges, to provide field-based experiences, and to teach with fact-based materials. Moreover, the Alabama EE program intends to develop students who are informed about local and global environmental challenges and to assist students in understanding their role as future leaders and responsible citizens to address those challenges. The EE program is also associated with Alabama’s Science, Technology, Engineering, and Mathematics (STEM) educational program. It is common that the students who have interests and talents in mathematics and science at school are more likely to pursue college degrees and career paths in fields of STEM (Subotnik et al. 2010).
In Alabama, the Alabama Math, Science, and Technology Initiative (AMSTI) provides environmental education for Grades K-12 teachers and administrators. AMSTI provides curriculum materials and training of national standard that includes topics on weather and phenology, soils, hydrology, land cover, erosion, and habitats (Bice 2013). Moreover, the EE courses in the Alabama high school system include biology, environmental science, earth and space science, marine science, health science, agriculture, food, and natural resources (Bice 2013). Nature centers, residential programs, non-profit groups, and science museums across the state also offer environmental education to schools.
The temporal evaluation of the students’ environmental attitudes and behaviors is important for revising environmental curricula and determining program results to inform further planning and decision making (Ugulu et al. 2013). The environmental awareness, attitude, skills and practices of the students need to be evaluated for further planning and decision making (Ozkan 2013; Köse et al. 2011). According to the 2016–2017 report of the Alabama State Department of Education [ALSDE] (ALSDE n.d.), the enrollment percentages of minority ethnic students, such as Blacks, Hispanics, and Asian in Alabama’s high schools were 33.6, 5.9 and 1.4, respectively. There is a lack of information on the outcomes and impacts of Alabama’s EE program. This study provided some insights with regards to the program’s impact among minority ethnic high school students. Empirical research to investigate whether minority students enrolled in high school STEM programs are interested in pursuing STEM college education and career paths is critical for long-term planning purposes at the state and national levels.
Survey instruments or constructs that are designed on a Likert type scale can be used as a reliable and valuable method for assessing attitudes and beliefs. After testing several scales, (Ugulu et al. 2013) found an “environmental attitude scale” that was designed on a 4-point Likert scale and divided under four subscales: environmental awareness, attitudes towards recovery, attitudes towards recycling, and environmental consciousness and behavior as a valid and reliable method for measuring attitudes of high school students towards environmental science education in Turkey.
There are several studies that have investigated students’ attitude and behavior towards environmental protection and EE (Uitto and Saloranta 2010; Ugulu et al. 2013; Hassan et al. 2010; Makki et al. 2003; Dillon and Gayford 1997; Ozkan 2013; Asan et al. 2014). Higher pro-environmental attitudes were found among biology/science students than among non-science students (Hassan et al. 2010; Tikka et al. 2000). Tuncer (2008) investigated university students in Turkey and reported no significant difference between students enrolled in environmental courses and students who were enrolled non-environmental courses with respect to their attitudes towards sustainable development. However, the attitude, knowledge, experience, and behavior of non-math-science and math-science high school students towards environmental protection and environmental education are less understood.
The main objective of the study was to investigate the differences between non-math-science (NMS) and math-science (MS) minority high school students in respect of their attitudes, knowledge, experiences, and participation in environmental protection. The specific objectives were to, (1) investigate NMS and MS students’ attitudes and knowledge towards environmental protection and conservation, (2) examine NMS and MS students’ participation and experience in pro-environmental activities, and (3) explore NMS and MS students’ motivation and satisfaction level on Alabama’s EE and interest in environmental career fields.

2. Materials and Methods

2.1. Study Area

The study area was Madison County, Alabama in the United States (Figure 1). There are 19 public high schools in Madison County (Public School Review 2017). Students from eight of these high schools participated in the study.

2.2. Data Collection

A multidimensional, 16-item survey instrument, the design of which was based on instruments used in similar past studies, was used for data collection. The reliability and validity of the instrument was tested though a pre-test administered to a sample of first-year forestry students at Alabama A&M University. The final survey instrument was divided into three sections: (1) Demographic and general information (2) Environmental knowledge, beliefs, and actions, and (3) Outlook and assessment of the role and influence of conservation. Each section consisted of a mixed-format set of multiple choice questions, “yes/no” questions, 5-point Likert-scale questions, and open-ended questions.
The data was collected from the high school students participating in ‘Upward Bound’ and ‘Upward Bound-Science and Math’ programs of the North Alabama Center for Educational Excellence (NACEE). NACEE, a non-profit educational center in Madison County, serves local high school students through academic advising and tutoring, college study skills, General Education Diploma (GED)/high school equivalency preparation, American College Testing (ACT) preparation, examination preparation classes, and provides many other educational services to make students more competent in their future endeavors (NACEE n.d.). The majority of the NACEE students come from minority, low-income families.
The ‘Upward Bound’ program provides academic activities, summer courses and activities, and bridge counselling to assist in college selection. The ‘Upward Bound—Science and Math’ program provides the same services and in addition, encourages and mentors students in mathematics and science with the goal that these students will pursue careers in the scientific and technical fields. The overall ‘Upward Bound’ and ‘Upward Bound—Science and Math’ programs also include a 6-weeks intensive summer module for the students.
Each summer NACEE enrolls approximately 64 students from the public high schools in Madison County into the ‘Upward Bound’ and ‘Upward Bound—Science and Math’ programs. For several years now a representative from Alabama A&M University’s Forestry, Ecology and Wildlife Program mentors some of the students involved in NACEE’s 6-weeks summer ‘Upward Bound’ and ‘Upward Bound—Science and Math’ modules. The mentees, with the support of NACEE program administrators, helped to get other participants to complete the survey instrument. Participants were given one day to complete and return the questionnaire. Although all the students were encouraged to participate in this survey, approximately 67% of students enrolled in NACEE responded to survey. We used a total of 86 completed questionnaires for data analysis, 43 collected in summers of 2014 and 2015, respectively.

2.3. Data Analysis

In this analysis NACEE’s ‘Upward Bound’ program participants were categorized as the ‘NMS’ sub-group and those participating in ‘Upward Bound—Science and Math’ program as the ‘MS’ sub-group. The total number of students was used to make inferences about the whole sample and for comparisons with the sub-samples, i.e., NMS and MS.
Descriptive statistics and graphical representation were used to interpret NMS, MS and total students’ attitudes, knowledge, experience, and motivation. A Pearson’s chi-square test was used to examine whether there were any differences between NMS and MS students with respect to their perspectives towards environmental conservation and commitment. Each conservation and commitment question was rated on a 5-point Likert scale with 1—Strongly Agree, 2—Agree, 3—Strongly Disagree, 4—Disagree, and 5—No opinion/Don’t Know.
To measure internal consistency of the set of Likert-scale questions, we computed Cronbach’s alpha reliability coefficient to determines whether the scale used was reliable and valid (Christian et al. 2016). We found values equal to 0.86 and 0.87 for Cronbach’s alpha and ‘Cronbach’s alpha based on standardized items’, respectively, which indicated a high level of internal consistency of the scales for our Likert-scale questionnaire. Cronbach alpha value ranges between zero and one. The closer the value is to one means the greater the consistency of the questions in the scale (Hair et al. 1998). Pearson’s chi-square test examined whether the observed distribution of NMS and MS students, and their attitudes (agreement level responses i.e., 1 to 5) were completely independent (Hair et al. 1998). Phi and Cramer’s V examined the strength of association between sets of variables (Kotrlik and Williams 2003). We used Spearman rho correlation to examine relationships between attitudes, participation, careers choices, and satisfaction levels of NMS and MS students. All data analysis was performed with the Statistical Package for Social Scientists (SPSS) 21 package.

3. Results and Discussion

A total of 86 students, equally divided between the NMS and MS sub-groups and representing eight high schools of the Madison County, Alabama, participated in the study. Among the 43 NMS students, nine were males and 34 females. Similarly, 10 were males and 33 females among the 43 MS students.
The number of siblings of NMS and MS students ranged from one to more than eight (Table 1). The high number of siblings indicated that most of the students had relatively large families, because according to census 2010–2014, the average family size in Alabama is 2.55 (U.S. Census Bureau, Quick Facts Alabama 2016). The number of MS students who had relatively large families (i.e., more than three siblings) was higher than the number of NMS students.
The participation of students from the Black/African-American race was highest in our investigation. We recorded 36 Black/African Americans, two Hispanics, one Native American, one Pacific Islander, and three ‘others’ among 43 NMS students. Similarly, there were 37 Black/African Americans, four Hispanics, and two ‘others’ among 43 MS students. The participation of first-year students and sophomores was higher than juniors and seniors. The highest number of participants was from the 14–15 age group.

3.1. Attitudes and Knowledge of NMS and MS Students towards Environmental Protection and Conservation

The majority of NMS and MS students believed that there is a need to protect the environment. In response to the question, ‘Do you believe in the need to protect the environment?’, the percentages of NMS students who said ‘yes’ and ‘no’ were 95 and two, respectively, while three percent provided no response to the question. For the same question, the percentages of MS students who answered ‘yes’ and ‘no’ were 98 and two respectively. We found a high level of pro-environmental attitude among NMS and MS students, and that both student sub-groups were equally concerned about environment protection.
Recycling of household waste is considered important because it helps to keep the environment clean, conserve materials, save energy, and reduce garbage in landfills. To the question, ‘Do you and/or your household recycle household materials?’, the percentages of NMS students who answered ‘yes’ and ‘no’ were 42 and 56, respectively, while two percent had no response to the question. For the same question, the percentages of MS students were 28 and 72 for ‘yes’ and ‘no’, respectively. The percentages of NMS students who recycled paper, glass, plastics, and other items were two, two, 28, and 14, respectively, while 54 percent had no response to the question. Similarly, the percentages of MS students who recycled paper, glass, plastics, and other items were nine, two, 12, and nine, respectively; while 68 percent had no response to the question.
Although the percentage of NMS students’ households that recycled was higher than MS students’ households, a relatively low level of attitude or awareness for recycling was found among both NMS and MS students. The low level of household recycling could possibly be associated with lack of knowledge among students and with parents’ educational level, knowledge, and awareness towards environmental protection. We did not gather information on parents’ education and social status; however most of the students represented low-income, minority families. To improve students’ attitudes towards recycling, the school system should adopt motivating techniques to create a sense of ownership and civic duty among students about their community (Busteed 2009).
Environment and nature conservation-related television programs are important mediums to cultivate pro-environmental attitudes and enhance knowledge among students (Eilam and Trop 2012). We asked students whether they watched any television programs focused on nature and/or the environment on a regular basis. The percentages of NMS students who answered ‘yes’ or ‘no’ were 23 and 72, respectively, while five percent did not respond to the question. Similarly, the percentages of MS students who answered ‘yes’ and ‘no’ were 30 and 70, respectively. The Animal Planet, Discovery Channel, Animals Gone Wild, National Geography, Nature, Net Geo, World’s Deadliest, and Tapped (Documentary) were the favorite television programs watched.
We also asked students how often they watched nature and/or environmental-based television shows based on given options: daily, weekly, fortnightly, monthly, and yearly. Daily and weekly viewings were more popular among both NMS and MS sub-groups. Among the total sample 21 percent of students followed such shows on a weekly basis (Figure 2). The NMS and MS students equally watched monthly (5%) and fortnightly (2%) television shows (Figure 2). However, the percentage of MS students was higher than NMS students for watching daily and weekly shows (Figure 2). The percentages of NMS and MS students who provided no response to the relevant question were high, i.e., 67 and 58 respectively (Figure 2). This indicated low motivation and interest levels among both NMS and MS students for watching television programs related to nature and/or environment.
Teachers can play an important role in increasing curiosity and interest among students for watching environment and nature-related television programs. As suggested by Shah and Jehangir (2006), we recommend that high school teachers should share real life experiences of environmental conservation, initiate environmental conservation activities in school, and encourage students to get involved in community interaction on environmental issues.
The Pearson chi-square test showed that there was no statistically significant difference between NMS and MS students’ attitudes towards conservation and commitment to the environment at confidence level 95% (Table 2). We conclude that there was no significant association between type of NACEE program (NMS and MS) and attitude/opinion of students about environmental conservation and commitment. Both NMS and MS students had equal agreement levels for the questions (Table 2). Phi and Cramer’s V measured strength of association between the variables (NACEE’s program and students’ attitude). The strength of association for the questions was weak (Table 2).
Interestingly, earlier studies (Hassan et al. 2010; Tikka et al. 2000) reported higher levels of environmental attitudes and awareness among biology/science high school students than among non-biology/science high school students. Similarly, Heyl et al. (2013) found a significant difference between students of environment field and those in non-environment field on their attitude and behavior towards environment.
We asked students to name Alabama’s officially sanctioned state ‘tree’ and ‘bird’ to assess their general knowledge of flora and fauna of their home state. The percentage of NMS students who provided the correct name of the state bird i.e., Yellowhammer (Colaptes auratus) was 21, and of the state tree i.e., Southern Longleaf Pine (Pinus palustris Miller) was 12. Similarly, the percentage of MS students who provided correct name of the state bird was 30 and of the state tree was 19. Although the percentage of MS students who provided the correct answers was higher than the percentage of NMS students, overall the results showed a poor knowledge level among students, particularly in respect of these two questions.

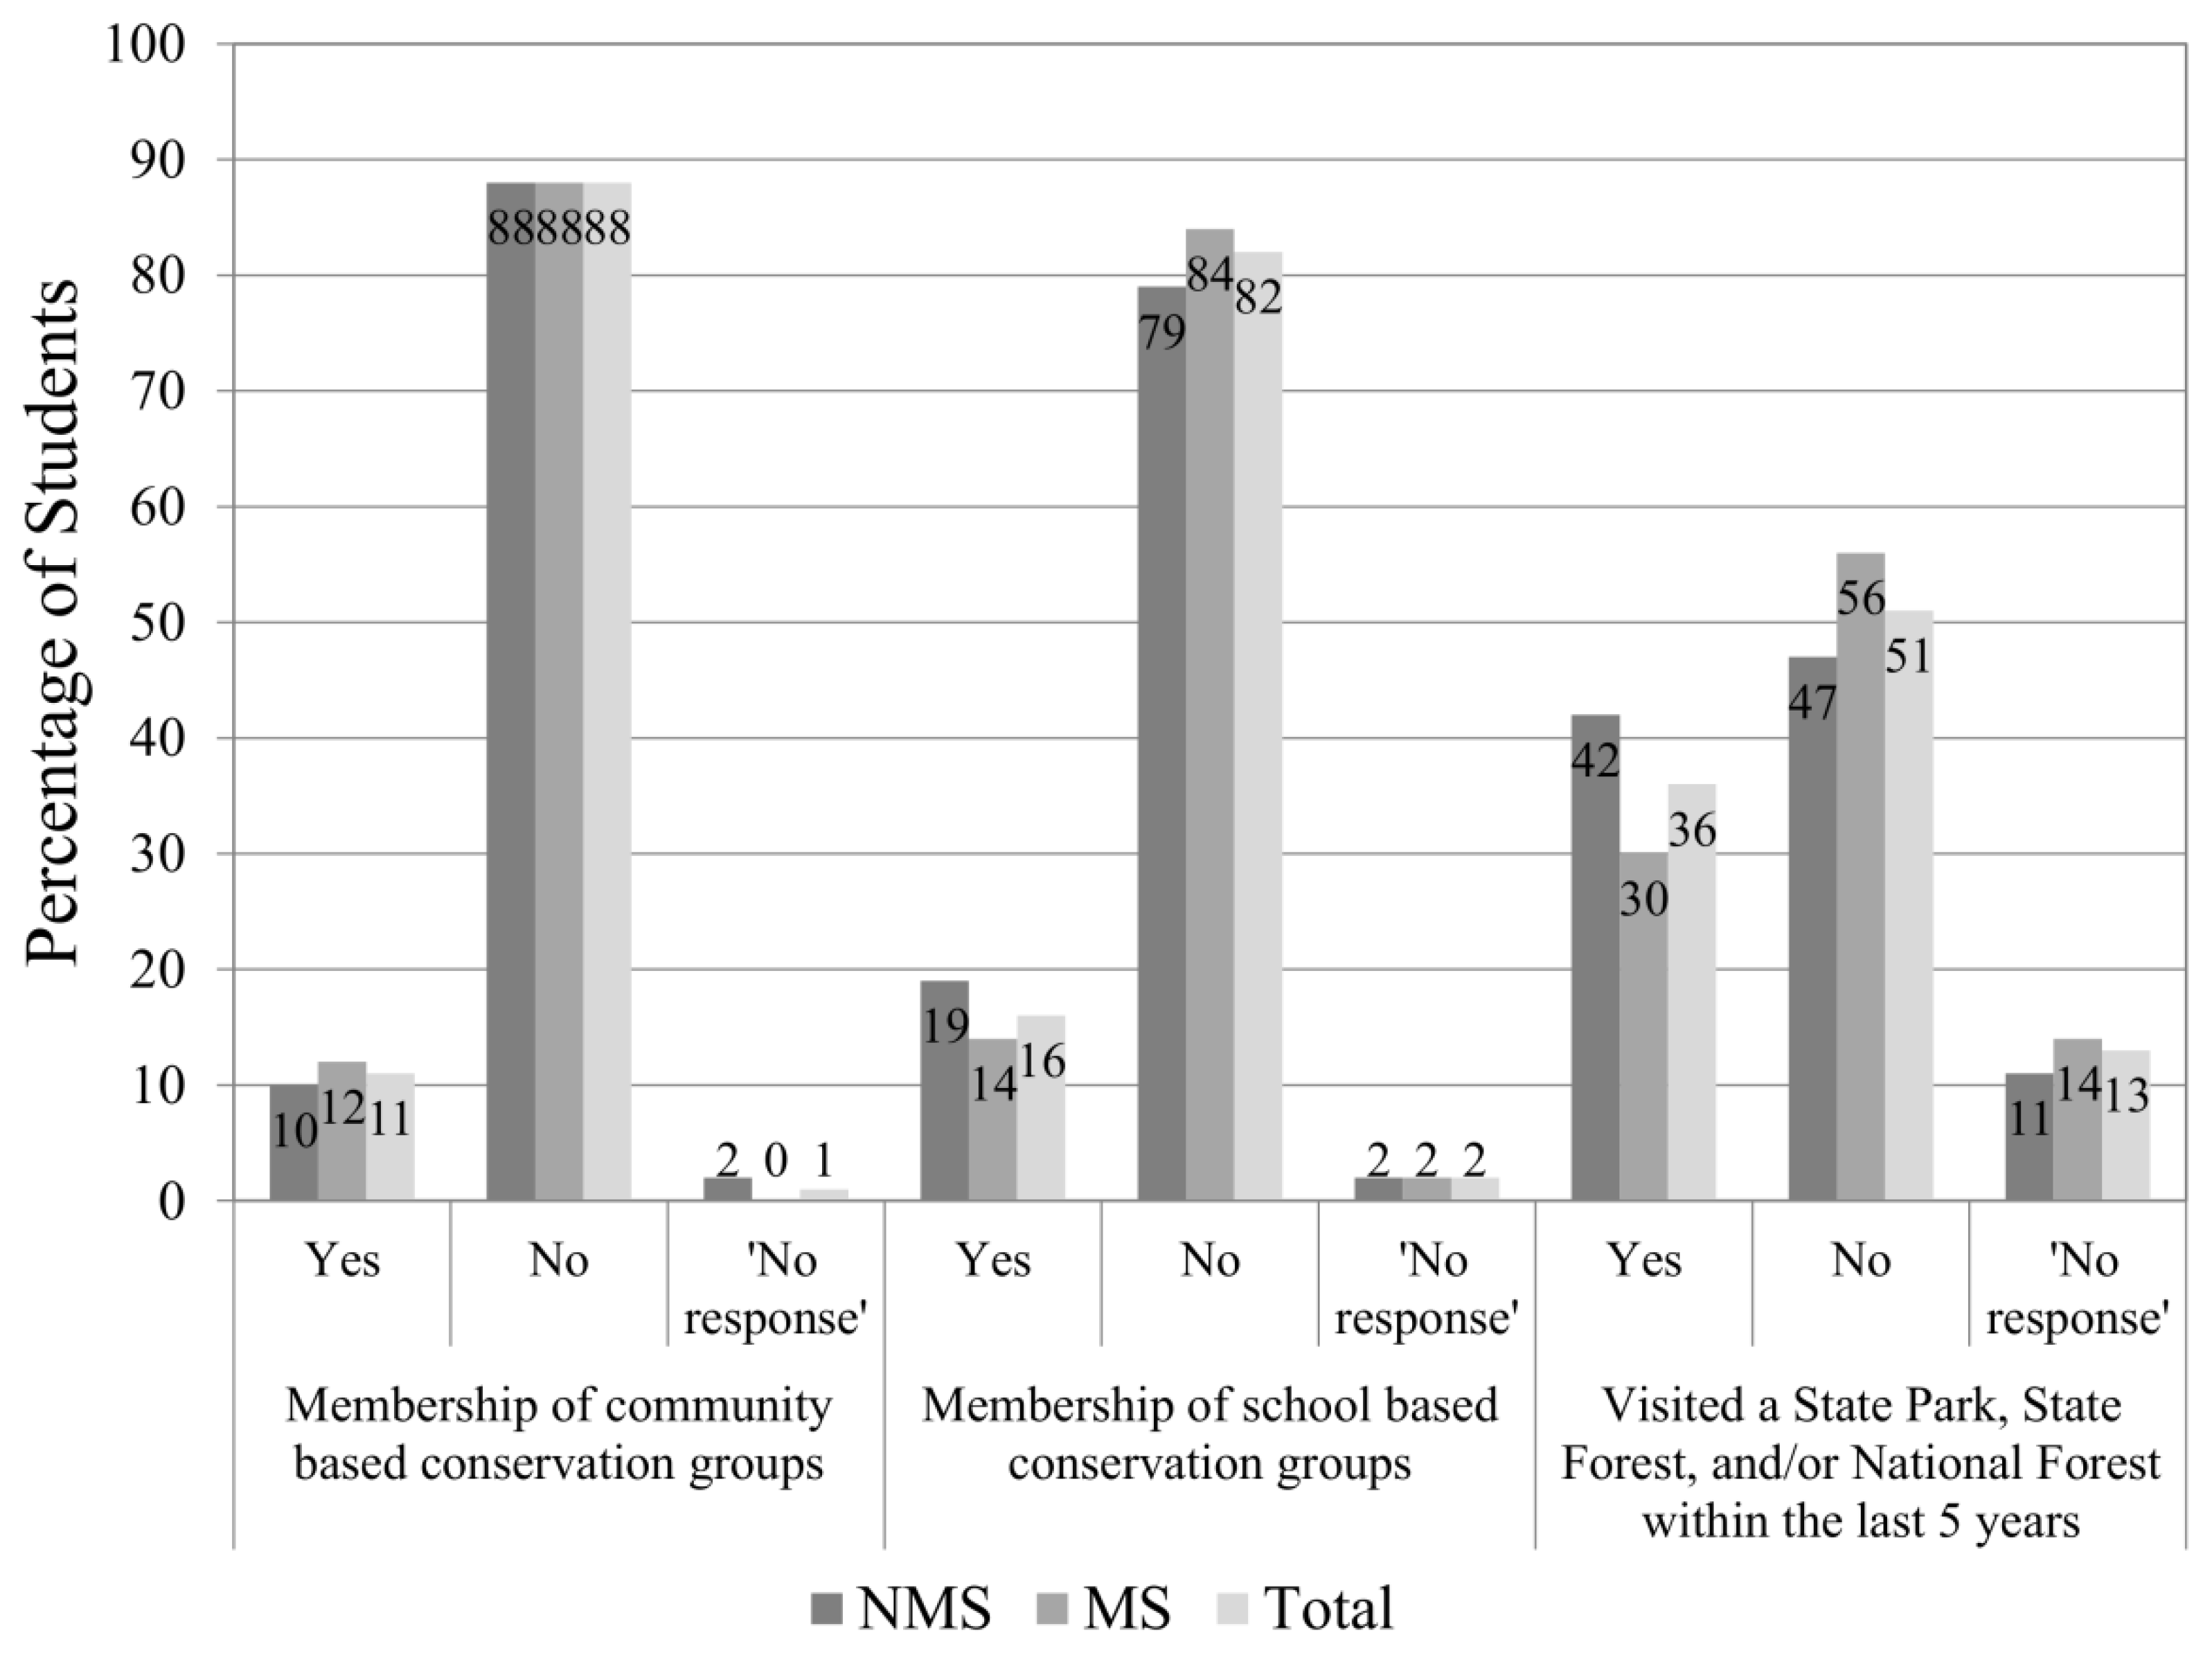
3.2. Experience and Participation of NMS and MS Students in Pro-Environmental Activities

To increase students’ pro-environmental attitude, knowledge and awareness, there is a need to increase their experience and participation in environment and natural resource conservation activities such as outdoor activities, recreational visits, tree planting, recycling, and participation in conservation groups’ meetings. We evaluated NMS, MS, and overall students’ experiences and participation in pro-environmental activities, such as membership of community-based conservation groups; membership of school-based conservation groups, such as Future Farmers of America (FFA), Minorities in Agriculture, Natural Resources and Related Sciences (MANRRS), horticulture clubs, and/or other similar groups; and visit to a park or forest within the last five years.
Twelve percent of MS students had membership in community-based conservation groups, which was slightly higher than the percentage of NMS students (10%) (Figure 3). However, the percentages of NMS students who had membership of school-based conservation groups and had visited a park and/or forest were 19 and 42, respectively, which were higher than the percentages of MS students and the percentages of total students (Figure 3). Although there was low experience and participation level of NMS and MS students in pro-environmental activities, we found a relatively higher experience of students from each group for visiting parks/forests, than participating in community or school-based conservation groups within the last five years.
Although there was a high level of pro-environmental attitude among both MNS and MS students, we found a low level of participation and experience in environmental activities. Similar to our results, Abbas and Singh (2014) reported a high pro-environmental attitude and knowledge but low participation in environment protection activities among university students in India. Similarly, Christian et al. (2016) found a high attitude and knowledge in environmental protection but low participation in nature conservation and outdoor recreation activities among high school students in Alabama. Emmons (1997) found a positive change in students’ perceptions towards environment based on their participation in environmental activities and events in school.
Some of the NMS and MS students had experience of participating in different outdoor activities during the last 5 years. The MS students were more active in the outdoors than NMS students. The participation percentages of MS students in hiking, camping, nature walks, bird watching, fishing, picnicking, horseback riding, mountain biking, and other activities were 35, 19, 35, nine, 37, 28, 16, seven, and nine, respectively, whereas the participation percentages of NMS students in these activities were 28, 16, 23, seven, 26, 12, 12, five, and seven, respectively (Figure 4). Among the outdoor activities, fishing, hiking, nature walks and picnicking were the most popular among the MS students whereas NMS students favored hiking, fishing, camping, and picnicking (Figure 4). In general, the experience of participating in outdoor activities among MS students was higher than among NMS students.
The three most participated outdoor activities among the NMS and MS students during last five years were hiking, fishing, and nature walks. Students most possibly had chance to participate in these three outdoor activities during summer school field trips. Moreover, high schools in North Alabama occasionally arrange field trips to various places related to environment and nature conservation.
There were many students who participated in more than one outdoor activity during last five years. We assessed how many times students were able to participate in such outdoor activities. The ‘one-time’ participation of MS students in hiking, camping, nature walks, fishing and mountain biking was higher than NMS students’ participation (Table 3), whereas ‘one-time’ bird watching and picnicking were more popular among NMS students than among MS students. Similarly, hiking, bird watching, fishing, picnicking, and horseback riding were more popular for ‘two to three’ visits among MS students than among NMS students. More MS students had participated ‘four to five times’ in nature walks, bird watching, fishing, and picnicking more often than NMS students during last five years (Table 3). Likewise, the participation of MS students was higher than NMS students in camping, nature walks, bird watching, and picnicking ‘six and more times’ during last five years (Table 3).
We found hiking, camping, nature walks, fishing, and picnicking as the most preferred outdoor activities for multiple visits among the students. When we assessed students’ experience and participation in outdoor activities for single to multiple times, it was found, that in general the MS students had higher levels of experience and participation in most of the outdoor activities than the NMS students. School teachers’ role and parents’ attitude and awareness towards environment, time, and earnings are likely important factors that could impact the frequency of students’ participation in outdoor activities.

3.3. Motivation and Satisfaction Levels of NMS and MS Students about Environmental Education and Career Fields

The data analysis pointed to a low level of motivation among students for selecting college education and career paths in the fields of biology/environment science. Among the total participants 13 percent responded ‘yes’, 84 percent said ‘no’ and three percent did not respond to the question ‘When you attend college are you likely to study and prepare for careers in the agricultural, environmental, and/or natural resources fields?’ The percentage of MS students who said ‘yes’ to the same question was 16, which was higher than the percentage of NMS students (9%). The percentage of students who said ‘no’ among NMS students was 86 and among MS students was 81 (Figure 5a).
The students who said that they will likely attend college and pursue career paths in the fields of biology/environmental science, were asked about their preferred field of interest among the given options of natural resource specialist, forest ranger, park ranger, game warden/wildlife specialist, outdoor recreation specialist, agriculture specialist, environmental specialist, and geographic information system (GIS) specialist. Out of 16 percent of MS students who responded ‘yes’, the preference was highest for natural resource specialist (7%) and then for agriculture specialist (5%), (Figure 5b). Likewise, out of nine percent of NMS students who responded ‘yes’, the preference was highest for agriculture specialist (5%), (Figure 5b). No one showed interest in being a GIS specialist, park ranger, or an environment specialist. The natural resource specialist and agriculture specialist fields were most preferred fields among the students. Such preferences could be due, in part, to students’ familiarity with local farming and forestry activities. Students’ apparent lack of interest in the other fields was possibly due to limited knowledge and personal experiences in these areas.
Other studies (Varisli 2009) reported that gender, parents’ education level, and mothers’ work status as significant factors that influence students’ environmental knowledge, attitude, sensitivity and concern. They found that parents’ education and mothers’ work status positively correlated with students’ environmental literacy.
The interest for attending a college and pursuing career in the fields of biology/environment was low among both NMS and MS students. According to Fizer (2013) some of the factors that influences students’ decision for selecting future education and career paths are family background and education (parents’, friends’ and others), high personally rewarding careers, and experiences. EE programs designed on the basis of students’ age group are most effective (Liefländer and Bogner 2014). In a pre- and post-retention study in Germany it was found that younger students of age 9–10 more concerned with positive attitudes towards preservation and utilization of nature than older students aged 11–13 years (Liefländer and Bogner 2014). These results suggest that the implementation of environmental literacy programs from the elementary school level is possibly the best strategy to cultivate students’ interest towards the environment/natural resource conservation field in future.
The satisfaction level of students about the Alabama EE program was evaluated using a 5-point Likert-scale question (‘1—Very dissatisfied’, ‘2—Dissatisfied’, ‘3—Satisfied’, ‘4—Very Satisfied’ and ‘5—Extremely Satisfied’). Our question to students was ‘Overall, how satisfied are you with conservation and environmental education programs in city of Huntsville?’ The percentages of ‘Extremely Satisfied’, ‘Very Satisfied’, and ‘Satisfied’ among NMS students were two, nine, and 63, respectively, whereas the percentages of ‘Extremely Satisfied’, ‘Very Satisfied’, and ‘Satisfied’ among MS students were zero, nine, and 56, respectively (Figure 6). There was no response to the question from seven percent of students from each NMS, MS, and total group (Figure 6).
The majority of NMS and MS students were satisfied with Alabama’s current EE program. This implied that students were satisfied with teachers’ role, teaching methods, and learning materials at school. However, when a comparison was made between NMS and MS, the satisfaction level was slightly higher among NMS students.
By evaluating the relationships between attitudes, participation, career choices, and satisfaction levels, we found significant differences between NMS and MS students especially in respect of participation, careers choices, and satisfaction levels (Table 4). While the association between participation and satisfaction was positive and significant for MS students, the relationship was significantly negative for NMS students. Participation of MS students in school-based conservation groups also positively associated with their career choice in the agricultural, environmental, and natural resources fields (Table 4).
Although students had high satisfaction levels towards Alabama’s EE, their interest for choosing college education and careers in the fields of biology/environment was low. This suggests that efforts should be directed at designing appropriate teaching or communication strategies in schools that could enhance students’ motivation towards biology or environment field. EE programs should provide opportunities for students to develop their concern and compassion towards the environment (Emmons 1997).
While majority of the NMS and MS students had positive attitude towards environmental conservation, both groups had low levels of participation and engagement in environmental protection and outdoor recreation activities. Even though environmental awareness among MS students was higher than NMS students, we need to continue to develop effective approaches in EE to enhance both groups’ interest in connecting with environment. Students are more likely to participate in environmental or social activities if their parents are active in such activities or give them encouragement and approval to take part in such activities (Wilson 2011). Similarly, teachers and other role models who have attachment to nature or environmental protection can motivate students to take an interest in those matters. Teachers can use artistic and creative approaches, such as drama, storytelling, music, dance, photography, poetry, creative writing, visual arts, and film to motivate and raise affective knowledge and emotional connections between students and the environment (Ham 1992; Wilson 2011).
Teachers can integrate classroom learning and outdoor learning strategies to broaden the minority students’ overall environmental learning experiences in all aspects of their school life. The outdoor experiences, such as camping and walking in national parks, and visiting museums, zoos and gardens can provide fun and at the same time may give rise to curiosity for nature among students. Also, the engagement of students in collective community or environmental works is most effective because students learn to work together for the common good and get enjoyment from socializing and learning. It also encourages the students to make their own informed decisions and act in a responsible manner towards the environment.
The study’s outcome can assist administrators to gain an understanding of the effectiveness of Alabama’s current EE program and can also serve as a guide for further environmental literacy planning, designing and decision making. Given that most of the respondents were from minority families, it is recommended that an inclusive EE program should be implemented to raise awareness and motivation among minority students and their families. Very importantly efforts should be made to include more Caucasians in any future study. The use of a small sample size and the failure to capture enough information about participating students’ family status (e.g., parents’ social, economic, employment, and educational backgrounds) as well as information about the level of teachers’ role and influence on students are some of the limitations of the study. Another limitation is the limited geographic scope of the data collection.

4. Conclusions

There is a positive attitude towards environmental protection and nature conservation among NMS and MS students in Northern Alabama. However, there was no statistically significant difference between NMS and MS students with respect to their environmental conservation and commitment attitudes. Both the NMS and MS student sub-groups had a very low level of participation and experience in pro-environmental activities. In general, the participation level of MS students in outdoor activities was higher than that of NMS students. Similarly, the percentage of MS students who was likely to pursue college education and careers in the fields of biology or environmental science was higher than percentage of NMS. The result showed a positive correlation between participation in outdoor activities and selecting college and careers in the fields of biology or environmental science among MS students.
Majority of both the NMS and MS students were satisfied with Alabama’s EE program. However, since the majority of participants in both MS and NMS sub-groups were of Black/African-American ethnicity, it may be concluded that improvement of Alabama’s EE curricula could possibly assist in motivating minorities to participate more in pro-environmental activities as well as to pursue careers in the fields of biology or environmental science. By emphasizing some activities in Alabama’s EE program, such as engaging students in the local environmental issues, involving student’s families and communities in environmental initiatives, providing enough opportunities for students to socialize and have fun with nature, and encouraging age- appropriate teaching and learning approaches can all lead to higher levels of minority students’ connection with nature and environment.

Author Contributions

Conceptualization, C.S.C.; Data curation, S.K.O.; Formal analysis, S.K.O.; Investigation, C.S.C. and B.S.H.; Methodology, C.S.C.; Project administration, C.S.C.; Writing—original draft, S.K.O.; Writing—review & editing, C.S.C. and B.S.H.

Funding

This research received no external funding.

Conflicts of Interest

The authors declare no conflict of interest.

References

  1. Abbas, Mohammed Yahaya, and Ripudaman Singh. 2014. A Survey of Environmental Awareness, Attitude, and Participation amongst University Students: A Case Study. International Journal of Science and Research (IJSR) 3: 1755–60. [Google Scholar]
  2. ALSDE. n.d.Alabama State Department of Education. Available online: http://web.alsde.edu/PublicDataReports/Default.aspx (accessed on 23 July 2018).
  3. Asan, Idrizi, Srbinovski Mile, and Jonuzi Ibraim. 2014. Attitudes of Macedonian High School Students towards the Environment. Procedia Social and Behavioral Sciences 159: 636–42. [Google Scholar] [CrossRef]
  4. Ballantyne, Roy, John Fien, and Jan Packer. 2001. School Environmental Education Programme Impacts upon Student and Family Learning: A Case Study Analysis. Environmental Education Research 7: 23–37. [Google Scholar] [CrossRef] [Green Version]
  5. Bice, Thomas R. 2013. Alabama Alive! A State Environmental Literacy Plan. Alabama Department of Education. Available online: http://eeaa.us/wp-content/uploads/2013/03/ALABAMA-ALIVE-Draft-for-review-by-SDE.pdf (accessed on 1 June 2018).
  6. Busteed, Meaghan. 2009. Recycling Attitudes and Behaviors of Students at Carlos Pascua Zúñiga High School. Worcester Polytechnic Institute. Available online: http://www.wpi.edu/Pubs/E-project/Available/E-project-121609-172634/unrestricted/RecyclingAttitudesandBehaviorsofStudentsatCarlosPascuaZunigaHighSchool.pdf (accessed on 5 June 2018).
  7. Chaiklin, Harris. 2011. Attitudes, Behavior, and Social Practice. The Journal of Sociology & Social Welfare 38: 31–54. [Google Scholar]
  8. Christian, Colmore, Santosh K. Ojha, and Berneece Herbert. 2016. The Perspectives and Experiences of High School Students towards the Environment—The Case of North Alabama. Journal of Education & Social Policy 3: 13–26. [Google Scholar]
  9. Dillon, Patrick J., and Christopher G. Gayford. 1997. A Psychometric Approach to Investigating the Environmental Beliefs, Intentions and Behaviours of Pre-service Teachers. Environmental Education Research 3: 283–97. [Google Scholar] [CrossRef]
  10. Eilam, Efrat, and Tamar Trop. 2012. Environmental Attitudes and Environmental Behavior—Which Is the Horse and Which Is the Cart? Sustainability 4: 2210–46. [Google Scholar] [CrossRef] [Green Version]
  11. Emmons, Katherine M. 1997. Perceptions of the Environment While Exploring the Outdoors: A Case Study in Belize. Environmental Education Research 3: 327–44. [Google Scholar] [CrossRef]
  12. Fizer, Darren. 2013. Factors Affecting Career Choices of College Students Enrolled in Agriculture. Master’s thesis, The University of Tennessee, Martin, TN, USA. Available online: https://www.utm.edu/departments/msanr/_pdfs/Fizer_Research_Project_Final.pdf (accessed on 1 June 2018).
  13. Hair, Joseph F., Ronald L. Tatham, Rolph E. Anderson, and William Black. 1998. Multivariate Data Analysis, 5th ed. Upper Saddle River: Prentice Hall, p. 768. [Google Scholar]
  14. Ham, Sam H. 1992. Environmental Interpretation: A Practical Guide for People with Big Ideas and Small Budgets. Colorado: Fulcrum Publishing. [Google Scholar]
  15. Hassan, Arba’at, Tajul Ariffin Noordin, and Suriati Sulaiman. 2010. The Status on the Level of Environmental Awareness in the Concept of Sustainable Development amongst Secondary School Students. Procedia Social and Behavioral Sciences 2: 1276–80. [Google Scholar] [CrossRef]
  16. Heyl, Marianne, Emilio Moyano Díaz, and Luis Cifuentes. 2013. Environmental Attitudes and Behaviors of College Students: A Case Study Conducted at a Chilean University. Revista Latinoamericana de Psicología 45: 487–500. [Google Scholar] [CrossRef]
  17. Kaiser, Florian G., Sybille Wolfing, and Urs Fuhrer. 1999. Environmental Attitude and Ecological Behaviour. Journal of Environmental Psychology 19: 1–19. [Google Scholar] [CrossRef]
  18. Köse, Sacit, Ayse Savran Gencer, Kudret Gezer, Gül Hanım Erol, and Kadir Bilen. 2011. Investigation of Undergraduate Students’ Environmental Attitudes. International Electronic Journal of Environmental Education 1. Available online: http://dergipark.ulakbim.gov.tr/iejeegreen/article/download/1087000016/1087000011 (accessed on 15 May 2018).
  19. Kotrlik, Joe W., and Heather A. Williams. 2003. The Incorporation of Effect Size in Information Technology, Learning, and Performance Research. Information Technology, Learning, and Performance Journal 21: 1–7. [Google Scholar]
  20. Liefländer, Anne Kristin, and Franz Xaver Bogner. 2014. The Effects of Children’s Age and Sex on Acquiring Pro-Environmental Attitudes through Environmental Education. The Journal of Environmental Education 45: 105–17. [Google Scholar] [CrossRef]
  21. Makki, Maha Haidar, Fouad Abd-El-Khalick, and Saouma Boujaoude. 2003. Lebanese Secondary School Students’ Environmental Knowledge and Attitudes. Environmental Education Research 9: 21–33. [Google Scholar] [CrossRef]
  22. NACEE—North Alabama Center for Educational Excellence. n.d.Available online: http://nacee.net/ (accessed on 2 October 2016).
  23. Ozkan, Recep. 2013. Indicating the Attitudes of High School Students to Environment. Educational Research and Reviews 8: 154–83. [Google Scholar]
  24. Public School Review. 2017. Madison County Public High Schools. Available online: https://www.publicschoolreview.com/alabama/madison-county/high (accessed on 18 May 2018).
  25. Shah, Abid, and Sadaf Jehangir. 2006. Teaching for Quality Education in Environmental Education: Challenges and Possibilities. Available online: http://ecommons.aku.edu/book_chapters/94/ (accessed on 25 May 2018).
  26. Stevenson, Kathryn T., M. Nils Peterson, Howard D. Bondell, Angela G. Mertig, and Susan E. Moore. 2013. Environmental, Institutional, and Demographic Predictors of Environmental Literacy among Middle School Children. PLoS ONE 8. [Google Scholar] [CrossRef] [PubMed]
  27. Subotnik, Rena F., Robert H. Tai, Rochelle Rickoff, and John Almarode. 2010. Specialized Public High Schools of Science, Mathematics, and Technology and the STEM Pipeline: What Do We Know Now and What Will We Know in 5 Years? Roeper Review 32: 7–16. [Google Scholar] [CrossRef]
  28. Tikka, Paivi, Markku Kuitunen, and Salla Tynys. 2000. Effects of Educational Background on Students’ Attitudes, Activity Levels, and Knowledge Concerning the Environment. The Journal of Environmental Education 31: 12–19. [Google Scholar] [CrossRef]
  29. Tuncer, Gaye. 2008. University Students’ Perception on Sustainable Development: A Case Study from Turkey. International Research in Geographical & Environmental Education 17: 212–26. [Google Scholar] [CrossRef]
  30. Ugulu, Ilker, Mehmet Sahin, and Suleyman Baslar. 2013. High School Students’ Environmental Attitude: Scale Development and Validation. International Journal of Educational Sciences 5: 415–24. [Google Scholar] [CrossRef]
  31. Uitto, Anna, and Seppo Saloranta. 2010. The Relationship between Secondary School Students’ Environmental and Human Values, Attitudes, Interests and Motivations. Procedia Social and Behavioral Sciences 9: 1866–72. [Google Scholar] [CrossRef]
  32. U.S. Census Bureau, Quick Facts Alabama. 2016. Available online: https://www.census.gov/quickfacts/table/PST045215/01 (accessed on 5 June 2018).
  33. Varisli, Tugce. 2009. Evaluating Eighth Grade Students’environmental Literacy: The Role of Socio-Demographic Variables. Middle East Technical University. Available online: https://etd.lib.metu.edu.tr/upload/12610808/index.pdf (accessed on 5 June 2018).
  34. Wals, Arjen. 2009. United Nations Decade of Education for Sustainable Development (DESD, 2005–2014). Review of Contexts and Structures for Education for Sustainable Development. Division for the Coordination of United Nations Priorities in Education UNESCO. Available online: http://unesdoc.unesco.org/images/0015/001540/154093e.pdf (accessed on 1 June 2018).
  35. Wilson, Carla. 2011. Effective Approaches to Connect Children with Nature. Wellington: Publishing Team, Department of Conservation. [Google Scholar]
Figure 1. Madison County in Alabama was the study area. Students from County’s high schools participated in the Study (USA map in inset).
Socsci 07 00130 g001
Figure 2. The frequency of watching nature and/or environment-focused television programs among NMS, MS, and total students. ‘No response’ means students had no response to the question. Data values are presented outside the bars.
Socsci 07 00130 g002
Figure 3. The percentages of NMS, MS, and total students who (1) had membership of a community-based conservation groups, such as hiking clubs, heritage societies, etc. (2) had membership of school-based conservation groups, such as FFA, MANRRS, horticulture club, etc., and (3) had visited a Park/Forest within the last 5 years. Data values are inside the bars.
Socsci 07 00130 g003
Figure 4. The percentages of NMS, MS, and total students who participated in various outdoor activities within the last 5 years. Data values are reflected inside the bars.
Socsci 07 00130 g004
Figure 5. The percentages of NMS, MS, and total students (a) who had/did not have interest in attending college and preparing for careers in the fields of agriculture and/or environmental sciences, and (b) who had career preferences in the fields of agriculture and/or environmental sciences. Here, the percentage of ‘yes’ responses was divided into preferred career fields. ‘No response’ means students did not respond to the relevant question. Data values are reflected inside the bar.
Socsci 07 00130 g005
Figure 6. The percentages of NMS, MS, and total students who rated their level of satisfaction of Alabama’s EE program. ‘No response’ means students did not respond to relevant question. Data values are captured outside the bars.
Socsci 07 00130 g006
Table 1. Number of siblings of the students who participated in the study. ‘NR’ means no response from the respondent in respect of the relevant question.
Students’ NACEE ProgramNumber of Siblings of the Participating StudentsTotal
123456788+NR’
NMS61010238103043
MS888732212243
Total1418189610315286
Table 2. Pearson chi-square test between NMS and MS students ‘attitudes towards environmental conservation and commitment’. Five-point Likert-scale questionnaire was used (where, 1—Strongly Agree, 2—Agree, 3—Strongly Disagree, 4—Disagree, and 5—No opinion/Don’t Know).
QuestionsNACEE’s School ProgramNumber of Respondents (n)Pearson Chi-Square TestSymmetric Measures
(5-Point Likert Scale)
12345
Conservation
Forest and natural resources are important to me, my community and my stateNMS1126014χ(4) = 3.92, p = 0.42Phi = 0.22
MS1819113 Cramer’s V = 0.22
More people should car poolNMS4202212χ(4) = 2.12, p = 0.83Phi = 0.16
MS6192411 Cramer’s V = 0.16
Individuals should always conserve waterNMS1621014χ(4) = 3.35, p = 0.50Phi = 0.20
MS1818204 Cramer’s V = 0.20
Individuals should always conserve energyNMS1720004χ(3) = 1.23, p = 0.74Phi = −0.12
MS1818015 Cramer’s V = 0.12
Alabama and the country as a whole should make greater use of renewable energy sourcesNMS2114015χ(3) = 1.62, p = 0.65Phi = −0.14
MS2018004 Cramer’s V = 0.14
Conservation or environmental education should be a required course during high schoolNMS1217229χ(4) = 2.49, p = 0.65Phi = −0.17
MS819447 Cramer’s V = 0.17
Commitment
Prepared to occasionally volunteer to work at community and/or state parks as a contribution to conservation programsNMS822129χ(4) = 5.26, p = 0.26Phi = −0.25
MS1615146 Cramer’s V = 0.25
Support enactment of stronger land use and planning regulations to protect the environmentNMS822218χ(4) = 7.35, p = 0.11Phi = 0.30
MS1714028 Cramer’s V = 0.30
Table 3. The percentages of NMS, MS, and total high school students who participated in outdoor activities and the number of times they participated within last 5 years.
NMSMSTotal
Outdoor Activities(Number of Times)
12–34–56+12–34–56+12–34–56+
Hiking25957169251093
Camping97222672517723
Nature Walks521099211214721612
Bird Watching720257256513
Fishing9951416219141315714
Picnicking75792191419512914
Horseback Riding9255914029823
Mountain Biking252290226222
Other5550212273833
Note: High values are in bold.
Table 4. Spearman’s rho correlation between participation, satisfaction and career preferences of NMS and MS students. Response categories are in parentheses.
ParticipationSatisfaction and Career
Satisfaction with the Alabama’s Environmental Educational Program (Very Dissatisfied, Dissatisfied, Satisfied, Very Satisfied and Extremely Satisfied)Study and Prepare for Careers in the Agricultural, Environmental and Natural Resources Fields (Yes, No)
NMSMSNMSMS
Membership of community-based Conservation groups (yes, no)0.120.42 **0.220.23
Membership of school-based conservation groups (yes, no)−0.40 *−0.020.090.36 *
** Correlation is significant at α = 0.01 level (2-tailed); * Correlation is significant at α = 0.05 level (2-tailed).

