Article

Cross-Feeding and Enzymatic Catabolism for Mannan-Oligosaccharide Utilization by the Butyrate-Producing Gut Bacterium Roseburia hominis A2-183

by
Abhishek Bhattacharya
1,*,†,
Lovisa Majtorp
1,†,
Simon Birgersson
1,
Mathias Wiemann
1,
Krishnan Sreenivas
2,
Phebe Verbrugghe
3,
Olivier Van Aken
4,
Ed W. J. Van Niel
2 and
Henrik Stålbrand
1,*
1
Division of Biochemistry and Structural Biology, Department of Chemistry, Lund University, Naturvetarvägen 14, 221 00 Lund, Sweden
2
Applied Microbiology, Department of Chemistry, Lund University, Naturvetarvägen 14, 221 00 Lund, Sweden
3
Department of Food Technology, Engineering and Nutrition, Lund University, Naturvetarvägen 14, 221 00 Lund, Sweden
4
Department of Biology, Lund University, Sölvegatan 35, 223 62 Lund, Sweden
*
Authors to whom correspondence should be addressed.
These authors contributed equally to this work.
Microorganisms 2022, 10(12), 2496; https://doi.org/10.3390/microorganisms10122496
Submission received: 21 October 2022 / Revised: 1 December 2022 / Accepted: 11 December 2022 / Published: 16 December 2022
(This article belongs to the Special Issue Regulation and Workings of the Gastrointestinal Microbiota)

Abstract

:
β-Mannan is abundant in the human diet and in hemicellulose derived from softwood. Linear or galactose-substituted β-mannan-oligosaccharides (MOS/GMOSs) derived from β-mannan are considered emerging prebiotics that could stimulate health-associated gut microbiota. However, the underlying mechanisms are not yet resolved. Therefore, this study investigated the cross-feeding and metabolic interactions between Bifidobacterium adolescentis ATCC 15703, an acetate producer, and Roseburia hominis A2-183 DSMZ 16839, a butyrate producer, during utilization of MOS/GMOSs. Cocultivation studies suggest that both strains coexist due to differential MOS/GMOS utilization, along with the cross-feeding of acetate from B. adolescentis E194a to R. hominis A2-183. The data suggest that R. hominis A2-183 efficiently utilizes MOS/GMOS in mono- and cocultivation. Notably, we observed the transcriptional upregulation of certain genes within a dedicated MOS/GMOS utilization locus (RhMosUL), and an exo-oligomannosidase (RhMan113A) gene located distally in the R. hominis A2-183 genome. Significantly, biochemical analysis of β-1,4 mannan-oligosaccharide phosphorylase (RhMOP130A), α-galactosidase (RhGal36A), and exo-oligomannosidase (RhMan113A) suggested their potential synergistic role in the initial utilization of MOS/GMOSs. Thus, our results enhance the understanding of MOS/GMOS utilization by potential health-promoting human gut microbiota and highlight the role of cross-feeding and metabolic interactions between two secondary mannan degraders inhabiting the same ecological niche in the gut.

1. Introduction

The human gastrointestinal tract contains a complex microbial community known as the human gut microbiota (HGM) [1,2]. The metabolic capabilities of the HGM assist the human gut to utilize recalcitrant complex nutrients [3,4]. The metabolic activity of the HGM is not only associated with health benefits but also with disease [2,5]. A decrease in the relative abundance of some gut bacteria, e.g., Bifidobacteria spp. or Roseburia spp., has been associated with health-related problems [5,6]. In the context of human health and physiology, the role of short-chain fatty acids (SCFAs), such as acetate and butyrate, generated during the fermentation of complex glycans by the HGM has gained much attention [7,8]. In particular, the role of butyrate as an important energy source for colonocytes has been extensively studied [5]. Furthermore, other beneficial aspects of butyrate-producing Roseburia have also contributed to an increased interest in them [2,5,7]. An interesting possibility could be the health-beneficial manipulation of the HGM composition through dietary carbohydrates such as prebiotic oligosaccharides [9,10,11].
β-Mannans are complex glycans naturally occurring as dietary fibers and are also extensively used as thickeners in the food and feed industry [12,13]. β-Mannans such as galactomannan carry α-galactosyl side groups [12]. Even though β-mannan metabolism has been identified as one of several important pathways for glycan utilization in the human gut microbiota [14], limited studies have focused on understanding the mechanisms of β-mannan or (galacto)-β-mannan-oligosaccharides (MOS/GMOS) utilization by the HGM [15,16,17,18,19,20]. Glycan-processing proteins are often organized into multigene clusters which encode glycan-binding proteins, carbohydrate-active enzymes, and transporters that work together to target a particular glycan [21,22]. Notably, such clusters are prevalent in Gram-negative genus Bacteroides and are termed polysaccharide utilization loci (PULs), characterized by outer membrane-bound solute-binding proteins (SBPs), Ton-B dependent transporters, and often endo-acting glycoside hydrolases [1]. In contrast, certain Gram-positive members of the HGM, such as Firmicutes (Roseburia, Clostridia) and Actinobacteria (Bifidobacteria), harbor glycan-processing proteins in specific utilization loci often characterized by distinct ATP-binding cassette (ABC) transporters that moderate the capturing of oligosaccharides by SBPs located extracellularly [22]. Significantly, several impactful studies on inulin and xylan utilization by gut bacteria belonging to Firmicutes and Actinobacteria harboring specific glycan utilization loci have been published [21,23]. However, very few studies on β-mannan and/or MOS/GMOS utilization loci in Roseburia spp. [17] and Bifidobacterium spp. [24] have been reported.
The interplay within the diverse gut microbiota allows for the breakdown of complex glycans by potential primary degraders such as members of Bacteroides, thereby making recalcitrant glycans available to secondary degraders which may lead to cooperation or competition among bacteria in shared nutrient niches within the human gut [22,25]. Notably, some primary β-mannan degraders, such as Roseburia intestinalis [17] and Bifidobacterium animalis subsp. lactis BI-04 [24], have been shown to compete with Bacteroides ovatus, another primary mannan degrader [17,18,24]. Interestingly, cooperative interaction was observed between a secondary degrader (MOS/GMOS consumer), Faecalibacterium prausnitzii, and the primary degraders R. intestinalis L1-82 or Ba. ovatus [15]. Recently, we demonstrated that Roseburia hominis A2-183 DSMZ 16839 (hereafter R. hominis) and Bifidobacterium adolescentis E194a ATCC 15703 (hereafter B. adolescentis) are secondary degraders (MOS/GMOS consumers) [16], and both the species have been associated with health-promoting effects on the host [26,27]. Some investigations have reported cross-feeding and metabolic interactions, using acetate producers (Bifidobacterium spp.) and butyrate producers (Eubacterium spp. or Faecalibacterium spp.) during coculturing on arabinoxylo-oligosaccharides (AXOSs), starch, or fructo-oligosaccharides (FOSs) [28,29]. However, little attention has been devoted to such cross-feeding during the utilization of MOS/GMOS, which is investigated in this study. Thus, we have chosen two strains that, as secondary mannan degraders, can utilize MOS/GMOS [16], namely the acetate-producing B. adolescentis and the acetate-consuming and butyrate-producing R. hominis, who are suggested to share the same nutrient niche in the human colon [30]. The mechanistic understanding of the MOS/GMOS utilization by R. hominis and B. adolescentis would not only assist in strategies for HGM manipulation and contribute to new perspectives regarding glycan-dependent metabolic interactions but would also help us to identify unexplored carbohydrate-active enzymes (CAZymes) from gut bacteria.
In this study, we investigated whether cross-feeding and metabolic interactions occur between B. adolescentis and R. hominis during the fermentation of MOS/GMOS or glucose, assessing whether competitive or cooperative behavior occurs during cocultivation. Moreover, we investigated the mechanistic role of a putative R. hominis (galacto)-β-mannan-oligosaccharides (MOS/GMOSs) utilization locus (RhMosUL, locus tag: RHOM_RS11115-11180), which was brought to attention by previous in silico sequence analyses of R. hominis genome [16,17]. Thus, herein we conducted a transcript analysis of certain RhMosUL putative genes. Furthermore, we characterized selected proteins encoded by RhMosUL, including a β-mannoside phosphorylase (RhMOP130A, RHOM_RS11135) and an α-galactosidase (RhGal36A, RHOM_RS11140), which were upregulated during the growth of R. hominis on MOS/GMOS, in addition to a distally expressed β-mannoside hydrolase (RhGH113A, RHOM_RS14610). Together, these data allowed us to throw light on the uptake and initial hydrolysis of MOS/GMOS by R. hominis and understand aspects of the interplay between R. hominis and B. adolescentis under in vitro conditions.

2. Materials and Methods

2.1. Bioinformatic Analysis

2.1.1. Bioinformatic Prediction of Roseburia hominis A2-183 Gene Functions

An amino acid sequence similarity analysis was conducted where the RefSeq annotated protein sequences listed in Supplementary Table S1 from the genome of R. hominis A2-183 (BioProject accession number PRJNA33399) were subjected to BLASTp searches against Roseburia intestinalis L1-82 strain (BioProject Accession PRJNA30005) [17] (Supplementary Table S1). The BLASTp (BLOSUM 62-matrix) suite of the National Center for Biotechnology Information (NCBI) was used at the default threshold e-value of 1 × e−5. The functional annotation for the R. hominis target proteins was predicted based on the high sequence similarity to the homologs in R. intestinalis [17] (Supplementary Table S1).

2.1.2. Bioinformatic Analysis of RhMosBP, RhMOP130A, RhMan113A, and RhGal36A

The gene sequences of RhMosBP (RHOM_RS11160, GenBank protein-id, AEN97401.1), RhMOP130A (RHOM_RS11135, GenBank protein-id AEN97396.1), RhMan113A (RHOM_RS14610, GenBank protein-id: AEN98108.1), and RhGal36A (RHOM_RS11175, GenBank protein-id: AEN97404.1) were collected from the GenBank database [31]; open reading frames (ORFs) were identified with the Expasy Translate tool [32]; and SignalP-6.0 [33] was used to predict signal peptides. Homology searches were conducted by BLASTp (NCBI) (https://blast.ncbi.nlm.nih.gov/Blast.cgi, accessed on 5 September 2022) against the Protein Data Bank (PDB). Multiple sequence alignments were carried out by using Clustal Omega (www.ebi.ac.uk/, accessed on 5 September 2022). The homology model for RhMosBP was generated by using SWISS-MODEL [34] with BlMnBP (PDB 6I5R) as a template. The model structure was evaluated by using the programs MolProbity [35] (molprobity.biochem.duke.edu/, accessed on 5 September 2022) and PROCHECK [36] (www.ebi.ac.uk/thornton-srv/software/PROCHECK/, accessed on 5 September 2022), resulting in low QMEAN (<|2|), and few Ramachandran outliers (<0.95%). PyMOL (Version 2.0, Schrödinger, LLC, New York, NY, USA) was used for structure superimposition and figure generation (pymol.org/2/, accessed on 5 September 2022).

2.2. Strains and Media

Bifidobacterium adolescentis E194a ATCC 15703, which was isolated from the human adult intestine, and Roseburia hominis A2-183 DSMZ 16839, which was isolated from a human fecal sample, were purchased from American Type Culture Collection (ATCC; Manassas, VA, USA) and German Collection of Microorganisms and Cell Cultures, GmbH (The Leibniz Institute; DSMZ, Braunschweig, Germany), respectively. Stock cultures were stored at −80 °C in a reinforced clostridial medium (RCM, Oxoid, Hampshire, UK) containing 25% (v/v) glycerol. B. adolescentis and R. hominis were cultivated anaerobically, using a medium for colon bacteria (MCB) and a modified medium for colon bacteria (mMCB), respectively [16]. For coculture studies, MCB was used. Both MCB and mMCB have the same composition, except that mMCB is enriched with sodium acetate (5 g/L). All cultivation studies were carried out in triplicates.

2.3. Monoculture and Coculture Fermentation Studies

Filter sterilized (0.22 µm syringe filter) glucose, mannose, galactose, and (galacto)-β-mannan-oligosaccharides (MOS/GMOSs) at 10 g/L were used as carbohydrate sources. The MOS/GMOSs were produced in-house by enzymatic hydrolysis of low-viscosity locust bean gum (lvLBG) (Megazyme, Bray, Ireland), using a β-mannanase (BoMan26B) from Bacteroides ovatus; the procedure and characterization of the preparation have been published before [16]. The growth medium was prepared, dispersed under nitrogen, and autoclaved at 121 °C for 20 min. For the cultivation of B. adolescentis or R. hominis, precultures were passaged three times on MCB or mMCB containing glucose or MOS/GMOS (details provided in Supplementary Materials Text S1). A 2.0% (v/v) preculture of B. adolescentis or R. hominis was used to inoculate 100 mL of MCB or mMCB for monocultivations. For cocultivation, 2% (v/v) values of both B. adolescentis and R. hominis were used as preculture for inoculating 100 mL of MCB. All fermentation studies were carried out at 37 °C for 48 h, without shaking in screw-capped vials in triplicates (referred to as biological replicates) [16]. Aliquots were collected after 0, 3, 6, 9, 12, 16, 24, 36, and 48 h of cultivation and were centrifuged at 8000× g for 15 min at 4 °C. For determining extracellular α-galactosidase and β-mannosidase activity, 100 µL of the cell-free supernatant was incubated with 0.9 mL of 1.0 mM para-nitrophenyl α-galactopyranoside (pNP-Gal) or para-nitrophenyl β-mannopyranoside (pNP-Man) (Sigma Aldrich, St. Louis, MO, USA) in 0.05 M phosphate buffer, pH 6.8. The reaction mixture was incubated at 37 °C for 10 min, and the reaction was stopped by adding 0.5 mL 1 M sodium carbonate, and the absorbance was measured at 405 nm. The rest of the supernatant was stored at −20 °C for carbohydrate utilization and short-chain fatty acids (SCFAs) analysis. The cell pellets were stored at −80 °C for genomic DNA (gDNA) extraction, quantitative PCR (qPCR), and gene-expression analysis.

2.4. Primer Design

Primer sets for determining the cell concentration of B. adolescentis and R. hominis by qPCR in mono- and cocultures were designed (Supplementary Table S2), and those used for amplification of reference genes and target genes in R. hominis by reverse-transcription-quantitative PCR (RT-qPCR) are listed in Supplementary Table S3. The primers were designed by using Primer3 plus software [37] and were based on the whole-genome sequences of Roseburia hominis A2-183 DSMZ 16839 (BioProject accession number PRJNA33399, RefSeq accession number NC_015977.1) and Bifidobacterium adolescentis E194a ATCC 15703 (BioProject accession number PRJNA16321, RefSeq accession number NC_008618.1). The in vitro confirmation of primer specificity and selectivity was performed by the qPCR analysis of gDNA from both the strains for evaluating population dynamics (Supplementary Table S2) and with gDNA from R. hominis for gene expression analysis (Supplementary Table S3). The details for qPCR amplification are mentioned below, in Section 2.5.2.

2.5. Bacterial Growth Analysis

The optical density at 600 nm (OD600) was determined by using a cell densitometer. All measurements were carried out in triplicates. The cell concentration of R. hominis and B. adolescentis during monocultivation and cocultivation on glucose and MOS/GMOS were quantified by using strain-specific qPCR targeting the rho gene (locus tag: RHOM_RS09380) encoding the RNA polymerase beta subunit protein and recA gene (locus tag: BAD_RS05455) encoding the recombination protein, respectively (Supplementary Table S2).

2.5.1. Genomic DNA Extraction

A culture volume of 2 mL was used for the extraction of gDNA, using a GeneJET Genomic DNA Purification kit (K0721, ThermoFisher Scientific, Waltham, MA, USA) according to the manufacturer’s protocol for Gram-positive bacteria, but with minor modifications [28], including the addition of 20 U/mL mutanolysin (Sigma-Aldrich, St Louis, MO, USA) and 30 mg/mL lysozyme (Sigma-Aldrich, St Louis, MO, USA) in the lysis buffer and an additional incubation (37 °C for 60 min) with 2.0 µg/mL DNase-free RNase (Sigma-Aldrich, St Louis, MO, USA). The concentration (absorbance at 260 nm) and purity (absorbance ratio, 260/280 nm) of the extracted gDNA were estimated by using a Nanodrop ND 1000 spectrophotometer (ThermoFisher Scientific, MA, USA), and the gDNA was stored in aliquots at −20 °C until further use.

2.5.2. Quantitative PCR (qPCR)

The extracted DNA from mono- and coculture studies were analyzed by qPCR (CFX384 Touch Real-Time PCR, Bio-Rad, USA). A master mix (6.0 µL) containing 2× SsoAdvanced Universal SYBR Green Supermix (Bio-Rad, Hercules, MA, USA), primers at 300 nM (final concentration), and 4.0 µL (4.0 ng or 1.0 ng/µL) of the sample (gDNA) were mixed. Ten-fold serial dilutions of known quantities of recA and rho gene-amplification products (4.0 ng to 4.0 pg) were used as qPCR standards. The amplification included a denaturation step at 98 °C for 120 s, followed by 40 two-step cycles at 98 °C for 15 s and 58 °C for 30 s. A melt curve analysis (65–98 °C) was conducted at the end of the run. A template without gDNA was used as the negative control. The cycle threshold (CT) values were determined based on CFX Maestro software (Bio-Rad, Hercules, MA, USA). The rho or recA copy numbers per mL were calculated based on CT values obtained during the qPCR analysis [38] (see Supplementary Materials Text S2 for details), using the corresponding standard curve. The standard curve was prepared by plotting the CT values obtained from qPCR analysis of the dilution series as a linear function of the logarithm of their calculated gene copy numbers per mL. The sum of calculated gene copy number values was used to determine the relative population of the different species [28,39]. Averages and standard deviations were calculated from three biological replicates and a technical duplicate of each biological replicate.

2.6. Determination of Carbohydrate Utilization and Short-Chain Fatty Acids (SCFAs) Production

2.6.1. Utilization of Glucose and MOS/GMOS

The utilization of glucose and MOS/GMOS was determined during the growth of R. hominis and B. adolescentis as mono- and cocultures on these carbohydrate sources by analyzing the cell-free supernatant (see Section 2.3), using high-performance anion-exchange chromatography with pulsed amperometric detection (HPAEC–PAD), as described before [16,40] in Section 2.11

2.6.2. Determination of Short-Chain Fatty Acids

The presence of SCFAs in the fermentation broth during the growth on different carbohydrate sources was determined as described by Bhattacharya et al. [41]. Briefly, cell-free supernatant (1 mL) was analyzed for lactic acid and SCFAs, including formate, propionate, acetate, and butyrate, by using high-performance liquid chromatography (HPLC) (Dionex Ultimate 3000, Thermo Fisher Scientific, MA, USA) equipped with an RI-detector (Shodex, New York, NY, USA). Values from control cultures without a carbohydrate source were subtracted.

2.7. Gene Expression Analyses

2.7.1. RNA Extraction and Purification

Samples (8 mL) for RNA extraction were collected, and two volumes of RNA protect (Qiagen, Hilden, Germany) were added, mixed by vortexing, and then allowed to stand for 5 min at room temperature, followed by centrifugation at 10,000× g for 10 min. The supernatant was removed carefully, and the pellets were stored at −80 °C. Total RNA was extracted by using the RNeasy mini kit (Qiagen, Hilden, Germany) according to the manufacturer’s instructions, but with minor modifications. Cell pellets were suspended in 100 µL of Bioultra TE buffer (30 mM Tris base, 1 mM EDTA, pH 8.0) (Sigma-Aldrich, St. Louis, MO, USA) containing 30 mg/mL of lysozyme (Sigma-Aldrich, St. Louis, MO, USA), 20 mg/mL of proteinase K (Sigma-Aldrich, St. Louis, MO, USA), and 40 U/mL of mutanolysin (Sigma-Aldrich, St. Louis, MO, USA) and incubated for 45 min at 37 °C. Then 700 µL of RLT buffer (RNeasy kit, Qiagen, Hilden, Germany) was added to the cell suspension, vortexed, and mechanically disrupted by using a bead-beater with the Cryolys attachment (Precellys 24, Bertin technologies, Montigny-le-Bretonneux, France) maintained at 4 °C, using liquid nitrogen in 2 mL standard tubes containing 0.1 mm glass beads (Precellys Lysing Kit VK01, Bertin technologies, France). The tubes were subjected to a lysis program of 3 repetitions at 6500 rpm for 30 s, with an interval of 30 s. An on-column RNase-free DNase I (79254, Qiagen, Hilden, Germany) was used for removing DNA according to the manufacturer’s instructions. RNA was eluted with 60 µL of RNase-free water, and 2 µL of protector RNase inhibitor (Merck, Darmstadt, Germany) was added. The concentration (absorbance at 260 nm) and purity (absorbance ratio, 260/280 nm) of the extracted total RNA were estimated by using a Nanodrop ND 1000 spectrophotometer (ThermoFisher Scientific, Waltham, MA, USA).

2.7.2. Monitoring Gene Expression

Reverse transcription of total RNA (diluted to a concentration of 100 ng/µL) into complementary DNA (cDNA) in a final volume of 20 µL was carried out with Revert Aid H Minus First Strand cDNA Synthesis Kit (K1632, ThermoFisher Scientific, MA, USA) as per the manufacturer’s instructions, using a Peltier thermal cycler PTC-200 (MJ Research, Waltham, MA, USA). For cDNA syntheses, the reaction was applied by using the following temperature profile: 40 °C for 5 min, 42 °C for 60 min, and 70 °C for 5 min. The cDNA samples were stored in aliquots at −80 °C. The qPCR analysis was carried out in a CFX384 Touch Real-Time PCR apparatus, Bio-Rad, USA. A master mix (6.0 µL) containing 2× Sso Advanced Universal SYBR Green Supermix (Bio-Rad, Hercules, CA, USA) and each primer at 300 nM final concentration was prepared, and 4.0 µL of the diluted cDNA (0.5 ng/µL). The qPCR amplification program consisted of an initial denaturation step at 95 °C for 20 s, followed by 40 two-step cycles at 95 °C for 10 s and 58 °C for 30 s. A melt curve analysis (65–98 °C) was conducted at the end of the run. In each run, gDNA from R. hominis was used as a positive control, while a no-template control (with nuclease-free water instead of cDNA) was used as the negative control. The CT values were determined based on CFX Maestro software.

2.7.3. Relative Quantification of Gene Expression

Reference genes are used to normalize the variations in transcriptomic data that arise due to variations during the quantification of RNA or cDNA synthesis. For normalization, multiple reference genes (Supplementary Table S3) were screened, and their selection was based on four different computational programs: BestKeeper tool, which ranks the genes in agreement with the standard deviation of their CT values in correlation with intragroup alterations [42]; NormFinder tool, which evaluates gene stability, using both intragroup and intergroup changes [43]; geNorm tool, which calculates the stability of each gene through intragroup differences and mean pairwise variation [44]; and comparative delta CT method tool, which values the fluctuation of the delta CT, making a comparison between two or more reference genes [45]. The data were integrated to obtain a final rank, based on the geometric mean, using the RefFinder tool [46].
The expression of certain putative genes (locus tag: RHOM_RS11135, 11140, 11145, 11160, and 11175) within the (galacto)-β-mannan-oligosaccharides (MOS/GMOS) utilization locus, RhMosUL (RHOM_RS11115-11180) and other putative target genes (locus tag: RHOM_RS14610, 05895, 06295, 13400, and 15425) spread across the R. hominis genome were analyzed (Supplementary Table S3). The level of expression of each target gene during the growth of this strain on glucose after 9 h was compared to its level of expression during the cultivation on glucose, mannose, galactose, and MOS/GMOS after 9 and 12 h of incubation and was expressed as the fold change on a logarithmic scale. The relative expression for each target gene was calculated based on the efficiency-corrected methodology, using multiple reference genes [47]. One-way ANOVA with Tukey’s post hoc test was used to determine whether the differential expression of the genes was significant during growth on different substrates.

2.8. Construction of Expression Plasmids for RhMOP130A, RhMan113A, and RhGal36A

The gene encoding RhMOP130A was codon optimized for expression in E. coli BL21(DE3) star cells (Thermo Fischer, Waltham, MA, USA), synthesized, and then inserted between the NcoI and NotI restriction sites of the plasmid pET-52b(+) by Genscript (Piscataway, NJ, USA). Positioned immediately after the NcoI site, the RhMOP130A gene was in frame with the plasmid-encoded start codon within the NcoI site. The native stop codon was replaced by a sequence encoding a Tobacco Etched Virus (TEV) protease site and subsequently followed by a plasmid-encoded Thrombin protease site, His10-tag, and stop codon. The TEV and Thrombin sites allow for the removal of the added His-tag but were not utilized within this work. The gene encoding RhMan113A was similarly codon optimized for expression in E. coli BL21(DE3) star cells, synthesized, and then inserted between the NcoI and NotI sites of the plasmid pET-28b(+) by Genscript (Piscataway, NJ, USA). The RhMan113A gene was positioned immediately after the NcoI site in frame with the plasmid-encoded start codon within the NcoI site. The native stop codon was replaced by a plasmid-encoded Thrombin protease site, His6-tag, and stop codon. Likewise, the gene encoding RhGal36A was codon optimized for expression in E. coli BL21(DE3) star cells, synthesized, and inserted between the NcoI and NotI sites of the plasmid pET-52b(+) by Genscript (Piscataway, NJ, USA). The NcoI start codon was replaced by the native one, followed by the coding region of the gene. The native stop codon was replaced by a plasmid-encoded Thrombin protease site, His10-tag, and stop codon. DNA sequencing was performed to verify the coding sequences and positions within the respective plasmids (Eurofins, Luxembourg). The plasmids were subsequently transformed into E. coli BL21(DE3) star cells.

2.9. Expression and Purification of RhMOP130A, RhMan113A, and RhGal36A

Transformed E. coli BL21 (DE3) star cells harboring the expression plasmid of either RhMOP130A, RhMan113A, or RhGal36A were cultured until mid-exponential phase (OD600~0.6) in 500 mL lysogeny broth (LB) medium at 37 °C, supplemented with 100 µg/mL ampicillin (for RhMOP130A and RhGal36A) or 50 µg/mL kanamycin (RhMan113A). Isopropyl β-D-thiogalactopyranoside (IPTG) was added (500 µM) to induce protein production, and the cultivation was continued for an additional 3 h. The cells were harvested by centrifugation and subsequently lysed by sonication or French press (RhMan113A). Recombinant proteins were purified from collected cell lysates by immobilized metal ion affinity chromatography (IMAC), using a 5 mL HisTrap Ni Sepharose Fast flow column (Cytiva, Marlborough, MA, USA) in an NGC FPLC-system (Bio-Rad, Hercules, CA, USA). A 20 to 500 mM imidazole gradient was used for elution. Fractions of pure recombinant protein (assessed by SDS–PAGE) were pooled, and the buffer was exchanged by using Vivaspin 20 centrifugal concentrators of appropriate molecular cutoffs to 20 mM sodium phosphate buffer pH 6 (RhMan113A), 20 mM TRIS-HCl pH 8 (RhGal36A), and 20 mM TRIS-HCl pH 7.4 (RhMOP130A) with storage at +4 °C. Protein concentrations were determined by measuring the absorbance at 280 nm, using a nano-drop ND 1000 spectrophotometer and the recombinant protein extinction coefficients: 80,790 M−1cm−1 for RhMOP130A, 92,820 M−1cm−1 for RhMan113A, and 117,580 M−1cm−1 for RhGal36A, calculated by using ProtParam (https://web.expasy.org/protparam/, accessed on 5 September 2022).

2.10. Protein Electrophoresis of RhMOP130A, RhMan113A, and RhGal36A

Sodium dodecyl sulfate–polyacrylamide gel electrophoresis (SDS–PAGE) analysis was conducted as previously described in Bågenholm et al. [18], using either an unstained PageRuler protein ladder (for RhMan113A and RhGal36A) (Thermo Scientific, Waltham, MA, U.S, product number: 26614) or a pre-stained PageRuler (RhMOP130A) (26616, Thermo Scientific, Waltham, MA, USA) as reference. Electrophoresis was carried out by using 12% Mini-PROTEAN® TGXTM Precast Protein gels (4561046, Bio-Rad, CA, USA) for 50 min at 150 V. Native polyacrylamide gel electrophoresis (native-PAGE) was conducted with Native PAGE marker (Thermo Fischer, Waltham, MA, USA, product number LC0725). Protein samples were loaded onto 4–15% Mini-PROTEAN® TGXTM Precast Protein Gels (4561086, Bio-Rad, CA, USA), and the electrophoresis was run for 30 min at 150 V, using the manufacturer’s instructions.

2.11. Saccharide Analysis by High-Performance Anion Exchange Chromatography–Pulsed Amperometric Detection (HPAEC–PAD)

Analysis of mono- and oligosaccharides was performed by using HPAEC–PAD, using CarboPac PA20 (060142, Dionex CarboPac PA20 BioLC, 3 × 150 mm, ThermoFisher Scientific, Sunnyvale, CA, USA) and PA200 (062896, Dionex CarboPac Pa200 BioLC, 3 × 250 mm, ThermoFisher Scientific, Sunnyvale, CA, USA) analytical columns coupled to guard columns of the same material on a Dionex ICS-5000 system (ThermoFisher Scientific, Sunnyvale, CA, USA) according to previously described methods [16,40]. Standards of appropriate monosaccharides, including mannose (M1) or galactose (G1) (Sigma Aldrich, St Louis, MO, USA); linear mannan-oligosaccharides (MOS), including mannobiose (M2), mannotriose (M3), mannotetraose (M4), and mannopentaose (M5); and galactosylated mannan-oligosaccharides (GMOS), including galactosyl mannotriose (GM3) and di-galactosyl mannopentaose (G2M5), were used (Megazyme, Bray, Ireland) (2.5–50 µM mannose (M1) or galactose (G1) for PA20, 2.5–30 µM M1–M5 and GMOS for PA200). For the analysis of bacterial saccharide utilization, the elution was performed according to the previously described method optimized for fermentation media, using PA200 [16]. The analysis of monosaccharides (PA20) in enzyme incubations was according to [40], and for oligosaccharides, the PA 200 method described by Morrill et al. [48] was used, but with a slightly reduced time (10 instead of 15 min) for the sodium acetate gradient (0–50 mM), applied in 78 mM NaOH. An additional wash step (3 min, 200 mM NaOH) was added. Analytes were identified based on correlation with retention times of the known standards. Representative chromatograms from analyzed triplicate incubations are shown in the figures.

2.12. Enzyme Activity Characterization of RhMOP130A

The activity, stability, and products of RhMOP130A were investigated in enzyme reactions set up in triplicates. The activity was determined by reverse phosphorolysis (synthesis) [49,50] by incubation (60 µL total reaction volume) of 0.14 mg/mL enzyme at 37 °C with α-D-mannose 1-phosphate (10 mM) and M4 (10 mM) in 100 mM sodium citrate buffer (pH 5.5, for pH-optimum pH 4.0–6.2). After 10 min, the reaction was stopped by boiling (5 min), and the released phosphate was quantified by using a colorimetric malachite green phosphate assay kit (MAK308, Sigma-Aldrich, St. Louis, MO, USA). The specific activity was determined by using either 10 mM glucose, M1, M2, M3, or M5 instead of M4. The stability of RhMOP130A was determined by incubating the enzyme in 100 mM sodium citrate buffer (pH 5.5 and 6.0) at 37 °C and sampling for activity determination after 0, 1, 3, 5, 24, and 72 h. The activity of RhMOP130A in the phosphorolysis reaction was determined by incubating 0.14 mg/mL of the enzyme in 100 mM sodium citrate buffer (pH 6.0) with 10 mM of either M2, M3, M4, M5, GM3, or G2M5 with 10 mM phosphate at 37 °C for 10 min (1 h and 24 h for the galactosyl mannosides) and analyzed by using HPAEC–PAD, as described above. The reactions were stopped by boiling (5 min) and were appropriately diluted with Milli-Q water and filtered through a 0.2 µM PTFE syringe filter into HPAEC vials. The detected phosphate release when using mannose 1-phosphate and oligosaccharides in synthesis activity determinations (as presented in the results section, Section 3.2.5, “Catalytic Properties of RhMOP130A”) indicates that RhMOP130A cleaves and phosphorylates terminal non-reducing mannosyl units by phosphorolysis, in accordance with other characterized mannan-oligosaccharide phosphorylases belonging to glycoside hydrolase (GH) family 130 [49]. Therefore, the assumed non-phosphorylated reaction product was quantified to determine the phosphorylase activity of the enzyme; for example, the release of M3 was used to assess the enzymatic phosphorylase activity against M4.

2.13. Enzyme Activity Characterization of RhMan113A

The activity, stability, and product formation of RhMan113A were characterized in triplicate enzyme incubations. The activity of RhMan113A towards the mannose containing polysaccharides galactomannan (Locust Bean Gum, Sigma-Aldrich, St. Louis, MO, USA) and glucomannan (Konjac, Low viscosity, MegaZyme, Bray, Ireland) was analyzed with the 3,5-dinitrosalicylic acid (DNS)-reducing sugar assay [18], using 84 µg/mL enzyme and 0.5% (w/v) substrate at 30 °C in 20 mM pH 6 sodium phosphate buffer and an extended time to 16 h. The specific activity assay of RhMan113A towards different MOS and GMOS was conducted by analyzing the mannose release with HPEAC–PAD, using a PA20 column after incubating enzyme (5 µg/mL) with 5 mM substrate at 30 °C in 50 mM pH 6 sodium phosphate buffer for 10 min, terminated by boiling for 5 min. For product formation, the enzyme reaction time was extended with sampling at 0, 1, 3, and 24 h, and an analysis was carried out with a PA200 HPAEC column (enzyme loading for M5 was 37 µg/mL). The sampling time for product formation from M2 and GM3 was 24 h, with analysis, using the PA20 HPAEC-column. For pH optimum, the specific activity assay was used at various pHs (50 mM buffers) and up to 30 min. Sodium citrate buffer was used for pH 4–6 and sodium phosphate buffer for pH 6–8. The protein stability was determined with the specific activity assay after incubation of the enzyme for 0, 1, 3, and 24 h at 30 °C. Michaelis–Menten kinetics was conducted by following the specific activity assay with increasing substrate concentration from 1 to 20 mM and reaction times 30 min. The KM and kcat constants were obtained by nonlinear regression of the data, using GraphPad Prism 9 software (version 9.4.1) (GraphPad Software LLC, San Diego, CA, USA).

2.14. Enzyme Activity Characterization of RhGal36A

The α-galactosidase-specific activity of RhGal36A was assayed in triplicate, using 1 mM pNP-Gal, as described by Reddy et al. [51]. The appropriately diluted enzyme was incubated with the substrate in 50 mM citrate buffer pH 6 at 37 °C for 10 min. For the determination of the pH optimum, the specific activity assay was used with buffers of varying pH (50 mM citrate buffer for pH 4–6 and 50 mM phosphate buffer for pH 6–8, duplicate incubations at each pH). The specific activity of RhGal36A with oligosaccharide substrates was assessed by studying the galactose release with HPEAC–PAD, using a PA20 column after incubating triplicate reactions of the enzyme (5 µg/mL) with 5 mM galactosylated mannotriose (GM3) at 30 °C in 50 mM sodium citrate buffer pH 5.5 for 10 min and termination by boiling for 5 min. The same setup conditions were used for HPAEC–PAD analysis of product formation when 5 mM of GM3, G2M5, or raffinose was used as the substrate, but with sampling at 0, 10, and 30 min and 24 h and using a PA200 column. Raffinose incubations were further analyzed with a PA20 column for the separation of galactose from sucrose.

3. Results

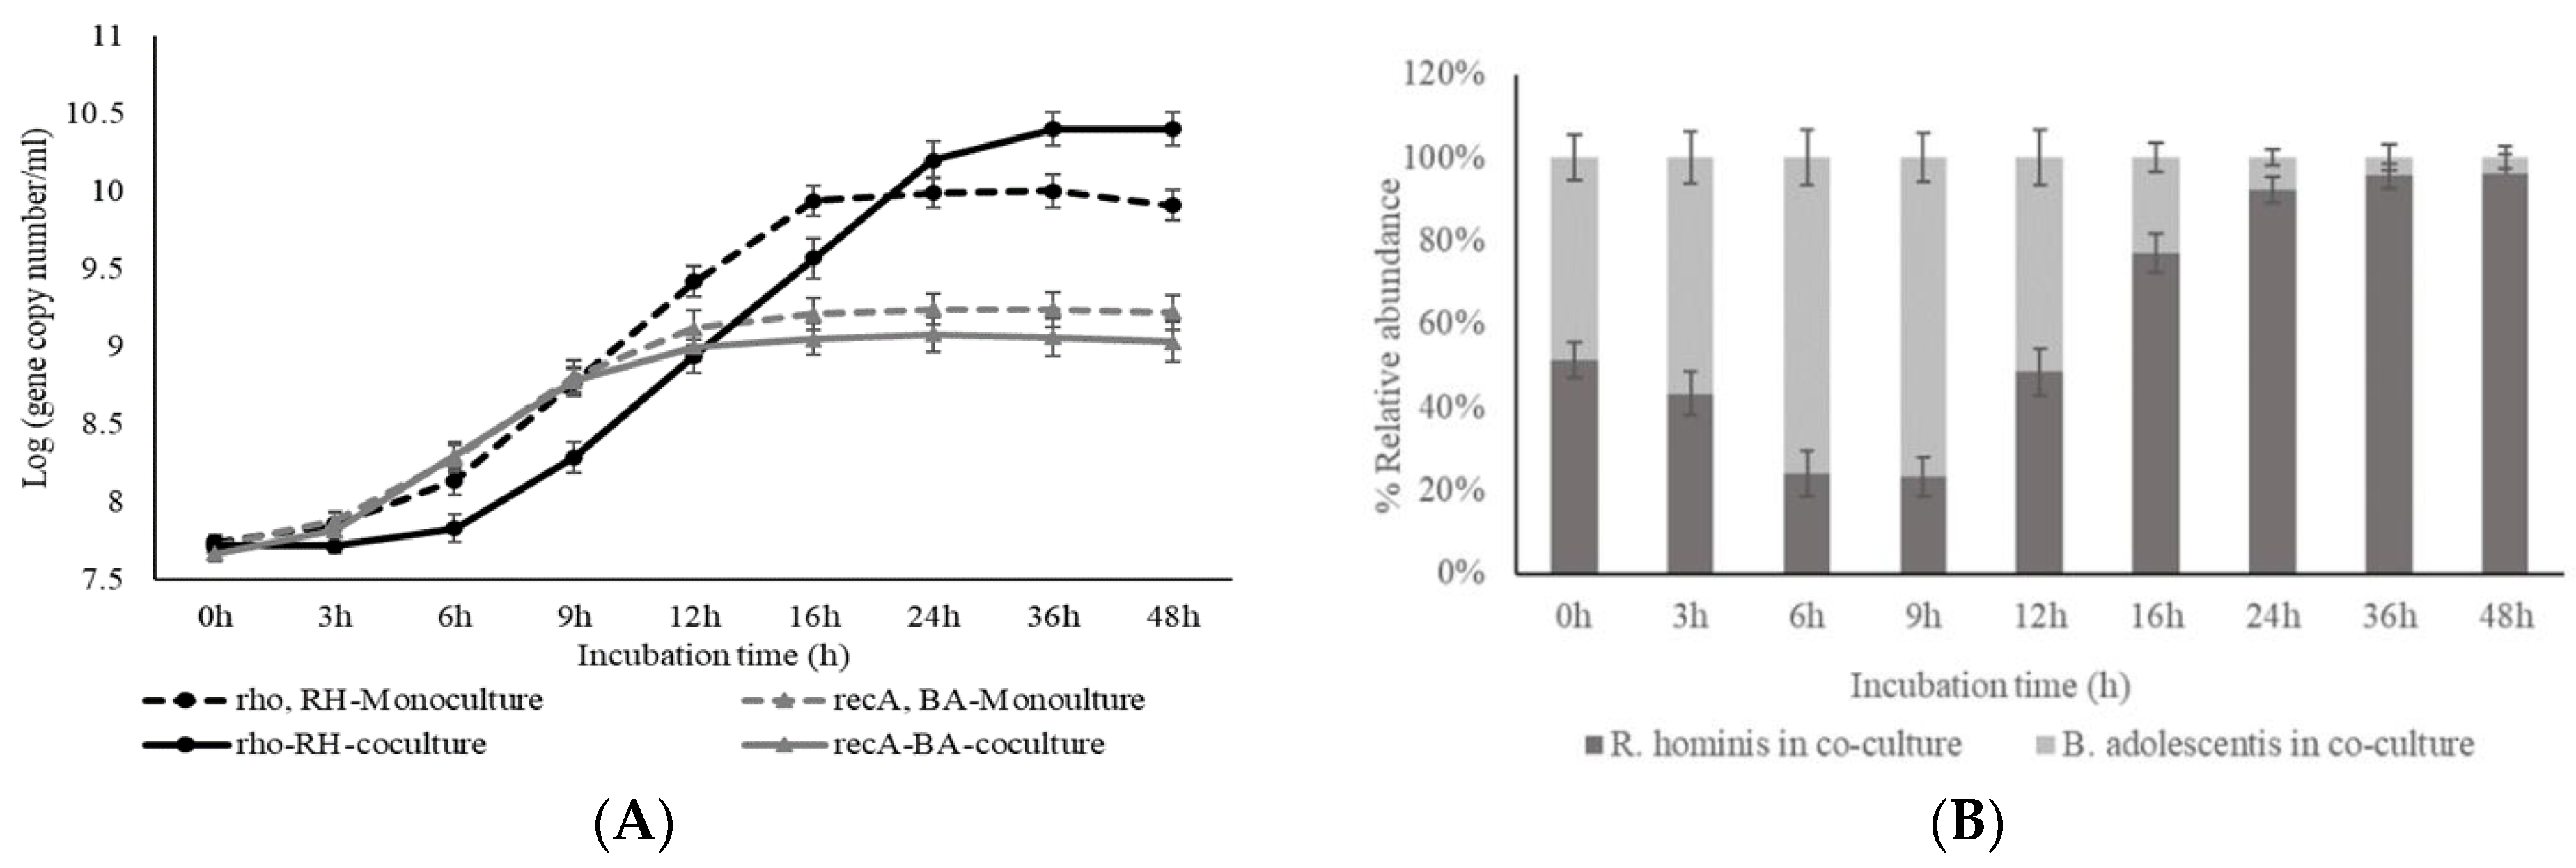
3.1. Mono- and Cocultivation of Bifidobacterium adolescentis EB1a (ATCC 15703) and Roseburia hominis A2-183 (DSMZ 16839)

3.1.1. Effect of Substrates on Bacterial Growth

The growth (OD 600 nm) of B. adolescentis and R. hominis cultivated on glucose (10 g/L) as monocultures in the presence and absence of sodium acetate (5 g/L) indicated that, as expected, R. hominis is dependent on acetate [16], but B. adolescentis is not (Supplementary Figure S1). Further studies with B. adolescentis and R. hominis were carried out by using the medium for colon bacteria (MCB, without acetate) and a modified medium for colon bacteria (mMCB, with acetate), respectively. Coculture studies were carried out in the MCB medium. The cell concentrations of R. hominis and B. adolescentis were quantified by using strain-specific quantitative PCR (qPCR) targeting the rho gene (RHOM_RS09380) and recA gene (BAD_RS05455), respectively (Figure 1A; Supplementary Figure S2A and Table S2). The growth curve of either strain during the monoculture fermentation of glucose was different compared to coculture fermentation (Supplementary Figure S2A). In monocultures, the highest cell concentration for B. adolescentis and R. hominis was determined to be 11.4 ± 0.2 log units (rho copy number mL−1) and 10.9 ± 0.1 log units (recA copy number mL−1), respectively, after 16 h of incubation (Supplementary Figure S2A). However, during cocultivation, the highest cell concentration for B. adolescentis (10.3 ± 0.1 log units) and R. hominis (10.0 ± 0.1 log units) was observed after 12 h of fermentation (Supplementary Figure S2A), which was appreciably lower compared to monocultures. This potentially indicates competition for glucose between the two strains.
When (galacto)-β-mannan-oligosaccharides (MOS/GMOSs) were used as the substrate, the growth curves of B. adolescentis in mono- and cocultures were comparable (Figure 1A), reaching similar cell concentrations after 24 h (9.1–9.2 log units). However, a slightly higher cell concentration was observed for R. hominis after 24 h in coculture compared to monoculture fermentations (Figure 1A). Notably, compared to monocultures, the growth of R. hominis is considerably slower during the first 6 h of coculture on either glucose or MOS/GMOS (Supplementary Figure S2A and Figure 1A).

3.1.2. Production of Short-Chain Fatty Acids (SCFAs) during Mono- and Cocultivation

Monocultivation of B. adolescentis on glucose resulted in the production of acetate (5.2 ± 0.5 g/L), followed by lactate (2.1 ± 0.4 g/L) and formate (0.31 ± 0.1 g/L), after 24 h (Supplementary Figure S2C). In the case of R. hominis monocultures, acetate consumption was accompanied by an appreciable production of butyrate (5.1 ± 0.4 g/L), followed by lactate (1.9 ± 0.3 g/L) and formate (1.0 ± 0.3 g/L), after 24 h (Supplementary Figure S2D).
When B. adolescentis was cultivated on MOS/GMOS, the concentration of acetate (3.7 ± 0.3 g/L) and formate (1.0 ± 0.2 g/L) increased up to 16 h and remained stable thereafter (Figure 1C); however, an increase in lactate (1.8 ± 0.2 g/L) was observed up to 9 h, followed by a significant decrease (1.1 ± 0.2 g/L) till 16 h of fermentation (Figure 1C). Such a decrease in lactate concentration was not observed when B. adolescentis was grown on glucose (Supplementary Figure S2C). Reduced lactate formation was also observed previously when B. longum was grown on arabinoxylo-oligosaccharides, and it was proposed that, for certain Bifidobacterium spp., acetate, formate, and/or ethanol are formed at lactate’s expense, possibly as a response to high energy demands during growth on complex carbohydrates [28]. During monocultivation of R. hominis on MOS/GMOS, butyrate (4.1 ± 0.3 g/L) was the major organic acid to be produced, followed by lactate (1.9 ± 0.2 g/L) and formate (1.0 ± 0.1 g/L) after 24 h of fermentation (Figure 1D).
In contrast to the monocultivation of B. adolescentis, during cocultivation with R. hominis on glucose or MOS/GMOS, a substantial decrease of acetate was observed after 9 h (Supplementary Figure S2 and Figure 1E). This phenomenon may potentially be associated with the initial dominance of B. adolescentis in coculture (Figure 1A,B and Supplementary Figure S2A,B), resulting in acetate production, which is then utilized by R. hominis (Figure 1E and Supplementary Figure S2E). This is further supported by the significant growth of R. hominis that was observed only after 3 or 6 h of cultivation on glucose (Supplementary Figure S2A) or MOS/GMOS (Figure 1A), respectively. This view is further supported by the fact that, during the fermentation of MOS/GMOS, a significant amount of butyrate was only detected in the fermentation medium after 12 h during cocultivation (Figure 1E) compared to 6 h in monocultivations (Figure 1D).

3.1.3. Effect of Cocultivation on Glucose and MOS/GMOS Consumption

To further understand the effect of cocultivation on the utilization of different carbohydrate sources, the utilization of glucose and MOS/GMOS in mono- and coculture fermentations were analyzed. The monocultivation on glucose indicated that both of the strains were able to efficiently utilize this monosaccharide (Supplementary Figure S2F) and thus would potentially compete for glucose during cocultivation. That this is the case is indicated by the disappearance of glucose within 9 h of cocultivation (Supplementary Figure S2F), along with lower growth of both strains compared to their monocultures (Supplementary Figure S2A). The utilization profile of MOS/GMOS in monocultures of B. adolescentis and R. hominis has previously been studied by us [16] and was repeated in the current study (Figure 2A,B). The results mirrored our previous findings, wherein R. hominis exhibited a preference for linear β-mannan-oligosaccharides, MOS (M2–M6), and certain galactosylated β-mannan-oligosaccharides, GMOS (GM3) [16]. B. adolescentis could internalize MOS with a degree of polymerization (DP) of 2–3 (M2–M3) and take up galactose possibly resulting from the enzymatic hydrolysis of GMOS by an extracellular α-galactosidase [16]. Interestingly, the MOS/GMOS utilization profile observed in the coculture (Figure 2C) is different when compared to monocultures of either strain (Figure 2A,B). The detection of galactose and uptake of mannobiose (M2) and mannotriose (M3) during the initial stages of coculture fermentations (0–6 h) are consistent with the profile observed for B. adolescentis monocultures, whereas the disappearance of mannotetraose (M4), mannopentaose (M5), and mannohexaose (M6) after 12 h of fermentation is not (Figure 2A). However, these M4–M6 can be utilized by R. hominis (Figure 2B) [16]. Remarkably, most of the detectable oligosaccharides disappeared from the fermentation medium in the coculture (Figure 2C) after 12 h of incubation, which was in stark contrast to monocultures of either strain (Figure 2A,B).
To understand the presence of galactose in the fermentation medium during the growth of B. adolescentis on MOS/GMOS in monoculture (Figure 2A) and in coculture (Figure 2C), we investigated the extracellular fractions for α-galactosidase activity using the pNP-α-galactopyranoside assay. A substantial amount of α-galactosidase activity (5.3–8.9 U/mL) was determined in the extracellular fractions after 6, 9, and 12 h fermentation of MOS/GMOS in B. adolescentis monoculture and during cocultivation. No α-galactosidase activity was detected in extracellular fractions of R. hominis (Supplementary Figure S3A). Moreover, after incubating the 9 h extracellular fractions from B. adolescentis and R. hominis monocultures with galactosyl-mannotriose (GM3) and di-galactosyl-mannopentaose (G2M5), galactose release was observed only with the extracellular fraction of B. adolescentis (Supplementary Figure S3B), suggesting that an extracellular α-galactosidase of B. adolescentis hydrolyzes these substrates. No β-mannosidase activity using pNP- β-mannopyranoside was detected in any of the extracellular fractions.

3.2. Role of the Locus RhMosUL and Other Genes in MOS/GMOS Utilization

To understand the mechanism behind the comparably efficient growth of R. hominis on MOS/GMOS and their utilization, we investigated the role of the putative (galacto)-β-mannan-oligosaccharides (MOS/GMOSs) utilization locus, RhMosUL, and other distal genes in the potential utilization of MOS/GMOSs.

3.2.1. Bioinformatic Analysis

Based on amino acid sequence similarity with a previously characterized β-mannan utilization locus in Roseburia intestinalis L1-82 (RiMULL) [17], putative genes encoding potential proteins involved in the utilization of MOS/GMOSs were identified to be present in the putative R. hominis MOS/GMOS utilization locus (RhMosUL, RHOM_RS11115-11180) (Figure 3A and Supplementary Table S1) with additional relevant genes for this function distributed across the genome (Figure 3B and Supplementary Table S1). The RhMosUL harbors fourteen putative genes, apparently encoding an ABC substrate-binding protein (RhMosBP), components of an ABC transporter (RhMPP1 and RhMPP2), a regulatory protein (TR), an unidentified protein, and nine putative enzymes. These predicted enzymes include a β-hexosaminidase belonging to glycoside hydrolase (GH) family 3 (RhGH3), a bifunctional protein (RhGH1-M6P) with an N-terminal β-glucosidase domain (GH1) and C terminal mannose 6-phosphate isomerase domain, two carbohydrate esterases (RhCE1 and RhCE2), a β-mannoside phosphorylase (GH130_2) (RhMOP130A), a mannosylglucose phosphorylase (GH130_1) (RhMGP130), an epimerase (RhMep), an α-galactosidase (GH36) (RhGal36A), and a phosphomannomutase (RhPmm) (Figure 3A and Supplementary Table S1). Furthermore, genes encoding a putative GH113 β-mannoside hydrolase (RhMan113A) and two other α-galactosidases belonging to GH36 (RhGal36B) and GH27 (RhGal27) were also identified elsewhere in the R. hominis A2-183 genome (Figure 3B and Supplementary Table S1). Additionally, genes predicted to encode lactate dehydrogenase (RhLDH) and butyrate CoA: acetate CoA transferase (RhBCoA) that play a key role in lactate and butyrate formation [28] were also identified in the R. hominis genome (Figure 3B and Supplementary Table S1).

3.2.2. Gene Expression Analysis, Using Reverse Transcription-Quantitative PCR (RT-qPCR)

The role of RhMosUL (five putative genes) and three other putative genes predicted to be involved in MOS/GMOS utilization was investigated based on expression analysis, using RT-qPCR. Moreover, the expression of two putative genes involved in butyric and lactic acid production was also analyzed. Therefore, for normalization of the transcriptomic data, six candidate reference genes in R. hominis were selected, and the variation in the gross expression data based on cycle threshold (CT) values were compared during growth on either glucose, mannose, galactose, or MOS/GMOS (Supplementary Table S3 and Figure S4A). These data were analyzed by four different statistical tools (Supplementary Figure S4B–E), and a comprehensive final ranking of the most stable reference genes was obtained by using RefFinder (Supplementary Figure S4F). This led to the selection of the three most stable genes, namely rho, DnaJ, and rpoB, which were used to normalize the gene expression of the target genes. Thus, the expression of 10 target genes (Figure 3C and Supplementary Table S3) in R. hominis during growth on four different substrates (glucose, galactose, mannose, and MOS/GMOS) at two different time points (9 and 12 h) was evaluated. The CT values for all the target genes analyzed after 9 and 12 h of fermentation are illustrated in Supplementary Figures S5 and S6, respectively. The five target genes which are part of the locus RhMosUL were all differentially expressed at significantly higher levels during growth on MOS/GMOS after 9 h compared to the monosaccharides (p < 0.0001) (Figure 3A,C). These genes encode RhMOP130A (RHOM_RS11135), RhMGP130 (RHOM_ RS 11140), RhMep (RHOM_ RS 11145), RhMosBP (RHOM_RS11160), and RhGal36A (RHOM_RS11175). Similarly, the gene encoding RhMan113A (RHOM_RS14610), which is not part of the RhMosUL, was also differentially expressed at a significantly higher level (Figure 3B,C). The genes coding for RhBCoA (RHOM_ RS13400) and RhLDH (RHOM_RS15885) were likewise significantly differentially expressed after 12 h of cultivation on MOS/GMOS (Figure 3B,C). Interestingly, the gene encoding RhGal36B (RHOM_RS06295) was found to be constitutively expressed during growth on all the substrates after 9 and 12 h (Supplementary Figures S5G and S6G; Figure 3) of fermentation, while the gene encoding RhGal27 (RHOM_RS05895) was not expressed (Supplementary Figures S5H and S6H; Figure 3).

3.2.3. Bioinformatic Analysis of RhMOP130A, RhMan113A, RhGal36A, and RhMosBP

Certain genes (RHOM_RS11135, RHOM_RS 11160, RHOM_RS11175, and RHOM_RS 14610) that were transcriptionally upregulated during growth on MOS/GMOS were further selected for biochemical and functional analysis of the proteins encoded by them. BLASTp analyses of the sequences of RhMOP130A, RhMan113A, RhGal36, and RhMosBP against the PDB database supported the respective putative classification and function of the respective protein (Supplementary Table S4). The top hit for RhMOP130A was a Thermotoga GH130 mannoside-phosphorylase (tm1225) acting on mannan-oligosaccharides (61.5% identity) [52]. For RhMan113A and RhGal36A, a β-1,4-mannanase (AxMan113A) from Amphibacillus xylanus (51.0%) [53] and a GH36 α-galactosidase (AgaB) from Geobacillus stearothermophilus (49.4%) [54] were the top hits, respectively (Supplementary Table S4). The top hit for RhMosBP was a mannan-oligosaccharide binding protein (BlMnBP1) of an ABC-transporter from Bifidobacterium animalis subsp. lactis ATCC 27673 [24] (Supplementary Table S4). The multiple sequence analysis with selected characterized homologs displayed the conservation of important catalytic residues in all three of the R. hominis enzymes (Supplementary Figure S7A–C). For RhMosBP, all stacking tryptophans and several other polar mannotriose interacting residues of the bifidobacterial protein were conserved (Supplementary Figure S7D). The conservation of these residues was further supported by generating a homology model of RhMosBP and superimposing it onto a crystal structure of BlMnBP1 in a complex with mannopentaose [24] (Supplementary Figure S8). This indicates that RhMosBP possibly also has a MOS-binding function and is involved in the MOS/GMOS utilization.

3.2.4. Expression and Purification of RhMOP130A, RhMan113A, and RhGal36A

To functionally investigate the predicted key enzymes involved in the initial hydrolysis of MOS/GMOS, the coding DNA sequences of RhMan113A, RhGal36A, and RhMOP130A were inserted in plasmids, equipped with codons for His-affinity tags (Supplementary Figure S9). The recombinant proteins were expressed in E. coli, purified, and analyzed by SDS–PAGE (Supplementary Figure S10A–C), resulting in bands of apparent molecular weights, agreeing with the expected molecular weights of the His-tagged proteins (38.6, 86.1, and 42.3 kDa, respectively). Analyzed by native-PAGE, RhMOP130A and RhGal36A showed bands at 232 and 346 kDa, (5.5-fold- and 4.0-fold-higher values than the respective monomer) (Supplementary Figure S10D), indicating that the proteins are hexameric and tetrameric, respectively. This is in line with previous (but not all) quaternary structures reported for GH130 [55] and GH36 enzymes [51].

3.2.5. Catalytic Properties of RhMOP130A

The activity of the predicted β-mannoside phosphorylase RhMOP130A was determined by using reverse phosphorolysis (synthesis), incubating α-mannose 1-phosphate and mannotetraose at pH 5.5. RhMOP130A was stable (>95% remaining activity) over 72 h at 37 °C and pH 5.5. At pH 6, RhMOP130A was stable (>95%) for 5 h. The activity was determined at various pH values, and the highest activity was obtained at pH 5.5, with a specific activity at 37 °C of 1.16 ± 0.11 kat/mol (Supplementary Figure S11A). Varying the acceptor saccharide, the highest specific activity was detected for M2 at 2.98 ± 0.1 kat/mol. RhMOP130A displayed no activity towards either mannose or glucose, whilst showing similar specific activity with either M3, M4, and M5 when used as the acceptor saccharide (1.1–1.4 kat/mol, respectively) (Table 1). For phosphorolysis activity, RhMOP130A was incubated (pH 6.0, 37 °C) with 10 mM phosphate and a mannan-oligosaccharide, using HPAEC for product detection (Supplementary Figure S12). No activity was detected towards M2 or without phosphate. The activity of RhMOP130A peaked against M3 at 1.02 ± 0.13 kat/mol and was notably lower against M4 and M5 (Table 1). Thus, RhMOP130A holds a preference for the same reaction complex consisting of three mannosyl units in either reaction direction (synthesis and phosphorolysis). The obtained phosphorolysis activities of RhMOP130A are of the same order of magnitude as previously characterized gut bacterial GH130 enzymes analyzed with mannobiose or β-mannan [49,56]. The activity of RhMOP130A towards MOS is in line with the activity of subfamily GH130_2 enzymes such as RaMP, with which RhMOP130A shows high identity (Supplementary Table S4), and contrasts with the specificity of GH130_1 mannoside hydrolases, which often act on shorter substrates, including mannosyl-glucose [56]. Interestingly, during HPEAC–PAD analysis of the phosphorolysis reactions, some of the generated reaction products appeared to have a higher degree of polymerization than the initial substrate (Supplementary Figure S12), indicating synthesis activity (without the addition of α-mannose 1-phosphate). When RhMOP130A was incubated with GM3 or G2M5 for phosphorolysis as above (but with extended time), no substrate consumption or product peaks were detected by HPAEC–PAD (Figure 4A and Supplementary Figure S13), suggesting that this mannan-oligosaccharide phosphorylase is inactive against galactosylated mannan-oligosaccharides, in contrast to undecorated saccharides (Table 1).

3.2.6. Catalytic Properties of RhMan113A

Guided by the homology with GH113 endo-β-mannanases (Supplementary Table S4), RhMan113A was initially incubated with polymeric β-mannans. The activity was very low, ≤0.02 katal/mol for locust bean gum galactomannan and ≤0.01 for konjac glucomannan at pH 6. Both AaManA [57] and AxMan113A [53], two previously characterized endo-acting GH113 β-mannanases, show high activity towards locust bean gum (724.2 ± 20.0 U/mg, 22.4 ± 0.21 U/mg) and konjac glucomannan (1055.7 ± 26.2 U/mg, 54.4 ± 0.66 U/mg). When M4 was used as a substrate in incubations with RhMan113A, higher activity was obtained (Table 2). At 30 °C and pH 6, RhMan113A retained 95% of its activity towards M4 after 16 h, and approx. 80% was retained after 24 h. The HPAEC–PAD analysis of M4 incubations showed the formation of the hydrolytic reaction products M1, M2, and M3, with M1 being formed initially and the main reaction product over the course of the 24 h long reaction (Figure 5A). In contrast to M3, M2 was not consumed but instead accumulated, resulting in M1 and M2 as reaction end-products (Figure 5B).
RhMan113A showed optimal activity at pH 6 (Supplementary Figure S11B). With oligosaccharides M2–M6, no detectable activity towards M2 was revealed, and M1 remained a dominant product in conversions, again ending with M1 and M2 as end-products. The specific activity (M1 formation at pH 6) was highest for M4 (10.2 ± 0.2 katal/mol), with M5 being the second most favored substrate (7.0 ± 0.1 katal/mol) (Table 2 and Supplementary Figure S14). The specific activity towards M3 was 4.9 ± 0.02 katal/mol, and for M6, it was 5.8 ± 0.4 katal/mol. No activity was detected towards GM3 (Table 2 and Figure 4B), suggesting that a non-galactosylated reducing end mannosyl unit is crucial for the hydrolytic activity of RhMan113A. RhMan113A exhibited Michaelis–Menten kinetics (Supplementary Figure S15), with the catalytic efficiency (kcat/KM) towards M4 3.1 s−1mM−1 (KM = 3.3 ± 1.1 mM, kcat = 10.2 ± 1.1 s−1), and 1.5 s−1mM−1 towards M5 (KM = 1 ± 1.8 mM, kcat = 3.2 ± 0.7 s−1) (Table 2).
The dominant release of mannose suggests that RhMan113A is an exo-oligomannosidase, an activity which, in addition to endo-mannanase, is included in GH113 [58] and observed for the homolog RiGH113 of R. intestinalis [17]. The lack of activity towards GM3, furthermore, is consistent with an attack from the reducing end, as is the case for RiGH113. However, RiGH113 slowly degraded M2, whereas RhMan113A seemingly cannot. In contrast to the endo-mannanase AxMan113A [53], the specific activity towards mannooligosaccharides of RhMan113A peaks for M4, with lower activity towards M5. A deviation that could further highlight the differences between endo- and exo-enzyme activity.

3.2.7. Catalytic Properties of RhGal36A

The specific activity of RhGal36A towards para-nitrophenyl α-galactopyranoside (pNP-Gal) was determined to be 234.7 ± 2.9 kat/mol at pH 6 (Table 3), which was also the pH-optimum (Supplementary Figure S11C). The specific activity towards galactosylated mannotriose (GM3) was 17.1 ± 0.7 katal/mol (30 °C, pH 5.5) (Table 3 and Supplementary Figure S16), which is similar to the GH36 α-galactosidase BoGal36A of the mannan utilization locus of Bacteroides ovatus [51]. The RhGal36A product profiles of GM3 and G2M5 show the reaction progressions and the galactose removal over time (Supplementary Figure S16A,B). After 24 h, the α-galactose substituents of both substrates were fully removed, leaving galactose and undigested M3 and M5 as reaction end-products. The digestion of raffinose generated detectable amounts of galactose and sucrose first after 24 h (Supplementary Figure S16C,D), indicating that RhGal36A may be optimized for GMOS rather than raffinose. Thus, RhGal36A could not only release terminal galactose substituents from galactosylated mannotriose and raffinose, but also internal galactose units from di-galactosylated mannopentaose (Table 3). The latter property is commonly observed for GH27 α-galactosidases [59] but only rarely observed for GH36 α-galactosidases [51], including the corresponding R. intestinalis GH36 α-galactosidase [17]. The capacity of RhGal36A to release galactosyl units from galactosylated mannotriose would make the remaining saccharide accessible for the herein characterized mannan-oligosaccharide phosphorylase RhMOP130A and the suggested exo-β-oligomannosidase RhMan113A, since these enzymes appear to be restricted by galactose substituents in the substrate (Figure 4).

4. Discussion

The differential in vitro utilization of (galacto)-β-mannan-oligosaccharides (MOS/GMOSs) during monocultivation by two potentially health-promoting gut bacteria, B. adolescentis and R. hominis, was demonstrated by Bhattacharya et al. [16] and laid the foundation for the current study. Herein, we tested our hypothesis that cross-feeding and metabolic interactions occur between B. adolescentis and R. hominis during growth on MOS/GMOSs, and this is supported by the significantly lower acetate concentrations during cocultivation on MOS/GMOSs (Figure 1E) compared to B. adolescentis monocultures (Figure 1C). The gut microbiome’s interaction can be both competitive and cooperative, including substrate and metabolite cross-feeding [22]. Some cocultivation studies involving dietary fibers such as inulin, xylan, and pectin have exemplified the cross-feeding of short-chain fatty acids (SCFAs) between different gut bacteria [23,60]. Notably, the importance of cross-feeding, particularly of acetate between bifidobacteria and butyrate producers, has been reported for the growth on inulin-type fructans [61] and arabinoxylo-oligosaccharides [28]. Our study expands the understanding and the potential prebiotic application of MOS/GMOSs as bifidogenic and butyrogenic agents and contributes to further insight into acetate sharing among Bifidobacterium spp. and Roseburia spp., using MOS/GMOSs.
In previous studies [16,41] and as reported in this study, acetate is essential for the growth of R. hominis (Supplementary Figure S1). Since the cocultures do not contain any external acetate source, the growth of R. hominis is dependent on the acetate provided by B. adolescentis. This is clearly reflected during cocultivation on MOS/GMOS since the increase in cell concentration of R. hominis was observed only after 6 h, which was accompanied by a substantial decrease in acetate concentrations in cocultures compared to monocultures of B. adolescentis (Figure 1). Similar results were observed during the growth on glucose (Supplementary Figure S2).
Interestingly, the growth of B. adolescentis in coculture fermentation of MOS/GMOS remains unaffected when compared to monoculture fermentations (Figure 1A), even though R. hominis becomes the more abundant strain in coculture after 12 h of incubation (Figure 1A,B). A possible explanation could be that, although mannobiose (M2) and mannotriose (M3) can be utilized by both strains, the initial relative abundance of B. adolescentis in the coculture (0–6 h) (Figure 1B) most likely allows it to utilize most of the available M2 and M3 before R. hominis starts competing for these oligosaccharides, due to the acetate dependence of this strain as discussed above.
The cocultures indicate faster and more comprehensive utilization of MOS/GMOS when compared to the selective utilization by either strain in monocultures (Figure 2). As a concrete example of differential and non-competitive utilization of MOS/GMOS in cocultures is the fact that only R. hominis can utilize linear β-mannan-oligosaccharides (MOS) longer than M3, including mannotetraose (M5), mannopentaose (M5), and mannohexaose (M6) (Figure 2B), and it is, therefore, likely responsible for their utilization in coculture (Figure 2C). Interestingly, R. hominis seems to benefit from the extracellular α-galactosidase activity of B. adolescentis (Supplementary Figure S3), which appears to result in the formation of linear β-mannan-oligosaccharides from galactosylated β-mannan-oligosaccharides (GMOSs) (Figure 2C). The benefit to R. hominis is substantiated by the fact that a higher cell concentration of R. hominis was determined during coculture compared to monoculture fermentation of MOS/GMOS (Figure 1A). Furthermore, the butyrate production was also clearly (20%) higher in coculture compared to the monoculture of R. hominis (Figure 1D,E).
These results, along with the fact that near complete utilization of detectable MOS/GMOS occurs during cocultivation (Figure 2C), lead us to suggest that the differential utilization of MOS/GMOS by B. adolescentis and R. hominis is an important element in their successful coexistence. This is in stark contrast to the coculture fermentation of glucose, wherein the cell concentration of both R. hominis and B. adolescentis were significantly lower compared to their monoculture fermentations (Supplementary Figure S2A), indicating competition for the same substrate. The results of this study provide strong support for our hypothesis regarding cross-feeding and metabolic interactions between the R. hominis and B. adolescentis during coculture fermentation of MOS/GMOS. Thus, our study describes cross-feeding from B. adolescentis to R. hominis. Unidirectional cross-feeding in general seems to be important and prevalent in gut bacteria [62].
Both monoculture and coculture studies strongly indicated that R. hominis is better adapted to MOS/GMOS utilization compared to B. adolescentis (Figure 1A), and this could be attributed to the presence of a dedicated MOS/GMOS utilization locus (RhMosUL) in R. hominis (Figure 3A). To further understand the role of RhMosUL in MOS/GMOS utilization, a gene expression analysis was undertaken during the fermentation of MOS/GMOS by R. hominis. The importance of RhMosUL in MOS/GMOS utilization was reflected by the significant transcriptional upregulation of genes encoding for RhMosBP, RhMOP130A, RhMOP130, RhMep, and RhGal36A belonging to the RhMosUL after 9 h of fermentation (Figure 3A,C). Furthermore, significant upregulation of the gene encoding RhMan113A, which is not part of the RhMosUL, was also observed after 9 h of fermentation (Figure 3). The upregulation of these genes and the predicted protein functions are consistent with significant roles in the uptake and utilization of MOS with a degree of polymerization (DP) of 2–3, along with galactosyl mannotriose (GM3) (Figure 2). Furthermore, a high level of expression of the genes encoding for RhLDH and RhBCoA after 12 h of MOS/GMOS fermentation was in accordance with the significant production of lactate and butyrate, respectively (Figure 1D and Figure 3C).
In this context, the present study not only throws light on the role of RhMosUL but also on the enzymatic machinery during the utilization of MOS/GMOS through the biochemical characterization of three enzymes, namely RhMOP130A, RhMan113A, and RhGal36A. The genes encoding these enzymes were found to be transcriptionally upregulated during growth on MOS/GMOS (Figure 3) and indeed most likely play an important role in the initial hydrolysis of MOS/GMOS in R. hominis. The characterization of proteins encoded by RhMosUL further elucidates the mechanism of MOS/GMOS utilization by R. hominis. The characterization clearly displays functions that align with the uptake and utilization of MOS/GMOS. Sequence analysis (Supplementary Figure S7D) and homology modeling (Supplementary Figure S8) support that RhMosBP is a MOS/GMOS binding protein of an ABC-transporter system [24]. The co-expression of the distal RhMan113A gene with RhMosUL genes and its functional characterization suggest that the role of this enzyme is to act together with RhMosUL-encoded enzymes in the conversion of MOS. This contrasts with the homologous RiGH113 with similar catalytic properties, but which is encoded within the mannan-utilization locus of R. intestinalis [17] and underlines that the enzymes encoded by saccharide-utilization loci may act in synergy with distally expressed enzymes. The carbohydrate utilization data demonstrate that MOS with DP up to 6 is utilized by R. hominis (in contrast to B. adolescentis which does not utilize M4–M6) (Figure 2). This is consistent with the catalytic specificities of RhMan113A and RhMOP130A. The hydrolytic exo-oligomannosidase RhMan113A acts on M3-M6 and shows the highest catalytic capability towards M4 (Table 2). In contrast to RiGH113 [17], it is inactive towards M2. The mannan-oligosaccharide phosphorylase RhMOP130A is active on the MOS with DP 3–6, with a slight preference for M3 (Table 1). Although GM3 is utilized by R. hominis (Figure 2B), both RhMan113A and RhMOP130A are hindered by galactosyl side groups carried by mannan-oligosaccharides (Figure 4). However, the α-galactosidase RhGal36A was shown to de-galactosylate GM3 and G2M5 (Table 3), and it is highly likely that this enzyme acts in sequential synergy with RhMan113A and/or RhMOP130A, generating linear saccharides for them, in a similar fashion as observed with some other α-galactosidases, such as BoGal36A in the mannan polysaccharide utilization locus (PUL) from Ba. ovatus [18], RiGH36 in RiMULL from R. intestinalis L1-82 [17], and FpGH36 in FpMULL from Faecalibacterium prausnitzii SL3/3 [15].
Thus, neither of the characterized GH130 or GH113 enzymes convert mannobiose, which may be converted to mannosyl-glucose by the predicted epimerase RhMep, encoded from RhMosUL, and transcriptionally upregulated during growth on the MOS/GMOS (Figure 3), in accordance with the β-mannan and MOS/GMOS utilization pathway characterized in R. intestinalis [17] and F. prausnitzii [15]. Furthermore, the mannosyl glucose could be converted by the similarly upregulated RhMGP130, a predicted subfamily GH130_1 mannosyl glucose phosphorylase (Figure 3), as suggested in the above pathways, completing the conversion to monosugar and monosugar phosphate. A model for uptake and catabolism of MOS/GMOS by R. hominis A2-183 is presented in Figure 6.
Our study sheds light on part of a possible mechanism for polysaccharide and oligosaccharide utilization among certain gut bacteria. We used a β-mannanase, BoMan26B from Bacteroides ovatus, to produce MOS/GMOS [16], which, in turn, was used as an oligosaccharide carbon source in this study. Notably, while Ba. ovatus is considered a primary degrader of many polysaccharides [22,23], B. adolescentis and R. hominis have been suggested to be secondary degraders, particularly for xylan and mannan [16,41]. Recent studies have highlighted the beneficial role of butyrate-producing gut bacteria [7] and underlined the potential role of R. intestinalis as a primary degrader of mannan [17] and R. hominis as a secondary degrader ([16], this study).
β-Mannans are naturally occurring polysaccharides that are commonly found in the human diet [12]. Logically, genomic analysis has indicated that β-mannan metabolism is prevalent within human gut microbiota [14]. This is further substantiated by the presence of the β-mannan polysaccharide utilization locus in Ba. ovatus, and Ba. fragilis [18,20], along with the recent identification of β-mannan utilization loci (RiMULs) in R. intestinalis [17] and Faecalibacterium prausnitzi [15]. In this context, our study extends our understanding of β-mannan utilization by gut bacteria and highlights the role of R. hominis as an efficient secondary degrader of MOS/GMOS characterized by the presence of a dedicated MOS/GMOS utilization locus (RhMosUL), along with a distally encoded exo-β-oligomannosidase.

5. Conclusions

In conclusion, microbiological, transcriptional, and biochemical analyses suggest that R. hominis A2-183 harbors a comprehensive apparatus for the utilization of MOS/GMOSs. This is in line with coculture studies involving B. adolescentis, wherein the ability to utilize a wide range of MOSs allows R. hominis to eventually become the more abundant strain, even though during the initial phase, growth is limited due to its dependence on acetate, which is provided by B. adolescentis. Moreover, the characterization of RhMosUL-encoded RhGal36A and RhMOP130A and distally encoded RhMan113A indicated a synergistic action of these enzymes for initial internal hydrolysis of MOS/GMOSs, and this is substantiated by their simultaneous transcriptional upregulation during growth on MOS/GMOSs.
Overall, our study highlights the differential utilization of MOS/GMOSs and metabolite cross-feeding interactions between two health-promoting gut bacteria B. adolescentis, and R. hominis. Considering the complexity of the gut microbiome and competition for nutrients in the gut, our findings can contribute to the design of customized prebiotics, probiotics, and/or synbiotics for improving overall health by selective manipulation of gut microbiota.

Supplementary Materials

The following supporting information can be downloaded at https://www.mdpi.com/article/10.3390/microorganisms10122496/s1. Table S1: Amino acid sequence similarity between R. hominis target proteins involved in this study with R. intestinalis and predicted functional annotation and localization of R. hominis proteins. Table S2: Primers designed and used in this study for quantitative PCR analysis (qPCR) in analysis of population dynamics. Table S3: Primers designed and used in this study for RT-qPCR analyses of reference and target genes in Roseburia hominis A2-183. Figure S1: Growth of Roseburia hominis (RH) and Bifidobacterium adolescentis (BA) on glucose (10 g/L) as mono- and coculture in the presence and absence of sodium acetate (5 g/L). Figure S2: Monitoring the growth, production of short-chain fatty acids (SCFAs) and glucose consumption during cultivation on glucose, as monoculture for Bifidobacterium adolescentis, BA (A, C, and F), Roseburia hominis, RH (A, D, and F), and as coculture (A, B, E, and F). Figure S3: Determining the extracellular (Ex) α-galactosidase activity in B. adolescentis (BA) and R. hominis (RH). Figure S4: Expression of reference genes and analysis of their stability in R. hominis. Figure S5: Expression data represented as cycle threshold (CT) values determined by using RT-qPCR for analysis of target genes during cultivation of R. hominis after 9 h of incubation. Figure S6: Expression data represented as cycle threshold (CT) values determined by using RT-qPCR for analysis of target genes during cultivation of R. hominis after 12 h of incubation. Table S4: Top 3 BLASTp results for selected MOS/GMOS utilization locus, RhMosUL, encoded protein sequences against the Protein Data Bank (PDB). Figure S7: Multiple Sequence Alignment (MSA) with selected R. hominis protein sequences, R. intestinalis homologs and proteins obtained by the BLASTp search of the PDB database, as mentioned in Table S4. Figure S8: Predicted mannan-oligosaccharide binding site of homology model generated for RhMosBP, using BlMnBP1 (pdb: 6I5R) as a template. Figure S9: The amino acid sequences of the studied protein constructs (A) RhMOP130A, (B) RhMan113A, and (C) RhGal36A. Figure S10: Protein analysis by polyacrylamide gel electrophoresis. Figure S11: The effect of pH on enzyme activity. Figure S12: RhMOP130A incubated with different mannan-oligosaccharides analyzed by HPAEC. Figure S13: RhMOP130A incubated with G2M5 analyzed on a PA200 column, using HPAEC–PAD. Figure S14: HPEAC–PAD (PA20 column) analysis of the mannose release when RhMan113A (5 µg/mL) was incubated with 5 mM mannan-oligosaccharides. Figure S15: Michaelis–Menten kinetics of RhMan113A. Figure S16: Galactose release by RhGal36A when incubated with galactose-containing substrates. Supplementary text.

Author Contributions

A.B. designed and performed experiments, analyzed, and interpreted data and wrote the manuscript; L.M. planned and performed experiments, analyzed and interpreted data, and contributed to the writing of the manuscript; S.B. planned and performed experiments, analyzed data, and contributed to writing part of the manuscript; M.W. planned and performed experiments, analyzed data, and edited the manuscript; K.S. provided advice on experimental design, critically discussed data, and edited manuscript; P.V. provided advice on experimental design, critically discussed data, and edited manuscript; O.V.A. critically discussed data and edited manuscript; E.W.J.V.N. critically discussed data and edited manuscript; H.S. provided advice and supervision on experimental design and execution, critically discussed data, co-wrote the manuscript, and secured funding. All authors have read and agreed to the published version of the manuscript.

Funding

This work was financed by Formas (942-2016-117) and the Swedish Research Council (2019-05605). AB is grateful to Lawski’s foundation for the financial support.

Data Availability Statement

Data is contained within the article or Supplementary Materials.

Acknowledgments

Kristina Sjöström is thanked for her technical assistance on some experiments.

Conflicts of Interest

The authors declare no conflict of interest.

References

  1. Ndeh, D.; Gilbert, H.J. Biochemistry of Complex Glycan Depolymerisation by the Human Gut Microbiota. FEMS Microbiol. Rev. 2018, 42, 146–164. [Google Scholar] [CrossRef] [PubMed]
  2. Hou, K.; Wu, Z.X.; Chen, X.Y.; Wang, J.Q.; Zhang, D.; Xiao, C.; Zhu, D.; Koya, J.B.; Wei, L.; Li, J.; et al. Microbiota in Health and Diseases. Signal Transduct. Target. Ther. 2022, 7, 135. [Google Scholar] [CrossRef] [PubMed]
  3. Desai, M.S.; Seekatz, A.M.; Koropatkin, N.M.; Kamada, N.; Hickey, C.A.; Wolter, M.; Pudlo, N.A.; Kitamoto, S.; Terrapon, N.; Muller, A.; et al. A Dietary Fiber-Deprived Gut Microbiota Degrades the Colonic Mucus Barrier and Enhances Pathogen Susceptibility. Cell 2016, 167, 1339–1353.e21. [Google Scholar] [CrossRef] [PubMed]
  4. David, L.A.; Maurice, C.F.; Carmody, R.N.; Gootenberg, D.B.; Button, J.E.; Wolfe, B.E.; Ling, A.V.; Devlin, A.S.; Varma, Y.; Fischbach, M.A.; et al. Diet Rapidly and Reproducibly Alters the Human Gut Microbiome. Nature 2014, 505, 559–563. [Google Scholar] [CrossRef] [PubMed]
  5. De Vos, W.M.; Tilg, H.; Van Hul, M.; Cani, P.D. Gut Microbiome and Health: Mechanistic Insights. Gut 2022, 71, 1020–1032. [Google Scholar] [CrossRef]
  6. Chen, Y.; Zhou, J.; Wang, L. Role and Mechanism of Gut Microbiota in Human Disease. Front. Cell. Infect. Microbiol. 2021, 11, 1–12. [Google Scholar] [CrossRef]
  7. Xu, T.; Wu, X.; Liu, J.; Sun, J.; Wang, X.; Fan, G.; Meng, X.; Zhang, J.; Zhang, Y. The Regulatory Roles of Dietary Fibers on Host Health via Gut Microbiota-Derived Short Chain Fatty Acids. Curr. Opin. Pharmacol. 2022, 62, 36–42. [Google Scholar] [CrossRef]
  8. Wei, J.; Xiang, L.; Li, X.; Song, Y.; Yang, C.; Ji, F.; Chung, A.C.K.; Li, K.; Lin, Z.; Cai, Z. Derivatization Strategy Combined with Parallel Reaction Monitoring for the Characterization of Short-Chain Fatty Acids and Their Hydroxylated Derivatives in Mouse. Anal. Chim. Acta 2020, 1100, 66–74. [Google Scholar] [CrossRef]
  9. Warne, R.W.; Kirschman, L.; Zeglin, L. Manipulation of Gut Microbiota during Critical Developmental Windows Affects Host Physiological Performance and Disease Susceptibility across Ontogeny. J. Anim. Ecol. 2019, 88, 845–856. [Google Scholar] [CrossRef]
  10. Jana, U.K.; Kango, N.; Pletschke, B. Hemicellulose-Derived Oligosaccharides: Emerging Prebiotics in Disease Alleviation. Front. Nutr. 2021, 8, 1–13. [Google Scholar] [CrossRef]
  11. Kolodziejczyk, A.A.; Zheng, D.; Elinav, E. Diet–Microbiota Interactions and Personalized Nutrition. Nat. Rev. Microbiol. 2019, 17, 742–753. [Google Scholar] [CrossRef] [PubMed]
  12. Singh, S.; Singh, G.; Arya, S.K. Mannans: An Overview of Properties and Application in Food Products. Int. J. Biol. Macromol. 2018, 119, 79–95. [Google Scholar] [CrossRef] [PubMed]
  13. Scheller, H.V.; Ulvskov, P. Hemicelluloses. Annu. Rev. Plant Biol. 2010, 61, 263–289. [Google Scholar] [CrossRef] [PubMed]
  14. Lloyd-Price, J.; Mahurkar, A.; Rahnavard, G.; Crabtree, J.; Orvis, J.; Hall, A.B.; Brady, A.; Creasy, H.H.; McCracken, C.; Giglio, M.G.; et al. Strains, Functions and Dynamics in the Expanded Human Microbiome Project. Nature 2017, 550, 61–66. [Google Scholar] [CrossRef]
  15. Lindstad, L.J.; Lo, G.; Leivers, S.; Lu, Z.; Michalak, L.; Pereira, G.V.; Røhr, Å.K.; Martens, E.C.; McKee, L.S.; Louis, P.; et al. Human Gut Faecalibacterium prausnitzii Deploys a Highly Efficient Conserved System to Cross-Feed on b-Mannan derived Oligosaccharides. MBio 2021, 12, 1–18. [Google Scholar] [CrossRef]
  16. Bhattacharya, A.; Wiemann, M.; Stålbrand, H. β-Mannanase BoMan26B from Bacteroides ovatus Produces Mannan-Oligosaccharides with Prebiotic Potential from Galactomannan and Softwood β-Mannans. LWT 2021, 151, 112215. [Google Scholar] [CrossRef]
  17. La Rosa, S.L.; Leth, M.L.; Michalak, L.; Hansen, M.E.; Pudlo, N.A.; Glowacki, R.; Pereira, G.; Workman, C.T.; Arntzen, M.; Pope, P.B.; et al. The Human Gut Firmicute Roseburia intestinalis Is a Primary Degrader of Dietary β-Mannans. Nat. Commun. 2019, 10, 1–14. [Google Scholar] [CrossRef]
  18. Bagenholm, V.; Reddy, S.K.; Bouraoui, H.; Morrill, J.; Kulcinskaja, E.; Bahr, C.M.; Aurelius, O.; Rogers, T.; Xiao, Y.; Logan, D.T.; et al. Galactomannan Catabolism Conferred by a Polysaccharide Utilization Locus of Bacteroides ovatus: Enzyme Synergy and Crystal Structure of a β-Mannanase. J. Biol. Chem. 2017, 292, 229–243. [Google Scholar] [CrossRef]
  19. Bågenholm, V.; Wiemann, M.; Reddy, S.K.; Bhattacharya, A.; Rosengren, A.; Logan, D.T.; Stålbrand, H. A Surface-Exposed GH26 -Mannanase from Bacteroides ovatus: Structure, Role, and Phylogenetic Analysis of BoMan26B. J. Biol. Chem. 2019, 294, 9100–9117. [Google Scholar] [CrossRef]
  20. Senoura, T.; Ito, S.; Taguchi, H.; Higa, M.; Hamada, S.; Matsui, H.; Ozawa, T.; Jin, S.; Watanabe, J.; Wasaki, J.; et al. New Microbial Mannan Catabolic Pathway That Involves a Novel Mannosylglucose Phosphorylase. Biochem. Biophys. Res. Commun. 2011, 408, 701–706. [Google Scholar] [CrossRef]
  21. Tamura, K.; Brumer, H. Glycan Utilization Systems in the Human Gut Microbiota: A Gold Mine for Structural Discoveries. Curr. Opin. Struct. Biol. 2021, 68, 26–40. [Google Scholar] [CrossRef] [PubMed]
  22. Briggs, J.A.; Grondin, J.M.; Brumer, H. Communal Living: Glycan Utilization by the Human Gut Microbiota. Environ. Microbiol. 2021, 23, 15–35. [Google Scholar] [CrossRef] [PubMed]
  23. Shetty, S.A.; Kuipers, B.; Atashgahi, S.; Aalvink, S.; Smidt, H.; de Vos, W.M. Inter-Species Metabolic Interactions in an In-Vitro Minimal Human Gut Microbiome of Core Bacteria. NPJ Biofilms Microbiomes 2022, 8, 1–13. [Google Scholar] [CrossRef]
  24. Ejby, M.; Guskov, A.; Pichler, M.J.; Zanten, G.C.; Schoof, E.; Saburi, W.; Slotboom, D.J.; Abou Hachem, M. Two Binding Proteins of the ABC Transporter That Confers Growth of Bifidobacterium animalis subsp. lactis ATCC27673 on β-Mannan Possess Distinct Manno-Oligosaccharide-Binding Profiles. Mol. Microbiol. 2019, 112, 114–130. [Google Scholar] [CrossRef] [PubMed]
  25. Coyte, K.Z.; Rakoff-Nahoum, S. Understanding Competition and Cooperation within the Mammalian Gut Microbiome. Curr. Biol. 2019, 29, R538–R544. [Google Scholar] [CrossRef] [PubMed]
  26. Patterson, A.M.; Mulder, I.E.; Travis, A.J.; Lan, A.; Cerf-Bensussan, N.; Gaboriau-Routhiau, V.; Garden, K.; Logan, E.; Delday, M.I.; Coutts, A.G.P.; et al. Human Gut Symbiont Roseburia hominis Promotes and Regulates Innate Immunity. Front. Immunol. 2017, 8, 1–14. [Google Scholar] [CrossRef]
  27. Guo, Y.; Xie, J.P.; Deng, K.; Li, X.; Yuan, Y.; Xuan, Q.; Xie, J.; He, X.M.; Wang, Q.; Li, J.J.; et al. Prophylactic Effects of Bifidobacterium adolescentis on Anxiety and Depression-like Phenotypes after Chronic Stress: A Role of the Gut Microbiota-Inflammation Axis. Front. Behav. Neurosci. 2019, 13, 126. [Google Scholar] [CrossRef]
  28. Rivière, A.; Gagnon, M.; Weckx, S.; Roy, D.; Vuyst, L. De Mutual Cross-Feeding Interactions between Bifidobacterium longum subsp. longum NCC2705 and Eubacterium rectale ATCC 33656. Appl. Environ. Microbiol. 2015, 81, 7767–7781. [Google Scholar] [CrossRef]
  29. Rios-Covian, D.; Gueimonde, M.; Duncan, S.H.; Flint, H.J.; De Los Reyes-Gavilan, C.G. Enhanced Butyrate Formation by Cross-Feeding between Faecalibacterium prausnitzii and Bifidobacterium adolescentis. FEMS Microbiol. Lett. 2015, 362, 1–7. [Google Scholar] [CrossRef]
  30. Ghosh, S.; Pramanik, S. Structural Diversity, Functional Aspects and Future Therapeutic Applications of Human Gut Microbiome. Arch. Microbiol. 2021, 203, 5281–5308. [Google Scholar] [CrossRef]
  31. Clark, K.; Karsch-Mizrachi, I.; Lipman, D.J.; Ostell, J.; Sayers, E.W. GenBank. Nucleic Acids Res. 2016, 44, D67–D72. [Google Scholar] [CrossRef]
  32. Gasteiger, E. ExPASy: The Proteomics Server for in-Depth Protein Knowledge and Analysis. Nucleic Acids Res. 2003, 31, 3784–3788. [Google Scholar] [CrossRef] [PubMed]
  33. Teufel, F.; Almagro Armenteros, J.J.; Johansen, A.R.; Gíslason, M.H.; Pihl, S.I.; Tsirigos, K.D.; Winther, O.; Brunak, S.; von Heijne, G.; Nielsen, H. SignalP 6.0 Predicts All Five Types of Signal Peptides Using Protein Language Models. Nat. Biotechnol. 2022, 40, 1023–1025. [Google Scholar] [CrossRef] [PubMed]
  34. Waterhouse, A.; Bertoni, M.; Bienert, S.; Studer, G.; Tauriello, G.; Gumienny, R.; Heer, F.T.; De Beer, T.A.P.; Rempfer, C.; Bordoli, L.; et al. SWISS-MODEL: Homology Modelling of Protein Structures and Complexes. Nucleic Acids Res. 2018, 46, W296–W303. [Google Scholar] [CrossRef]
  35. Williams, C.J.; Headd, J.J.; Moriarty, N.W.; Prisant, M.G.; Videau, L.L.; Deis, L.N.; Verma, V.; Keedy, D.A.; Hintze, B.J.; Chen, V.B.; et al. MolProbity: More and Better Reference Data for Improved All-Atom Structure Validation. Protein Sci. 2018, 27, 293–315. [Google Scholar] [CrossRef]
  36. Laskowski, R.A.; MacArthur, M.W.; Moss, D.S.; Thornton, J.M. PROCHECK: A Program to Check the Stereochemical Quality of Protein Structures. J. Appl. Crystallogr. 1993, 26, 283–291. [Google Scholar] [CrossRef]
  37. Untergasser, A.; Cutcutache, I.; Koressaar, T.; Ye, J.; Faircloth, B.C.; Remm, M.; Rozen, S.G. Primer3—New Capabilities and Interfaces. Nucleic Acids Res. 2012, 40, e115. [Google Scholar] [CrossRef]
  38. Whelan, J.A.; Russell, N.B.; Whelan, M.A. A Method for the Absolute Quantification of CDNA Using Real-Time PCR. J. Immunol. Methods 2003, 278, 261–269. [Google Scholar] [CrossRef] [PubMed]
  39. Byrne, E.; Björkmalm, J.; Bostick, J.P.; Sreenivas, K.; Willquist, K.; van Niel, E.W.J. Characterization and Adaptation of Caldicellulosiruptor Strains to Higher Sugar Concentrations, Targeting Enhanced Hydrogen Production from Lignocellulosic Hydrolysates. Biotechnol. Biofuels 2021, 14, 1–14. [Google Scholar] [CrossRef] [PubMed]
  40. Bhattacharya, A.; Butler, S.; Al-Rudainy, B.; Wallberg, O.; Stålbrand, H. Enzymatic Conversion of Different Qualities of Refined Softwood Hemicellulose Recovered from Spent Sulfite Liquor. Molecules 2022, 27, 3207. [Google Scholar] [CrossRef]
  41. Bhattacharya, A.; Ruthes, A.; Vilaplana, F.; Karlsson, E.N.; Adlecreutz, P.; Stålbrand, H. Enzyme Synergy for the Production of Arabinoxylo-Oligosaccharides from Highly Substituted Arabinoxylan and Evaluation of Their Prebiotic Potential. LWT 2020, 131, 109762. [Google Scholar] [CrossRef]
  42. Pfaffl, M.W.; Tichopad, A.; Prgomet, C.; Neuvians, T.P. Determination of Stable Housekeeping Genes, Differentially Regulated Target Genes and Sample Integrity: BestKeeper–Excel-Based Tool Using Pair-Wise Correlations. Biotechnol. Lett. 2004, 26, 509–515. [Google Scholar] [CrossRef] [PubMed]
  43. Andersen, C.L.; Jensen, J.L.; Ørntoft, T.F. Normalization of Real-Time Quantitative Reverse Transcription-PCR Data: A Model-Based Variance Estimation Approach to Identify Genes Suited for Normalization, Applied to Bladder and Colon Cancer Data Sets. Cancer Res. 2004, 64, 5245–5250. [Google Scholar] [CrossRef] [PubMed]
  44. Vandesompele, J.; De Preter, K.; Pattyn, F.; Poppe, B.; Van Roy, N.; De Paepe, A.; Speleman, F. Accurate Normalization of Real-Time Quantitative RT-PCR Data by Geometric Averaging of Multiple Internal Control Genes. Genome Biol. 2002, 3, 1–12. [Google Scholar] [CrossRef] [PubMed]
  45. Silver, N.; Best, S.; Jiang, J.; Thein, S.L. Selection of Housekeeping Genes for Gene Expression Studies in Human Reticulocytes Using Real-Time PCR. BMC Mol. Biol. 2006, 7, 1–9. [Google Scholar] [CrossRef] [PubMed]
  46. Xie, F.; Xiao, P.; Chen, D.; Xu, L.; Zhang, B. MiRDeepFinder: A MiRNA Analysis Tool for Deep Sequencing of Plant Small RNAs. Plant Mol. Biol. 2012, 80, 75–84. [Google Scholar] [CrossRef]
  47. Pfaffl, M.W. Quantification Strategies in Real-Time Polymerase Chain Reaction. In Polymerase Chain Reaction: Theory and Technology; Caister Academic Press: Norfolk, UK, 2019. [Google Scholar]
  48. Morrill, J.; Kulcinskaja, E.; Sulewska, A.M.; Lahtinen, S.; Stålbrand, H. Bifidobacterium animalis subsp. lactis Bl-04 Possesses a Low-Affinity Mannan-Binding Module and Highlights the Diversity of Mannanolytic Enzymes. BMC Biochem. 2015, 16, 1–12. [Google Scholar] [CrossRef]
  49. Ladevéze, S.; Tarquis, L.; Cecchini, D.A.; Bercovici, J.; André, I.; Topham, C.M.; Morel, S.; Laville, E.; Monsan, P.; Lombard, V.; et al. Role of Glycoside Phosphorylases in Mannose Foraging by Human Gut Bacteria. J. Biol. Chem. 2013, 288, 32370–32383. [Google Scholar] [CrossRef]
  50. Li, A.; Benkoulouche, M.; Ladeveze, S.; Durand, J.; Cioci, G.; Laville, E.; Potocki-Veronese, G. Discovery and Biotechnological Exploitation of Glycoside-Phosphorylases. Int. J. Mol. Sci. 2022, 23, 3043. [Google Scholar] [CrossRef]
  51. Reddy, S.K.; Bågenholm, V.; Pudlo, N.A.; Bouraoui, H.; Koropatkin, N.M.; Martens, E.C.; Stålbrand, H. A β-Mannan Utilization Locus in Bacteroides ovatus Involves a GH36 α-Galactosidase Active on Galactomannans. FEBS Lett. 2016, 590, 2106–2118. [Google Scholar] [CrossRef]
  52. Grimaud, F.; Pizzut-Serin, S.; Tarquis, L.; Ladevèze, S.; Morel, S.; Putaux, J.L.; Potocki-Veronese, G. In Vitro Synthesis and Crystallization of β-1,4-Mannan. Biomacromolecules 2019, 20, 846–853. [Google Scholar] [CrossRef] [PubMed]
  53. You, X.; Qin, Z.; Yan, Q.; Yang, S.; Li, Y.; Jiang, Z. Structural Insights into the Catalytic Mechanism of a Novel Glycoside Hydrolase Family 113 -1,4-Mannanase from Amphibacillus xylanus. J. Biol. Chem. 2018, 293, 11746–11757. [Google Scholar] [CrossRef] [PubMed]
  54. Merceron, R.; Foucault, M.; Haser, R.; Mattes, R.; Watzlawick, H.; Gouet, P. The Molecular Mechanism of Thermostable α-Galactosidases AgaA and AgaB Explained by X-Ray Crystallography and Mutational Studies. J. Biol. Chem. 2012, 287, 39642–39652. [Google Scholar] [CrossRef] [PubMed]
  55. Nakae, S.; Ito, S.; Higa, M.; Senoura, T.; Wasaki, J.; Hijikata, A.; Shionyu, M.; Ito, S.; Shirai, T. Structure of Novel Enzyme in Mannan Biodegradation Process 4-O-β-d-Mannosyl-d-Glucose Phosphorylase MGP. J. Mol. Biol. 2013, 425, 4468–4478. [Google Scholar] [CrossRef] [PubMed]
  56. Ye, Y.; Saburi, W.; Odaka, R.; Kato, K.; Sakurai, N.; Komoda, K.; Nishimoto, M.; Kitaoka, M.; Mori, H.; Yao, M. Structural Insights into the Difference in Substrate Recognition of Two Mannoside Phosphorylases from Two GH130 Subfamilies. FEBS Lett. 2016, 590, 828–837. [Google Scholar] [CrossRef]
  57. Zhang, Y.; Ju, J.; Peng, H.; Gao, F.; Zhou, C.; Zeng, Y.; Xue, Y.; Li, Y.; Henrissat, B.; Gao, G.F.; et al. Biochemical and Structural Characterization of the Intracellular Mannanase AaManA of Alicyclobacillus acidocaldarius Reveals a Novel Glycoside Hydrolase Family Belonging to Clan GH-A. J. Biol. Chem. 2008, 283, 31551–31558. [Google Scholar] [CrossRef]
  58. Couturier, M.; Touvrey-Loiodice, M.; Terrapon, N.; Drula, E.; Buon, L.; Chirat, C.; Henrissat, B.; Helbert, W. Functional Exploration of the Glycoside Hydrolase Family GH113. PLoS ONE 2022, 17, e0267509. [Google Scholar] [CrossRef]
  59. Linares, C.N.; Dilokpimol, A.; Stålbrand, H.; Mäkelä, M.R.; de Vries, R.P. Recombinant Production and Characterization of Six Novel GH27 and GH36 α-Galactosidases from Penicillium subrubescens and Their Synergism with a Commercial Mannanase during the Hydrolysis of Lignocellulosic Biomass. Bioresour. Technol. 2020, 295, 122258. [Google Scholar] [CrossRef]
  60. Hirmas, B.; Gasaly, N.; Orellana, G.; Vega-Sagardía, M.; Saa, P.; Gotteland, M.; Garrido, D. Metabolic Modeling and Bidirectional Culturing of Two Gut Microbes Reveal Cross-Feeding Interactions and Protective Effects on Intestinal Cells. mSystems 2022, 7, e00646-22. [Google Scholar] [CrossRef]
  61. Moens, F.; Verce, M.; De Vuyst, L. Lactate- and Acetate-Based Cross-Feeding Interactions between Selected Strains of Lactobacilli, Bifidobacteria and Colon Bacteria in the Presence of Inulin-Type Fructans. Int. J. Food Microbiol. 2017, 241, 225–236. [Google Scholar] [CrossRef]
  62. D’Souza, G.; Shitut, S.; Preussger, D.; Yousif, G.; Waschina, S.; Kost, C. Ecology and Evolution of Metabolic Cross-Feeding Interactions in Bacteria. Nat. Prod. Rep. 2018, 35, 455–488. [Google Scholar] [CrossRef] [PubMed]
Figure 1. Growth and production of short-chain fatty acids (SCFAs) during cultivation of Bifidobacterium adolescentis (BA) and Roseburia hominis (RH) on (galacto)-β-mannan-oligosaccharide (MOS/GMOS). (A) Cell concentration by qPCR-analysis for BA and RH in mono- and cocultures. (B) Relative strain abundance (%) in the coculture. (C) The BA monocultivation (in the medium for colon bacteria, MCB). (D) The RH monocultivation (in the modified medium for colon bacteria, mMCB). (E) The cocultivation of RH and BA in MCB. RecA (for BA) and rho (for RH) genes were used as markers in the qPCR-analysis to determine the cell concentration, expressed as log (copy number/mL) in the mono- and cocultures. The sum of calculated gene-copy-number values was used to determine the relative population (%) of RH and BA in the cocultures. The optical density (OD) was determined at 600 nm. The amount of SCFAs was determined by HPLC.
Microorganisms 10 02496 g001aMicroorganisms 10 02496 g001b
Figure 2. High-performance anion-exchange chromatography with pulsed amperometric detection (HPAEC–PAD) analysis of (galacto)-β-mannan-oligosaccharide (MOS/GMOS) utilization during the growth of (A) B. adolescentis, (B) R. hominis, (C) B. adolescentis, and R. hominis in coculture. The HPAEC–PAD analysis of the fermentation medium was carried out by using CarboPac PA200 column, as mentioned in Materials and Methods, in Section 2.11, Saccharide analysis by HPAEC–PAD. The elution was according to the previously described method optimized for fermentation media, as described previously in Bhattacharya et al. 2021 [16]. The arrows point to the retention time of galactose (G1), mannose (M1), linear mannan-oligosaccharides, MOS (mannobiose, M2, to mannohexaose, M6), and galactosylated mannan-oligosaccharides, GMOS (galactosyl mannotriose, GM3; di-glactosyl mannopentaose, G2M5) that have been used as standards in this study. All substrates were used at 5 g/L. An injection volume of 10 µL was used for all analytes.
Microorganisms 10 02496 g002aMicroorganisms 10 02496 g002b
Figure 3. Gene expression analysis, using reverse transcription-quantitative PCR (RT-qPCR) during the growth of R. hominis on different substrates (glucose, mannose, galactose, and (galacto)-β-mannan-oligosaccharide, MOS/GMOS). (A) A putative MOS/GMOS utilization locus (RhMosUL, RHOM_RS11115-11180) is predicted to be involved in MOS/GMOS utilization. (B) Other selected putative genes distributed across the genome were predicted to potentially be involved in MOS/GMOS utilization and short-chain fatty acid (SCFA) production. (C) Relative expression of 10 target genes expressed as fold change (logarithmic) relative to growth on glucose after 9 h. The putative function of the target genes RHOM_RS11135, RHOM_RS11140, RHOM_RS11145, RHOM_RS11160, RHOM_RS11175, RHOM_RS14610, RHOM_RS15885, RHOM_RS06425, and RHOM_RS13400 was functionally predicted as β-mannoside phosphorylase (RhMOP130A), mannosylglucose phosphorylase (RhMGP130), epimerase (RhMep), ABC substrate-binding protein (RhMosBP), α-galactosidase (RhGal36A), β-mannoside hydrolase (RhGH113A), lactate dehydrogenase (RhLDH), and butyl CoA: acetate CoA transferase (RhBCoA). One-way ANOVA with Tukey’s post hoc test was used to determine whether the differential expression of the genes was significant during growth on different substrates over two different time points (9 and 12 h). The significantly different means are shown as ** p < 0.01, *** p < 0.001, and **** p < 0.0001. Data from triplicate cultivations and mean values ± SD (standard deviation) are presented.
Microorganisms 10 02496 g003
Figure 4. Incubation of mannotriose and galactosyl mannotriose with (A) RhMOP130A or (B) RhMan113A analyzed by anion-exchange chromatography with pulsed amperometric detection (HPAEC–PAD). (A) Column PA200 chromatograms of phosphorolysis incubations of RhMOP130A (0.14 mg/mL) with 10 mM of either mannotriose (M3) or galactosylmannotriose (GM3). Standards of mannose (M1) to mannotetraose (M4) were applied for product quantification. Incubations were carried out at 37 °C for 0–1 h in 100 mM sodium citrate buffer (pH 6.0). (B) Column PA20-chromatograms for analysis of M1 release in incubations of RhMan113A (5 µg/mL) with 5 mM of M3 or GM3. M1 was used as the standard for quantification. Incubations were carried out at 30 °C for 0–24 h in 50 mM sodium phosphate buffer (pH 6.0). Data from triplicate incubations and mean values ± SD (standard deviation) are presented.
Microorganisms 10 02496 g004
Figure 5. Progression of mannotetraose (M4) hydrolysis catalyzed by RhMan113A. RhMan113A (5 µg/mL) was incubated with 5 mM M4 at 30 °C in 50 mM sodium phosphate buffer (pH 6.0). (A) HPEAC–PAD analysis of hydrolysis reactions sampled over time. Mannose (M1) and mannan-oligosaccharides mannobiose to mannotetraose (M2–M4) were used as standards. (B) Profile of generated and consumed reaction products by RhMan113A over time. Data from triplicate incubations and mean values ± SD (standard deviation) are presented.
Microorganisms 10 02496 g005
Figure 6. Schematic model of proposed (galactosyl-)mannan-oligosaccharide (MOS/GMOS) utilization mechanism of R. hominis A2-183. The figure shows a selection of proteins/enzymes proposed to be involved in the uptake and initial degradation of MOS/GMOS. All proteins and enzymes are encoded by the MOS/GMOS utilization locus (RhMosUL, RHOM_RS11115-11180), except those marked with an asterisk (*). Gene products for which expression was studied and shown to be upregulated during growth on MOS/GMOS are in black text. Proteins and enzymes that were functionally investigated in this work are highlighted with bold text. The uptake of extracellular mannan-oligosaccharides (mannobiose to mannohexaose) and galactosyl-mannotriose is facilitated by ABC-transporter proteins, here exemplified by the solute-binding protein RhMosBP and transport proteins (white text, not studied). Based on biochemical data, the α-galactosidase RhGal36A removes α-galactosyl substitutions making linear mannan-oligosaccharides available for depolymerization by the exo-oligomannosidase RhMan113A and the mannan-oligosaccharide phosphorylase RhMOP130A (phosphoryl shown in red). The dotted arrows illustrate several putative reactions.
Microorganisms 10 02496 g006
Table 1. The specific activity of the β-mannan-oligosaccharide phosphorylase RhMOP130A in synthesis and phosphorolysis reaction directions.
Specific Activity of RhMOP130A (kat/mol)
SubstrateSynthesis DirectionPhosphorolysis Direction
M1 -NA
M22.98 ± 0.10-
M31.13 ± 0.081.02 ± 0.13
M41.16 ± 0.110.65 ± 0.04
M51.45 ± 0.080.58 ± 0.02
GM3NA-
G2M5NA-
Enzyme activity was measured at 37 °C for 10 min in 50 mM sodium citrate buffer and 10 mM mannose 1-phosphate (synthesis reaction) or 100 mM sodium citrate buffer and 10 mM inorganic phosphate (phosphorolysis reaction). NA, not analyzed; “-”, no detectable activity. Commercially available mannose (M1), mannobiose (M2), mannotriose (M3), mannotetraose (M4), mannopentaose (M5), galactosyl mannotriose (GM3), and di-galactosyl mannopentaose (M5) were used as substrates. Data from triplicate incubations and mean values ± SD (standard deviation) are presented.
Table 2. Specific activity and enzyme kinetic parameters of RhMan113A, using different substrates.
RhMan113A
SubstrateSpecific Activity (kat/mol)kcat (s−1)KM (mM)kcat/KM (s−1 mM−1)
M2-NANANA
M34.9 ± 0.02NANANA
M410.2 ± 0.210.2 ± 1.13.3 ± 1.13.1 ± 0.4
M57.0 ± 0.13.2 ± 0.72.1 ± 1.81.5 ± 0.9
M65.8 ± 0.4NANANA
GM3-NANANA
Incubations were at 30 °C in 50 mM phosphate buffer. The assay time was 10 min for specific activity analysis and 30 min for Michaelis–Menten kinetics. NA, not analyzed; “-”, no detectable activity. Data from triplicate incubations and mean values ± SD (standard deviation) are presented.
Table 3. Activity of RhGal36A on different substrates.
SubstrateSpecific Activity of RhGal36A in (kat/mol)
pNP-gal234.7 ± 2.9
Raffinose+
GM317.1 ± 0.7
G2M5+
Incubations were at 30 °C in 50 mM sodium citrate buffer for 10 min (for determination of specific activity values) or 24 h (for detection of product formation as galactose release, using HPAEC–PAD with a PA20-column); “+”, activity detected on 24 h incubations. Data from triplicate incubations, mean values ± SD (standard deviation) are presented.
Publisher’s Note: MDPI stays neutral with regard to jurisdictional claims in published maps and institutional affiliations.

