Article

Proteome and Physiological Characterization of Halotolerant Nodule Endophytes: The Case of Rahnella aquatilis and Serratia plymuthica

1
Dipartimento di Scienze e Innovazione Tecnologica, Università del Piemonte Orientale, 15121 Alessandria, Italy
2
Dipartimento per lo Sviluppo Sostenibile e la Transizione Ecologica, University of Piemonte Orientale, 13100 Vercelli, Italy
3
Center on Autoimmune and Allergic Diseases (CAAD), Università del Piemonte Orientale, 28100 Novara, Italy
4
Dipartimento di Medicina Traslazionale, Università del Piemonte Orientale, 28100 Novara, Italy
5
Laboratorio Analisi e Microbiologia, ASL-VC Ospedale Sant’Andrea, 13100 Vercelli, Italy
*
Authors to whom correspondence should be addressed.
Microorganisms 2022, 10(5), 890; https://doi.org/10.3390/microorganisms10050890
Submission received: 30 March 2022 / Revised: 22 April 2022 / Accepted: 22 April 2022 / Published: 24 April 2022
(This article belongs to the Special Issue Feature Collection in Environmental Microbiology Section 2021-2022)

Abstract

:
Bacterial endophytes were isolated from nodules of pea and fava bean. The strains were identified and characterized for plant beneficial activities (phosphate solubilization, synthesis of indole acetic acid and siderophores) and salt tolerance. Based on these data, four strains of Rahnella aquatilis and three strains of Serratia plymuthica were selected. To shed light on the mechanisms underlying salt tolerance, the proteome of the two most performant strains (Ra4 and Sp2) grown in the presence or not of salt was characterized. The number of proteins expressed by the endophytes was higher in the presence of salt. The modulated proteome consisted of 302 (100 up-regulated, 202 down-regulated) and 323 (206 up-regulated, 117 down-regulated) proteins in Ra4 and Sp2, respectively. Overall, proteins involved in abiotic stress responses were up-regulated, while those involved in metabolism and flagellum structure were down-regulated. The main up-regulated proteins in Sp2 were thiol: disulfide interchange protein DsbA, required for the sulfur binding formation in periplasmic proteins, while in Ra4 corresponded to the soluble fraction of ABC transporters, having a role in compatible solute uptake. Our results demonstrated a conserved response to salt stress in the two taxonomically related species.

1. Introduction

Until the early 2000s, rhizobia were considered the sole bacteria able to colonize legume root nodules. This idea quickly changed when several works highlighted the occurrence of other bacterial strains inside the root nodules [1,2]. These microorganisms, living inside nodules but unable to form them, are collectively called Non-Rhizobia Endophytic (NRE) bacteria and have been classified as opportunistic colonizers [3]. It has been proposed that NRE bacteria may enter the nodule through infection threads, whose formation is induced in legume roots by rhizobia [3,4]. Therefore, rhizobia and other bacterial species frequently coexist in nodules [5,6].
NRE bacteria mainly belong to alpha- (Agrobacterium, Methylobacterium, Ochrobactrum, Microvirga, Phyllobacterium, Devosia, Shinella), beta- (Herbaspirillum), and gamma- (Acinetobacter, Enterobacter, Pantoea, Pseudomonas, Stenotrophomonas) Proteobacteria, Firmicutes (Bacillus, Paenibacillus, Staphylococcus), and Actinobacteria (Micromonospora, Microbacterium, Arthrobacter, Mycobacterium) [1]. The biodiversity of the culturable bacteria isolated from nodules of spontaneous Sulla coronaria has been studied by Amplified Ribosomal DNA Restriction Analysis (ARDRA) and 16S rDNA sequencing techniques. The results obtained highlighted that Rhizobium sullae, the typical rhizobium associated with field cropped varieties, occurred only in 25 out of 60 nodules, while the remaining 35 were colonized by unculturable strains of Pseudomonas sp., Microbacterium sp., and Pantoea agglomerans [7]. More recently, it has been reported that only 10% of the bacterial strains isolated from nodules of wild Lotus parviflorus plants are able to nodulate legumes (Bradyrhizobium canariense and Bradyrhizobium sp.), while 90% are represented by opportunistic nodule associated bacteria classified in alpha- (Rhizobium/Agrobacterium), beta- (Massilia), and gamma- (Pseudomonas, Lysobacter, Luteibacter, Stenotrophomonas, and Rahnella) Proteobacteria [8]. A study performed on cowpea cultivated in two semi-arid regions of Brazil with different soil characteristics (a silty-clay Haplic Vertisol and a sandy-loam Red Yellow Dystrophic Ultisol) demonstrated that the soil type is the main factor affecting the biodiversity of the nodule microbiome [9], with Chryseobacterium spp. as the dominant genus inhabiting cowpea nodules. Since Chryseobacterium strains were previously reported to enhance the tolerance of Phaseolus vulgaris to moderate saline stress [10], it has been hypothesized that NRE bacterial strains belonging to this genus may support cowpea plant growth in the presence of saline stress, a condition that frequently occurs in semi-arid regions.
While the role of nodule endophytes is unclear, it is widely accepted that they usually do not induce negative effects on plant growth. Contrarily, since their discovery, some papers have underlined a direct beneficial activity on legume plants, such as an increase in the nodulation level and improvement of nitrogen fixation efficiency [11,12,13], as well as indirect biocontrol activity against phytopathogenic fungi and nematodes [14,15]. Several strains of NRE can synthesize auxins and siderophores, solubilize phosphate, and fix nitrogen and some of them showed the capability to increase plant tolerance to stress [16,17,18,19].
Plants belonging to the Fabaceae family are usually classified as sensitive or moderately sensitive to abiotic stress, especially salinity [20]. In fact, salt stress not only affects different early phases of the symbiosis establishment with rhizobia, nodule formation, and function (i.e., nitrogen fixation) but also plant growth and root development [21]. However, rhizobia and NRE bacteria seem to be more tolerant to salt stress than the host legume [22,23]. Overall, our knowledge of NRE bacteria is still scanty: less than 100 papers have been published on bacteria living in this peculiar habitat. Information on the mechanisms by which NRE bacteria tolerate mild salt stress and possibly contribute to reducing the intensity of the stressful condition for the symbiosis is completely lacking.
This work has two main purposes: (i) to isolate, identify and characterize salt stress-tolerant nitrogen-fixing bacteria, and (ii) to shed light on the molecular mechanisms at the basis of salt stress tolerance using a proteomic approach.

2. Materials and Methods

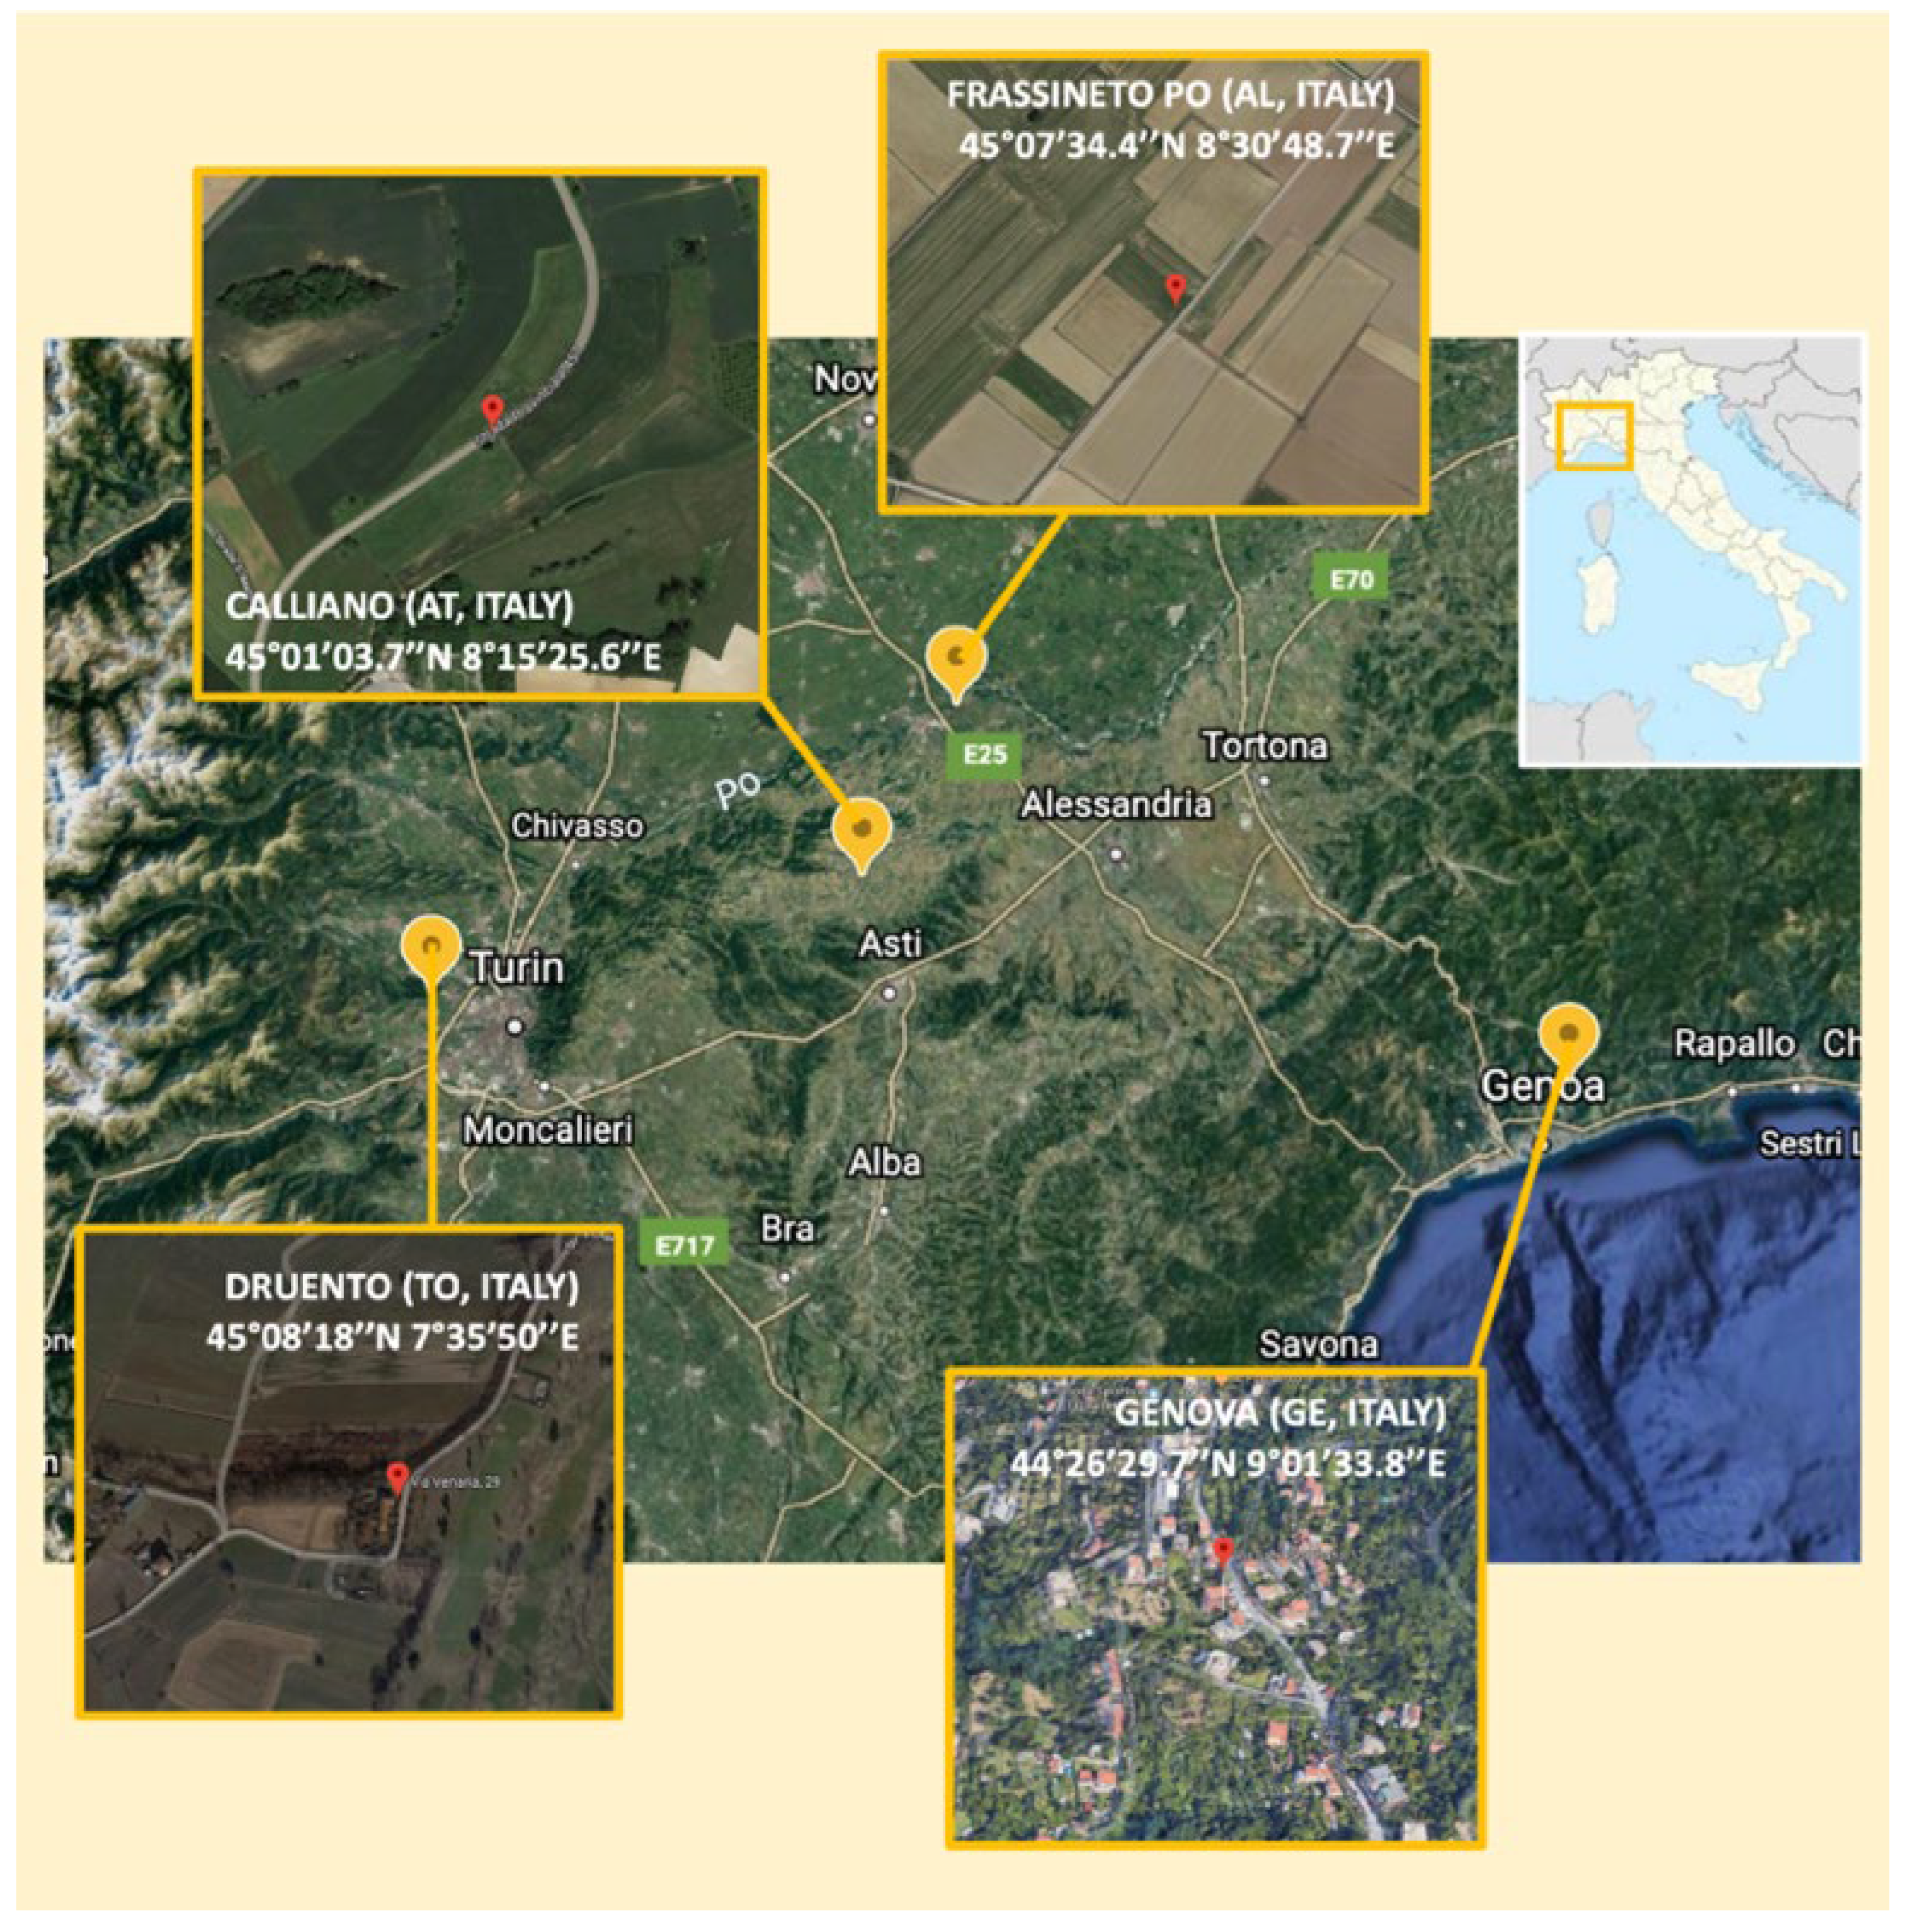
2.1. Isolation of Bacterial Strains from Vicia fava and Pisum sativum Nodules

The isolation of the endophytic bacterial strains was performed from nodules of fava bean (Vicia fava L.) and pea (Pisum sativum L.) cultivated in different geographical areas of northern Italy. In particular, three fava bean plants in each site were sampled: in Genoa (44°26′29.7″ N, 9°01′33.8″ E), in Calliano (Asti, Italy) (45°01′03.7″ N, 8° 15′25.6″ E), and in Frassineto Po (Alessandria, Italy) (45°07′34.4″ N, 8° 30′48.7″ E), while three pea plants were sampled in Calliano (Asti, Italy) (45°01′03.7″ N, 8° 15′25.6″ E) and Druento (TO) (45°08′18″ N, 7°35′50″ E), respectively (Figure 1).
Roots of pea and fava bean (3 plants in each considered site) were harvested and washed with tap water. Nodules were separated from roots with a sterile scalpel and placed in a 50 mL sterile tube to which 30 mL of sterile deionized water was added for 15 min, under slow shaking. This procedure was repeated 4 times to reduce bacterial density on the nodule surface. Then, the nodules were surface sterilized in 1% sodium hypochlorite for 5 min. Next, 5 more washing steps (1 min each) were performed in sterile physiological solution (NaCl 0.9%). To check the nodule surface sterilization efficacy, 5 nodules per sample were incubated on Trypticase Soy Agar (VWR, Milan, Italy) for 5 days at 28 °C. Nodules were then homogenized in 10 mL of MgSO4, 0.1 M, with a Tissue Lyser at 560 rpm for 5 min. Finally, 100 µL of the suspension was spread, in triplicate, onto Yeast Mannitol Agar (YMA) plates added with cycloheximide (100 µg mL−1) (Sigma Aldrich, Milan, Italy) [24]. This growth medium is widely accepted as selective for nitrogen-fixing bacteria.

2.2. Identification of Bacterial Endophytes

Pure colonies grown on YMA were described for their morphology and subjected to Gram staining.
Identification of the bacterial strains was performed both by mass spectrometry MALDI (Matrix-Assisted Laser Desorption/Ionization) and TOF/TOF (UltrafleXtreme, Bruker) equipped with Biotyper identification software (version 2.0; Bruker Daltonics) and by 16S rDNA sequencing.
A pure bacterial colony was spotted on an MTP 384 target plate polished steel (Bruker Daltonics, Milan, Italy). The spot was firstly overlaid with 70% Formic acid (Sigma Aldrich, Milan, Italy), after drying with 1 μL HCCA (alpha-cyano-4-hydroxycinnamic acid) (Bruker, Milan, Italy) in 50% acetonitrile–2.5% trifluoroacetic acid in water as matrix solution. The preparation was dried at room temperature until co-crystallization with the sample. The resulting mass spectra were analyzed by the BioTyper software and referred to standard matching. The obtained results were further validated by 16S rDNA sequencing.
Nucleo Spin tissue DNA purification kit (Macherey-Nagel, M-Medical, Cornaredo, Milan) was employed to extract genomic DNA of the bacterial endophytes, following the manufacturer’s instructions. PCR amplification of 16S rDNA was performed using the fD1/RP2 primer pair, whose sequence has been reported in Weisburg et al. [25]. The PCR reaction was carried out as described in Gamalero et al. [26]. Specifically, initial denaturation at 94 °C for 5 min; 34 cycles at 94 °C for 1 min, 60 °C for 1 min, and 72 °C for 1 min 30 s, with 72 °C for 10 min as the final extension time. The resulting amplified product was purified with Nucleo Spin Extract II kit (Macherey-Nagel) and sequenced by BMR Genomics (Padua, Italy). Electropherograms were assembled using Sequencing Analysis Software version 5.1 (Applied Biosystems, Milan, Italy) and transformed into a text file for further bioinformatic analyses.
DNA sequences were compared against all bacterial 16S rDNA reference sequences available at the NCBI World Wide Web database using BLAST. The identified sequences were loaded in GenBank.

2.3. Physiological Characterization of Plant Beneficial Traits

All the nodule endophytic bacterial strains were characterized for the physiological activities at the base of the plant growth promotion effect.
The capability to synthesize siderophores was assessed on universal Chrome Azurol S (CAS) agar [27]. A colony of each bacterial strain was inoculated at the center of the CAS medium. Plates were incubated at 28 °C for 5 days and monitored daily for the appearance of an orange halo around the colony, indicating siderophore synthesis. The measurements were done in triplicate, and siderophore production was expressed as a ratio between the two diameters of the halo and the two diameters of the colony.
Phosphate solubilization capability was assessed on 2 media containing dicalcium phosphate (DCP) (Sigma Aldrich, Milan, Italy) or tricalcium phosphate (TCP) (Sigma Aldrich, Milan, Italy). A colony of each strain was spotted at the center of the plate and incubated at 28 °C for 15 days. Solubilization of DCP and TCP was indicated by the formation of a clarification halo under the colony and by colony growth, respectively [24].
The synthesis of indole-3-acetic acid (IAA) was performed according to De Brito Alvarez et al. [28]. Briefly, a single colony of each bacterial strain was inoculated onto a nitrocellulose disk placed on 10% TSA (VWR, Milan, Italy) added with 5 mM L-tryptophan (Sigma Aldrich, Milan, Italy). After 3 days of incubation at 28 °C, nitrocellulose membranes were dipped in 20 mL of Salkowsky’s reagent (composed of 2% FeCl3 in 35% perchloric acid) (Sigma Aldrich, Milan, Italy). The possible development of a red/pink halo around the colony spot indicated the capability to produce IAA.

2.4. Tolerance to Temperature and Antibiotic Resistance Profile

In order to assess temperature tolerance, bacterial colonies were transplanted on TSA and Mueller Hinton Agar (MH) (VWR, Milan, Italy) plates and incubated for 2 days at 4, 28, 37, or 42 °C.
The antibiotic resistance profile was characterized through both agar disk diffusion and Minimal Inhibitory Concentration (MIC) assays according to the EUCAST method with some modifications.
Bacterial suspensions containing 108 colony-forming units/mL (cfu/mL) (optical density 0.5 at 600 nm of wavelength) prepared in MgSO4, 0.1 M, were swabbed on MH medium. Disks containing erythromycin 15 µg, chloramphenicol 30 µg, rifampicin 30 µg, streptomycin 10 µg, neomycin 30 µg, kanamycin 30 µg, Cefepime (30 µg), Cefotaxime 5 µg, Ceftazidime (10 µg), Ciprofloxacin (5 µg), Gentamicin 10 µg, Trimethoprim-Sulphamethazole (1.25 + 23.75 µg), Fosfomycin (200 µg), Amoxicillin (3 µg), Meropenem (10 µg), Piperacillin/Tazobactam (36 µg) were deposited on the agar surface. Then, the plates were incubated at 28 °C for 24 h, considering their optimal growth temperature. The diameter of the growth inhibition halo was measured with a caliper (mm). The results were interpreted according to Stock et al. [29], Massa et al. [24], and EUCAST Clinical Breakpoint Tables (v. 12.0) for Enterobacterales.
The MICs of the 15 antibacterial drugs Amikacin, Amoxicillin/Clavulanic Acid, Cefepime, Cefotaxime, Ceftazidime, Ciprofloxacin, Ertapenem, Gentamicin, Mero-penem, Piperacillin/Tazobactam, Trimethoprim-Sulphamethazole, Ampicillin, Aztre-onam, Colistin, Levofloxacin, Piperacillin, Ticarcillin, Tigecycline, and Tobramycin were measured by VITEK® 2 AST card using the VITEK® 2 automated system (BioMerieux, Lyon, France). Briefly, strain suspensions obtained in physiological solution were adjusted to 0.5 McFarland by measuring absorbance at 600 nm. These suspensions were then loaded into the instrument in VITEK® 2 AST cards that provided a series of antibiograms and tests to detect resistance.

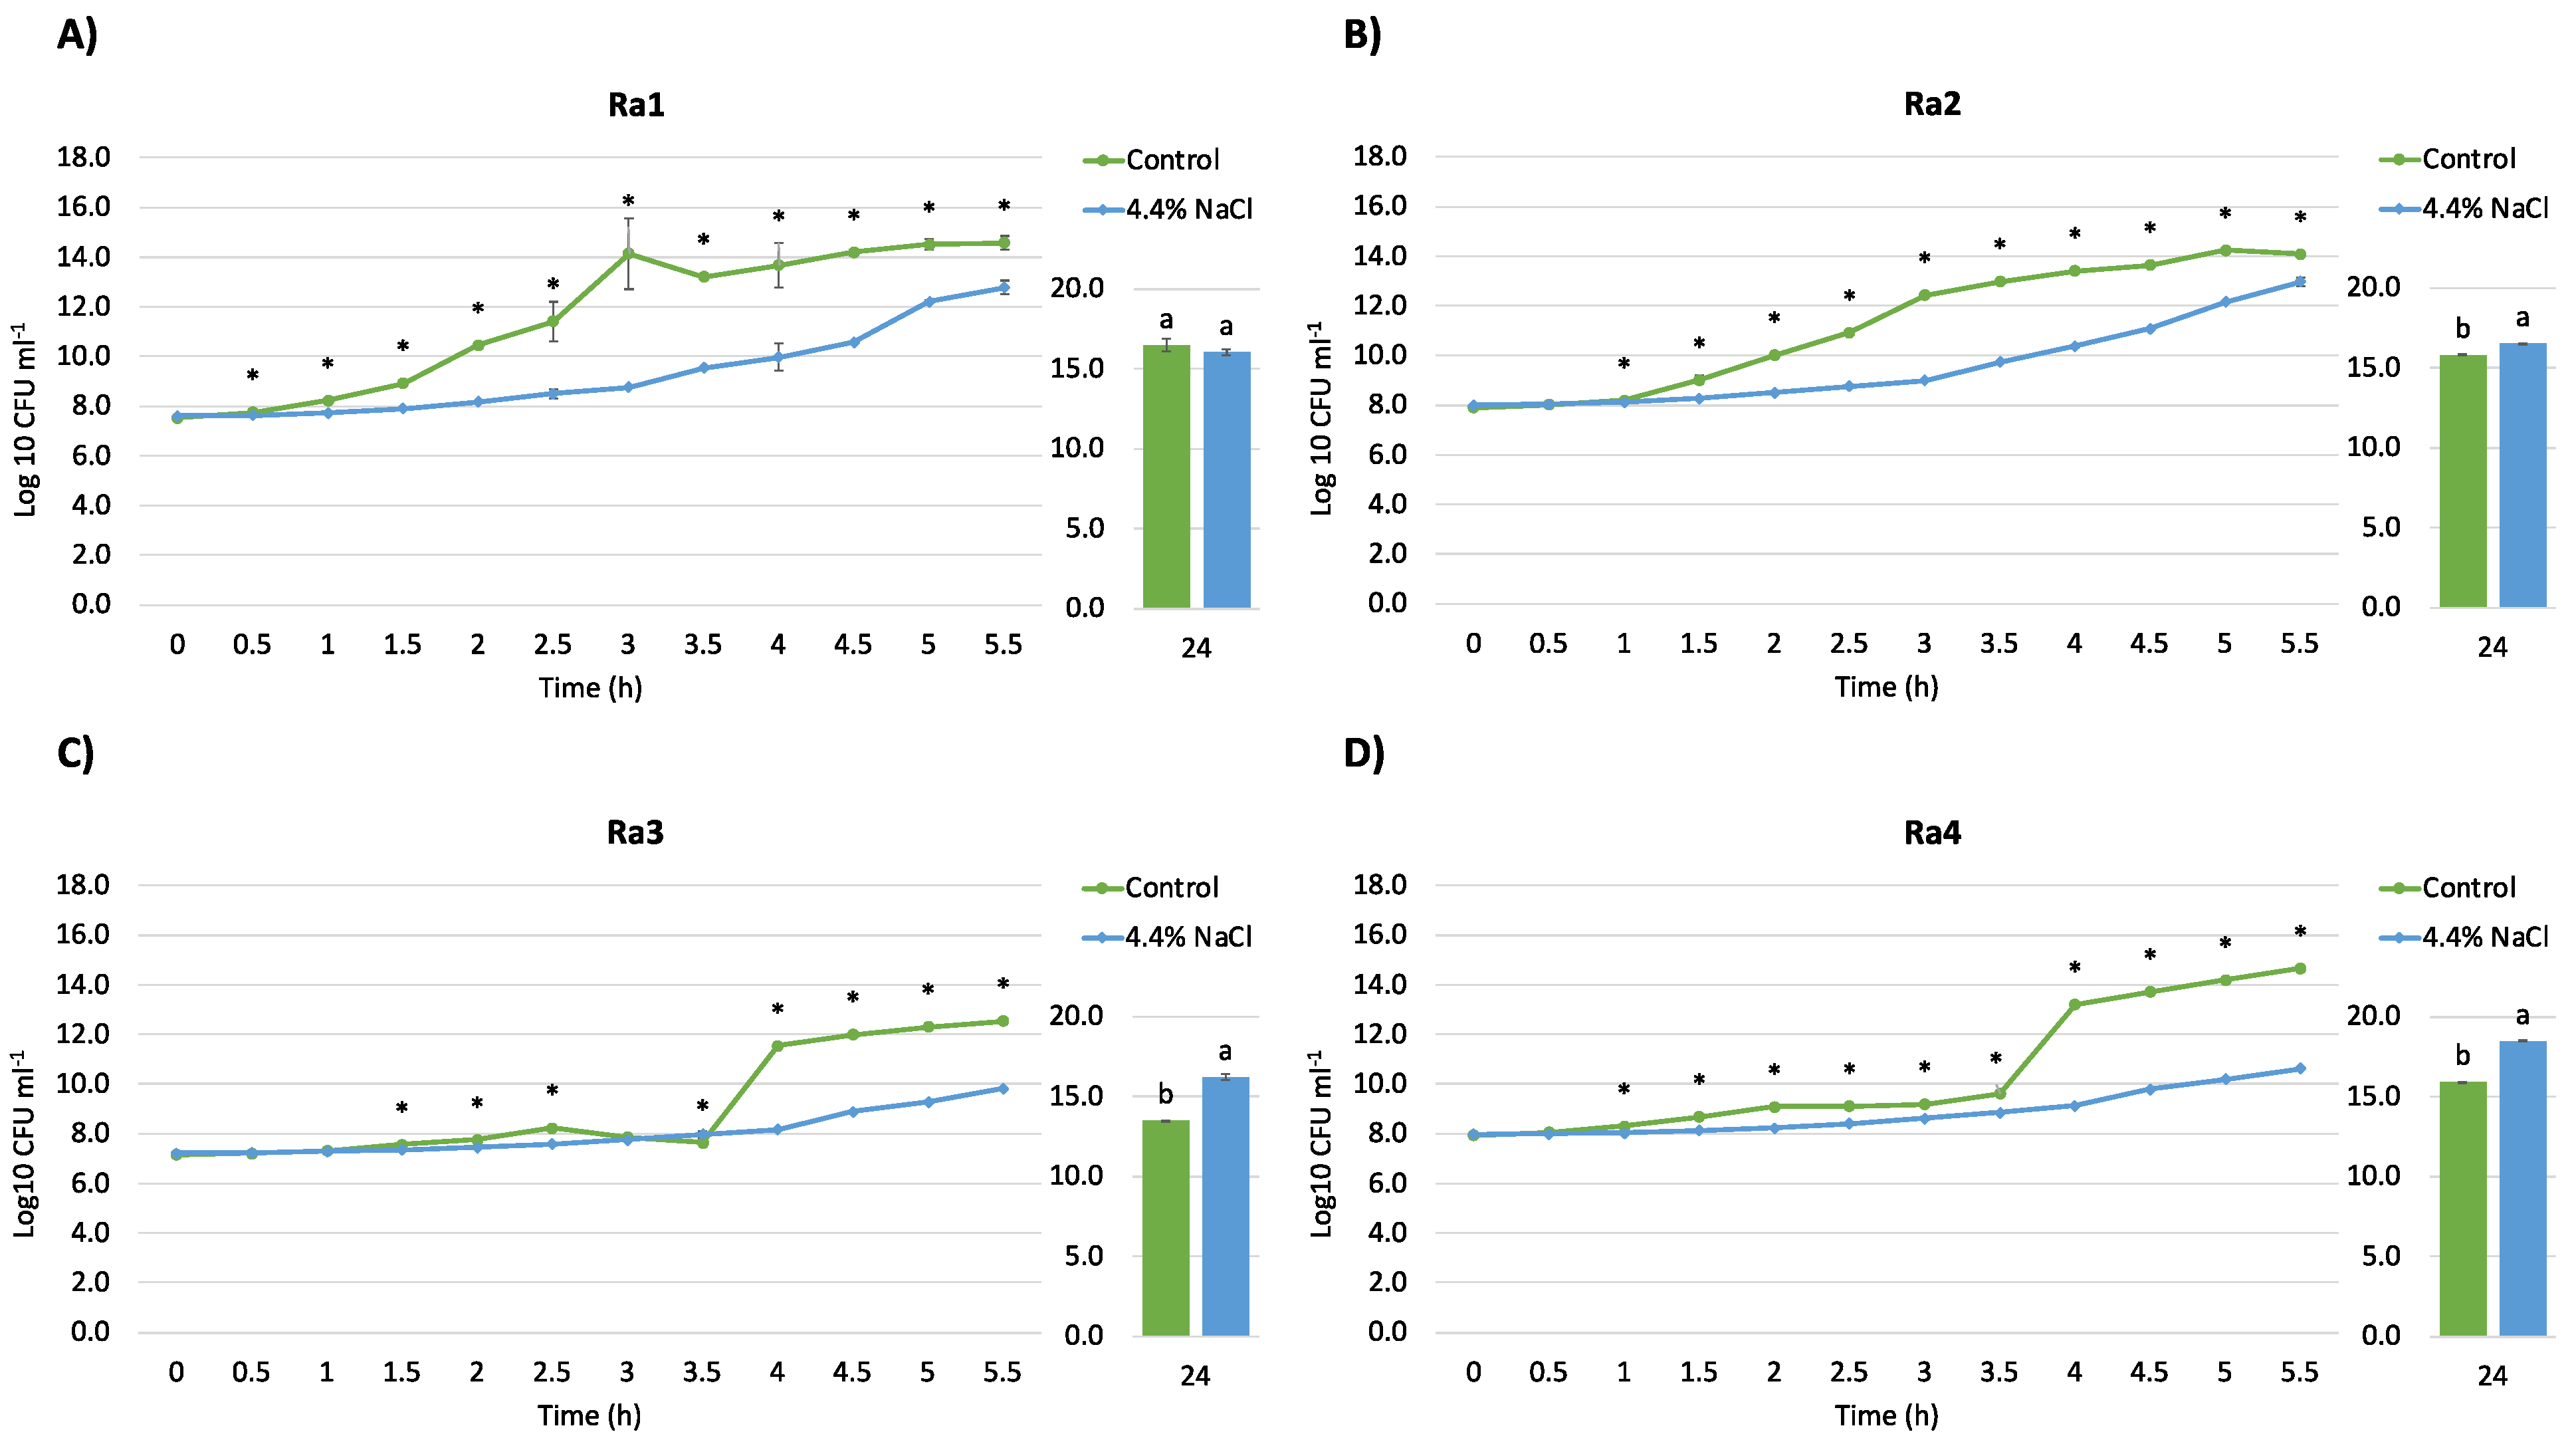
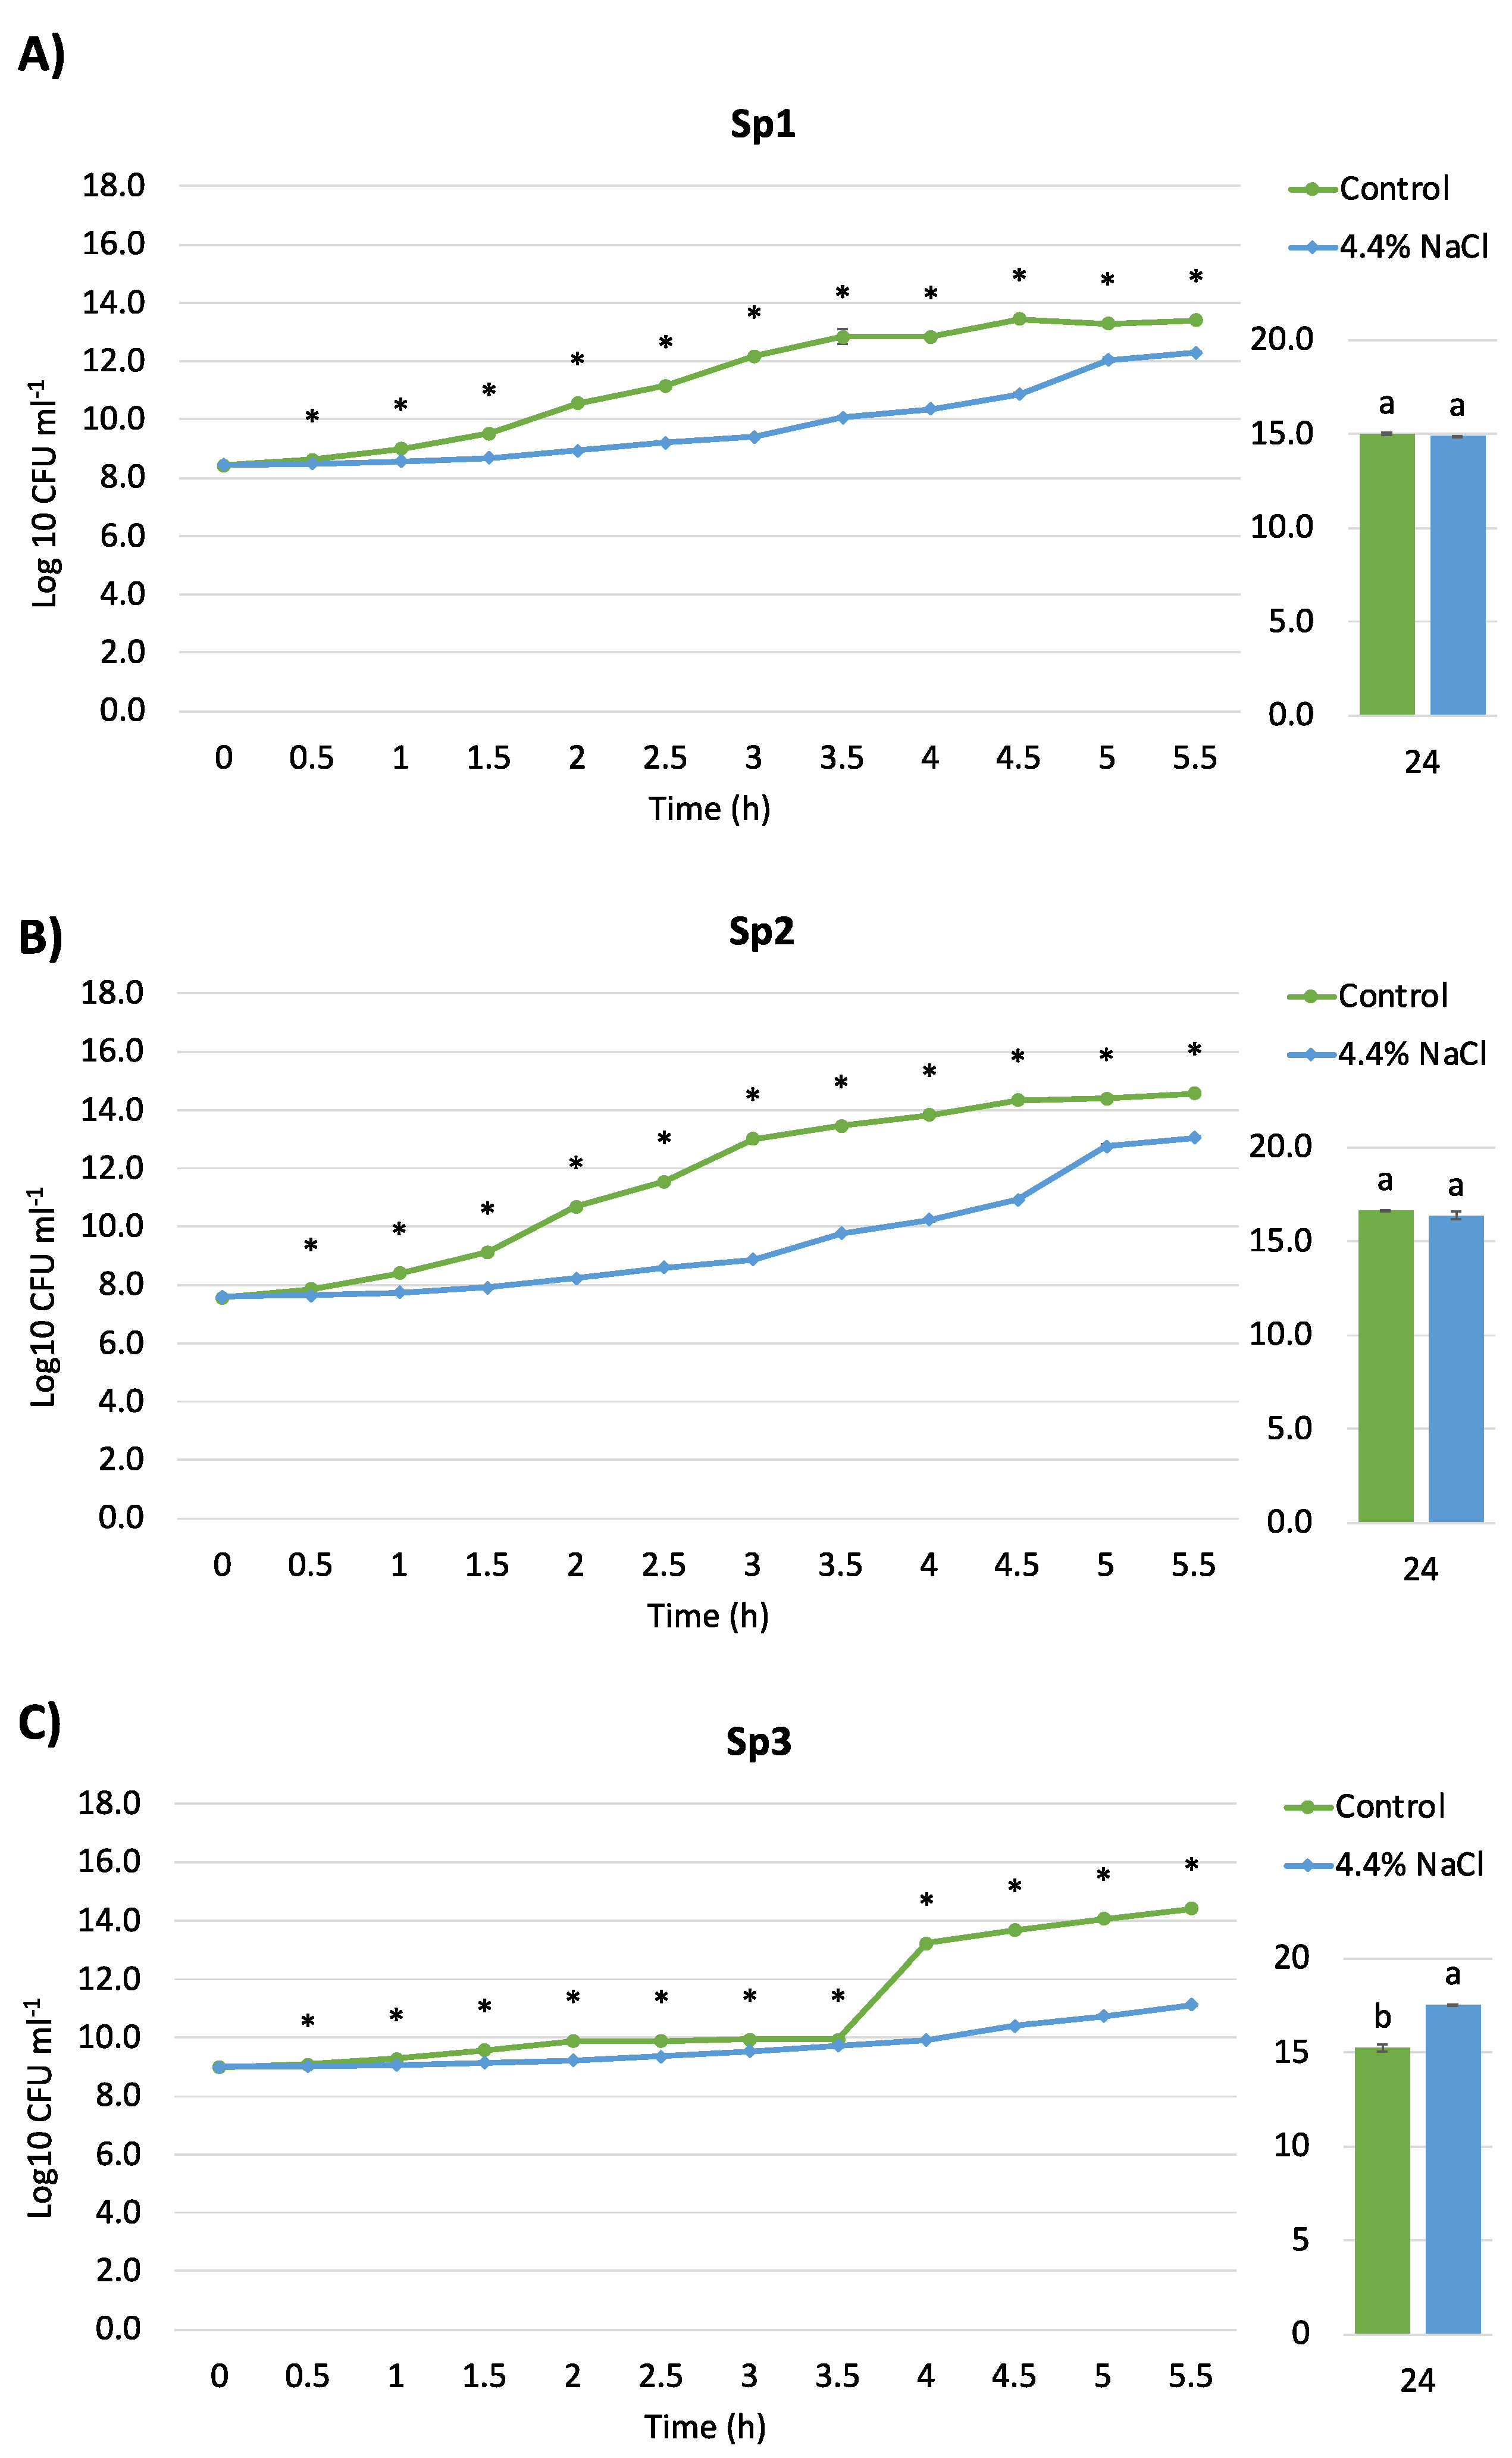
2.5. Salt Tolerance and Growth Curve

The salt tolerance of each bacterial strain was evaluated through the determination of the Minimum Inhibitory Concentration (MIC) using a microdilution method in a 96-well microtiter plate, according to the EUCAST method modified by adding NaCl into the medium. A 24 h culture of each bacterial strain was diluted in MgSO4 (0.1 M) to reach 108 cfu/mL (optical density 0.5 at 600 nm wavelength). First, sodium chloride (Fluka, Milan, Italy) was dissolved in tryptic soy broth (TSB) (VWR, Milan, Italy) with a concentration ranging from 14.4 to 0.014%. In a second step, to better understand the true range of bacterial tolerance, NaCl was diluted from 7.2 to 2.4%. A negative control, containing TSB with each NaCl dilution, as well as a positive control represented by TSB inoculated with the bacterial strains at the same NaCl concentrations, were set up. All plates were incubated at 28 °C for 48 h. A well was considered positive when the formation of a visible bacterial cell pellet occurred. Each experiment was performed in triplicate. Salt tolerance assay results were used to select the best performing strains to investigate the salt response by proteomic analysis.

2.6. 1-Aminocyclopropane-1-carboxylic Acid (ACC) Deaminase Assay

Two strains (Rahnella aquatilis Ra4 and Serratia plymuthica Sp2) were selected according to the results obtained by salt tolerance assay and were tested for their 1-aminocyclopropane-1-carboxylic acid (ACC) deaminase capability using the method described by Penrose and Glick [30]. Briefly, bacterial cells were grown for 24 h at 28 °C in tryptic soy broth (TSB medium) and then in Dworkin and Foster (DF) [31] salts minimal medium added of 45 µL 0.5 M ACC (Sigma Aldrich, Milan, Italy) solution. The bacteria were first washed with 0.1 M Tris-HCl, pH 7.6, suspended in 0.1 M Tris-HCl, pH 8.5, and then in toluene (Sigma Aldrich, Milan, Italy). An aliquot of the cells treated with toluene was stored for protein assay. The remaining aliquot was incubated at 30 °C for 15 min in the presence or the absence of ACC. A total of 1 milliliter of 0.56 M HCl was added to the suspension and centrifuged at 16,000× g at room temperature for 10 min. Then, 1 milliliter of the supernatant was vortexed together with 800 µL of 0.56 M HCl and 300 µL of the 2,4-dinitrophenylhydrazine reagent. After 30 min of incubation at 30 °C, 2 mL 2 N NaOH was added, and the absorbance of the mixture was measured at 540 nm. Pseudomonas migulae 8R6 [32], able to synthesize ACC deaminase and to produce alpha-ketobutyrate and its mutant, unable to synthesize this enzyme, were used as positive and negative controls, respectively.

2.7. Proteome Analysis

Salt response was investigated in Ra4 and Sp2 strains comparing the proteome produced by treated cells (4.4% NaCl) versus untreated cells. The experiment was conducted in triplicate in TSB. In each strain, both the control (TSB) and 4.4% NaCl (treated) solution were inoculated with an optical density of 108 cfu/mL diluted 1:1000, reaching a final bacterial concentration of 105 cfu/mL. The cultures were incubated at 28 °C under shaking for 24 h. At the end of incubation, the samples were centrifuged for 15 min RT at 1500× g. To recover proteins, 5 volumes of 0.1 M ammonium acetate in methanol were added to 10 mL of supernatant and incubated overnight at −20 °C.
The precipitated proteins were recovered by centrifugation for 50 min at 4 °C, 1500× g. The resulting protein pellet was resuspended in 400 μL of 50 mM ammonium bicarbonate and quantified by the Bradford method [33] using Bovine Serum Albumin (Sigma Aldrich, Milan, Italy) as standard (from 2 to 0.031 µg µL−1). Proteins were Trypsin digested as fully reported in Bona et al. [34,35].
The mass spectrometry analyses were performed using a micro-LC Eksigent Technologies (Dublin, OH, USA) system with a Halo Fused C18 column (0.5 × 100 mm, 2.7 μm) as a stationary phase. The injection volume was 4.0 μL, and the oven temperature was set at 40 °C. The mobile phase was a mixture of 0.1% (v/v) formic acid in water (A) and 0.1% (v/v) formic acid in acetonitrile (B), eluting at a flow rate of 15.0 μL min−1 at an increasing concentration of solvent B from 2% to 40% in 30 min. The LC system was interfaced with a 5600+ TripleTOF system (AB Sciex, Concord, ON, Canada) equipped with a DuoSpray Ion Source. The samples were subjected to the traditional data-dependent acquisition (DDA): mass spectrometer analysis was performed using a mass range of 100–1500 Da, followed by an MS/MS product ion scan from 200 to 1250 Da with the abundance threshold set at 30 counts per second (cps) (35 candidate ions can be monitored during every cycle).
For label-free quantification, samples were then subjected to cyclic data independent analysis (DIA) of the mass spectra using a 25-Da window. A 50-ms survey scan (TOF-MS) was performed, followed by MS/MS experiments on all precursors. These MS/MS experiments were performed in a cyclic manner using an accumulation time of 40 ms per 25-Da swath (36 swaths in total) for a total cycle time of 1.5408 s.
The ions were fragmented for each MS/MS experiment in the collision cell using the rolling collision energy. The MS data were acquired with Analyst TF 1.7 (AB Sciex) [36]. Mass data were analyzed using Mascot (Matrix Science Inc., Boston, MA, USA) against the NCBI databases of Rahnella aquatilis (71,017 sequences, 16 September 2019) and Serratia plymuthica (130,272 sequences, 16 September 2019).
The search was performed on Mascot v. 2.3.0; the digestion enzyme selected was Trypsin, with 3 maximum missed cleavages; a search tolerance of 120 ppm was specified for the peptide mass tolerance, and 0.6 Da for the MS/MS tolerance. The charges of the peptides to search for were set to 2+, 3+, and 4+, and the search was set on monoisotopic mass. The following modifications were used: oxidized methionine and deamidation (NQ) as variable modifications. Proteins with at least 1 peptide with an ion score higher than the homology or identity ion score value were considered significant.
Moreover, the quantification was performed by integrating the extracted ion chromatogram of all the unique ions for a given peptide. The quantification was carried out with PeakView 2.2 and MarkerView 1.2. (Sciex, Concord, ON, Canada). A total of 6 peptides per protein and 6 transitions per peptide were extracted from the SWATH files. Shared peptides were excluded as well as peptides with modifications. Peptides with FDR lower than 1.0% were exported in MarkerView for the t-test [37].

2.8. Bioinformatic Analysis

All identified proteins were annotated with eggNOG-mapper software (v. 2.0.1) (Cantalapiedra CP), and both KEGG pathway terms and GO Terms were associated with each protein.
Differentially expressed proteins were considered for both R. aquatilis Ra4 and S. plymutica Sp2 using a |log2FC| > 1 and p-value < 0.05 as cutoffs for differential expression. T-tests between Ra4 treated with salt (4.4% NaCl) against the corresponding control and Sp2 treated with salt (4.4% NaCl) against the corresponding control were performed.
For differential expressed proteins, functional enrichment for KEGG Pathways and GO Terms associated with each protein were tested by a hypergeometric test using the R “phyper” function (p-value < 0.05, Fisher’s test). Volcano plots were generated using the “plot” function in R (R core 2020).

2.9. Statistical Analysis

Shapiro–Wilk and Levene tests were employed to assess data normality and homogeneity of variance, respectively. Based on the results obtained, parametric (ANOVA and Welch one-way ANOVA) or non-parametric (Kruskal–Wallis and per-mutation test) one-way tests were used to compare controls and 4.4% NaCl in the different bacterial strains. Differences were considered significant for p < 0.05. All statistical analyses were performed using R (v. 3.5.1) [R Core Team (2018)].

3. Results and Discussion

3.1. Isolation, Identification, and Physiological Characterization of Bacterial Strains

A total of 14 and 8 strains were isolated from the nodules cut from the roots of fava bean and pea plants, respectively (Table 1), and sampled as reported in paragraph 2.1 (Figure 1).
Of these, 9 strains developed small pink mucoid colonies, round shape with convex elevation and entire margins, while 7 strains showed large mucoid and pink colonies with entire margins, and 7 strains showed orange-red colonies (Table 1).
These features are typical of rhizobia strains on YMA. All 22 strains were Gram-negative. None of the isolates were able to solubilize TCP, while 18 strains showed solubilization activity on DCP (Table 1). Only the PSEB1A1 and PSEN2B1 strains synthesized siderophores on CAS agar, while 9 strains produced IAA (Table 1).
Based on the characteristics of the colony and the results of the physiological activities, 7 strains (highlighted in green in Table 1) were selected for further analyses.
The nearest neighbors search against all bacterial 16S rDNA reference sequences, available at the NCBI World Wide Web database, allowed the identification of Ra1-4 as R. aquatilis and Sp1-3 as S. plymuthica. Bacterial 16S rDNA reference sequences of the isolated bacteria are available at the NCBI World Wide Web database GenBank with the accession numbers reported in Table 2. All the isolates were able to grow at 4 °C and 28 °C, showing swarming colonies. At 37 °C, they showed a reduced growth rate and motility loss, while none of the strains grew at 42 °C (Table 2). The swarming capability at 28 °C, but not at 37 °C, suggests that 28 °C is their optimal growth temperature. Consequently, they do not have a pathogenic potential toward animals and humans. Although strains belonging to R. aquatilis, and less frequently, S. plymuthica, are reported to cause human infections, bacteriemia and sepsis [39,40,41], these bacterial species are considered ubiquitous in the environment and more spread in soil, water and plants. Moreover, these strains could be considered moderate halophilic bacteria as they can grow in the presence of NaCl, ranging from 5.8 to 6.4% of NaCl (Table 2). In literature, it has been reported that Pantoea ananatis tolerate 8.15% of NaCl concentration, and R. aquatilis survives in up to 6.3% NaCl [42].
Table 3, Table 4 and Table 5 report the results of the response to antibiotics (both disc diffusion and MIC assays), demonstrated by different isolated strains. In particular, the isolates showed an intrinsic resistance only to erythromycin and cefepime, while they were differently sensitive to the other tested antibiotics. These results partly agree with the literature reporting strains of R. aquatilis as naturally resistant to many antibiotics, including amoxicillin, ampicillin, rifampicin, fosfomycin, cefotaxime, cephalothin, piperacillin, streptomycin, sulfamethoxazole, ticarcillin, and trimethoprim [29,43,44]. The substantial sensitivity profile of the isolated strains confirms their non-pathogenic nature and therefore makes it possible to use them to relieve salt stress in crop plants.
Growth curves of selected R. aquatilis strains treated or not with 4.4% NaCl are shown in Figure 2. This salt amount was identified (considering the MIC) as a sub-lethal concentration allowing a sufficient bacterial biomass production. The growth of R. aquatilis strains was generally inhibited by salt during the first 5.5 h of treatment. However, at 24 h, the growth of Ra 2, 3, and 4 was significantly higher in the presence of 4.4% NaCl than in TSB. This result suggests an adaptation of the strains to the stress probably mediated by the synthesis of compatible solutes such as proline, trehalose, glycine betaine, and other molecules regulating the osmotic responses. This hypothesis is supported by the proteome analysis highlighting the up-regulation of glycine betaine/L-proline ABC transporter substrate-binding protein ProX.
All S. plymuthica strains were sensitive to salt in the first 5.5 h of treatment (Figure 3). The growth of the strains Sp1 and Sp2 was unaffected by salt stress (Figure 3A,B). Like what was recorded for R. aquatilis strains, at 24 h, the density of S. plymuthica Sp3 in the presence of salt was higher than that in TSB (Figure 3C). Considering the growth kinetics and the degree of salt tolerance, R. aquatilis Ra4 and S. plymuthica Sp2 were chosen for further analyses and the evaluation of the proteome response to salt stress.

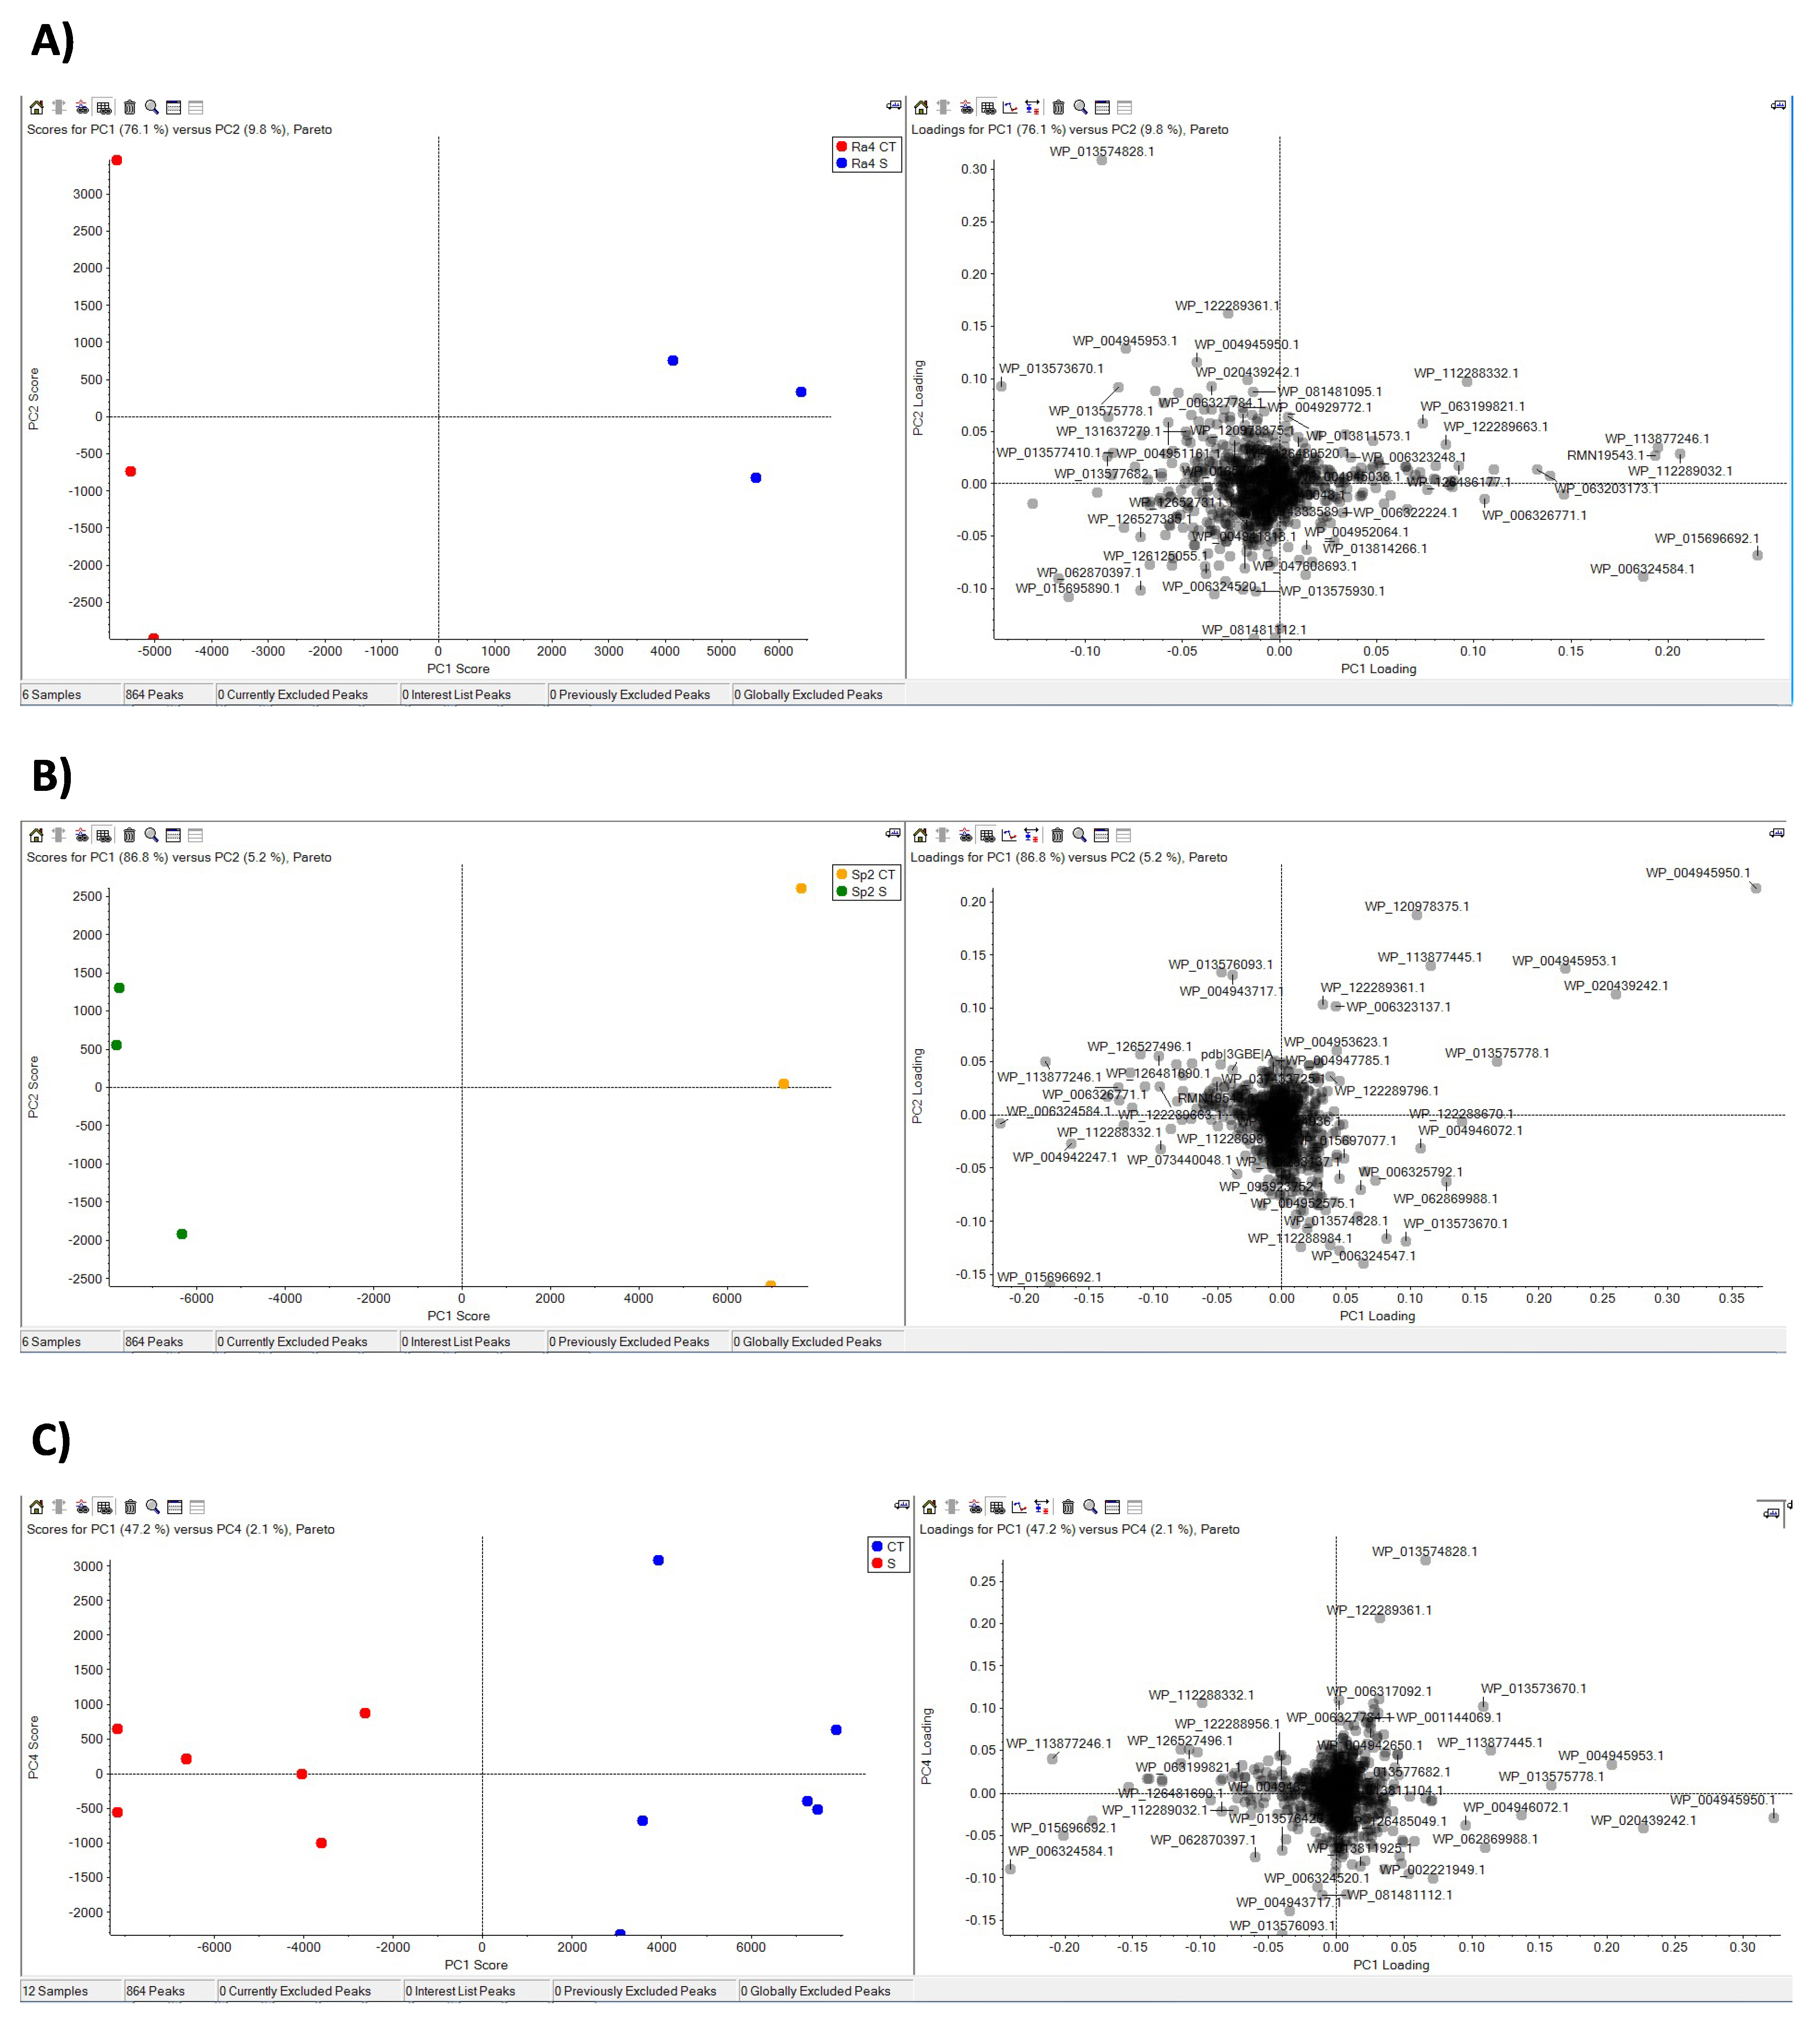
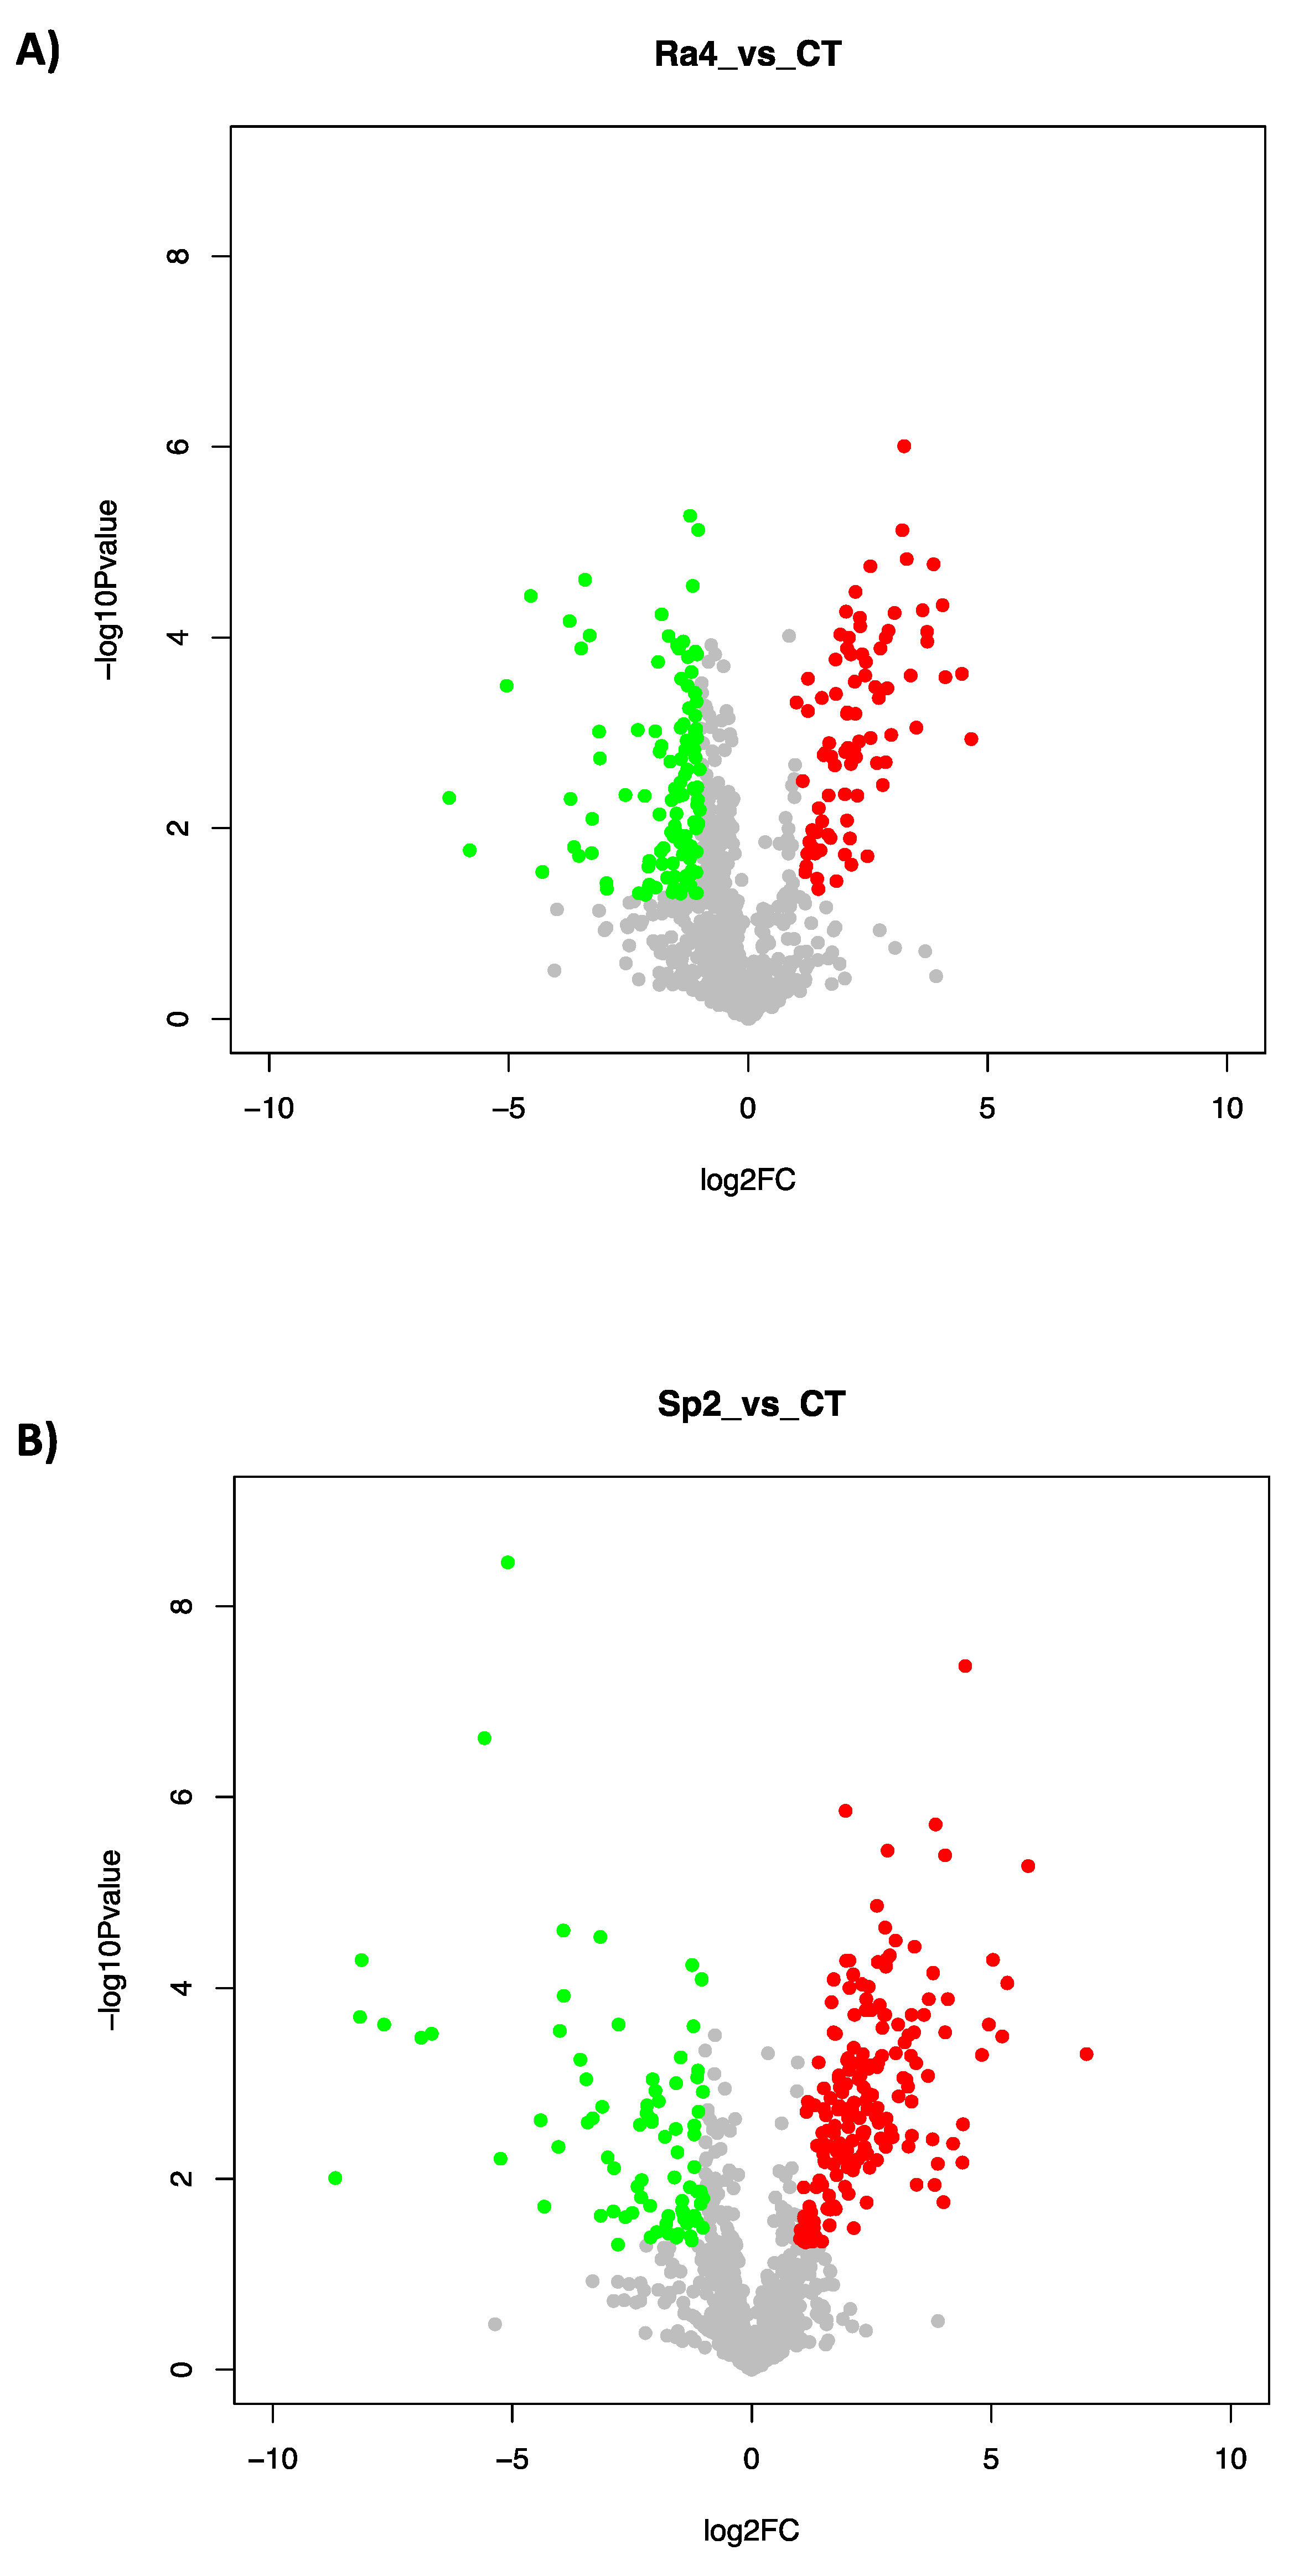
3.2. Proteome Response to Salt Stress

Figure 4 shows extracellular protein concentration present in the growth medium after 24 h of bacterial growth. R. aquatilis Ra4 grown in the presence of 4.4% NaCl produced a number of proteins comparable to non-stressed cells, while the concentration of protein synthesized by S. plymuthica Sp2 was higher in the presence of salt stress. Considering both the bacterial density at 24 h in the presence of salt (Figure 2D) and the quantity of produced proteins (Figure 4A), Ra4 showed a higher growth rate when subjected to salt stress (after 24 h of incubation) and a synthesis of proteins comparable to the control. However, similar amounts of proteins released do not necessarily mean similar protein patterns. On the contrary, the growth of Sp2 was unaffected by salt stress at 24 h, but it was coupled with a 70% increase in protein synthesis. This observation suggests that the two bacterial strains had a different sensitivity to moderate salt stress leading to a different protein expression. To explain these data, we must consider that the colony counting method used to evaluate bacterial density does not consider the number of cells that may have lost cultivability. In fact, it is well known that environmental stresses (low temperature and pH, starvation, salinity) can induce the cells to enter a Viable But Not Culturable (VBNC) state [45]. Based on this information, we can hypothesize that the density enhancement observed in Ra4 cells exposed to salinity can be overshadowed in Sp2 from the entry into the VBNC state. Consistently, Ra4 cells seem to be less sensitive than Sp2 to salt stress, while Sp2 would be more responsive in terms of protein production. To the best of our knowledge, increased protein synthesis in the presence of moderate saline stress has not been reported in the literature yet. Our work highlights that salt tolerance can lead to increased protein production. The modulation of the secretome in response to salt stress has also been reported in Burkoldera pseudomallei [46].
PCA analysis results of the expressed proteins are presented in Figure 5. Based on PC1, all the samples were well separated, both considering Ra4 (Figure 5A) and Sp2 (Figure 5B) or Ra4 + Sp2 (Figure 5C) responses. PC1 explained 78% of the variability for Ra4 and 87% for Sp2. The response to salt treatment was significant for both strains.
In the 2 analyzed strains, a different number of proteins was identified: 470 in Ra4 (Table S1) and 851 in Sp2 (Table S2). Among these, in Ra4, 302 proteins were significantly modulated (100 up-regulated and 202 down-regulated, Table S3), while in Sp2, 323 (206 up-regulated and 117 down-regulated, Table S4). This different protein modulation was also described in Figure 6, which shows the protein log2fold change between the two treatments. In Figure 6, scattered points stand for each protein, and no significant difference is indicated by the grey color. Moreover, significantly up-regulated and down-regulated proteins are indicated by red and green colors, respectively. Based on these results, the Sp2 strain showed a higher protein up-regulation compared to Ra4.
The results of Gene Ontology analysis showed that 116 GO terms were commonly up-regulated in the 2 analyzed strains in NaCl treated cells compared to control (Table S5). In Ra4, 26 GO terms were specifically up-regulated (Table S6) and 81 in Sp2 (Table S7). Moreover, 18 GO terms were commonly down-regulated (Table S8), and 200 and 88 GO terms were specifically down-regulated in Ra4 (Table S9) and Sp2 (Table S10), respectively.
In general, in this proteome study, also considering the GO terms, the up-regulated proteins were involved in the response to abiotic stress and the transport of solutes, while the down-regulated ones were related to the metabolism and bacterial structure and to the flagellum. Our results partly agree with Rubiano-Labrador et al. [47], identifying the proteins related to protein folding, membrane lipid alterations, signal transduction, and the transport of compatible solutes as the most involved in a 4% salt stress response of Tistlia consotensis (Gram-negative, aerobic, mesophilic, non-spore-forming, chemotrophic, nitrogen-fixing alpha proteobacterium [48]). In detail, our results highlight that in the Ra4 and Sp2 proteome, different trans-membrane ABC transporters (ATP-binding cassettes) were the most represented among the up-regulated proteins. Thanks to their characteristic ability to bind and hydrolyze ATP in order to transport substrates through the lipid bilayer, they play an important role in the absorption of compatible solutes in many bacteria [49]. In fact, the most up-regulated protein (fold-change 25.3 NaCl vs. Control, Table S3 in Ra4) was glycine betaine/L-proline ABC transporter substrate-binding protein ProX which mediates the import of glycine betaine, proline betaine, homobetaine, and marine osmolyte dimethylsulfoniopropionate (DMSP) and it is reported to be involved in the osmotic response in bacteria belonging to the Bacillus genus [50]. Other up-regulated ABC transporters were sulfate ABC transporter substrate-binding protein, zinc ABC transporter substrate-binding protein ZnuA, glutathione ABC transporter substrate-binding protein GsiB, oligopeptide ABC transporter substrate-binding protein OppA, cystine ABC transporter substrate-binding protein, and ribose ABC transporter substrate-binding protein RbsB (Table S3). Moreover, among the most up-regulated proteins, (i) the molecular chaperone OsmY acts as an autotransporter, and it is reported to be induced by osmotic stress [51]; (ii) serine endoprotease DegP is induced by stress conditions (high temperatures, extreme pH and osmotic shock) and removes or corrects damaged and/or misfolded proteins [52]; (iii) FKBP-type peptidyl-prolyl cis-trans isomerase is involved in many biological processes (such as gene expression, signal transduction, protein secretion, tissue development, and regeneration) and catalyzes protein folding [53]; (iv) glucans biosynthesis protein MdoG is one of the systems developed by enterobacteria to deal with osmotic stress [54] and finally, (v) penicillin-binding protein activator LpoB is known to regulate the peptidoglycan synthesis, thus being involved in the maintenance of osmotic stability [55].
All the up-regulated proteins in Ra4 are related to the cellular response to salinity conditions. Considering their GO terms they are involved in abiotic stress response, reactive oxygen species response, protein refolding, hyperosmotic response, and autolysis.
Among the proteins that were down-regulated under salt stress in Ra4 were: (i) the FliC/FljB family flagellin, whose down-regulation significantly decreased the diameter of the flagella [56]; (ii) the chemotaxis protein CheW, which is part of the chemotaxis system and allows bacteria to swim towards nutrients and far away from repellants [57]; (iii) deformylase peptide, cutting the terminal formyl group of proteins, which is lethal for prokaryotes [58]; (iv) flagellar hook-assembly protein FlgD, a scaffolding protein required for flagellar assembly [59], and the flagellar hook-associated protein FlgK, essential for the formation and determination of the flagellar filament length [60]; (v) phosphoenolpyruvate phosphotransferase (PTS) glucose transporter subunit IIA, a system that coordinates the bacterial response to the availability of carbohydrates through direct interactions of its components with protein targets. One of these components, the specific glucose enzyme IIA (EIIAGlc), coordinates bacterial metabolism, nutrient absorption, and interaction with cytoplasmic and membrane proteins [61].
Repression of the genes coding flagellar proteins, related to down-regulation of chemotaxis genes, has been previously observed in Bacillus cereus ATCC14579 exposed to severe salt stress (5% salt for 10 to 60 min) without any consequent changes in the chemotactic behavior of the treated cells [62,63]. Consistently, our results demonstrated that the down-regulation of CheW protein was also observed in R. aquatilis Ra4 exposed to salinity.
The most up-regulated protein in Sp2 was the thiol: disulfide interchange protein DsbA which is required for disulfide bond formation in some periplasmic proteins such as PhoA or OmpA [64]. The second most up-regulated protein was the ATP-independent periplasmic protein-refolding chaperone, which is one of the main protein families involved in cellular protection and facilitating protein folding without ATP consumption. Self-protection is the natural and immediate response of cells towards any sudden threat, such as the saline stress induced in this work. The cellular response to stress is therefore linked to molecular chaperones, which are the first line of defense to effectively recognize misfolded proteins and prevent their aggregation [65]. Further up-regulated proteins were Porin OmpA and Porin OmpC, which are associated with peptidoglycan and play a role in stabilizing the outer membrane of Gram-negative bacteria and maintaining bacterial cell shape [66]. External factors such as phosphate, nutrient deficiency, or osmolarity can affect the synthesis of proteins of the outer membrane (omps). In E. coli or Salmonella typhimurium, the synthesis of OmpC proteins is controlled by osmolarity and temperature [67,68]. Moreover, in these bacterial species, the level of OmpC increases with increasing osmolarity [69]. Osmotically-inducible lipoprotein OsmE is an osmotic regulator whose expression is induced by a high osmolarity [70]. Another up-regulated protein was FKBP-type peptidyl-prolyl cis-trans isomerase, whose function is to catalyze the folding phase of the protein. As reported before for Ra4, this enzyme is involved in different biological processes [71]. Finally, other up-regulated proteins in Sp2 were (i) the penicillin-binding protein activator LpoB, regulating the formation of peptidoglycan [55], and (ii) proteins that are sensors against various abiotic stresses, including stress induced by heavy metals and reactive oxygen species: periplasmic heavy metal sensor and oxidative stress defense protein.
As observed in Ra4, the most down-regulated proteins in Sp2 are those involved in the formation of the bacterial flagellum and involved FliC/FljB family flagellin with a log (fold change) value around −2. Only in Sp2 was it observed that the down-regulation protein is flagellar filament capping protein FliD, which is a protein that makes up the cap of the flagellum, so a reduction in function causes the bacterium to be not very mobile, as the flagellar filaments are missing [72]. Two other down-regulated proteins, as also reported before for Ra4, are flagellar hook assembly proteins FlgD and flagellar hook-associated proteins FlgK. FlgD is a scaffold protein necessary for the assembly of the flagellar hook but not for its own export [59], while FlgK controls the length of the flagellar hook and detects when it has reached its optimal length in order to initiate export [73]. Similar to what was observed in R. aquatilis Ra4, exposure to salt stress induced the down-regulation of proteins involved in flagellar apparatus in S. plymutica Sp2. However, in this bacterial species, the expression of proteins involved in chemotaxis remained unaffected by salinity. The loss of bacterial motility can be differently modulated according to salt concentration, as demonstrated in Exiguobacterium sp. SH31, a halotolerant bacterium isolated from sediments in Salar de Huasco (Chile).

4. Conclusions

This work demonstrated that taxonomically correlated non-rhizobia endophytic bacteria were present in nodules of the same plant species grown in distant geographical areas, suggesting an ecological selection of these bacteria in field conditions. In the present paper, 22 NRE bacteria were isolated, identified, and characterized for their antibiotic resistance profiles and their physiological activities, especially their response to salt stress. To contribute to filling the gap that exists in the knowledge of NRE bacteria, we analyzed and compared the proteome of two halotolerant bacterial strains (Rahnella aquatilis Ra4 and Serratia plymuthica Sp2) grown under optimal and moderate salt stress conditions. The proteomic approach employed in the present study demonstrated a conserved response to salt stress in two nodule endophytic strains belonging to different species but isolated in the same ecological niche. It is evident that proteins involved in the response to abiotic stress and the transport of solutes were up-regulated, while the down-regulated ones were related to the metabolism and structure of the bacterium, the flagellum, and the chemotaxis system. The two selected strains demonstrated different interesting features, from nitrogen-fixing ability to salt stress tolerance. For all these reasons, they represent good candidates for future investigations regarding genome characterization to go deeper into their environmental role in protecting plants from salt stress and nutrient starvation.

Supplementary Materials

The following material is available online at https://www.mdpi.com/article/10.3390/microorganisms10050890/s1, Table S1: Identified proteins in Ra4 (Rahnella aquatilis); Table S2: Identified proteins in Sp2 (Serratia plymuthica); Table S3. Differential expression of proteins in Ra4 treated with 0.4% NaCl vs. Control; Table S4: Differential expression of proteins in Sp2 treated with 0.4% NaCl vs. Control; Table S5: GO terms of proteins overexpressed both in Ra4 and in Sp2 treated with 0.4% NaCl vs. Control. Table S6: GO terms of proteins overexpressed only in Ra4 treated with 0.4% NaCl vs. Control; Table S7: GO terms of proteins overexpressed only in Sp2 treated with 0.4% NaCl vs. Control. Table S8: GO terms of proteins under-expressed both in Ra4 and in Sp2 treated with 0.4% NaCl vs. Control; Table S9: GO terms of proteins under-expressed only in Ra4 treated with 0.4% NaCl vs. Control; Table S10: GO terms of proteins under-expressed only in Sp2 treated with 0.4% NaCl vs. Control.

Author Contributions

Conceptualization, E.B. and E.G., formal analysis, N.M., F.F., D.C., M.P., L.P., G.C. and F.M.; investigation, G.N., E.B., A.C., M.M. and P.C.; resources, E.B.; data curation, M.M. and F.F.; writing—original draft preparation, E.B., N.M. and G.N.; writing—review and editing, E.G., G.L., V.T. and E.M.; supervision, E.B.; project administration, E.B.; funding acquisition, E.B. All authors have read and agreed to the published version of the manuscript.

Funding

This research received no external funding.

Institutional Review Board Statement

Not applicable.

Informed Consent Statement

Not applicable.

Data Availability Statement

The mass spectrometry proteomics data have been deposited with the ProteomeXchange Consortium via the PRIDE partner repository with the dataset identifier PXD031626. Submission details: Project Name: Proteome and physiological characterization of halotolerant nodule endophytes: the case of Rahnella aquatilis and Serratia plymuthica. Project accession: PXD031626. Reviewer account details: Username: [email protected] Password: YH1Cxirc.

Acknowledgments

The authors thank Bernard R. Glick for his valuable revision of the manuscript.

Conflicts of Interest

The authors declare no conflict of interest.

References

  1. Velazquez, E.; Martinez-Hidalgo, P.; Carro, L.; Alonso, P.; Peix, A. Nodular Endophytes: Untapped Diversity. In Beneficial Plant-Microbial Interactions; CRC Press: Boca Raton, FL, USA, 2013. [Google Scholar]
  2. De Meyer, S.E.; De Beuf, K.; Vekeman, B.; Willems, A. A Large Diversity of Non-Rhizobial Endophytes Found in Legume Root Nodules in Flanders (Belgium). Soil Biol. Biochem. 2015, 83, 1–11. [Google Scholar] [CrossRef] [Green Version]
  3. Zgadzaj, R.; James, E.K.; Kelly, S.; Kawaharada, Y.; de Jonge, N.; Jensen, D.B.; Madsen, L.H.; Radutoiu, S. A Legume Genetic Framework Controls Infection of Nodules by Symbiotic and Endophytic Bacteria. PLoS Genet. 2015, 11, e1005280. [Google Scholar] [CrossRef] [Green Version]
  4. Pandya, M.; Rajput, M.; Rajkumar, S. Exploring Plant Growth Promoting Potential of Non Rhizobial Root Nodules Endophytes of Vigna radiata. Microbiology 2015, 84, 80–89. [Google Scholar] [CrossRef]
  5. Liu, H.; Carvalhais, L.C.; Crawford, M.; Singh, E.; Dennis, P.G.; Pieterse, C.M.J.; Schenk, P.M. Inner Plant Values: Diversity, Colonization and Benefits from Endophytic Bacteria. Front. Microbiol. 2017, 8, 2552. [Google Scholar] [CrossRef] [PubMed]
  6. Ibáñez, F.; Wall, L.; Fabra, A. Starting Points in Plant-Bacteria Nitrogen-Fixing Symbioses: Intercellular Invasion of the Roots. J. Exp. Bot. 2017, 68, 1905–1918. [Google Scholar] [CrossRef]
  7. Muresu, R.; Porceddu, A.; Sulas, L.; Squartini, A. Nodule-Associated Microbiome Diversity in Wild Populations of Sulla coronaria Reveals Clues on the Relative Importance of Culturable Rhizobial Symbionts and Co-Infecting Endophytes. Microbiol. Res. 2019, 221, 10–14. [Google Scholar] [CrossRef]
  8. Soares, R.; Trejo, J.; Lorite, M.J.; Figueira, E.; Sanjuán, J.; Videira e Castro, I. Diversity, Phylogeny and Plant Growth Promotion Traits of Nodule Associated Bacteria Isolated from Lotus parviflorus. Microorganisms 2020, 8, 499. [Google Scholar] [CrossRef] [Green Version]
  9. Leite, J.; Fischer, D.; Rouws, L.F.M.; Fernandes-Júnior, P.I.; Hofmann, A.; Kublik, S.; Schloter, M.; Xavier, G.R.; Radl, V. Cowpea Nodules Harbor Non-Rhizobial Bacterial Communities That Are Shaped by Soil Type Rather than Plant Genotype. Front. Plant. Sci. 2017, 7. [Google Scholar] [CrossRef]
  10. Estévez, J.; Dardanelli, M.S.; Megías, M.; Rodríguez-Navarro, D.N. Symbiotic Performance of Common Bean and Soybean Co-Inoculated with Rhizobia and Chryseobacterium balustinum Aur9 under Moderate Saline Conditions. Symbiosis 2009, 49, 29–36. [Google Scholar] [CrossRef]
  11. Rajendran, G.; Sing, F.; Desai, A.J.; Archana, G. Enhanced Growth and Nodulation of Pigeon Pea by Co-Inoculation of Bacillus Strains with Rhizobium Spp. Bioresour. Technol. 2008, 99, 4544–4550. [Google Scholar] [CrossRef]
  12. Bai, Y.; Zhou, X.; Smith, D.L. Enhanced Soybean Plant Growth Resulting from Coinoculation of Bacillus Strains with Bradyrhizobium japonicum. Crop. Sci. 2003, 43, 1774–1781. [Google Scholar] [CrossRef]
  13. Tariq, M.; Hameed, S.; Yasmeen, T.; Zahid, M.; Zafar, M. Molecular Characterization and Identification of Plant Growth Promoting Endophytic Bacteria Isolated from the Root Nodules of Pea (Pisum sativum L.). World, J. Microbiol. Biotechnol. 2014, 30, 719–725. [Google Scholar] [CrossRef] [PubMed]
  14. Egamberdieva, D.; Wirth, S.J.; Shurigin, V.V.; Hashem, A.; Abd_Allah, E.F. Endophytic Bacteria Improve Plant Growth, Symbiotic Performance of Chickpea (Cicer arietinum L.) and Induce Suppression of Root Rot Caused by Fusarium solani under Salt Stress. Front. Microbiol. 2017, 8, 1887. [Google Scholar] [CrossRef] [PubMed]
  15. Zhao, J.; Wang, S.; Zhu, X.; Wang, Y.; Liu, X.; Duan, Y.; Fan, H.; Chen, L. Isolation and Characterization of Nodules Endophytic Bacteria Pseudomonas protegens Sneb1997 and Serratia plymuthica Sneb2001 for the Biological Control of Root-Knot Nematode. Appl. Soil Ecol. 2021, 164, 103924. [Google Scholar] [CrossRef]
  16. Peix, A.; Ramírez-Bahena, M.H.; Velázquez, E.; Bedmar, E.J. Bacterial Associations with Legumes. Crit. Rev. Plant. Sci. 2015, 34, 17–42. [Google Scholar] [CrossRef]
  17. Andrews, M.; Hodge, S.; Raven, J.A. Positive Plant Microbial Interactions. Ann. Appl. Biol. 2010, 157, 317–320. [Google Scholar] [CrossRef]
  18. Saïdi, S.; Chebil, S.; Gtari, M.; Mhamdi, R. Characterization of Root-Nodule Bacteria Isolated from Vicia faba and Selection of Plant Growth Promoting Isolates. World J. Microbiol. Biotechnol. 2013, 29, 1099–1106. [Google Scholar] [CrossRef]
  19. Maheshwari, R.; Bhutani, N.; Suneja, P. Isolation and Characterization of ACC Deaminase Producing Endophytic Bacillus mojavensis PRN2 from Pisum sativum. IRAN J. Biotech. 2020, 18, e2308. [Google Scholar] [CrossRef]
  20. Maas, E.V.; Hoffman, G.J. Crop Salt Tolerance—Current Assessment. J. Irrig. Drain. Div. 1977, 103, 115–134. [Google Scholar] [CrossRef]
  21. Bruning, B.; Rozema, J. Symbiotic Nitrogen Fixation in Legumes: Perspectives for Saline Agriculture. Environ. Exp. Bot. 2013, 92, 134–143. [Google Scholar] [CrossRef]
  22. Hashem, F.M.; Swelim, D.M.; Kuykendall, L.D.; Mohamed, A.I.; Abdel-Wahab, S.M.; Hegazi, N.I. Identification and Characterization of Salt- and Thermo-Tolerant Leucaena -Nodulating Rhizobium Strains. Biol. Fertil. Soils 1998, 27, 335–341. [Google Scholar] [CrossRef]
  23. Saxena, A.K.; Rewari, R.B. Differential Responses of Chick Pea (Cicer arietinum L.)- Rhizobium Combination to Saline Soil Conditions. Biol. Fertil. Soils 1992, 13, 31–34. [Google Scholar] [CrossRef]
  24. Massa, N.; Cesaro, P.; Todeschini, V.; Capraro, J.; Scarafoni, A.; Cantamessa, S.; Copetta, A.; Anastasia, F.; Gamalero, E.; Lingua, G.; et al. Selected Autochthonous Rhizobia, Applied in Combination with AM Fungi, Improve Seed Quality of Common Bean Cultivated in Reduced Fertilization Condition. Appl. Soil Ecol. 2020, 148, 103507. [Google Scholar] [CrossRef]
  25. Weisburg, W.G.; Barns, S.M.; Pelletier, D.A.; Lane, D.J. 16S Ribosomal DNA Amplification for Phylogenetic Study. J. Bacteriol. 1991, 173, 697–703. [Google Scholar] [CrossRef] [Green Version]
  26. Gamalero, E.; Favale, N.; Bona, E.; Novello, G.; Cesaro, P.; Massa, N.; Glick, B.; Orozco-Mosqueda, M.; Berta, G.; Lingua, G. Screening of Bacterial Endophytes Able to Promote Plant Growth and Increase Salinity Tolerance. Appl. Sci. 2020, 10, 5767. [Google Scholar] [CrossRef]
  27. Schwyn, B.; Neilands, J. Universal Chemical Assay for the Detection and Determination of Siderophore. Anal. Biochem. 1987, 160, 47–56. [Google Scholar] [CrossRef]
  28. De Brito, A.M.; Gagne, S.; Antoun, H. Effect of Compost on Rhizosphere Microflora of the Tomato and on the Incidence of Plant Growth-Promoting Rhizobacteria. Appl. Environ. Microbiol. 1995, 61, 194–199. [Google Scholar] [CrossRef] [Green Version]
  29. Stock, I.; Gruger, T.; Wiedemann, B. Natural Antibiotic Susceptibility of Rahnella aquatlis and R. aquatilis-Relared Strains. J. Chemoterapy 2000, 12, 30–39. [Google Scholar] [CrossRef]
  30. Penrose, D.M.; Glick, B.R. Methods for Isolating and Characterizing ACC Deaminase-Containing Plant Growth-Promoting Rhizobacteria. Physiol. Plant. 2003, 118, 10–15. [Google Scholar] [CrossRef] [Green Version]
  31. Dworkin, M.; Foster, J.W. Experiments with Some Microorganisms Which Utilize Ethane And Hydrogen. J. Bacteriol. 1958, 75, 592–603. [Google Scholar] [CrossRef] [Green Version]
  32. Rashid, S.; Charles, T.C.; Glick, B.R. Isolation and Characterization of New Plant Growth-Promoting Bacterial Endophytes. Appl. Soil Ecol. 2012, 61, 217–224. [Google Scholar] [CrossRef]
  33. Bradford, M.M. A Rapid and Sensitive Method for the Quantification of Micrograms Quantities of Proteins Utilizing the Principle of Protein-Dye Binding. Ann. Biochem. 1976, 72, 248–254. [Google Scholar] [CrossRef]
  34. Bona, E.; Massa, N.; Novello, G.; Boatti, L.; Cesaro, P.; Todeschini, V.; Magnelli, V.; Manfredi, M.; Marengo, E.; Mignone, F.; et al. Metaproteomic Characterization of Vitis vinifera Rhizosphere. FEMS Microbiol. Ecol. 2019, 95, fiy204. [Google Scholar] [CrossRef]
  35. Bona, E.; Scarafoni, A.; Marsano, F.; Boatti, L.; Copetta, A.; Massa, N.; Gamalero, E.; D’Agostino, G.; Cesaro, P.; Cavaletto, M.; et al. Arbuscular Mycorrhizal Symbiosis Affects the Grain Proteome of Zea mays: A Field Study. Sci. Rep. 2016, 6, 26439. [Google Scholar] [CrossRef] [PubMed] [Green Version]
  36. Albanese, P.; Manfredi, M.; Re, A.; Marengo, E.; Saracco, G.; Pagliano, C. Thylakoid Proteome Modulation in Pea Plants Grown at Different Irradiances: Quantitative Proteomic Profiling in a Non-Model Organism Aided by Transcriptomic Data Integration. Plant. J. 2018, 96, 786–800. [Google Scholar] [CrossRef]
  37. Dalla Pozza, E.; Manfredi, M.; Brandi, J.; Buzzi, A.; Conte, E.; Pacchiana, R.; Cecconi, D.; Marengo, E.; Donadelli, M. Trichostatin A Alters Cytoskeleton and Energy Metabolism of Pancreatic Adenocarcinoma Cells: An in Depth Proteomic Study. J. Cell. Biochem. 2018, 119, 2696–2707. [Google Scholar] [CrossRef] [PubMed]
  38. Goldstein, A.H. Bacterial Solubilization of Mineral Phosphates: Historical Perspective and Future Prospects. Am. J. Alt. Ag. 1986, 1, 51–57. [Google Scholar] [CrossRef]
  39. Roeder, H.A.; Fuller, B.; Scoular, S. Septic Shock Caused by Rahnella aquatilis Bacteremia in an Immunocompetent Adult. Am. J. Case Rep. 2021, 22, e930888-1. [Google Scholar] [CrossRef]
  40. Lee, W.J.; Song, Y.; Park, S.Y.; Kim, M.J. Bacteremia Due to Rahnella aquatilis in a Patient with a Chemoport. Infect. Chemother 2019, 51, 191. [Google Scholar] [CrossRef]
  41. Carrero, P.; Garrote, J.A.; Pacheco, S.; García, A.I.; Gil, R.; Carbajosa, S.G. Report of Six Cases of Human Infection by Serratia plymuthica. J. Clin. Microbiol. 1995, 33, 275–276. [Google Scholar] [CrossRef] [Green Version]
  42. Bakhshandeh, E.; Rahimian, H.; Pirdashti, H.; Nematzadeh, G.A. Phosphate Solubilization Potential and Modeling of Stress Tolerance of Rhizobacteria from Rice Paddy Soil in Northern Iran. World J. Microbiol. Biotechnol. 2014, 30, 2437–2447. [Google Scholar] [CrossRef] [PubMed]
  43. Tash, K. Rahnella aquatilis Bacteremia from a Suspected Urinary Source. J. Clin. Microbiol. 2005, 43, 2526–2528. [Google Scholar] [CrossRef] [PubMed] [Green Version]
  44. Ruimy, R.; Meziane-Cherif, D.; Momcilovic, S.; Arlet, G.; Andremont, A.; Courvalin, P. RAHN-2, a Chromosomal Extendedspectrum Class A b-Lactamase from Rahnella aquatilis. J Antimicrob. Chemother 2010, 65, 1619–1623. [Google Scholar] [CrossRef] [PubMed]
  45. Gin, K.Y.-H.; Goh, S.G. Modeling the Effect of Light and Salinity on Viable but Non-Culturable (VBNC) Enterococcus. Water Res. 2013, 47, 3315–3328. [Google Scholar] [CrossRef]
  46. Pumirat, P.; Saetun, P.; Sinchaikul, S.; Chen, S.-T.; Korbsrisate, S.; Thongboonkerd, V. Altered Secretome of Burkholderia pseudomallei Induced by Salt Stress. Biochim. Et Biophys. Acta (BBA)—Proteins Proteom. 2009, 1794, 898–904. [Google Scholar] [CrossRef]
  47. Rubiano-Labrador, C.; Bland, C.; Miotello, G.; Armengaud, J.; Baena, S. Salt Stress Induced Changes in the Exoproteome of the Halotolerant Bacterium Tistlia consotensis Deciphered by Proteogenomics. PLoS ONE 2015, 10, e0135065. [Google Scholar] [CrossRef] [Green Version]
  48. Díaz-Cárdenas, C.; Patel, B.K.C.; Baena, S. Tistlia consotensis Gen. Nov., Sp. Nov., an Aerobic, Chemoheterotrophic, Free-Living, Nitrogen-Fixing Alphaproteobacterium, Isolated from a Colombian Saline Spring. Int. J. Syst. Evol. Microbiol. 2010, 60, 1437–1443. [Google Scholar] [CrossRef] [Green Version]
  49. Rice, A.J.; Park, A.; Pinkett, H.W. Diversity in ABC Transporters: Type I, II and III Importers. Crit. Rev. Biochem. Mol. Biol. 2014, 49, 426–437. [Google Scholar] [CrossRef] [Green Version]
  50. Teichmann, L.; Kümmel, H.; Warmbold, B.; Bremer, E. OpuF, a New Bacillus Compatible Solute ABC Transporter with a Substrate-Binding Protein Fused to the Transmem.mbrane Domain. Appl. Env. Microbiol. 2018, 84. [Google Scholar] [CrossRef] [Green Version]
  51. Lennon, C.W.; Thamsen, M.; Friman, E.T.; Cacciaglia, A.; Sachsenhauser, V.; Sorgenfrei, F.A.; Wasik, M.A.; Bardwell, J.C.A. Folding Optimization In Vivo Uncovers New Chaperones. J. Mol. Biol. 2015, 427, 2983–2994. [Google Scholar] [CrossRef] [Green Version]
  52. Zhang, W.; Sun, K.; Cheng, S.; Sun, L. Characterization of DegQ Vh, a Serine Protease and a Protective Immunogen from a Pathogenic Vibrio Harveyi Strain. Appl Env. Microbiol 2008, 74, 6254–6262. [Google Scholar] [CrossRef] [PubMed] [Green Version]
  53. Ünal, C.M.; Steinert, M. Microbial Peptidyl-Prolyl Cis/Trans. Isomerases (PPIases): Virulence Factors and Potential Alternative Drug Targets. Microbiol Mol. Biol Rev. 2014, 78, 544–571. [Google Scholar] [CrossRef] [PubMed] [Green Version]
  54. Bontemps-Gallo, S.; Bohin, J.-P.; Lacroix, J.-M. Osmoregulated Periplasmic Glucans. EcoSal. Plus 2017, 7, 1–17. [Google Scholar] [CrossRef] [PubMed]
  55. Typas, A.; Banzhaf, M.; van den Berg van Saparoea, B.; Verheul, J.; Biboy, J.; Nichols, R.J.; Zietek, M.; Beilharz, K.; Kannenberg, K.; von Rechenberg, M.; et al. Regulation of Peptidoglycan Synthesis by Outer-Membrane Proteins. Cell 2010, 143, 1097–1109. [Google Scholar] [CrossRef] [Green Version]
  56. He, Y.; Xu, T.; Fossheim, L.E.; Zhang, X.-H. FliC, a Flagellin Protein, Is Essential for the Growth and Virulence of Fish Pathogen Edwardsiella tarda. PLoS ONE 2012, 7, e45070. [Google Scholar] [CrossRef] [Green Version]
  57. Eismann, S.; Endres, R.G. Protein Connectivity in Chemotaxis Receptor Complexes. PLoS Comput. Biol. 2015, 11, e1004650. [Google Scholar] [CrossRef] [Green Version]
  58. Berg, A.K.; Srivastava, D.K. Delineation of Alternative Conformational States in Escherichia Coli Peptide Deformylase via Thermodynamic Studies for the Binding of Actinonin. Biochemistry 2009, 48, 1584–1594. [Google Scholar] [CrossRef] [Green Version]
  59. Ohnishi, K.; Ohto, Y.; Aizawa, S.; Macnab, R.M.; Iino, T. FlgD Is a Scaffolding Protein Needed for Flagellar Hook Assembly in Salmonella typhimurium. J. Bacteriol. 1994, 176, 2272–2281. [Google Scholar] [CrossRef] [Green Version]
  60. Muramoto, K.; Makishima, S.; Aizawa, S.-I.; Macnab, R.M. Effect of Hook Subunit Concentration on Assembly and Control of Length of the Flagellar Hook of Salmonella. J. Bacteriol 1999, 181, 5808–5813. [Google Scholar] [CrossRef] [Green Version]
  61. Vijayakumar, V.; Vanhove, A.S.; Pickering, B.S.; Liao, J.; Tierney, B.T.; Asara, J.M.; Bronson, R.; Watnick, P.I. Removal of a Membrane Anchor Reveals the Opposing Regulatory Functions of Vibrio cholerae Glucose-Specific Enzyme IIA in Biofilms and the Mammalian Intestine. mBio 2018, 9, e00858-18. [Google Scholar] [CrossRef] [Green Version]
  62. Den Besten, H.M.W.; Mols, M.; Moezelaar, R.; Zwietering, M.H.; Abee, T. Phenotypic and Transcriptomic Analyses of Mildly and Severely Salt-Stressed Bacillus cereus ATCC 14579 Cells. Appl. Env. Microbiol. 2009, 75, 4111–4119. [Google Scholar] [CrossRef] [PubMed] [Green Version]
  63. Remonsellez, F.; Castro-Severyn, J.; Pardo-Esté, C.; Aguilar, P.; Fortt, J.; Salinas, C.; Barahona, S.; León, J.; Fuentes, B.; Areche, C.; et al. Characterization and Salt Response in Recurrent Halotolerant Exiguobacterium Sp. SH31 Isolated From Sediments of Salar de Huasco, Chilean Altiplano. Front. Microbiol. 2018, 9, 2228. [Google Scholar] [CrossRef] [PubMed]
  64. Grauschopf, U.; Winther, J.R.; Korber, P.; Zander, T.; Dallinger, P.; Bardwell, J.C.A. Why Is DsbA Such an Oxidizing Disulfide Catalyst? Cell 1995, 83, 947–955. [Google Scholar] [CrossRef] [Green Version]
  65. Suss, O.; Reichmann, D. Protein Plasticity Underlines Activation and Function of ATP-Independent Chaperones. Front. Mol. Biosci. 2015, 2, 43. [Google Scholar] [CrossRef] [Green Version]
  66. Havekes, L.M.; Hoekstra, W.P. Characterization of an Escherichia coli K-12 F-Con-Mutant. J. Bacteriol. 1976, 126, 593–600. [Google Scholar] [CrossRef] [Green Version]
  67. Lugtenberg, B.; Peterz, R.; Bernheimer, H.; Berendsen, W. Influence of Cultural Conditions and Mutations on the Composition of the Outer Membrane Proteins of Escherichia coli. Mol. Gen. Genet. 1976, 147, 251–262. [Google Scholar] [CrossRef]
  68. Nikaido, H.; Vaara, M. Molecular Basis of Bacterial Outer Membrane Permeability. Microbiol. Rev. 1985, 49, 32. [Google Scholar] [CrossRef]
  69. Sato, M.; Machida, K.; Arikado, E.; Saito, H.; Kakegawa, T.; Kobayashi, H. Expression of Outer Membrane Proteins in Escherichia coli Growing at Acid PH. Appl. Env. Microbiol. 2000, 66, 943–947. [Google Scholar] [CrossRef] [Green Version]
  70. Jung, J.U.; Gutierrez, C.; Martin, F.; Ardourel, M.; Villarejo, M. Transcription of OsmB, a Gene Encoding an Escherichia coli Lipoprotein, Is Regulated by Dual Signals. Osmotic Stress and Stationary Phase. J. Biol. Chem. 1990, 265, 10574–10581. [Google Scholar] [CrossRef]
  71. Gothel, S.F.; Marahiel, M.A. Peptidyl-Prolyl Cis-Trans Isomerases, a Superfamily of Ubiquitous Folding Catalysts. Cell. Mol. Life Sci. (CMLS) 1999, 55, 423–436. [Google Scholar] [CrossRef]
  72. Ikeda, T.; Oosawa, K.; Hotani, H. Self-Assembly of the Filament Capping Protein, FliD, of Bacterial Flagella into an Annular Structure. J. Mol. Biol. 1996, 259, 679–686. [Google Scholar] [CrossRef] [PubMed]
  73. Waters, R.C.; O’Toole, P.W.; Ryan, K.A. The FliK Protein and Flagellar Hook-Length Control. Protein Sci. 2007, 16, 769–780. [Google Scholar] [CrossRef] [PubMed] [Green Version]
Figure 1. View of the sampling map. The image was produced using Google Earth’s online version.
Microorganisms 10 00890 g001
Figure 2. Growth curves of R. aquatilis strains. Effect induced by the treatment with 4.4% NaCl (light blue) compared to untreated cells (green) in the first 5.5 h and at 24 h of incubation (28 °C in shaking) on the growth (Log10 cfu/mL) of the different bacterial strains: (A) R. aquatilis Ra1; (B) R. aquatilis Ra2; (C) R. aquatilis Ra3; (D) R. aquatilis Ra4. Asterisks and different letters indicate statistically significant differences between controls and salt-treated bacteria (p-value < 0.05).
Microorganisms 10 00890 g002
Figure 3. Growth curves of Serratia plymuthica strains. Effect induced by the treatment with 4.4% NaCl (light blue) compared to untreated cells (green) in the first 5.5 h and at 24 h of incubation (28 °C in shaking) on the growth (Log10 cfu/mL) of the different bacterial strains: (A) Serratia plymuthica Sp1; (B) S. plymuthica Sp2; (C) S. plymuthica Sp3. Asterisks and different letters indicate statistically significant differences between controls and salt-treated bacteria (p-value < 0.05).
Microorganisms 10 00890 g003
Figure 4. Quantification of proteins (concentration µg µL−1) (precipitated from the growth supernatant); Control: bacteria growth for 24 h under shaking in TSB medium at 28 °C; treated cells: bacteria grown in TSB medium added with 4.4% NaCl at 24 h of incubation (28 °C in shaking): (A) Rahnella aquatilis Ra4; (B) Serratia plymuthica Sp2. Different letters indicate statistically significant differences between values in 4.4% NaCl in respect to control (p-value < 0.05).
Microorganisms 10 00890 g004
Figure 5. Principal Component Analysis (PCA) of the protein expression in (A) Rahnella aquatilis Ra4; (B) Serratia plymuthica Sp2, and (C) both bacterial strains grown in TSB medium added with 4.4% NaCl at 24 h of incubation (28 °C in shaking).
Microorganisms 10 00890 g005
Figure 6. Analysis of differential proteins (DPs) in (A) Rahnella aquatilis and (B) Serratia plymuthica, 4.4% NaCl vs. Control (untreated cells). The X-axis represents the protein Log2fold change between the 2 groups; the Y-axis represents −1xlog10 p-value (p-value from t-test). The scattered points stand for each protein. No significant difference is indicated by grey color, significantly up-regulated and down-regulated proteins are indicated by red and green colors, respectively.
Microorganisms 10 00890 g006
Table 1. Characterization of different strains isolated from compared to untreated cells (green) Vicia fava and Pisum sativum nodules.
StrainStrain LabelHost PlantSampling SiteColony Description (YMA)Gram StainingDCP *CAS @IAA §
FV_Fr4BRa1V. favaGenovaSmall colony, round shape, convex elevation, entire margin, mucoid and pinkNegative2.260.003
FV_Fr4C V. favaGenovaSmall colony, round shape, convex elevation, entire margin, mucoid and pinkNegative0.000.00neg
FV_Fr5BRa2V. favaGenovaSmall colony, round shape, convex elevation, entire margin, mucoid with pink coreNegative2.890.001
FV_Fr6A V. favaGenovaRound shape, entire margin, mucoid and orangeNegative0.000.00neg
FV_Fr6B V. favaGenovaSmall colony, round shape, convex elevation, entire margin, mucoid and pinkNegative0.000.000
FV_EB1A_1Sp1V. favaCallianoSmall colony, round shape, convex elevation, entire margin, mucoid with pink coreNegative1.600.002
FV_EB2A_1 V. favaCallianoLarge colony, entire margin, mucoid and pinkNegative2.820.00neg
FV_EB2C_1 V. favaCallianoSmall colony, entire margin, mucoid and dark pink Negative0.000.00neg
FV_EB1B_1Sp2V. favaCallianoSmall colony, round shape, convex elevation, entire margin, mucoid with dark orange coreNegative1.780.001
FV_EB1C_1 V. favaCallianoSmall colony, round shape with a dark orange coreNegative1.750.000
PS_EB1A_1 P. sativumCallianoLarge colony, entire margin, mucoid and pinkNegative3.321.19neg
PS_EB1A_2 P. sativumCallianoLarge colony, entire margin, mucoid and pinkNegative2.000.002
PS_EB1C_1 P. sativumCallianoMucoid, with a dark red coreNegative1.580.00neg
FV_EB2B_1 V. favaCallianoMucoid, with a light pink coreNegative2.970.00neg
FV_VT2B_1Ra3V. favaFrassinetoSmall colony, round shape, convex elevation, entire margin, mucoid with pink coreNegative2.930.002
FV_VT1C_1Sp3V. favaFrassinetoLarge colony, entire margin, mucoid and pinkNegative2.340.000
FV_VT1B_1 V. favaFrassinetoMucoid with a red coreNegative2.900.00neg
PS_EN1B_1 P. sativumDruentoLarge colony, entire margin, mucoid and pinkNegative2.080.001
PS_EN1B_2 P. sativumDruentoLarge colony, entire margin, mucoid and pinkNegative1.800.00neg
PS_EN1A_1 P. sativumDruentoRound shape, smooth, with a dark red coreNegative2.060.001
PS_EN1C_1Ra4P. sativumDruentoLarge colony, entire margin, mucoid with a dark red coreNegative2.730.003
PS_EN2B_1 P. sativumDruentoLarge colony, entire margin, mucoid and pink with a red coreNegative2.941.02neg
* Phosphate solubilization was assessed according to Goldstein (1986) [38], using two different media: one containing dicalcium phosphate (DCP) and one containing tricalcium phosphate (TCP), after 15 days of culture. * DCP: Dicalcium phosphate; @ CAS: Siderophore production was assessed on universal Chrome Azurol S (CAS) agar (Schwyn and Neilands, 1987) [27] after 7 days of culture.; § IAA: Indole-3-Acetic Acid (IAA) production was quantified according to De Brito Alvarez et al. (1995) [28] after 3 days of culture. The values indicate the reaction intensity (0 = no color, 1 = light pink, 2 = pink, 3 = light red, 4 = red). Green background color highlights the selected strains and their characteristics.
Table 2. Identification, growth capabilities, and salt tolerance of the different strains isolated from fava bean and pea nodules.
StrainStrain
Label
BLAST
Identification
Seq. Cov (%) aId
(%) b
Genbank Accesion
Number
4 °C28 °C37 °C42 °CSalt MIC (%)
FV_Fr4BRa1R. aquatilis9999.3MK157042++± §-6.4
FV_Fr5BRa2R. aquatilis9899.1MK156743++±-6.4
FV_VT2B1Ra3R. aquatilis9899.5MK157017++±-6.4
PS_EN1C1Ra4R. aquatilis10099.8OK614097++±-5.8
FV EB 1A1Sp1S. plymuthica9899.5MK156722++±-5.8
FV EB 1B1Sp2S. plymuthica9899.6MK157024++±-6.2
FV VT 1C1Sp3S. plymuthica9899.1MK157016++±-5.8
a BLAST sequence coverage obtained comparing each bacterial 16S rDNA sequence to all the reference sequences available at the NCBI. b BLAST identity results obtained comparing each bacterial 16S rDNA sequence to all the reference sequences available at the NCBI. § the use of the symbol ± stands for limited growth.
Table 3. Intrinsic antibiotic resistance of the different R. aquatilis strains, isolated from fava bean and pea nodules, determined using the disc diffusion method on solid MH medium. Values indicate the halo diameter (mm) (mean and standard errors, n = 3 dishes).
AntibioticRa1I 1I 2I 3Ra2I 1I 2I 3Ra3I 1I 2I 3Ra4I 1I 2I 3
Amoxicillin6.0 ± 0.1 R6.0 ± 0.1 R6.0 ± 0.1 R6.0 ± 0.1 R
Cefepime 6.0 ± 0.1 R6.0 ± 0.1 R8.0 ± 0.1 R6.0 ± 0.1 R
Cefotaxime18.0 ± 0.6 I18.0 ± 0.7 I17.0 ± 0.6 I24.0 ± 0.8 S
Ceftazidime22.0 ± 0.3 S22.0 ± 0.4 S25.0 ± 0.3 S22.0 ± 0.5 S
Chloramphenicol26.7 ± 1.8SS 26.7 ± 1.3SS 24.3 ± 0.3SS 24.0 ± 1.0SS
Ciprofloxacin34.0 ± 0.5 S40.0 ± 0.7 S28.0 ± 0.4 S35.0 ± 0.6 S
Erythromycin8.3 ± 1.8RR 6.3 ± 0.3RR 8.0 ± 0.6RR 6.7 ± 0.3RR
Kanamycin16.3 ± 0.9SS 18.3 ± 0.3SS 19.0 ± 0.6SS 16.3 ± 0.3SS
Meropenem34.0 ± 0.7 S18.0 ± 0.6 I28.0 ± 0.7 S29.0 ± 0.6 S
Neomycin10.3 ± 0.9SS 11.0 ± 0.6SS 11.7 ± 0.3SS 11.3 ± 0.3SS
Piperacillin/Tazobactam23.0 ± 0.5 S22.0 ± 0.6 S27.0 ± 0.6 S24.0 ± 0.7 S
Rifampicin20.0 ± 0.0 S 19.0 ± 0.5 S 21.3 ± 0.7 S 22.3 ± 0.9 S
Streptomycin14.0 ± 1.0SS 16.7 ± 0.7SS 15.3 ± 0.3SS 15.0 ± 0.0SS
Trimetoprim/Sulfametoxazol24.0 ± 0.7 32.0 ± 0.6 28.0 ± 0.6 32.0 ± 0.5
1 Indicates the results interpreted according to Stock et al., 2000 [29], which state that all Rahnella strains are naturally sensitive or intermediate to Chloramphenicol and to aminoglycosides of which Streptomycin, Neomycin, and Kanamycin are part, intrinsically resistant to macrolides of which Erythromycin is part. 2 indicates the results interpreted according to Massa et al., 2000 [24]. An inhibition zone lower than 7 mm was considered as an index of no sensitivity to the tested drug. 3 Indicates the results interpreted according to EUCAST Clinical Breakpoint Tables v. 12. Green background color highlights the selected strains and their characteristics.
Table 4. Intrinsic antibiotic resistance of the different S. plymuthica strains, isolated from fava bean and pea nodules, determined using the disc diffusion method on solid MH medium. Values indicate the halo diameter (mm) (mean and standard errors, n = 3 dishes).
AntibioticSp1I 1I 2Sp2I 1I 2Sp3I 1I 2
Amoxicillin6.0 ± 0.1 R6.0 ± 0.1 R6.0 ± 0.1 R
Cefepime 7.0 ± 0.1 R6.0 ± 0.1 R6.0 ± 0.1 R
Cefotaxime25.0 ± 0.7 S24.0 ± 0.6 S23.0 ± 0.7 S
Ceftazidime22.0 ± 0.3 S23.0 ± 0.3 S19.0 ± 0.5 I
Chloramphenicol17.0 ± 1.7S 17.3 ± 1.8S 24.0 ± 1.0S
Ciprofloxacin45.0 ± 0.5 S44.0 ± 0.4 S36.0 ± 0.6 S
Erythromycin13.0 ± 1.5S 6.0 ± 0.2R 7.0 ± 0.3R
Kanamycin15.3 ± 0.7S 17.3 ± 1.3S 17.7 ± 0.3S
Meropenem24.0 ± 0.5 S25.0 ± 0.6 S25.0 ± 0.6 S
Neomycin12.3 ± 1.5S 9.7 ± 0.9S 11.3 ± 0.3S
Piperacillin/Tazobactam22.0 ± 0.5 S23.0 ± 0.6 S21.0 ± 0.6 S
Rifampicin12.7 ± 1.3S 14.0 ± 1.2S 22.0 ± 1.2S
Streptomycin15.0 ± 1.7S 12.7 ± 1.5S 15.3 ± 0.3S
Trimetoprim/Sulfametoxazol27.0 ± 0.8 32.0 ± 0.6 34.0 ± 0.7
1 indicates the results interpreted according to Massa et al., 2000 [24]. An inhibition zone lower than 7 mm was considered as an index of no sensitivity to the tested drug. 2 Indicates the results interpreted according to EUCAST Clinical Breakpoint Tables v. 12.0. Green background color highlights the selected strains and their characteristics.
Table 5. Antibiotic response of the different strains, isolated from fava bean and pea nodules, determined using Vitek2. The results were interpreted according to EUCAST Clinical Breakpoint Tables v. 12.0.
AntibioticRa1I 1Ra2I 1Ra3I 1Ra4I 1Sp1I 2Sp2I 2Sp3I 2
Amikacin<=8S<=8S<=8S<=8S<=8S<=8S<=8S
Amoxicillin/Clavulanic Acid<=4S<=4S<=4S<=4S<=4S<=4S4S
Cefepime <=1S<=1S<=0.5S<=1S<=1S2I<=1S
Cefotaxime<=0.5S<=0.5S<=0.5S<=0.5S------- ------- ------
Ceftazidime<=0.5S<=0.5S<=0.2S<=0.5S<=0.5S<=0.5S<=0.5S
Ciprofloxacin<=0.2S<=0.2S<=0.1S<=0.2S<=0.2S<=0.2S<=0.2S
Ertapenem<=0.1S<=0.1S<=0.1S<=0.1S<=0.1S<=0.1S<=0.1S
Gentamicin<=2S<=2S<=2S<=2S<=2S<=2S<=2S
Meropenem<=0.1S<=0.1S <=0.1S<=0.1S<=0.1S<=0.1S
Piperacillin/Tazobactam<=4S<=4S<=4S<=4S<=4S<=4S<=4S
Trimetoprim/Sulfametoxazol<=2S<=2S<=2S<=2S<=2S<=2S<=2S
Ampicillin<=2S4S>8R8S4S4S4S
Aztreonam<=1S<=1S<=1S<=1S2I<=1S-------
Colistin<=2S<=2S<=2S<=2S>4R>4R<=2S
Levofloxacin<=0.5S<=0.5S<=0.5S<=0.5S<=0.5S<=0.5S<=0.5S
Piperacillin<=4S<=4S<=4S<=4S<=4S<=4S<=4S
Ticarcillin<=8S<=8S<=8S<=8S<=8S<=8S<=8S
Tigecycline<=0.5S<=0.5S<=0.5S<=0.5S<=0.5S<=0.5S<=0.5S
Tobramycin<=2S<=2S<=2S<=2S<=2S<=2S<=2S
1 Indicates the results interpreted according to Stock et al., 2000 [29], which state that all Rahnella strains are naturally sensitive or intermediate to Chloramphenicol and to aminoglycosides of which Streptomycin, Neomycin, and Kanamycin are part, intrinsically resistant to macrolides of which Erythromycin is part. 2 indicates the results interpreted according to Massa et al., 2000 [24]. An inhibition zone lower than 7 mm was considered as an index of no sensitivity to the tested drug. Green background color highlights the selected strains and their characteristics.
Publisher’s Note: MDPI stays neutral with regard to jurisdictional claims in published maps and institutional affiliations.

