Article

Different Responses of Soil Bacterial and Fungal Communities in Three Typical Vegetations following Nitrogen Deposition in an Arid Desert

1
Xinjiang Key Laboratory of Desert Plant Roots Ecology and Vegetation Restoration, Xinjiang Institute of Ecology and Geography, Chinese Academy of Sciences, Urumqi 830011, China
2
State Key Laboratory of Desert and Oasis Ecology, Key Laboratory of Ecological Safety and Sustainable Development in Arid Lands, Xinjiang Institute of Ecology and Geography, Chinese Academy of Sciences, Urumqi 830011, China
3
Cele National Station of Observation and Research for Desert-Grassland Ecosystems, Cele 848300, China
4
University of Chinese Academy of Sciences, Beijing 100049, China
5
School of Resources and Environment, Linyi University, Linyi 276000, China
6
Department of Soil Science, University of Manitoba, Winnipeg, MB R3T 2N2, Canada
7
Life Science and Technology School, Linnan Normal University, Zhanjiang 524048, China
8
National Engineering Technology Research Center for Desert-Oasis Ecological Construction, Xinjiang Institute of Ecology and Geography, Chinese Academy of Sciences, Urumqi 830011, China
*
Authors to whom correspondence should be addressed.
Microorganisms 2023, 11(10), 2471; https://doi.org/10.3390/microorganisms11102471
Submission received: 5 September 2023 / Revised: 22 September 2023 / Accepted: 29 September 2023 / Published: 1 October 2023
(This article belongs to the Special Issue Advances in Soil Microbiome 2.0)

Abstract

:
The effects of increased nitrogen (N) deposition on desert ecosystems have been extensively studied from a plant community perspective. However, the response of soil microbial communities, which play a crucial role in nutrient cycling, to N inputs and plant community types remains poorly understood. In this study, we conducted a two-year N-addition experiment with five gradients (0, 10, 30, 60, and 120 kg N ha−1 year−1) to evaluate the effect of increased N deposition on soil bacterial and fungal communities in three plant community types, namely, Alhagi sparsifolia Shap., Karelinia caspia (Pall.) Less. monocultures and their mixed community in a desert steppe located on the southern edge of the Taklimakan Desert, Northwest China. Our results indicate that N deposition and plant community types exerted an independent and significant influence on the soil microbial community. Bacterial α-diversity and community dissimilarity showed a unimodal pattern with peaks at 30 and 60 kg N ha−1 year−1, respectively. By contrast, fungal α-diversity and community dissimilarity did not vary significantly with increased N inputs. Furthermore, plant community type significantly altered microbial community dissimilarity. The Mantel test and redundancy analysis indicated that soil pH and total and inorganic N (NH4+ and NO3) levels were the most critical factors regulating soil microbial communities. Similar to the patterns observed in taxonomic composition, fungi exhibit stronger resistance to N addition compared to bacteria in terms of their functionality. Overall, our findings suggest that the response of soil microbial communities to N deposition is domain-specific and independent of desert plant community diversity, and the bacterial community has a critical threshold under N enrichment in arid deserts.

1. Introduction

In recent decades, increased nitrogen (N) fertilizer use and fossil energy consumption have contributed significant amounts of reactive N to the atmosphere, of which 60% is returned to the soil [1,2]. As one of the drivers of global change, N deposition profoundly affects plants and microorganisms in various ecosystems, including deserts [3,4]. Soil microorganisms play a vital role in biogeochemical cycles, plant nutrient uptake, and climate regulation. The differential responses of plants to N deposition at the individual and community levels alter the soil microbial communities by changing litter properties and plant identity, diversity, and root exudates [5,6,7,8]. In this context, ecosystem services provided by soil microorganisms may be profoundly affected [9]. To fully understand the potential influence of global change on soil ecosystems, soil microbial communities need to be investigated under different N deposition and plant community types.
Deserts cover one-third of the global land surface and have a lower critical N load than other ecosystems [10,11,12]. N deposition can affect soil microbial diversity and function by favoring certain nitrogen-use species and suppressing others [13]. This disruption can lead to imbalances in nutrient cycling processes, increasing N leaching and reducing nutrient availability to plants [11], negatively impacting ecosystem productivity, and potentially affecting ecosystem functioning and resilience [3]. A four-year field experiment showed that N deposition significantly altered soil bacterial communities by increasing the abundance of ammonia-oxidizing bacteria and reducing denitrification genes in a desert steppe in Inner Mongolia, China [14]. A recent study conducted in the Gurbantunggut Desert, Northwest China, showed that six-year N additions significantly altered the structure of soil bacterial and fungal community composition by changing soil conditions such as pH [15]. However, in the same desert, two-year N additions slightly affected soil microbial community composition [16]. Similarly, She et al. [17] and Huang et al. [18] reported no significant effect of N deposition on the soil microbial community in the Mu Us Desert, China. These inconsistent results may be due to climate, the amount and duration of N treatment, and initial soil properties [19]. In addition, soil bacterial and fungal communities behave differently when faced with the same environmental changes. Compared to the fungal community, the bacterial community is more tolerant to N deposition in subtropical and arid regions [4,15,20]. These studies suggest that the response of the soil microbial community to N deposition is microbial-domain-specific. Currently, there is no clear understanding of how soil microorganisms respond to N deposition in typical desert plant communities at the southern edge of the Taklamakan Desert in extremely arid areas. In this area, the vegetation consists mainly of deep-rooted plants such as Alhagi sparsifolia Shap. and Karelinia caspia (Pall.) Less.
Previously, we conducted an intercropping experiment with three plant community types (or two diversity levels), namely, A. sparsifolia and K. caspia monocultures and their mixed community [21]. We showed that the microbial biomass C/N in the mixed community (14.1 ± 0.8, mean ± standard deviation) was significantly higher than that in the monoculture communities (8.9 ± 0.6 in A. sparsifolia monoculture and 9.3 ± 0.7 in K. caspia monoculture). This observation suggests that N is a critical limiting factor for the microbial community in this area. Therefore, we hypothesized that (1) increased N inputs will significantly shape the soil microbial community composition by improving microbial species diversity; and (2) this change will be partly attributed to changes in plant community characteristics caused by N deposition, i.e., N deposition interacting with plant community type exerts a significant influence on the soil microbial community. To test the above hypotheses, we used high-throughput sequencing to characterize soil bacterial and fungal communities using a two-year N-addition treatment with five gradients in a desert steppe at the southern edge of the Taklimakan Desert, Northwest China. This study aimed to provide a scientific basis for accurately predicting the response of the soil microbial community to excess N enrichment.

2. Materials and Methods

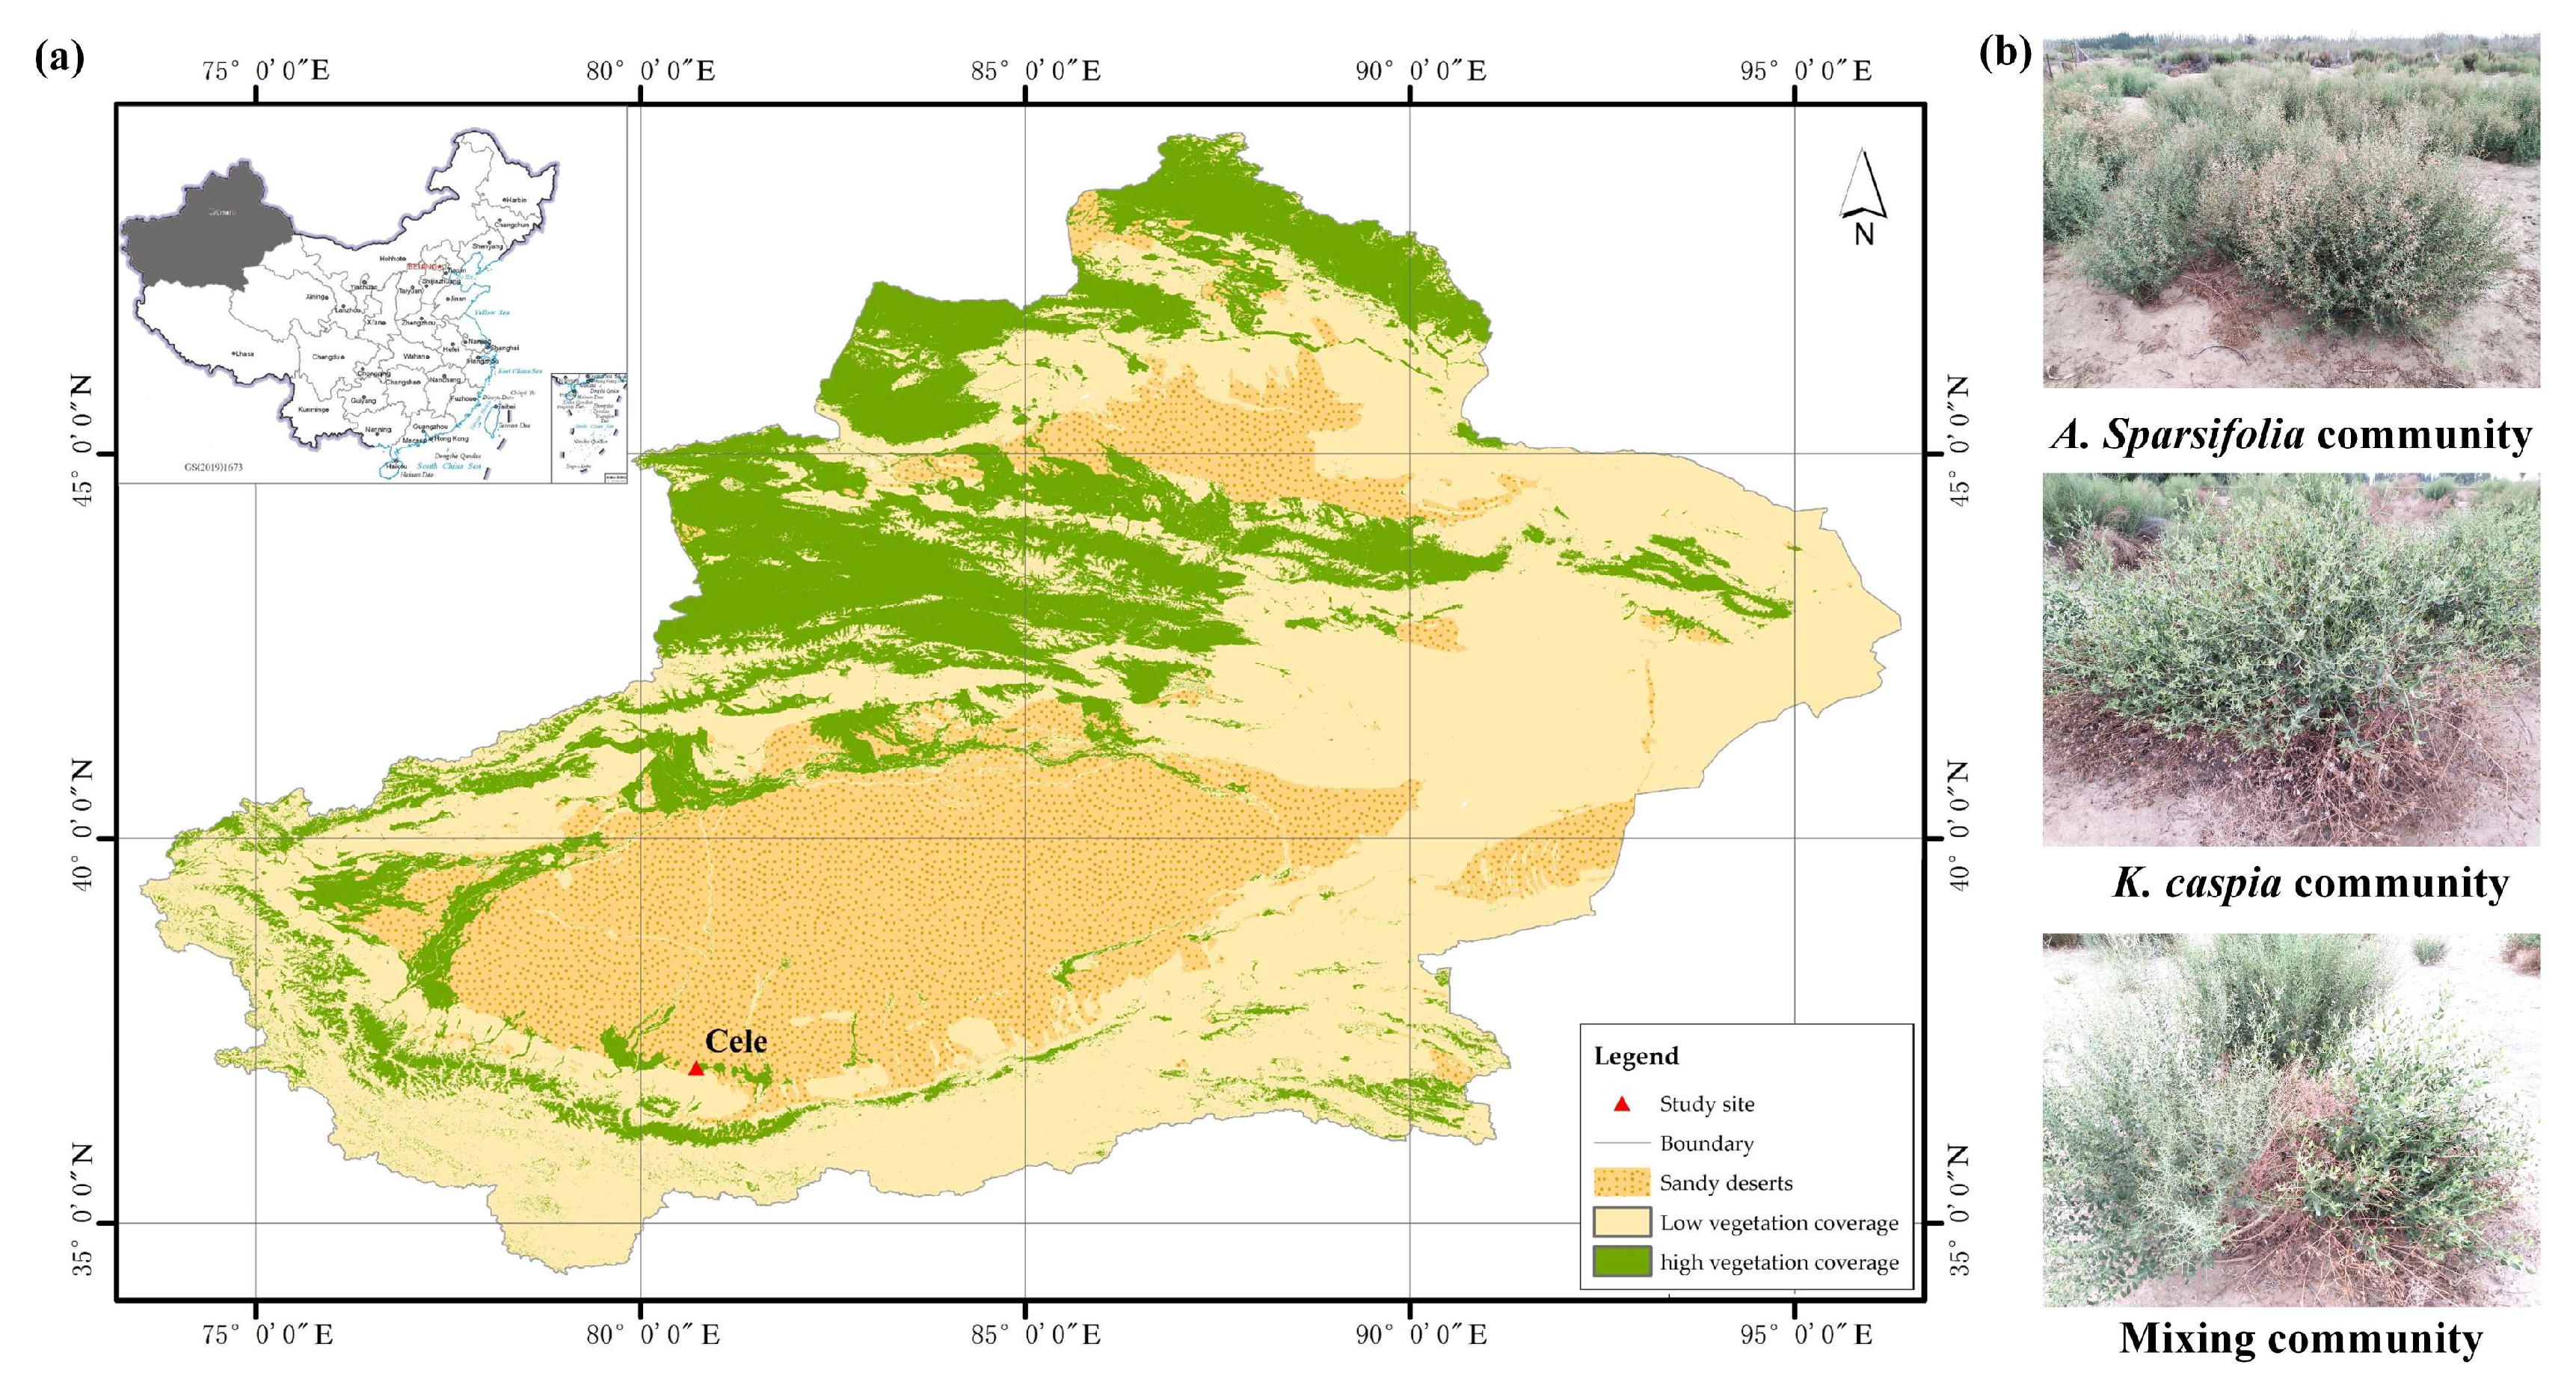
2.1. Site Description

This study was conducted in a desert steppe (80°43′ E, 37°00′ N, 1363 m asl) at the southern edge of the Taklimakan Desert, China, the second-largest drifting desert in the world (Figure 1a). The mean annual temperature, average annual precipitation and potential evaporation in this region are 12.7 °C, 35 mm and 2600 mm, respectively. Rainfall occurs from May to August. The groundwater depth in the study area ranges from 13 to 15 m. The sandy soil has a bulk density of 1.36 g/cm3 [22]. The vegetation is sparsely covered, ranging from 20% to 40%, and dominated by perennial plants. Among these, the most common vegetation types in this area are A. sparsifolia (legume) monoculture, K. caspia (Compositae) monoculture and their mixed communities [23,24]. A. sparsifolia has a height of 0.5–0.9 m, a canopy size of 0.6–1.6 m2, and a rooting depth of 13–15 m. On the other hand, K. caspia has a height of 0.5–0.9 m, a canopy size of 0.6–1.6 m2, and a rooting depth of 3–9 m. Since 1983, this area has been a natural desert steppe and has been fenced off.

2.2. Experimental Design

Urea (CON2H4) has been used to simulate N deposition since May 2019. We applied urea at the levels of 0 (CK),10 (N10), 30 (N30), 60 (N60), and 120 kg N ha−1 year−1 (N120). The natural levels of N deposition at the study site are a considerably low 6.33 kg N ha−1 year−1 [24] and were not considered in this work to explore the influence of N deposition on soil microbial community. The above five N treatments were conducted on A. sparsifolia monoculture, K. caspia monoculture and their mixed communities (Figure 1b), and three 6 m × 6 m repeating plots spaced 3 m apart were set for each treatment. The distances among the three community types are less than 200 m. A total of 45 plots were used, i.e., 3 plant community types × 5 N-addition treatments × 3 duplications. Urea dissolved in 5 L of purified water was evenly sprayed over plots with a hand-held sprayer at the beginning of each month (May to October). By contrast, an equal amount of purified water was sprayed on the control plots. According to weather station monitoring at Cele National Station, about 1 km from our study site, annual precipitations in 2019 and 2020 were 47.2 mm and 63.2 mm, respectively. Before experimental treatment, the properties of soil were as follows: soil organic carbon (SOC), 1.50 g kg−1; total nitrogen (TN), 0.25 g kg−1; nitrate (NO3−N), 19.74 mg kg−1; ammonium (NH4+−N), 3.84 mg kg−1; available nitrogen (AN), 28.87 mg kg−1; available phosphorus (AP), 5.07 mg kg−1; available potassium (AK), 223.61 mg kg−1; and pH, 7.11.

2.3. Soil Sampling

Soil samples (0−20 cm) were collected from each plot on September 20, 2020. Before the collection of soil samples, the litter layer was removed. In each plot, three soil cores were collected along the diagonal, including under-shrub patches and the interspaces (areas between shrubs), and then mixed into one soil sample. Soil samples were passed through a 2 mm sieve to remove roots and stones and then returned to the laboratory in an ice box. The soil samples were divided into three parts. One was air-dried to determine the general soil physical and chemical properties, one was stored at −20 °C to determine mineral N (NH4+−N and NO3−N) contents, and one was kept at −20 °C to analyze soil microbial communities.

2.4. Determination of Soil Properties

Soil physical and chemical properties were determined according to the description of Zhang et al. [4]. Briefly, soil pH and electrical conductivity (EC) were determined using pH and EC meters at a soil/water ratio of 1:2.5 (w/v), respectively. SOC was measured with the K2Cr2O7 oxidation method. NH4+−N and NO3−N contents were extracted with 1 M KCl and then measured with the ultraviolet spectroscopy method. AN was measured with the alkali hydrolyzable method. TN was evaluated using the Kjeldahl method. AP was measured by the molybdate/ascorbic acid method. AK was extracted using NH4OAc and then measured.

2.5. DNA Extraction and Illumina Sequencing

The total DNA was extracted from 0.5 g fresh soil using the DNeasy PowerSoil DNA Isolation Kit (Qiagen, Inc., Venlo, The Netherlands), in accordance with the manufacturer’s protocol. The purity and concentration of the obtained DNA were evaluated using a NanoDrop ND-1000 spectrophotometer (Thermo Fisher Scientific, Waltham, MA, USA). For bacteria, the V3-V4 hypervariable region of the 16S rRNA gene was amplified using the polymerase chain reaction (PCR) primers 338F (5′-ACTCCTACGGGAGGCAGCA-3′)/806R (5′-GGACTACHVGGGTWTCTAAT-3′) [25]. For fungi, the internal transcribed spacer (ITS)1 region was amplified using the PCR primers ITS5 (5′-GGAAGTAAAAGTCGTAACAAGG-3′)/ITS2(5′-GCTGCGTTCTTCATCGATGC-3′) [26]. Sample-specific barcodes were linked to the reverse primers for subsequent amplification. The amplification quality of the PCR products was evaluated by agarose gel electrophoresis. PCR products that met the criteria were then purified and pooled in equal proportions based on DNA concentrations and molecular weight to produce the Illumina® DNA libraries. Paired-end DNA sampling was performed on the Illumina MiSeq System platform (Personal Biotechnology Co., Ltd., Shanghai, China).
For each library, the procedures, including sequence quality control, denoising, splicing, and chimera removal were performed after removing the sequence of unmatched primers in accordance with the DADA2 method [27]. The sequence produced by this method was called amplicon sequence variants (ASVs), which can be used to identify all possible sequences in a sample with great specificity, including those with a single variant. In contrast, the traditional operational taxonomic unit only identifies sequences that are clustered together with a specific degree of similarity [28]. Silva (Release 132) [29] and UNITE (Release 8.0) [30] databases were used to annotate the 16S rRNA and ITS genes, respectively. α-Diversity was assessed with Chao1 index to detect within-sample diversity. The raw data were deposited in the NCBI Sequence Read Archive database under the accession number of PRJNA949150 for bacteria and PRJNA949140 for fungi.

2.6. Statistical Analyses

All data analyses were conducted using R software. Abundance analysis was performed for bacterial phyla (92% of total abundance), bacterial classes (62% of total abundance), fungal phyla (100% of total abundance), and fungal classes (97% of total abundance). One-way analysis of variance (ANOVA) and two-way ANOVA were used to investigate the effects of N additions or/and plant community types on microbial abundance, diversity and soil physicochemical properties. The least significant difference (LSD) was used for multiple comparisons. Venn diagrams were used to show the shared and unique ASVs among different plant communities. Microbial community composition at the ASV level was analyzed by principal coordinate analysis combined with permutational multivariate ANOVA (PERMANOVA) with 999 permutations and assessed using the Mantel test. Given the absence of interaction between N addition and plant community type on microbial community composition, Bray–Curtis community dissimilarity was conducted on these two treatments. Redundancy analysis (RDA) combined with hierarchical partitioning was used to analyze the relationship between microbial community composition and soil physicochemical properties [31]. Pearson correlation among microbial diversity, abundance, and soil properties was calculated and visualized via heatmaps, and p-values were adjusted using the false discovery rate. PIRCUSt was used to predict the soil bacterial function profiles based on KEGG pathways genes. FUNGuild was used to parse fungal communities by ecological guild. The abundance in the top 20 A was subsequently analyzed. Abundances of these predicted functions were investigated by the effects of N additions within each plant community type by ANOVA. The LSD method was performed to conduct multiple comparisons in the case of significant differences.

3. Results

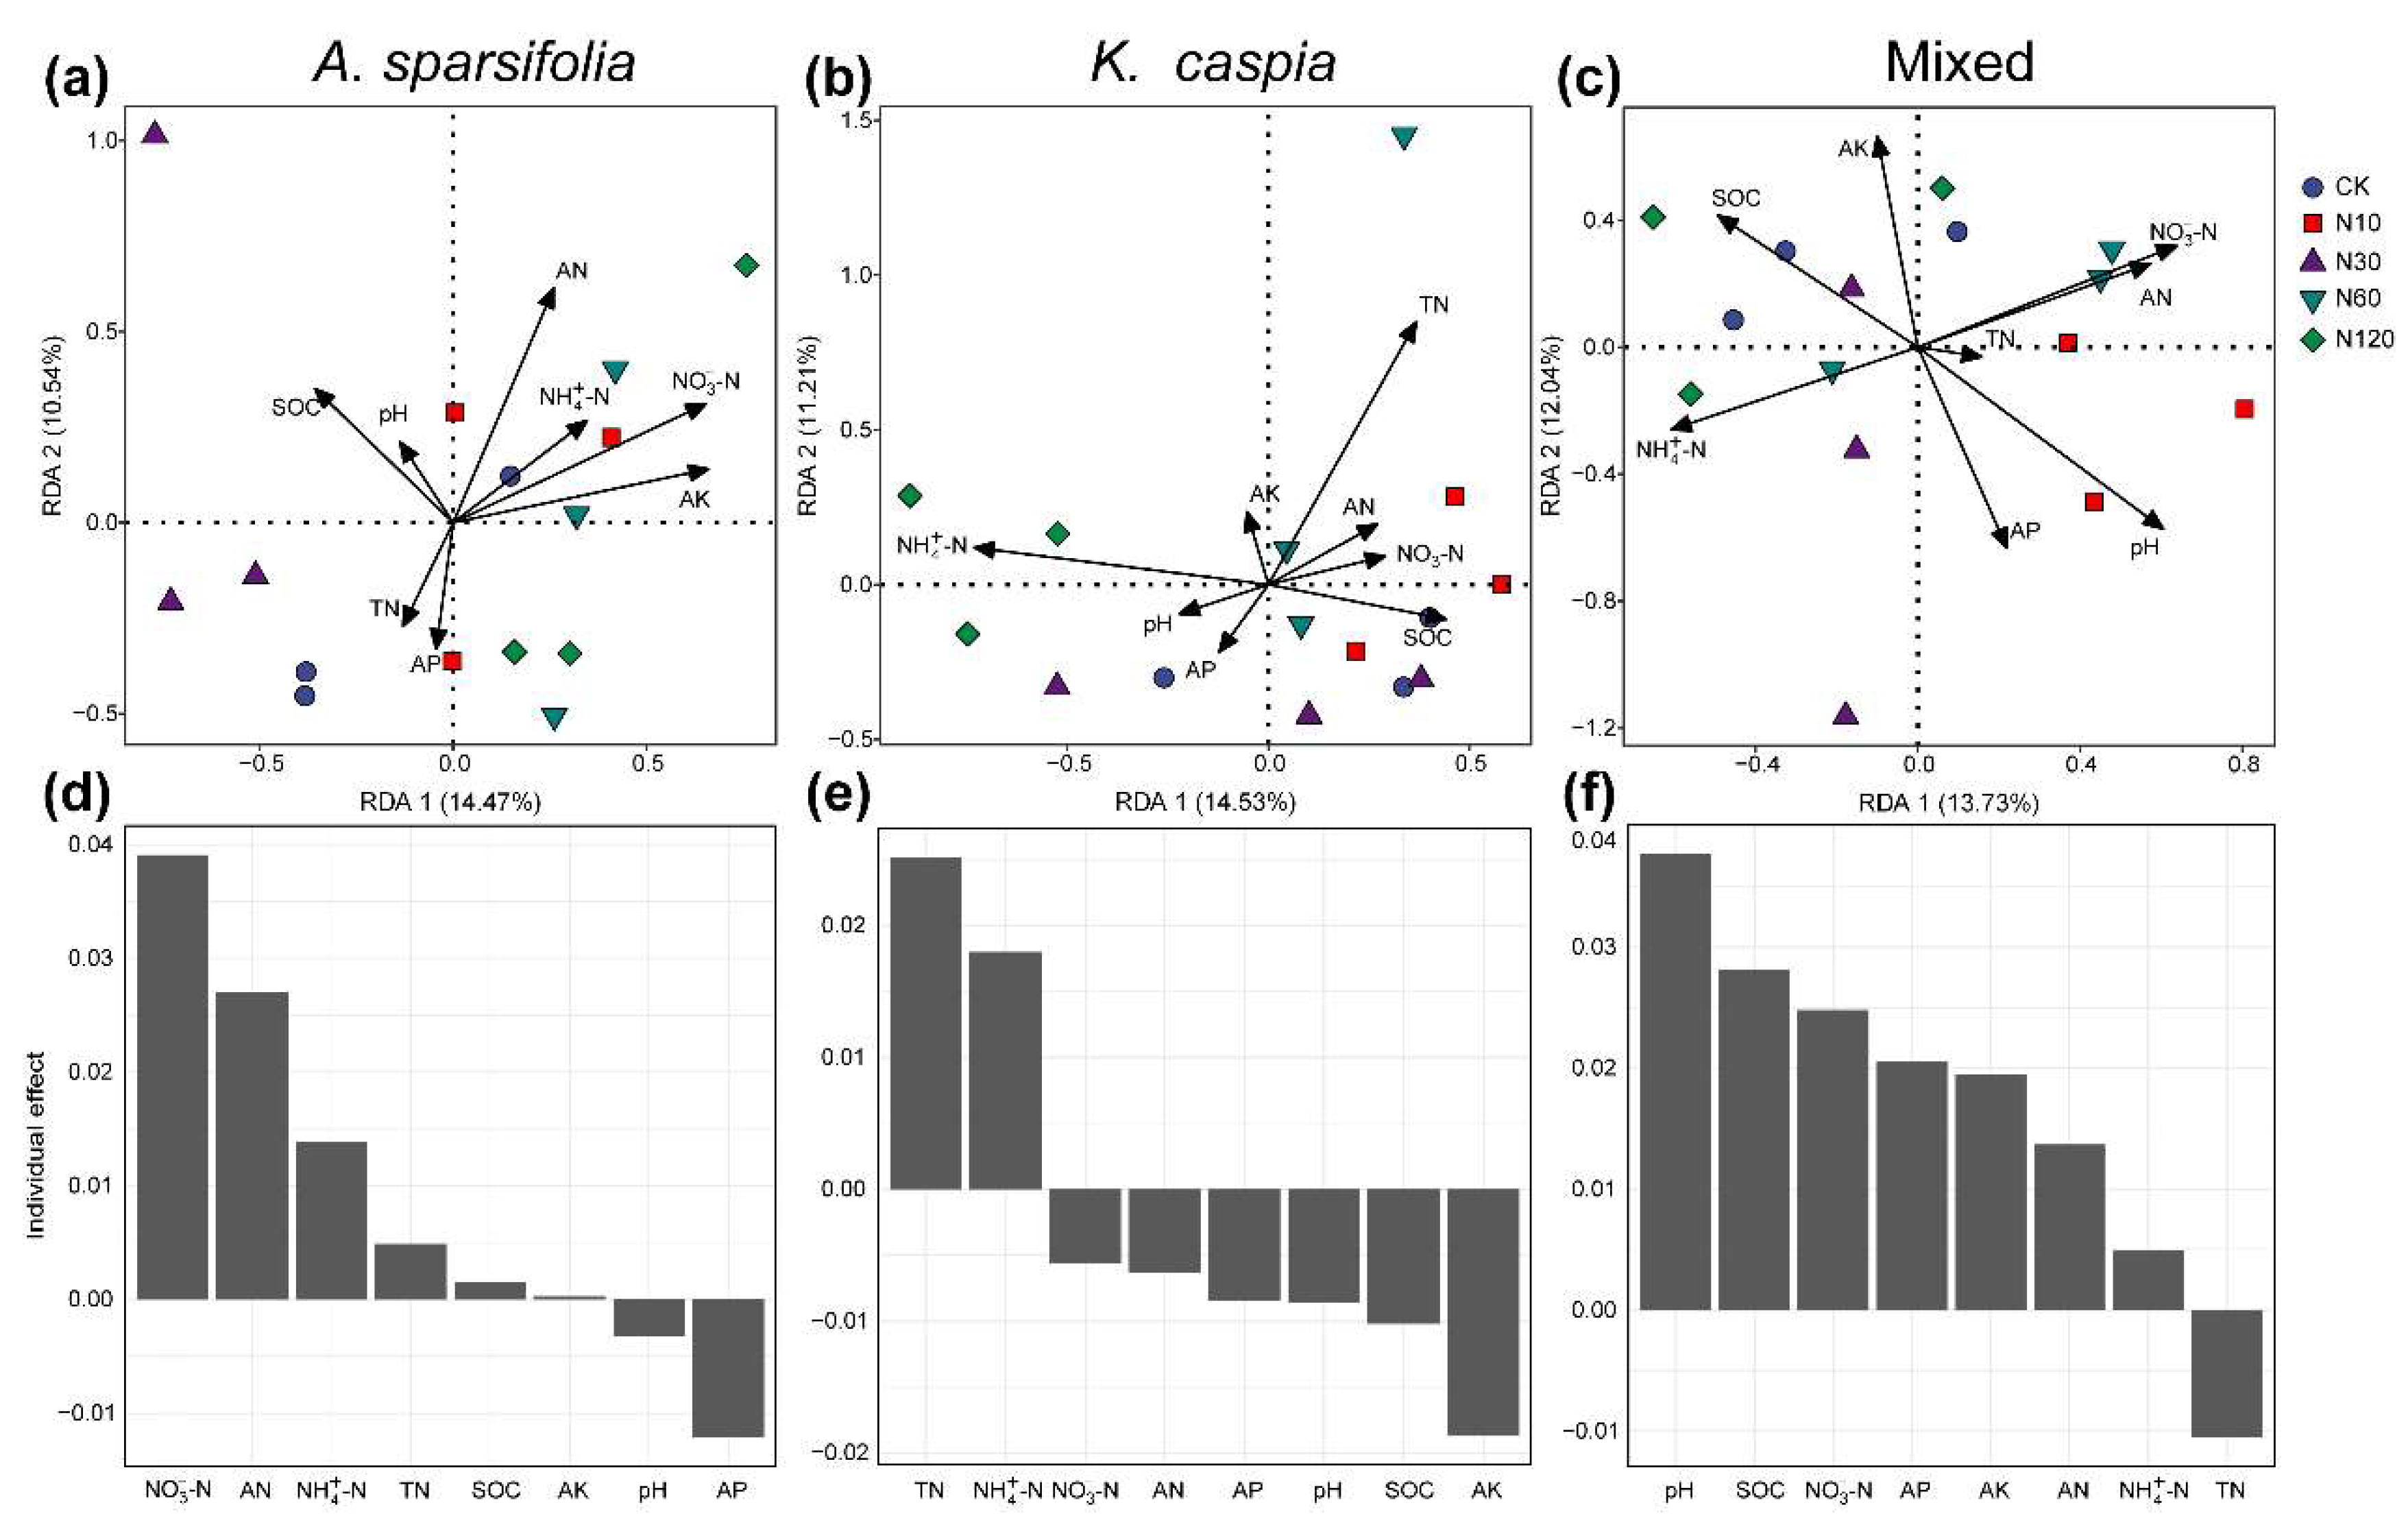
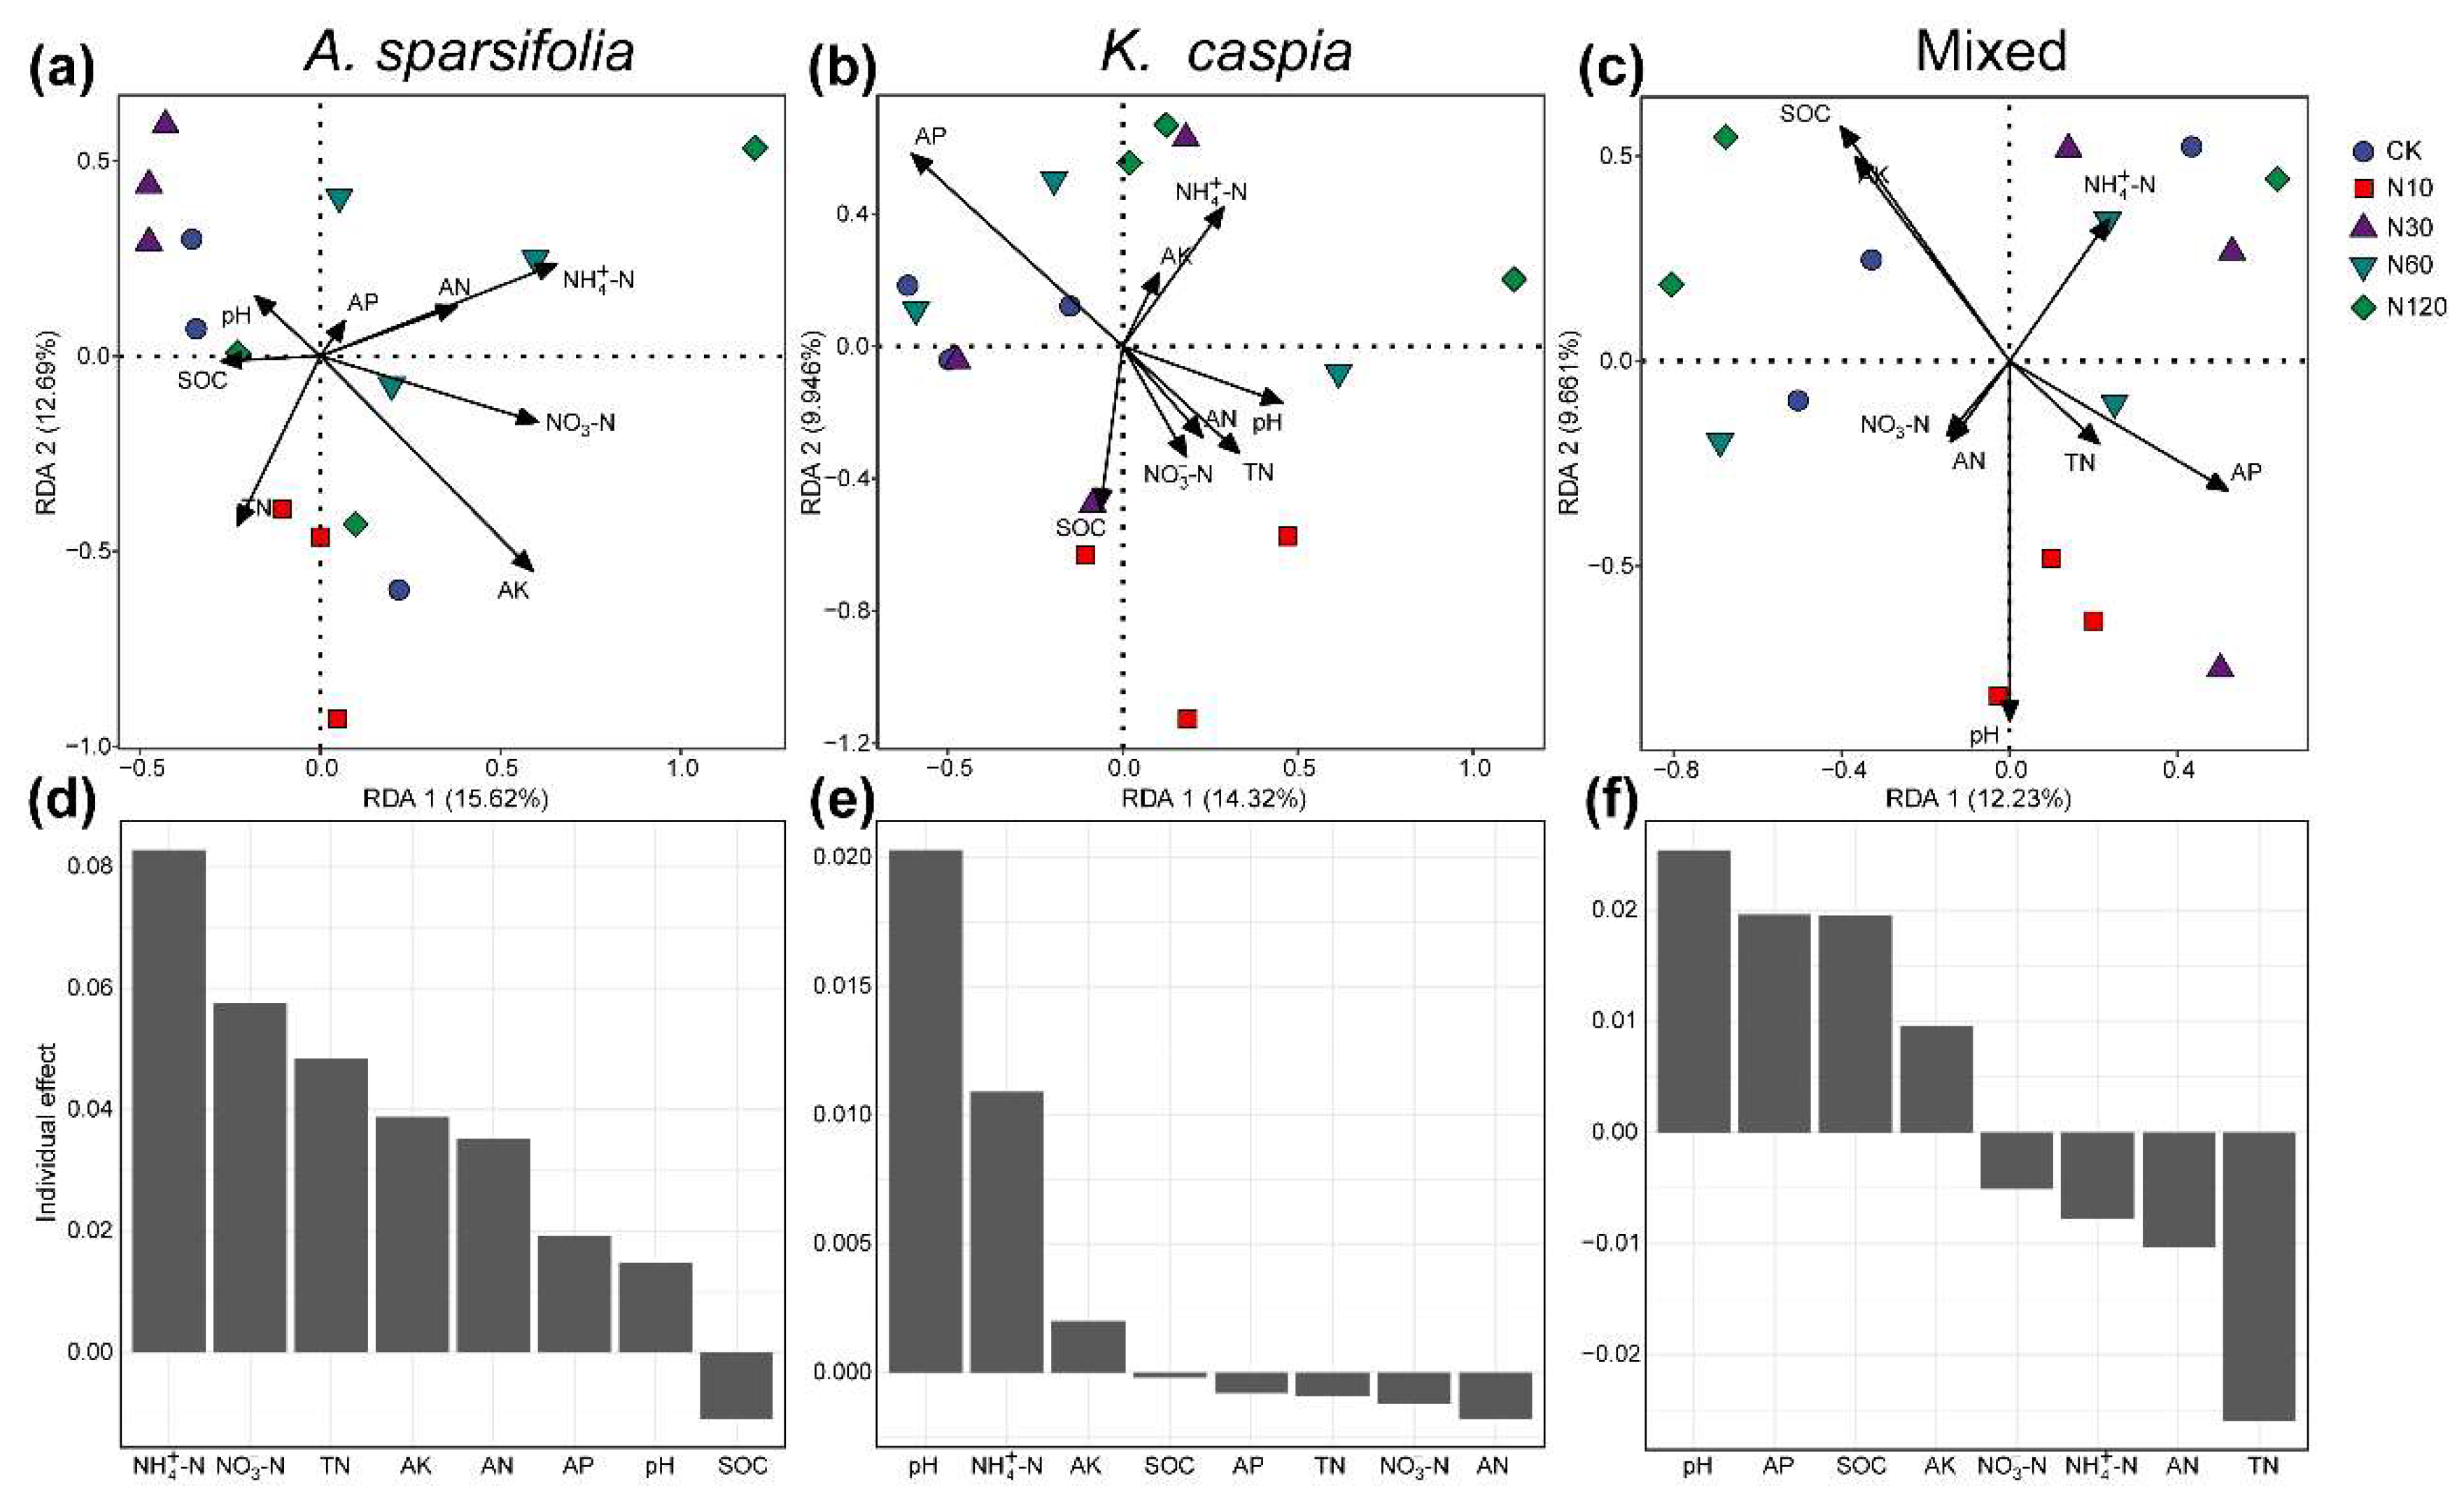
3.1. Soil Properties Affected by N Addition

Soil C, N, P, and pH significantly responded to N-addition treatment, plant community type, and their interaction (Table 1; p < 0.05). The interaction between N addition and plant community type significantly affected TN, SOC, and AP. Soil TN was the highest in the CK of the A. sparsifolia community, whereas in N60 treatment, it was the lowest. The SOC was the highest in the N120-treated K. caspia community, while in the N10 treatment, it was the lowest. Soil AP was the highest in the CK of the A. sparsifolia community, whereas in the N10-treated mixed community, it was the lowest. N addition, but not plant community type, significantly changed the contents of AN, NH4+−N, NO3−N. Soil AN and NO3−N showed a higher level in N60 than in other treatments. The content of NH4+−N was the highest in CK and N120 treatments. Soil pH was significantly influenced by the independent effect of N addition and plant community type. N addition significantly increased pH, and soil pH was significantly lower in the mixed community than in A. sparsifolia and K. caspia communities.

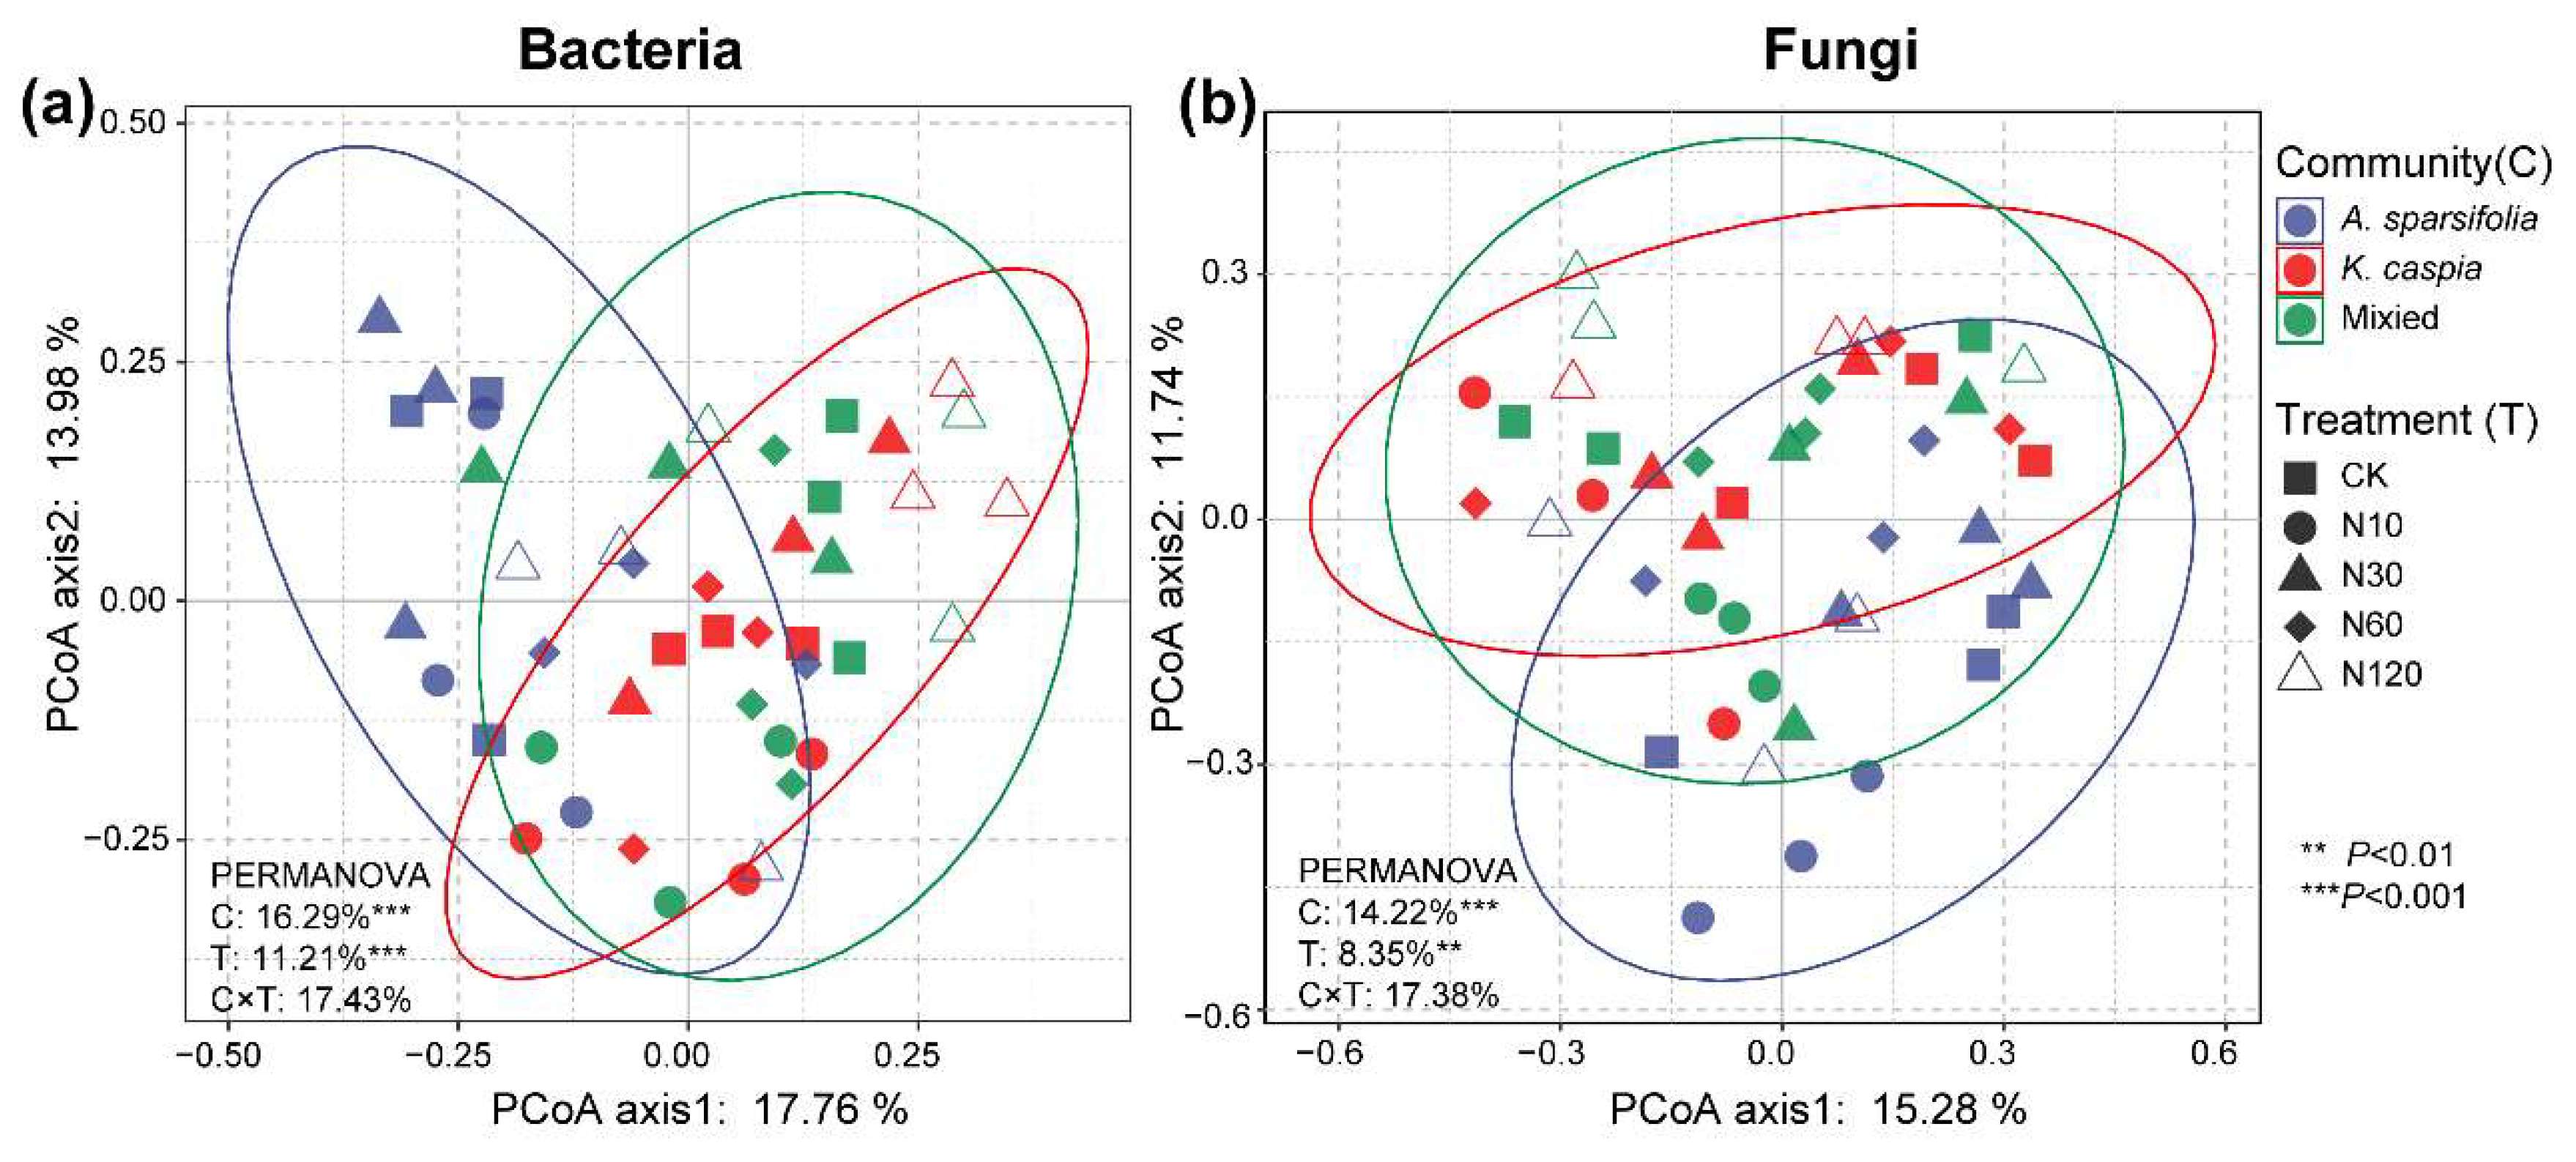
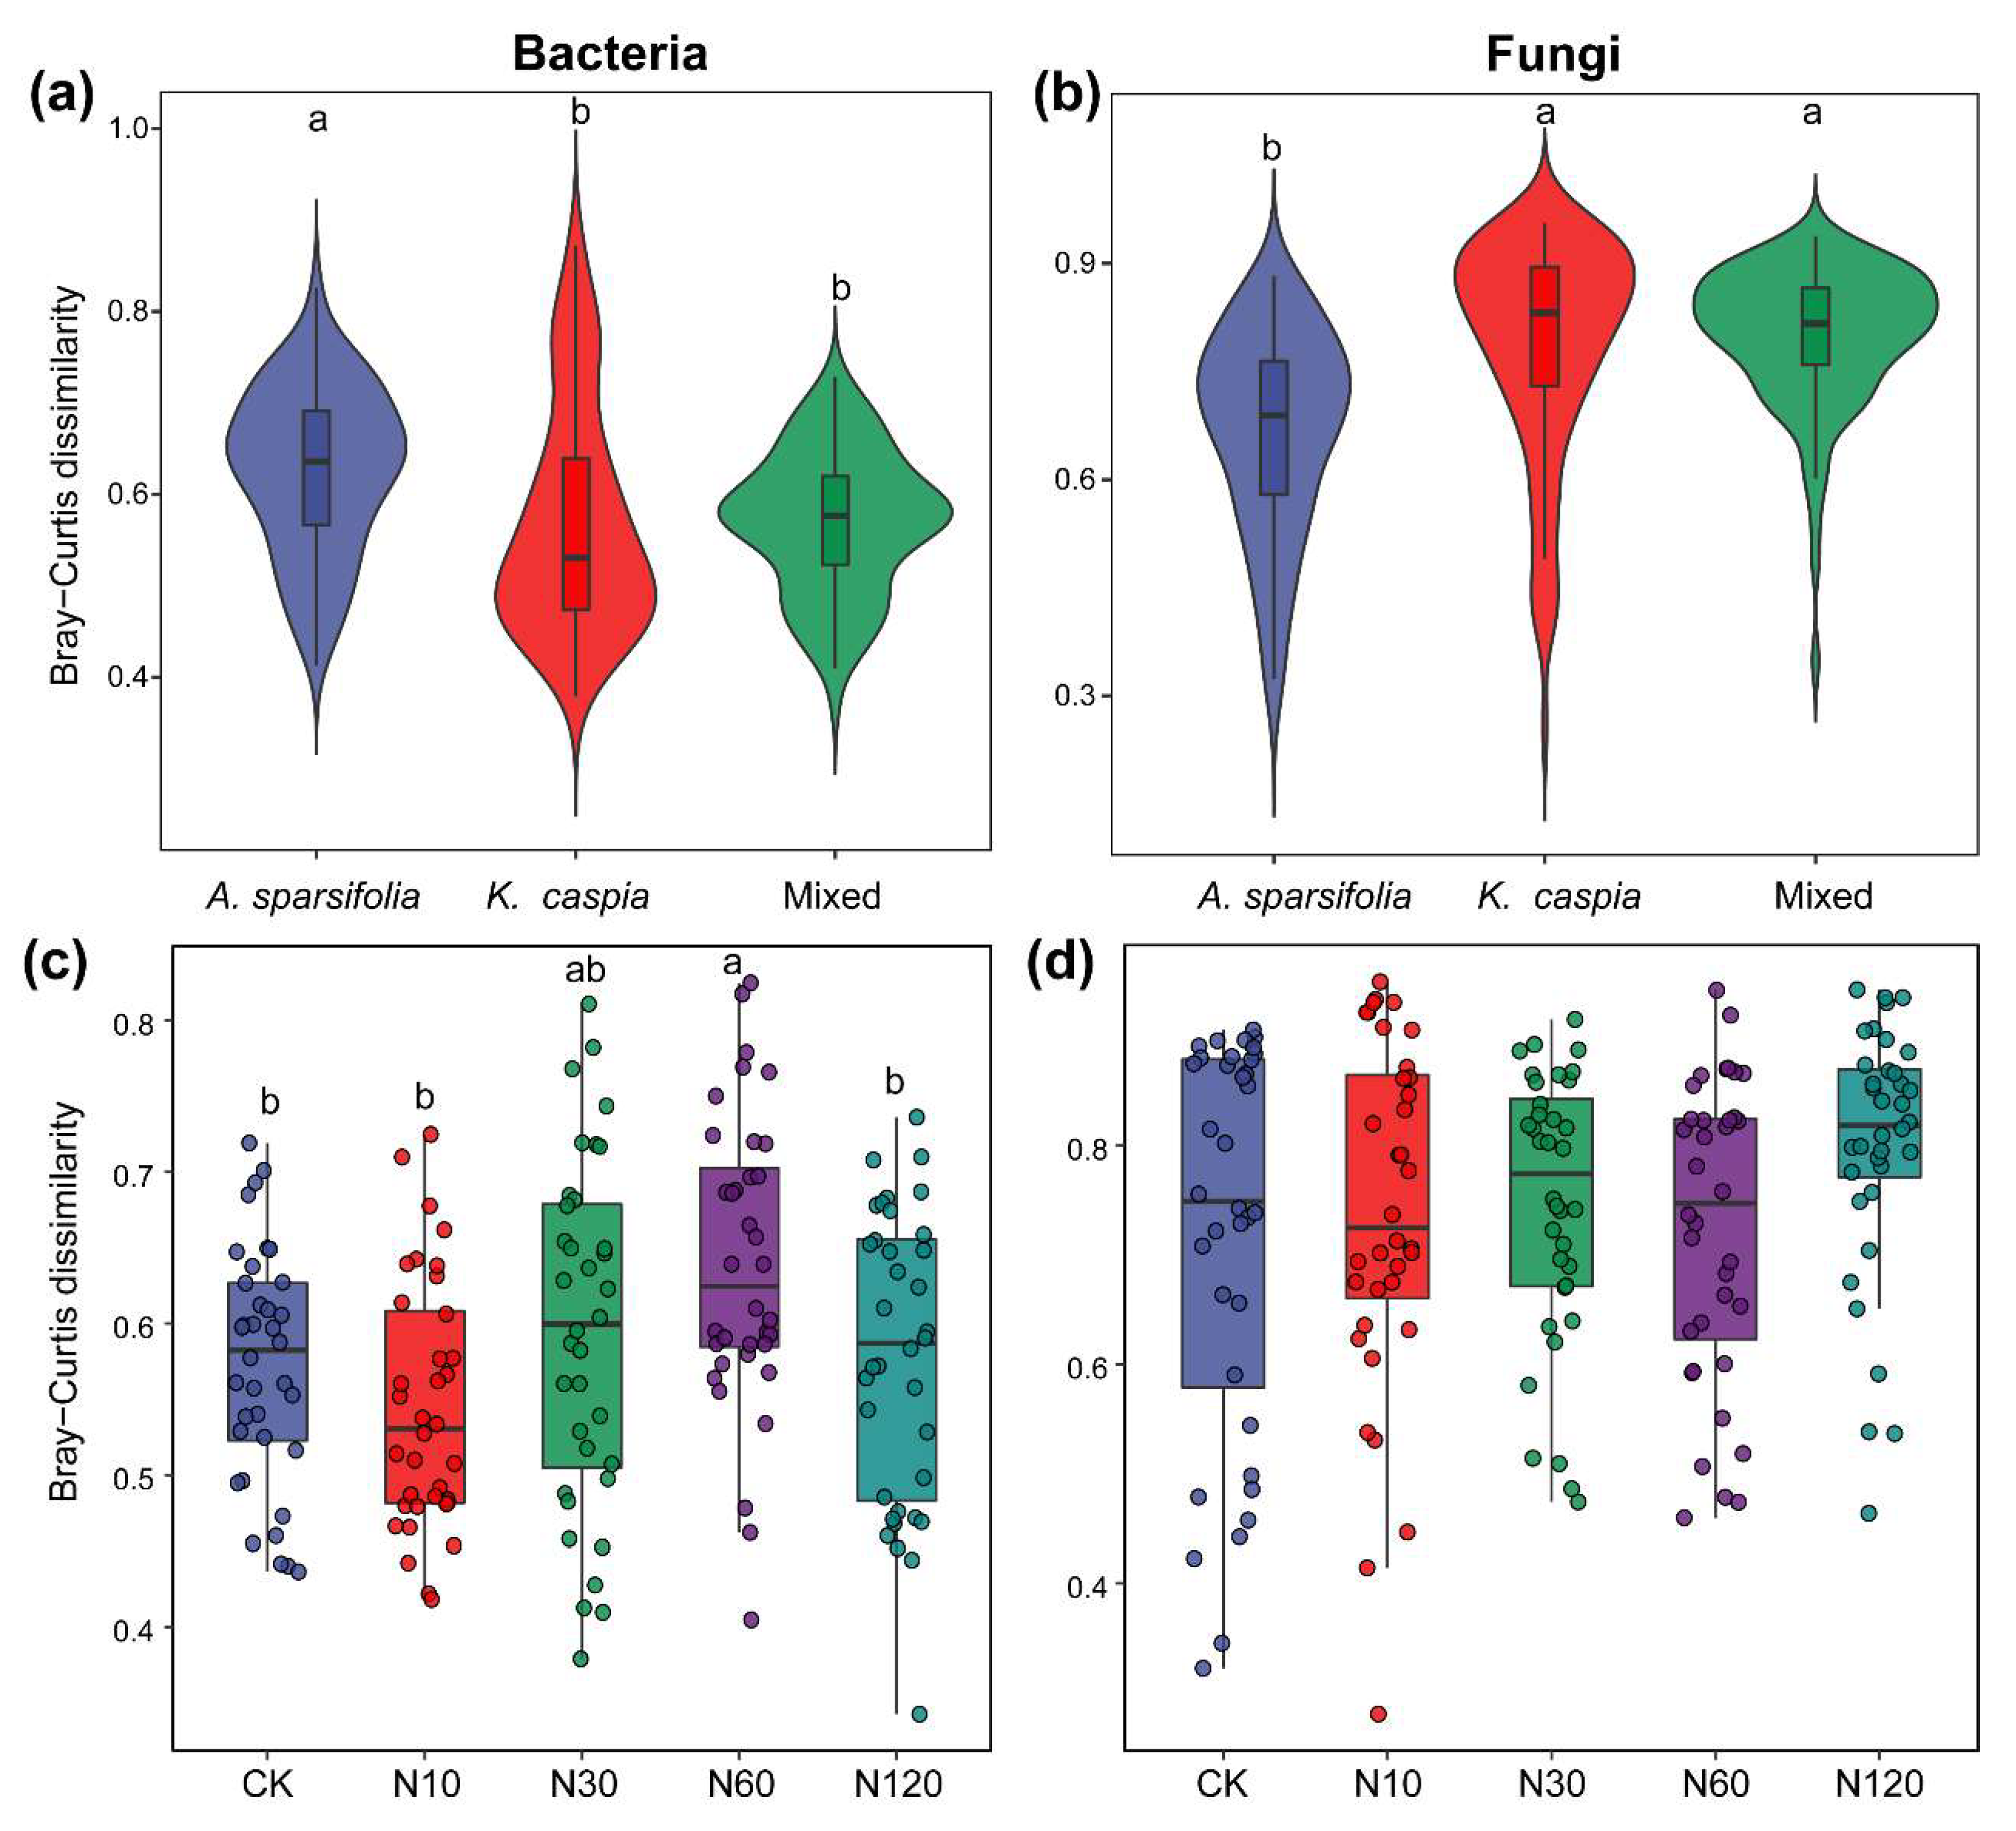
3.2. Soil Bacterial and Fungal Community Composition

High-throughput sequencing of bacterial and fungal samples generated 55,164–105,226 and 42,633–207,089 sequences, respectively, and eventually produced 5224 (bacteria) and 284 (fungi) ASVs (Figure S2). The contribution of N-addition treatment and plant community type to bacterial abundance and α-diversity (estimated by Chao1) was greater than those of fungi (Figure 2). Actinobacteria, Proteobacteria, and Bacteroidetes dominated the bacterial community (Figure 2a). Compared with CK, N addition significantly changed the abundances of phyla Actinobacteria (31.19% reduction under N60), Bacteroidetes (35.72% increase under N60 and 24.95% reduction under N10), Firmicutes (97.77% increase under N60 and 12.01% reduction under N10), Planctomycetes (29.16% increase under N10), Gemmatimonadetes (26.06% increase under N10 and 19.04% reduction under N120), and Chloroflexi (44.18% increase under N10 and 30.16% reduction under N120) (Figure 2a; p < 0.05). Abundances of Alphaproteobacteria and Actinobacteria were significantly reduced by the N60 treatment (Figures S3, S4a and S5; p < 0.05). The A. sparsifolia community showed a significantly lower abundance of phylum Deinococcus-Thermus compared to other community types, while the abundance of Chloroflexia and Deltaproteobacteria was significantly higher in the A. sparsifolia community than in other community types (Figures S6 and S7; p < 0.05). The N60 treatment significantly decreased the abundances of Proteobacteria in the A. sparsifolia and mixed communities, but was not significantly affected by N addition in K. caspia community (Figure S8; p < 0.05). The α-diversity of N30 treatment was the highest in the A. sparsifolia and plant mixed communities (Figure 2c; p < 0.05). Ascomycota dominated the fungal community (Figure 2b). However, fungal α-diversity showed no significant response to N addition in any community type (Figure 2d; p > 0.05).
N addition and plant community type independently and significantly shaped soil bacterial and fungal composition at the ASV level (Figure 3). The PERMANOVA result showed that plant community type (16.29% for bacteria and 14.22% for fungi) contributed more variation to microbial community composition than N addition (11.21% for bacteria and 8.35% for fungi). N addition explained 37.5%, 41.2%, and 35.2% of the variation in bacterial community composition of A. sparsifolia, K. caspia, and mixed communities, respectively (Figure S9a−c; p < 0.05). For fungi, N addition significantly changed the fungal community composition of the A. sparsifolia community, but not those of other plant community types (Figure S9d–f). The dissimilarity of the soil bacterial community in the A. sparsifolia community was significantly greater than that in other plant communities (Figure 4a; p < 0.05). Adversely, the dissimilarity of soil fungal community in the A. sparsifolia community was significantly lower than that in other plant communities (Figure 4b; p < 0.05). In terms of N-addition treatment, a significantly higher dissimilarity of soil bacterial community was observed under the N60 treatment (Figure 4c; p < 0.05). However, no significant difference in the dissimilarity of fungal communities was noted among different N-addition treatments (Figure 4d; p > 0.05).

3.3. Diversity of Soil Bacterial and Fungal Communities

To identify the factors influencing the formation of soil bacterial and fungal communities across three plant communities subject to varying N-addition treatments, we initially examined the correlation between eight soil properties, dominant phyla and classes, and Chao1. Subsequently, we assessed the connection between soil properties and microbial community composition at the ASV level via the Mantel tests, RDA, and variance partitioning analyses (Figure 5, Figure 6 and Figure S10–S12).
The correlation analysis revealed that the α-diversity of bacteria in the mixed community was significantly positively correlated with AP and pH, while it was significantly negatively correlated with AK (Figure S10; p < 0.05), and the α-diversity of fungi in the K. caspia community was significantly negatively correlated with NH4+−N (Figure S10; p < 0.05). Soil C, N, and K levels were significantly correlated with the relative abundance of dominant bacterial phyla (i.e., Firmicutes) and classes (i.e., Bacilli) (Figure S11; p < 0.05). The significant correlation between the abundance of dominant fungal taxa and soil properties was more observed at the class level (Figure S12; p < 0.05).
The Mantel test result showed that pH, AK, and NO3−N were powerful factors that significantly shaped the community composition of soil bacteria in mixed communities (Table S1; Mantel test: >0.308, p < 0.05). Soil NH4+−N and TN explained more variation than any of the other factors in the fungal community composition of A. sparsifolia and K. caspia communities, respectively (Mantel test: >0.254, p < 0.05).
RDA and variance partitioning analyses suggested that soil NO3−N, TN, and pH had the highest individual importance in explaining the variation in the community composition of bacteria in A. sparsifolia, K. caspia, and their mixed communities (Figure 5). Soil NH4+−N had the highest individual effect on the fungal community composition of the A. sparsifolia community (Figure 6c). Soil pH was the strongest determinant of fungal community composition in K. caspia and their mixed communities (Figure 6e,f).

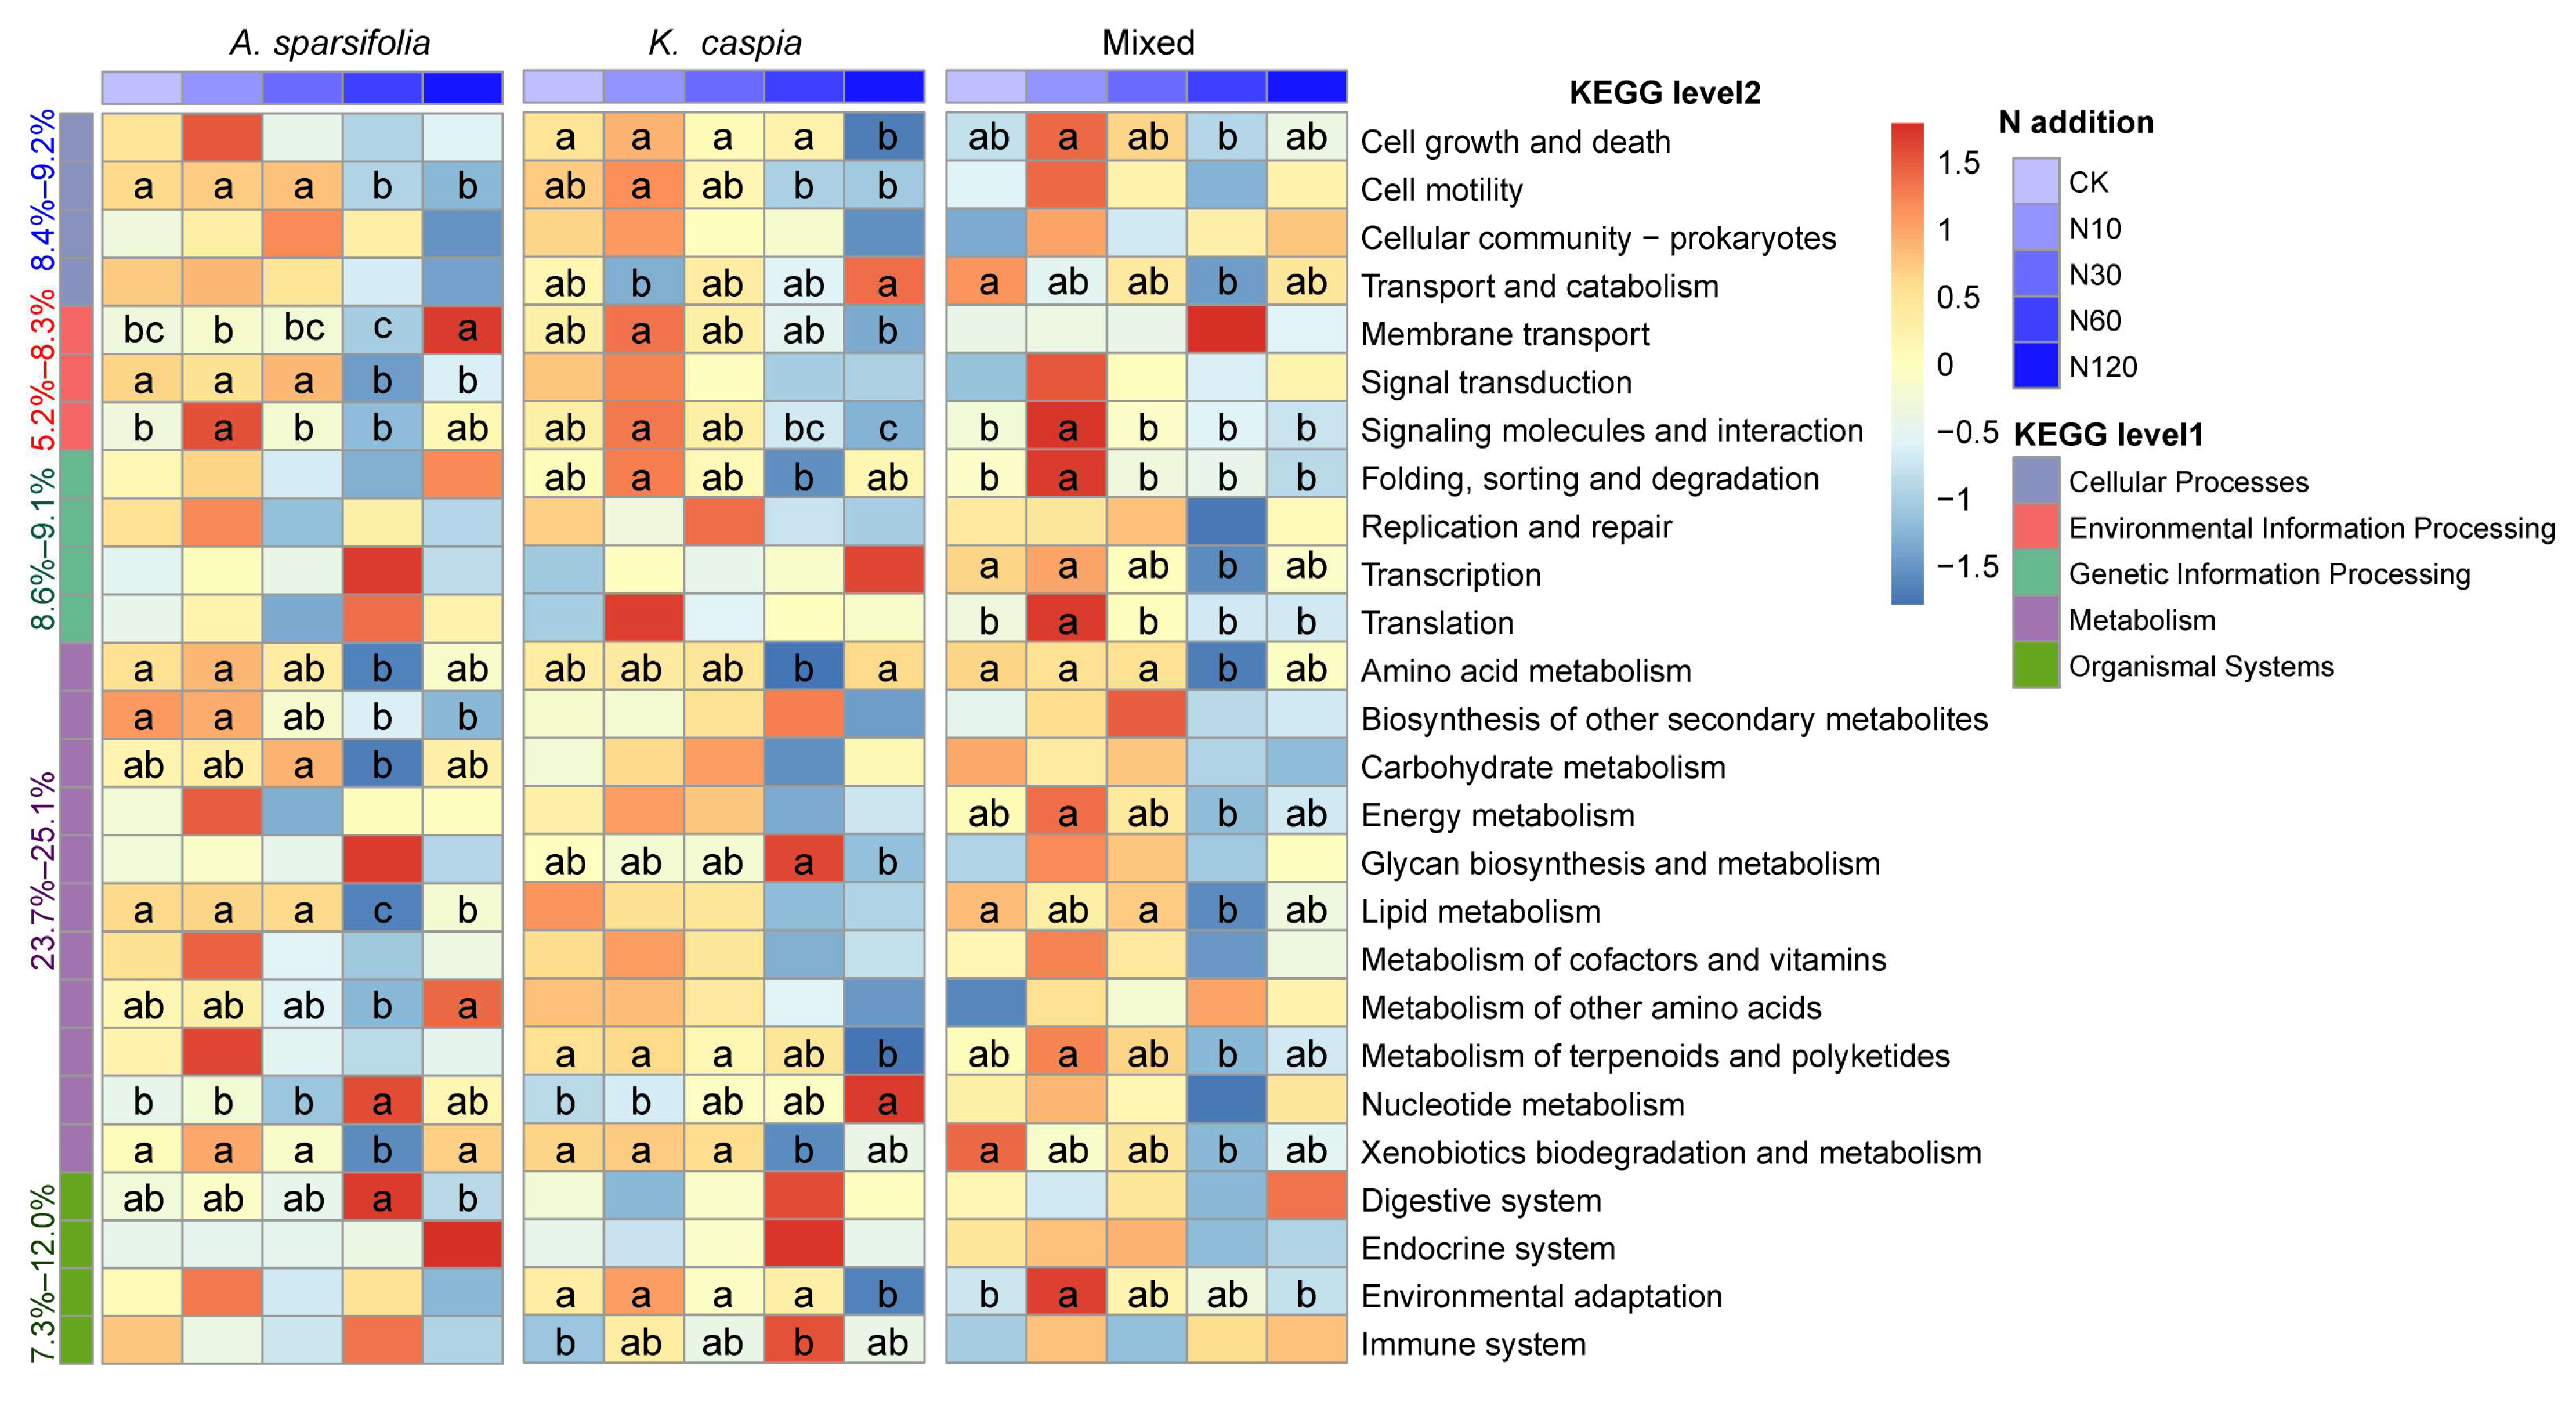
3.4. Function Prediction of Soil Bacterial and Fungal Communities

According to the PICRUSt result for the bacterial community, there were 24 predicted KEGG functional genes whose abundances significantly differed among five N-addition treatments within each plant community (Figure 7, p < 0.05). Of those, the dominant potential function in three plant community types was “metabolism”, accounting for 23.7–25.1%. N addition significantly influenced the abundance of amino acid metabolism and xenobiotics biodegradation and metabolism in three plant community types. In contrast, only three fungal guild abundances significantly differed among N-addition treatments (Figure 8, p < 0.05). Specifically, N addition significantly decreased the abundance of “endophyte-Plant Pathogen-Undefined Saprotroph” in the A. sparsifolia community. However, abundances of “animal endosymbiont-animal pathogen-plant pathogen-undefined saprotroph” and “plant saprotroph-wood saprotroph” were increased by N60 and N10 treatments in the K. caspia community, respectively.

4. Discussion

Numerous studies have investigated the response of soil microbial communities to N deposition or plant community types. However, only a limited number of studies have considered these factors together in desert ecosystems. Our study explored the potential effect of N inputs and plant community type on soil bacterial and fungal community structure in the desert steppe at the southern edge of the Taklimakan Desert. Increased and then decreased bacterial α-diversity and community dissimilarity were observed with increasing N additions, whereas the fungal community was more insensitive, partially supporting our first hypothesis. The independent effects of N deposition and plant community type significantly altered soil microbial community composition, which does not support our second hypothesis. This finding indicates that increased N deposition alters soil microbial community structure, and this effect is independent of plant community types in this region. Soil pH and the form and amount of N are important factors regulating soil microbial community.

4.1. Effects of N Addition on Soil Microbial Community Structure

Given the close relevance of soil microorganisms to biogeochemical cycles, it is important to understand the mechanisms by which soil microbial abundance, diversity and composition respond to environmental changes [20]. Our results revealed a unimodal and domain-specific diversity pattern for the soil microbial community with elevated N deposition in this region. Previous studies have shown that soil bacterial or/and fungal diversity in desert ecosystems is insensitive to elevated N deposition [16,17,32]. In this study, although the community composition of soil bacteria and fungi was significantly affected by N deposition, their diversity and community dissimilarity responded differently. Bacterial diversity and community dissimilarity first significantly increased and then decreased with increasing N deposition rate, whereas fungal diversity was stable under the same environmental conditions (Figure 2c,d and Figure 4c,d). These results indicate that there is a threshold in the response of bacterial diversity and community dissimilarity to N addition, and that fungi in desert soils are more tolerant to N deposition than bacteria. The nonlinear responses of bacterial diversity to N addition can be attributed to the availability of soil resources and competition for resources between bacterial species. Low levels of N addition can alleviate N limitation, promoting bacterial growth and leading to an increase in diversity [33]. As N availability increases, certain bacterial taxa may have competitive advantages over others, leading to dominance and a subsequent decrease in diversity [34,35]. The initial stimulation and subsequent competitive exclusion mechanism may result in a nonlinear response, with diversity peaking at intermediate N levels (Figure 2c). The different responses of bacterial and fungal communities to N addition may reflect their various adaptation strategies in desert habitats. Fungi have better access to soil nutrients through their mycelial network [36], whereas these mycelia may be damaged by an arid environment [37], reducing their sensitivity to resource changes. Alternatively, unchanged fungal diversity and community dissimilarity suggest a frequent association of a core soil fungal microbiome with different N-deposition scenarios, which may play a particularly important role in N-cycle-associated soil functions. The strong fungal community response to N enrichment may occur in long-term experimental treatments.
N addition significantly affected the composition of bacterial and fungal communities (Figure 3), which is consistent with previous studies conducted in other desert steppe ecosystems [3,16,38]. There are several possible explanations for this change before and after N addition. Firstly, previous studies conducted in semi-arid steppes [14] and on a global scale [39] have documented that decreased pH induced by N fertilization plays a vital role in the soil microbial community [38]. Although our Mantel test and RDA also suggested that pH induced by N addition significantly influenced microbial community composition, pH in our case showed an increasing trend after N additions (Table 1 and Table S1; Figure 5 and Figure 6). The up-regulation of pH after N addition may be related to the combined effects of soil type, initial pH, buffering capacity, and the specific form and amount of N added [40,41,42]. For example, urea can accumulate large amounts of ammonium ions in the soil, which combine with water to form ammonium hydroxide, leading to soil alkalinization [43,44]. Secondly, N additions can increase NO3−N content by increasing potential nitrification rates and improving nitrate reductase [14], which can regulate the soil microbial community induced by plant growth under increased soil nutrients (e.g., AN) [4]. Our experiment revealed that the TN level and N form (i.e., NH4+−N and NO3−N) were the main regulators of soil microbial community composition (Figure 5 and Figure 6; Table 1).
The response of copiotrophic bacteria to N addition is different from that of oligotrophic taxa. Copiotrophic bacteria can easily consume liable C with a highly additional N input to support their high intrinsic growth rates, whereas oligotrophic bacteria primarily consume less absorbable C using less nutrients and therefore grow at a slower rate [45]. Our results partially support this hypothesis. In this study, the level of Firmicutes, which belongs to a copiotrophic group, was improved by N addition (N60), whereas those of Actinobacteria and Proteobacteria, which also belong to a copiotrophic group, were significantly decreased under N-addition treatments (Figures S3 and S5). These results suggest that changes in the abundance of copiotrophic and oligotrophic bacteria induced by N addition were inconsistent within each functional group [3]. This finding is supported by two possible explanations: firstly, multiple variables (i.e., soil moisture and vegetation cover) that influence bacterial growth and life histories may lead to the inconsistency of copio-oligotrophic associates at the phylum or class level [46]. Firmicutes are better adapted to extreme environments because they can produce endospores that help tolerate dehydrating conditions [47]. Their abundance was significantly improved by a suitable external N supply (N60 in this study), which likely reduced the abundance of other copiotrophic taxa. Secondly, even within the same phylum, differences in life history and growth can lead to various ecological functions and niches. The phylum Proteobacteria contain numerous functionally diverse taxa, such as Alphaproteobacteria, Gammaproteobacteria, and Deltaproteobacteria. In our study, only Alphaproteobacteria significantly responded to N addition (Figure S5). As a shortcoming of this study, given the short experimental processing time, an extended observation period is needed in the future to clarify the direct and indirect effects of global changes on soil microbial communities in desert ecosystems.

4.2. Effects of Plant Community Types on Soil Microbial Community Structure

Different plant community types may affect soil microbial community structure, thereby affecting their response to nutrient additions [36,48]. However, the small relationship between plant community types and soil microbial diversity has been documented in several studies [45,49]. In our research, plant community types significantly altered soil microbial community composition, but did not affect their diversity (Figure 2c,d and Figure 3b). This finding may be attributed to differences in the quantity and quality of plant-derived resources (e.g., litters and root exudates) in the soil and the resulting differences in soil physical and chemical properties [7]. However, these changes in edaphic factors were insufficient to alter microbial diversity.
Soil pH can regulate the availability of nutrients in soil and is closely related to biogeochemical cycles [50]. In the present study, a lower soil pH was observed in the mixed community than the pure communities (Table 1), which largely contributed to the variation in the composition of soil microbial community in the investigated plant community type (Table 1; Figure 5c,f and Figure 6c,f). This result may be due to three potential mechanisms. Firstly, the differences in nutrient uptake and storage of different plants may affect soil acidity. Different plant species have varying nutrient uptake patterns and requirements [51]. In mixed plant communities, certain species may have higher nutrient demands or preferentially take up specific nutrients from the soil. As plants uptake nutrients, this can result in the depletion of certain ions, such as calcium (Ca) and magnesium (Mg), which are often linked to soil pH-buffering capacity. The extraction of these ions from the soil leads to a reduction in the soil’s pH level. [52]. Secondly, plants in mixed communities contribute different types and quantities of litter to the soil. During the decomposition process of litter, organic acids such as acetic, oxalic, and citric acid are commonly released into the soil, leading to soil acidification and a decrease in pH [53,54,55]. A. sparsifolia or K. caspia may have litters with higher concentrations of these organic acids, leading to a more pronounced effect on soil pH when present in a mixed plant community. Thirdly, in mixed plant communities, intense P deficiency induced by strong competition for N among plant–microbe and microbe–microbe communities can influence soil pH through microbial-mediated processes [56]. When available phosphorus (AP) in soil is insufficient, phosphate solubilizing can dissolve inorganic phosphorus compounds by secreting organic acids (e.g., citramalic acid and salicylic acid) and enzymes, converting them into dissolved phosphorus that can be absorbed and utilized by plants, which induce soil acidity [57]. Our RDA results indicate that AP is the second most important factor affecting the soil fungal community (Figure 5c,f). Such findings can be expected given the critical role of fungi in desert soil P cycle [58]. Furthermore, soil bacteria diversity showed a significantly positive correlation with pH and AP in the mixed community, although the bacterial diversity was slightly affected by plant community types (Figure 2d and Figure S9).
Plant community characteristics (e.g., cover and plant identity) can influence the abundance of certain bacterial groups. Class Chloroflexia includes phototrophic bacteria, and their abundance is the best predictor of soil N content [59]. Our result revealed a significantly higher Chloroflexia abundance in the A. sparsifolia community than in other community types (Figure S8). The difference can be attributed to the higher transmittance under the shrub due to the smaller leaf area and thinner canopy [60], as well as the biological N fixation by legume A. sparsifolia [61].
Except for the fungal community in the K. caspia monoculture community, the edaphic factors influencing soil bacterial and fungal community composition differed in various plant community types (Table 1; Figure 5 and Figure 6). These results suggest that soil microbial communities and the biogeochemical cycles they mediate (e.g., nitration and organic matter decomposition) may be modified by plant community types in a desert steppe. Consequently, perennial desert plant community types can indirectly shape the soil microbial community via soil pH and nutrient availability. However, further investigations involved with higher levels of diversity and exploration of litter properties are necessarily separating their direct and indirect effects on soil microbial community.
In our research area, the influence of sandstorms on topsoil texture and rainfall events on ephemeral plants were uncertainties impairing the experimental results (e.g., the potential interaction between N additions and plant community types). Our subsequent experiments will systematically explore the effects of N deposition and plant community types on soil microbial communities under more refined and controlled conditions. Although several flaws should be optimized in our future research, our present study revealed that the response of soil microbial communities to N deposition is domain-specific and independent of desert plant community diversity. The bacterial community has a critical threshold under different N scenarios in an arid desert.

4.3. Effects of N Addition and Plant Community Types on the Function of Soil Microbial Community

The enrichment of N in soil changed the structure of the soil microbial community and inevitably caused a variation in soil microbial community function. Our prediction showed that N addition substantially altered bacterial function profiles within each plant community type (Figure 7). However, only three fungal functional guilds were markedly influenced by N addition (Figure 8). These findings were consistent with the variation in their taxonomic abundance and community composition (Figure 2 and Figure 4).
Amino acids have significant roles not only as integral constituents of proteins but also in numerous essential physiological processes. Furthermore, they act as precursors for various secondary metabolites and possess crucial functions such as plant signaling, stress defense, and interaction with other organisms [62]. In this study, the N-addition rate of 60 kg N ha−1 year−1 (N60) may damage the above processes of microorganisms and be independent of the type of plant community in which they are located (Figure 7). The pathways involved in nucleotide metabolism play a significant role in aiding soil bacteria to adapt to environmental stress conditions. The upregulation of this gene abundance under N60 and N120 conditions suggests that future N enrichment is expected to harm the adaptability of bacteria to extreme habitats [63]. Saprotrophic fungi are crucial contributors to the process of decomposition because they possess the ability to break down the lignocellulose matrix found in the litter. In our study, the N addition rate of 10 kg N ha−1 year−1 (N10) significantly upregulated the abundance of genes associated with “plant saprotroph–wood saprotroph”, which was consistent with the previous study [15].
Similar to the findings on the taxonomic composition, the fungal functionality exhibits stronger resistance to N addition than bacteria. This trend is also confirmed by the previous research [64]. To investigate the soil microbial function profiles in the desert steppe under N addition, further research is required that employs metagenomic, transcriptomic, proteomic, or metabolomic data.

5. Conclusions

Our study revealed that short-term N addition and different types of plant communities independently and significantly shaped the composition of soil bacterial and fungal communities via changes in soil pH and nutrient content. With the increase in the N-deposition rate, bacterial diversity and community dissimilarity showed a unimodal pattern. By contrast, N deposition did not affect fungal dominant phyla and classes, diversity, and community dissimilarity. This insensitivity may contribute to the buffering of desert steppe ecosystems against environmental changes. Plant community types did not exert statistical influence on soil microbial diversity, whereas soil pH and TN and AN content significantly affected soil microbial community composition. Fungal functionality demonstrates a greater resistance to N addition than bacteria, similar to the patterns observed in taxonomic composition. Our findings suggest that N deposition and plant community types regulate soil microbial communities through noninteractive pathways in this desert steppe ecosystem. This understanding will enhance our ability to predict the response of plant and microbial communities to the future state of N deposition and global climate change in desert steppe ecosystems.

Supplementary Materials

The following supporting information can be downloaded at https://www.mdpi.com/article/10.3390/microorganisms11102471/s1. Figure S1: Venn diagram shows the number (percentage) bacterial (a) and fungal (b) ASVs specific to and common to the three plant community types; Figure S2: Phyla significantly affected by N treatment (p < 0.05). Different lowercase letters indicate a significant difference among different N addition treatments; Figure S3: Community composition of bacteria (a) and fungi (b) at class level (top 10); Figure S4: The classes significantly affected by N treatment (p < 0.05). Different lowercase letters indicate a significant difference among different N addition treatments; Figure S5: The classes significantly affected by plant community type (p < 0.05). Different lowercase letters indicate a significant difference among different N addition treatments; Figure S6: The relative abundance of Deinococcus-Thermus. Different lowercase letters indicate a significant difference among different plant communities; Figure S7: The relative abundance of Proteobacteria. Different lowercase letters indicate a significant difference among different plant communities; Figure S8: Principal coordinate analysis (PCoA) of the bacterial (a, b, c) and fungal (d, e, f) communities based on the Bray-Curtis distance of ASV. Permutational analysis of variance (PERMANOVA) shows the effects of N addition treatment on the Bray-Curtis distance of ASVs; Figure S9: Pearson correlation between α-diversity (Chao1) of bacterial (a) and fungal (b) communities and soil properties. Asterisks indicate significant relationships (p < 0.05). SOC, soil organic carbon; AP, available phosphorus; AK, available potassium; TN, total nitrogen; NO3−N, nitrate; NH4+−N, ammonium; AN, available nitrogen; Figure S10: Pearson correlation between the relative abundance of bacterial dominant phyla and classes and soil properties. Asterisks indicate significant relationships. SOC, soil organic carbon; AP, available phosphorus; AK, available potassium; TN, total nitrogen; NO3−N, nitrate; NH4+−N, ammonium; AN, available nitrogen. Figure S11: Pearson correlation between the relative abundance of fungal dominant phyla and classes and soil properties. Asterisks indicate significant relationships. SOC, soil organic carbon; AP, available phosphorus; AK, available potassium; TN, total nitrogen; NO3−N, nitrate; NH+4−N, ammonium; AN, available nitrogen; Table S1: Mantel test analysis between community composition of soil bacteria and fungi and soil physicochemical properties in three plant communities.

Author Contributions

B.Z., Y.W. and F.Z. conceived the experimental design. Z.Z., X.C. and B.Z. conducted the field measurement, sampling, and data analysis. Z.Z. and B.Z. wrote the manuscript. B.L., G.T. and X.G. revised the manuscript. All authors have read and agreed to the published version of the manuscript.

Funding

This study was supported by the National Key Research and Development Program of China (2022YFF1302505-03), the Youth Innovation Promotion Association Foundation of the Chinese Academy of Sciences (2020435), the Project for Cultivating High-Level Talent of Xinjiang Institute of Ecology and Geography, Chinese Academy of Sciences (E0502101), Shandong Province College Youth Innovation Technology Support Program (2020KJE009), Natural Science Foundation of Xinjiang Uygur Autonomous Region (2022D01B213), the Third Batch of Tianshan Talents Program of Xinjiang Uygur Autonomous Region (2021–2023), and the Tianchi Doctor Project of Xinjiang Uygur Autonomous Region.

Data Availability Statement

The data presented in this study are available on request from the corresponding author. The data are not available to the public due to the data management requirements of the Chinese Academy of Sciences.

Acknowledgments

We thank Ruixue Jin for assisting in the Cele Station fieldwork. We are also grateful to the anonymous referees for reviewing this manuscript.

Conflicts of Interest

The authors declare that they have no competing interests.

References

  1. Galloway, J.N.; Winiwarter, W.; Leip, A.; Leach, A.M.; Bleeker, A.; Erisman, J.W. Nitrogen Footprints: Past, Present and Future. Environ. Res. Lett. 2014, 9, 115003. [Google Scholar] [CrossRef]
  2. Galloway, J.N.; Townsend, A.R.; Erisman, J.W.; Bekunda, M.; Cai, Z.; Freney, J.R.; Martinelli, L.A.; Seitzinger, S.P.; Sutton, M.A. Transformation of the Nitrogen Cycle: Recent Trends, Questions, and Potential Solutions. Science 2008, 320, 889–892. [Google Scholar] [CrossRef]
  3. Grant, T.; Sethuraman, A.; Escobar, M.A.; Vourlitis, G.L. Chronic Dry Nitrogen Inputs Alter Soil Microbial Community Composition in Southern California Semi-Arid Shrublands. Appl. Soil Ecol. 2022, 176, 104496. [Google Scholar] [CrossRef]
  4. Zhang, Z.; Tariq, A.; Zeng, F.; Graciano, C.; Sun, F.; Chai, X.; Ahmed, Z. Nitrogen and Water Addition Regulate Fungal Community and Microbial Co-Occurrence Network Complexity in the Rhizosphere of Alhagi Sparsifolia Seedlings. Applied Soil Ecology 2021, 164, 103940. [Google Scholar] [CrossRef]
  5. Li, C.; Liu, L.; Zheng, L.; Yu, Y.; Mushinski, R.M.; Zhou, Y.; Xiao, C. Greater Soil Water and Nitrogen Availability Increase C : N Ratios of Root Exudates in a Temperate Steppe. Soil Biol. Biochem. 2021, 161, 108384. [Google Scholar] [CrossRef]
  6. Ma, S.; De Frenne, P.; Boon, N.; Brunet, J.; Cousins, S.A.O.; Decocq, G.; Kolb, A.; Lemke, I.; Liira, J.; Naaf, T.; et al. Plant Species Identity and Soil Characteristics Determine Rhizosphere Soil Bacteria Community Composition in European Temperate Forests. FEMS Microbiol. Ecol. 2019, 95, fiz063. [Google Scholar] [CrossRef] [PubMed]
  7. Santonja, M.; Rancon, A.; Fromin, N.; Baldy, V.; Hättenschwiler, S.; Fernandez, C.; Montès, N.; Mirleau, P. Plant Litter Diversity Increases Microbial Abundance, Fungal Diversity, and Carbon and Nitrogen Cycling in a Mediterranean Shrubland. Soil Biol. Biochem. 2017, 111, 124–134. [Google Scholar] [CrossRef]
  8. Zhang, Z.; Chai, X.; Tariq, A.; Zeng, F.; Graciano, C.; Li, X.; Ullah, A. Coordinated Patterns in the Allocation, Composition, and Variability of Multiple Elements Among Organs of Two Desert Shrubs Under Nitrogen Addition and Drought. J. Soil Sci. Plant Nutr. 2022, 22, 47–58. [Google Scholar] [CrossRef]
  9. Zhou, Z.; Wang, C.; Luo, Y. Meta-Analysis of the Impacts of Global Change Factors on Soil Microbial Diversity and Functionality. Nat. Commun. 2020, 11, 3072. [Google Scholar] [CrossRef] [PubMed]
  10. Brooks, M.L. Effects of Increased Soil Nitrogen on the Dominance of Alien Annual Plants in the Mojave Desert: Nitrogen Effects on Alien Annual Plants. J. Appl. Ecol. 2003, 40, 344–353. [Google Scholar] [CrossRef]
  11. Fenn, M.E.; Allen, E.B.; Weiss, S.B.; Jovan, S.; Geiser, L.H.; Tonnesen, G.S.; Johnson, R.F.; Rao, L.E.; Gimeno, B.S.; Yuan, F.; et al. Nitrogen Critical Loads and Management Alternatives for N-Impacted Ecosystems in California. J. Environ. Manag. 2010, 91, 2404–2423. [Google Scholar] [CrossRef]
  12. Laity, J. Deserts and Desert Environments; Wiley: Blackwell, UK, 2009. [Google Scholar]
  13. Sun, R.; Wang, F.; Hu, C.; Liu, B. Metagenomics Reveals Taxon-Specific Responses of the Nitrogen-Cycling Microbial Community to Long-Term Nitrogen Fertilization. Soil Biol. Biochem. 2021, 156, 108214. [Google Scholar] [CrossRef]
  14. Wang, Z.; Na, R.; Koziol, L.; Schellenberg, M.P.; Li, X.; Ta, N.; Jin, K.; Wang, H. Response of Bacterial Communities and Plant-Mediated Soil Processes to Nitrogen Deposition and Precipitation in a Desert Steppe. Plant Soil 2020, 448, 277–297. [Google Scholar] [CrossRef]
  15. Zhang, X.; Song, X.; Wang, T.; Huang, L.; Ma, H.; Wang, M.; Tan, D. The Responses to Long-Term Nitrogen Addition of Soil Bacterial, Fungal, and Archaeal Communities in a Desert Ecosystem. Front. Microbiol. 2022, 13, 1015588. [Google Scholar] [CrossRef] [PubMed]
  16. Huang, G.; Li, L.; Su, Y.; Li, Y. Differential Seasonal Effects of Water Addition and Nitrogen Fertilization on Microbial Biomass and Diversity in a Temperate Desert. CATENA 2018, 161, 27–36. [Google Scholar] [CrossRef]
  17. She, W.; Bai, Y.; Zhang, Y.; Qin, S.; Feng, W.; Sun, Y.; Zheng, J.; Wu, B. Resource Availability Drives Responses of Soil Microbial Communities to Short-Term Precipitation and Nitrogen Addition in a Desert Shrubland. Front. Microbiol. 2018, 9, 186. [Google Scholar] [CrossRef] [PubMed]
  18. Huang, J.; Xu, Y.; Yu, H.; Zhu, W.; Wang, P.; Wang, B.; Na, X. Soil Prokaryotic Community Shows No Response to 2 Years of Simulated Nitrogen Deposition in an Arid Ecosystem in Northwestern China. Env. Microbiol. 2021, 23, 1222–1237. [Google Scholar] [CrossRef]
  19. Dai, Z.; Su, W.; Chen, H.; Barberán, A.; Zhao, H.; Yu, M.; Yu, L.; Brookes, P.C.; Schadt, C.W.; Chang, S.X.; et al. Long-Term Nitrogen Fertilization Decreases Bacterial Diversity and Favors the Growth of Actinobacteria and Proteobacteria in Agro-Ecosystems across the Globe. Glob Change Biol. 2018, 24, 3452–3461. [Google Scholar] [CrossRef] [PubMed]
  20. Wang, J.; Shi, X.; Zheng, C.; Suter, H.; Huang, Z. Different Responses of Soil Bacterial and Fungal Communities to Nitrogen Deposition in a Subtropical Forest. Sci. Total Environ. 2021, 755, 142449. [Google Scholar] [CrossRef] [PubMed]
  21. Tariq, A.; Sardans, J.; Peñuelas, J.; Zhang, Z.; Graciano, C.; Zeng, F.; Olatunji, O.A.; Ullah, A.; Pan, K. Intercropping of Leguminous and Non-Leguminous Desert Plant Species Does Not Facilitate Phosphorus Mineralization and Plant Nutrition. Cells 2022, 11, 998. [Google Scholar] [CrossRef]
  22. Zhang, B.; Zeng, F.; Gao, X.; Shareef, M.; Zhang, Z.; Yu, Q.; Gao, Y.; Li, C.; Yin, H.; Lu, Y.; et al. Groundwater Depth Alters Soil Nutrient Concentrations in Different Environments in an Arid Desert. Front. Environ. Sci. 2022, 10, 939382. [Google Scholar] [CrossRef]
  23. Wu, Y.; Gao, X.; Liu, X.; Wen, Z.; Liu, J.; Li, X.; Zeng, F. Comparison of Nitrogen Deposition between Two Ecosystems in the Southern Edge of Tarim Basin. Atmos. Environ. 2023, 293, 119452. [Google Scholar] [CrossRef]
  24. Zhang, Z.; Tariq, A.; Zeng, F.; Graciano, C.; Zhang, B. Nitrogen Application Mitigates Drought-Induced Metabolic Changes in Alhagi Sparsifolia Seedlings by Regulating Nutrient and Biomass Allocation Patterns. Plant Physiol. Biochem. 2020, 155, 828–841. [Google Scholar] [CrossRef]
  25. Claesson, M.J.; O’Sullivan, O.; Wang, Q.; Nikkilä, J.; Marchesi, J.R.; Smidt, H.; de Vos, W.M.; Ross, R.P.; O’Toole, P.W. Comparative Analysis of Pyrosequencing and a Phylogenetic Microarray for Exploring Microbial Community Structures in the Human Distal Intestine. PLoS ONE 2009, 4, e6669. [Google Scholar] [CrossRef] [PubMed]
  26. White, T.J.; Bruns, T.; Lee, S.; Taylor, J. Amplification and Direct Sequencing of Fungal Ribosomal Rna Genes for Phylogenetics. In PCR Protocols; Elsevier: Amsterdam, The Netherlands, 1990; pp. 315–322. ISBN 978-0-12-372180-8. [Google Scholar]
  27. Callahan, B.J.; McMurdie, P.J.; Rosen, M.J.; Han, A.W.; Johnson, A.J.A.; Holmes, S.P. DADA2: High-Resolution Sample Inference from Illumina Amplicon Data. Nat. Methods 2016, 13, 581–583. [Google Scholar] [CrossRef] [PubMed]
  28. Callahan, B.J.; McMurdie, P.J.; Holmes, S.P. Exact Sequence Variants Should Replace Operational Taxonomic Units in Marker-Gene Data Analysis. ISME J. 2017, 11, 2639–2643. [Google Scholar] [CrossRef] [PubMed]
  29. Quast, C.; Pruesse, E.; Yilmaz, P.; Gerken, J.; Schweer, T.; Yarza, P.; Peplies, J.; Glöckner, F.O. The SILVA Ribosomal RNA Gene Database Project: Improved Data Processing and Web-Based Tools. Nucleic Acids Res. 2012, 41, D590–D596. [Google Scholar] [CrossRef] [PubMed]
  30. Kõljalg, U.; Nilsson, R.H.; Abarenkov, K.; Tedersoo, L.; Taylor, A.F.S.; Bahram, M.; Bates, S.T.; Bruns, T.D.; Bengtsson-Palme, J.; Callaghan, T.M.; et al. Towards a Unified Paradigm for Sequence-Based Identification of Fungi. Mol. Ecol. 2013, 22, 5271–5277. [Google Scholar] [CrossRef]
  31. Lai, J.; Zou, Y.; Zhang, J.; Peres-Neto, P.R. Generalizing Hierarchical and Variation Partitioning in Multiple Regression and Canonical Analyses Using the Rdacca.Hp R Package. Methods Ecol. Evol. 2022, 13, 782–788. [Google Scholar] [CrossRef]
  32. Sha, M.; Xu, J.; Zheng, Z.; Fa, K. Enhanced Atmospheric Nitrogen Deposition Triggered Little Change in Soil Microbial Diversity and Structure in a Desert Ecosystem. Glob. Ecol. Conserv. 2021, 31, e01879. [Google Scholar] [CrossRef]
  33. Li, J.; Xie, J.; Zhang, Y.; Dong, L.; Shangguan, Z.; Deng, L. Interactive Effects of Nitrogen and Water Addition on Soil Microbial Resource Limitation in a Temperate Desert Shrubland. Plant Soil 2022, 475, 361–378. [Google Scholar] [CrossRef]
  34. Liu, W.; Jiang, L.; Yang, S.; Wang, Z.; Tian, R.; Peng, Z.; Chen, Y.; Zhang, X.; Kuang, J.; Ling, N.; et al. Critical Transition of Soil Bacterial Diversity and Composition Triggered by Nitrogen Enrichment. Ecology 2020, 101, e03053. [Google Scholar] [CrossRef]
  35. Nie, Y.; Wang, M.; Zhang, W.; Ni, Z.; Hashidoko, Y.; Shen, W. Ammonium Nitrogen Content Is a Dominant Predictor of Bacterial Community Composition in an Acidic Forest Soil with Exogenous Nitrogen Enrichment. Sci. Total Environ. 2018, 624, 407–415. [Google Scholar] [CrossRef] [PubMed]
  36. Manzoni, S.; Schimel, J.P.; Porporato, A. Responses of Soil Microbial Communities to Water Stress: Results from a Meta-analysis. Ecology 2012, 93, 930–938. [Google Scholar] [CrossRef] [PubMed]
  37. Navarro-Ródenas, A.; Lozano-Carrillo, M.C.; Pérez-Gilabert, M.; Morte, A. Effect of Water Stress on in Vitro Mycelium Cultures of Two Mycorrhizal Desert Truffles. Mycorrhiza 2011, 21, 247–253. [Google Scholar] [CrossRef] [PubMed]
  38. Zhu, Y.; Yu, K.; Wu, Q.; Cheng, X.; Li, Z.; Wang, Z.; Zhao, M.; Wilkes, A.; Bisselling, T.; Han, G.; et al. Seasonal Precipitation and Soil Microbial Community Influence Plant Growth Response to Warming and N Addition in a Desert Steppe. Plant Soil 2022, 482, 245–259. [Google Scholar] [CrossRef]
  39. García-Palacios, P.; Vandegehuchte, M.L.; Shaw, E.A.; Dam, M.; Post, K.H.; Ramirez, K.S.; Sylvain, Z.A.; de Tomasel, C.M.; Wall, D.H. Are There Links between Responses of Soil Microbes and Ecosystem Functioning to Elevated CO2, N Deposition and Warming? A Global Perspective. Glob Change Biol. 2015, 21, 1590–1600. [Google Scholar] [CrossRef] [PubMed]
  40. Hong, S.; Gan, P.; Chen, A. Environmental Controls on Soil pH in Planted Forest and Its Response to Nitrogen Deposition. Environ. Res. 2019, 172, 159–165. [Google Scholar] [CrossRef] [PubMed]
  41. Xiao, K.; Yu, L.; Xu, J.; Brookes, P.C. pH, Nitrogen Mineralization, and KCl-Extractable Aluminum as Affected by Initial Soil pH and Rate of Vetch Residue Application: Results from a Laboratory Study. J. Soils Sediments 2014, 14, 1513–1525. [Google Scholar] [CrossRef]
  42. Yang, Y.; Ji, C.; Ma, W.; Wang, S.; Wang, S.; Han, W.; Mohammat, A.; Robinson, D.; Smith, P. Significant Soil Acidification across Northern China’s Grasslands during 1980s–2000s. Glob. Change Biol. 2012, 18, 2292–2300. [Google Scholar] [CrossRef]
  43. Hartikainen, H.; Yli-Halla, M. Solubility of Soil Phosphorus as Influenced by Urea. Z. Für Pflanzenernährung Und Bodenkd. 1996, 159, 327–332. [Google Scholar] [CrossRef]
  44. Rochette, P.; Angers, D.A.; Chantigny, M.H.; Gasser, M.-O.; MacDonald, J.D.; Pelster, D.E.; Bertrand, N. NH3 Volatilization, Soil Concentration and Soil pH Following Subsurface Banding of Urea at Increasing Rates. Can. J. Soil. Sci. 2013, 93, 261–268. [Google Scholar] [CrossRef]
  45. Fierer, N.; Bradford, M.A.; Jackson, R.B. Toward an Ecological Classification of Soil Bacteria. Ecology 2007, 88, 1354–1364. [Google Scholar] [CrossRef] [PubMed]
  46. Ho, A.; Lonardo, D.P.D.; Bodelier, P.L.E. Revisiting Life Strategy Concepts in Environmental Microbial Ecology. Microbiol. Ecol. 2017, 93, fix006. [Google Scholar] [CrossRef]
  47. Beskrovnaya, P.; Fakih, D.; Morneau, I.; Hashimi, A.; Bello, D.G.; Xing, S.; Nanci, A.; Huan, T.; Tocheva, E.I. No Endospore Formation Confirmed in Members of the Phylum. Appl. Environ. Microbiol. 2021, 87, 11. [Google Scholar] [CrossRef] [PubMed]
  48. Zak, D.R.; Holmes, W.E.; White, D.C.; Peacock, A.D.; Tilman, D. Plant Diversity, Soil Microbial Communities, and Ecosystem Function: Are There Any Links? Ecology 2003, 84, 2042–2050. [Google Scholar] [CrossRef]
  49. Bakker, M.G.; Schlatter, D.C.; Otto-Hanson, L.; Kinkel, L.L. Diffuse Symbioses: Roles of Plant–Plant, Plant–Microbe and Microbe–Microbe Interactions in Structuring the Soil Microbiome. Mol. Ecol. 2014, 23, 1571–1583. [Google Scholar] [CrossRef]
  50. Xie, H.; Tang, Y.; Yu, M.; Geoff Wang, G. The Effects of Afforestation Tree Species Mixing on Soil Organic Carbon Stock, Nutrients Accumulation, and Understory Vegetation Diversity on Reclaimed Coastal Lands in Eastern China. Glob. Ecol. Conserv. 2021, 26, e01478. [Google Scholar] [CrossRef]
  51. Fujii, K.; Funakawa, S.; Hayakawa, C.; Kosaki, T. Contribution of Different Proton Sources to Pedogenetic Soil Acidification in Forested Ecosystems in Japan. Geoderma 2008, 144, 478–490. [Google Scholar] [CrossRef]
  52. Mueller, K.E.; Eissenstat, D.M.; Hobbie, S.E.; Oleksyn, J.; Jagodzinski, A.M.; Reich, P.B.; Chadwick, O.A.; Chorover, J. Tree Species Effects on Coupled Cycles of Carbon, Nitrogen, and Acidity in Mineral Soils at a Common Garden Experiment. Biogeochemistry 2012, 111, 601–614. [Google Scholar] [CrossRef]
  53. Guckland, A.; Jacob, M.; Flessa, H.; Thomas, F.M.; Leuschner, C. Acidity, Nutrient Stocks, and Organic-matter Content in Soils of a Temperate Deciduous Forest with Different Abundance of European Beech (Fagus Sylvatica L.). Z. Pflanzenernähr. Bodenk. 2009, 172, 500–511. [Google Scholar] [CrossRef]
  54. Mastný, J.; Kaštovská, E.; Bárta, J.; Chroňáková, A.; Borovec, J.; Šantrůčková, H.; Urbanová, Z.; Edwards, K.R.; Picek, T. Quality of DOC Produced during Litter Decomposition of Peatland Plant Dominants. Soil Biol. Biochem. 2018, 121, 221–230. [Google Scholar] [CrossRef]
  55. Thoms, C.; Gattinger, A.; Jacob, M.; Thomas, F.M.; Gleixner, G. Direct and Indirect Effects of Tree Diversity Drive Soil Microbial Diversity in Temperate Deciduous Forest. Soil Biol. Biochem. 2010, 42, 1558–1565. [Google Scholar] [CrossRef]
  56. Deng, Q.; Hui, D.; Dennis, S.; Reddy, K.C.; Xu, X. Responses of Terrestrial Ecosystem Phosphorus Cycling to Nitrogen Addition: A Meta-analysis. Glob. Ecol. Biogeogr. 2017, 26, 713–728. [Google Scholar] [CrossRef]
  57. Wei, Y.; Zhao, Y.; Shi, M.; Cao, Z.; Lu, Q.; Yang, T.; Fan, Y.; Wei, Z. Effect of Organic Acids Production and Bacterial Community on the Possible Mechanism of Phosphorus Solubilization during Composting with Enriched Phosphate-Solubilizing Bacteria Inoculation. Bioresour. Technol. 2018, 247, 190–199. [Google Scholar] [CrossRef] [PubMed]
  58. Bell, C.W.; Tissue, D.T.; Loik, M.E.; Wallenstein, M.D.; Acosta-Martinez, V.; Erickson, R.A.; Zak, J.C. Soil Microbial and Nutrient Responses to 7 Years of Seasonally Altered Precipitation in a Chihuahuan Desert Grassland. Glob. Change Biol. 2014, 20, 1657–1673. [Google Scholar] [CrossRef] [PubMed]
  59. Yang, L. Bacterial Communities Drive the Resistance of Soil Multifunctionality to Land-Use Change in Karst Soils. Eur. J. Soil Biol. 2021, 9, 103313. [Google Scholar] [CrossRef]
  60. Zhu, J.-T.; Li, X.-Y.; Zhang, X.-M.; Yu, Q.; Lin, L.-S. Leaf Nitrogen Allocation and Partitioning in Three Groundwater-Dependent Herbaceous Species in a Hyper-Arid Desert Region of North-Western China. Aust. J. Bot. 2012, 60, 61–67. [Google Scholar] [CrossRef]
  61. Li, M.; Petrie, M.D.; Tariq, A.; Zeng, F. Response of Nodulation, Nitrogen Fixation to Salt Stress in a Desert Legume Alhagi Sparsifolia. Environ. Exp. Bot. 2021, 183, 104348. [Google Scholar] [CrossRef]
  62. Florencio-Ortiz, V.; Sellés-Marchart, S.; Zubcoff-Vallejo, J.; Jander, G.; Casas, J.L. Changes in the Free Amino Acid Composition of Capsicum Annuum (Pepper) Leaves in Response to Myzus Persicae (Green Peach Aphid) Infestation. A Comparison with Water Stress. PLoS ONE 2018, 13, e0198093. [Google Scholar] [CrossRef]
  63. Corrigan, R.M.; Bowman, L.; Willis, A.R.; Kaever, V.; Gründling, A. Cross-Talk between Two Nucleotide-Signaling Pathways in Staphylococcus Aureus. J. Biol. Chem. 2015, 290, 5826–5839. [Google Scholar] [CrossRef] [PubMed]
  64. Jing, X.; Sanders, N.J.; Shi, Y.; Chu, H.; Classen, A.T.; Zhao, K.; Chen, L.; Shi, Y.; Jiang, Y.; He, J.-S. The Links between Ecosystem Multifunctionality and Above- and Belowground Biodiversity Are Mediated by Climate. Nat. Commun. 2015, 6, 8159. [Google Scholar] [CrossRef] [PubMed]
Figure 1. (a) The location of the study site. (b) Photographs of the three communities.
Microorganisms 11 02471 g001
Figure 2. Community composition of bacteria (a) and fungi (b) at the phylum level (top 10). The blue, green, and yellow pentacle in the legend indicates that the variation in abundance was significant in response to N-addition treatment, plant community, and their interaction (LSD, p < 0.05). The α-diversity (estimated by Chao1) of bacteria (c) and fungi (d). Different lowercase letters indicate a significant difference among different N-addition treatments in each plant community (LSD, p < 0.05).
Microorganisms 11 02471 g002
Figure 3. Principal coordinate analysis (PCoA) of the bacterial (a) and fungal (b) communities based on the Bray–Curtis distance of ASV. The ellipse represents the 95% confidence interval. Permutational analysis of variance (PERMANOVA) with 999 permutations shows the effects of N-addition treatment (T) and plant community type (C) on microbial community composition based on the Bray–Curtis distance of ASVs.
Microorganisms 11 02471 g003
Figure 4. The dissimilarity distances of bacterial (a,c) and fungal (b,d) communities under different plant community types and N-addition treatments. Different lowercase letters indicate a significant difference among plant communities and N-addition treatments (Kruskal–Wallis test or LSD, p < 0.05).
Microorganisms 11 02471 g004
Figure 5. Redundancy analysis (RDA) of the bacterial community in A. sparsifolia- (a) and K. caspia-communities (b) and their mixed community (c). The relative importance of individual soil physicochemical parameters in predicting the bacterial community composition in each plant community (df). SOC, soil organic carbon; AP, available phosphorous; AK, available potassium; TN, total nitrogen; NO3−N, nitrate; NH4+−N, ammonium; AN, available nitrogen.
Microorganisms 11 02471 g005
Figure 6. Redundancy analysis (RDA) of fungal community in A. sparsifolia- (a) and K. caspia-communities (b) and their mixed community (c). The relative importance of individual soil physicochemical parameters in predicting the fungal community composition in each plant community (df). SOC, soil organic carbon; AP, available phosphorous; AK, available potassium; TN, total nitrogen; NO3−N, nitrate; NH4+−N, ammonium; AN, available nitrogen.
Microorganisms 11 02471 g006
Figure 7. Variation in abundances of soil bacterial function profiles in three plant community types under different N-addition treatments analyzed by PICRUSt. Different lowercase letters indicate a significant difference among five N-addition treatments at 0.05 level.
Microorganisms 11 02471 g007
Figure 8. Variation in abundances of soil fungal functional guilds in three plant community types under different N-addition treatments. Different lowercase letters indicate a significant difference among five N-addition treatments at 0.05 level.
Microorganisms 11 02471 g008
Table 1. Effects of nitrogen-addition treatment, plant community types, and their interaction on soil properties.
N-Addition Treatment × Plant Community Type
TNSOCAPAK
A. sparsifoliaCK0.290 ± 0.040 a1.71 ± 0.10 b6.11 ± 0.71 a201.13 ± 8.37 a
N100.186 ± 0.041 def1.65 ± 0.35 b3.81 ± 0.39 ab244.15 ± 16.95 a
N300.160 ± 0.033 ef1.88 ± 0.35 ab4.38 ± 1.35 ab178.83 ± 21.65 a
N600.150 ± 0.046 f1.38 ± 0.24 bc4.45 ± 0.82 ab228.80 ± 33.56 a
N1200.185 ± 0.033 def1.40 ± 0.27 bc4.24 ± 0.90 ab205.40 ± 17.45 a
K. caspiaCK0.273 ± 0.048 ab1.34 ± 0.02 bc5.41 ± 1.59 ab226.03 ± 18.94 a
N100.264 ± 0.017 abc1.81 ± 0.12 ab2.99 ± 0.41 b210.06 ± 18.60 a
N300.197 ± 0.036 cdef1.77 ± 0.22 ab4.06 ± 0.49 ab221.66 ± 24.23 a
N600.238 ± 0.014 abcd1.48 ± 0.14 bc5.01 ± 1.39 ab246.43 ± 34.71 a
N1200.229 ± 0.035 abcde1.46 ± 0.38 bc3.77 ± 1.03 ab234.03 ± 41.39 a
MixingCK0.185 ± 0.029 def1.44 ± 0.23 bc3.69 ± 0.60 ab243.66 ± 35.22 a
N100.238 ± 0.030 abcd1.00 ± 0.16 c4.77 ± 0.19 ab216.40 ± 40.17 a
N300.182 ± 0.022 def1.34 ± 0.20 bc5.34 ± 1.56 ab206.76 ± 27.73 a
N600.232 ± 0.044 abcde1.61 ± 0.33 b5.28 ± 0.75 ab231.56 ± 11.71 a
N1200.215 ± 0.024 bcdef2.29 ± 0.31 a4.67 ± 0.63 ab240.13 ± 7.82 a
N-addition treatment
ANNH4+−NNO3−NpH
CK28.9 ± 8.5 b3.8 ± 0.8 a19.7 ± 7.9 b7.11 ± 0.06 c
N1037.6 ± 13.9 ab3.1 ± 0.2 b30.1 ± 11.8 ab7.51 ± 0.13 a
N3031.0 ± 9.70 b3.6 ± 0.8 ab18.6 ± 9.9 b7.49 ± 0.20 a
N6046.9 ± 16.8 a3.5 ± 0.4 ab34.0 ± 16.5 a7.28 ± 0.09 b
N12025.4 ± 15.0 b4.2 ± 1.0 a18.8 ± 13.9 b7.38 ± 0.21 ab
Plant community type
pH
A. sparsifolia7.37 ± 0.19 b
K. caspia7.41 ± 0.20 a
Mixing7.29 ± 0.21 c
Note: SOC, soil organic carbon, g kg−1; AP, available phosphorus, mg kg−1; AK, available potassium, mg kg−1; TN, total nitrogen, g kg−1; NO3−N, nitrate, mg kg−1; NH4+−N, ammonium, mg kg−1; AN, available nitrogen, mg kg−1. Different lowercase letters in the same column indicate significant differences between groups (p < 0.05).
Disclaimer/Publisher’s Note: The statements, opinions and data contained in all publications are solely those of the individual author(s) and contributor(s) and not of MDPI and/or the editor(s). MDPI and/or the editor(s) disclaim responsibility for any injury to people or property resulting from any ideas, methods, instructions or products referred to in the content.

