
Effect of the Inoculum-to-Substrate Ratio on Putative Pathogens and Microbial Kinetics during the Batch Anaerobic Digestion of Simulated Food Waste
 ,
,  and
and
Abstract
:1. Introduction
2. Materials and Methods
2.1. Substrate and Inoculum
2.2. Background Bacterial Enumeration of Substrate and Inoculum
2.3. Recovery and Confirmation of Marker Fluorescent-Labelled Escherichia coli Strain
2.4. Anaerobic Digestion Setup
2.5. Monitoring the Fate of Marker Escherichia coli and Other Resident Pathogens during AD
2.6. pH Determination
2.7. Molecular Analyses
2.7.1. DNA Extraction and Sanger Sequencing
2.7.2. RT-qPCR Analysis for Microbial Quantification
2.8. Secondary Digestion of AD Effluent
2.9. Statistical Analysis
3. Results
3.1. Background Bacterial Species in Substrate and Inoculum
3.2. Fate of Indicator and Bacterial Pathogens during AD Using Culture-Dependent Analysis
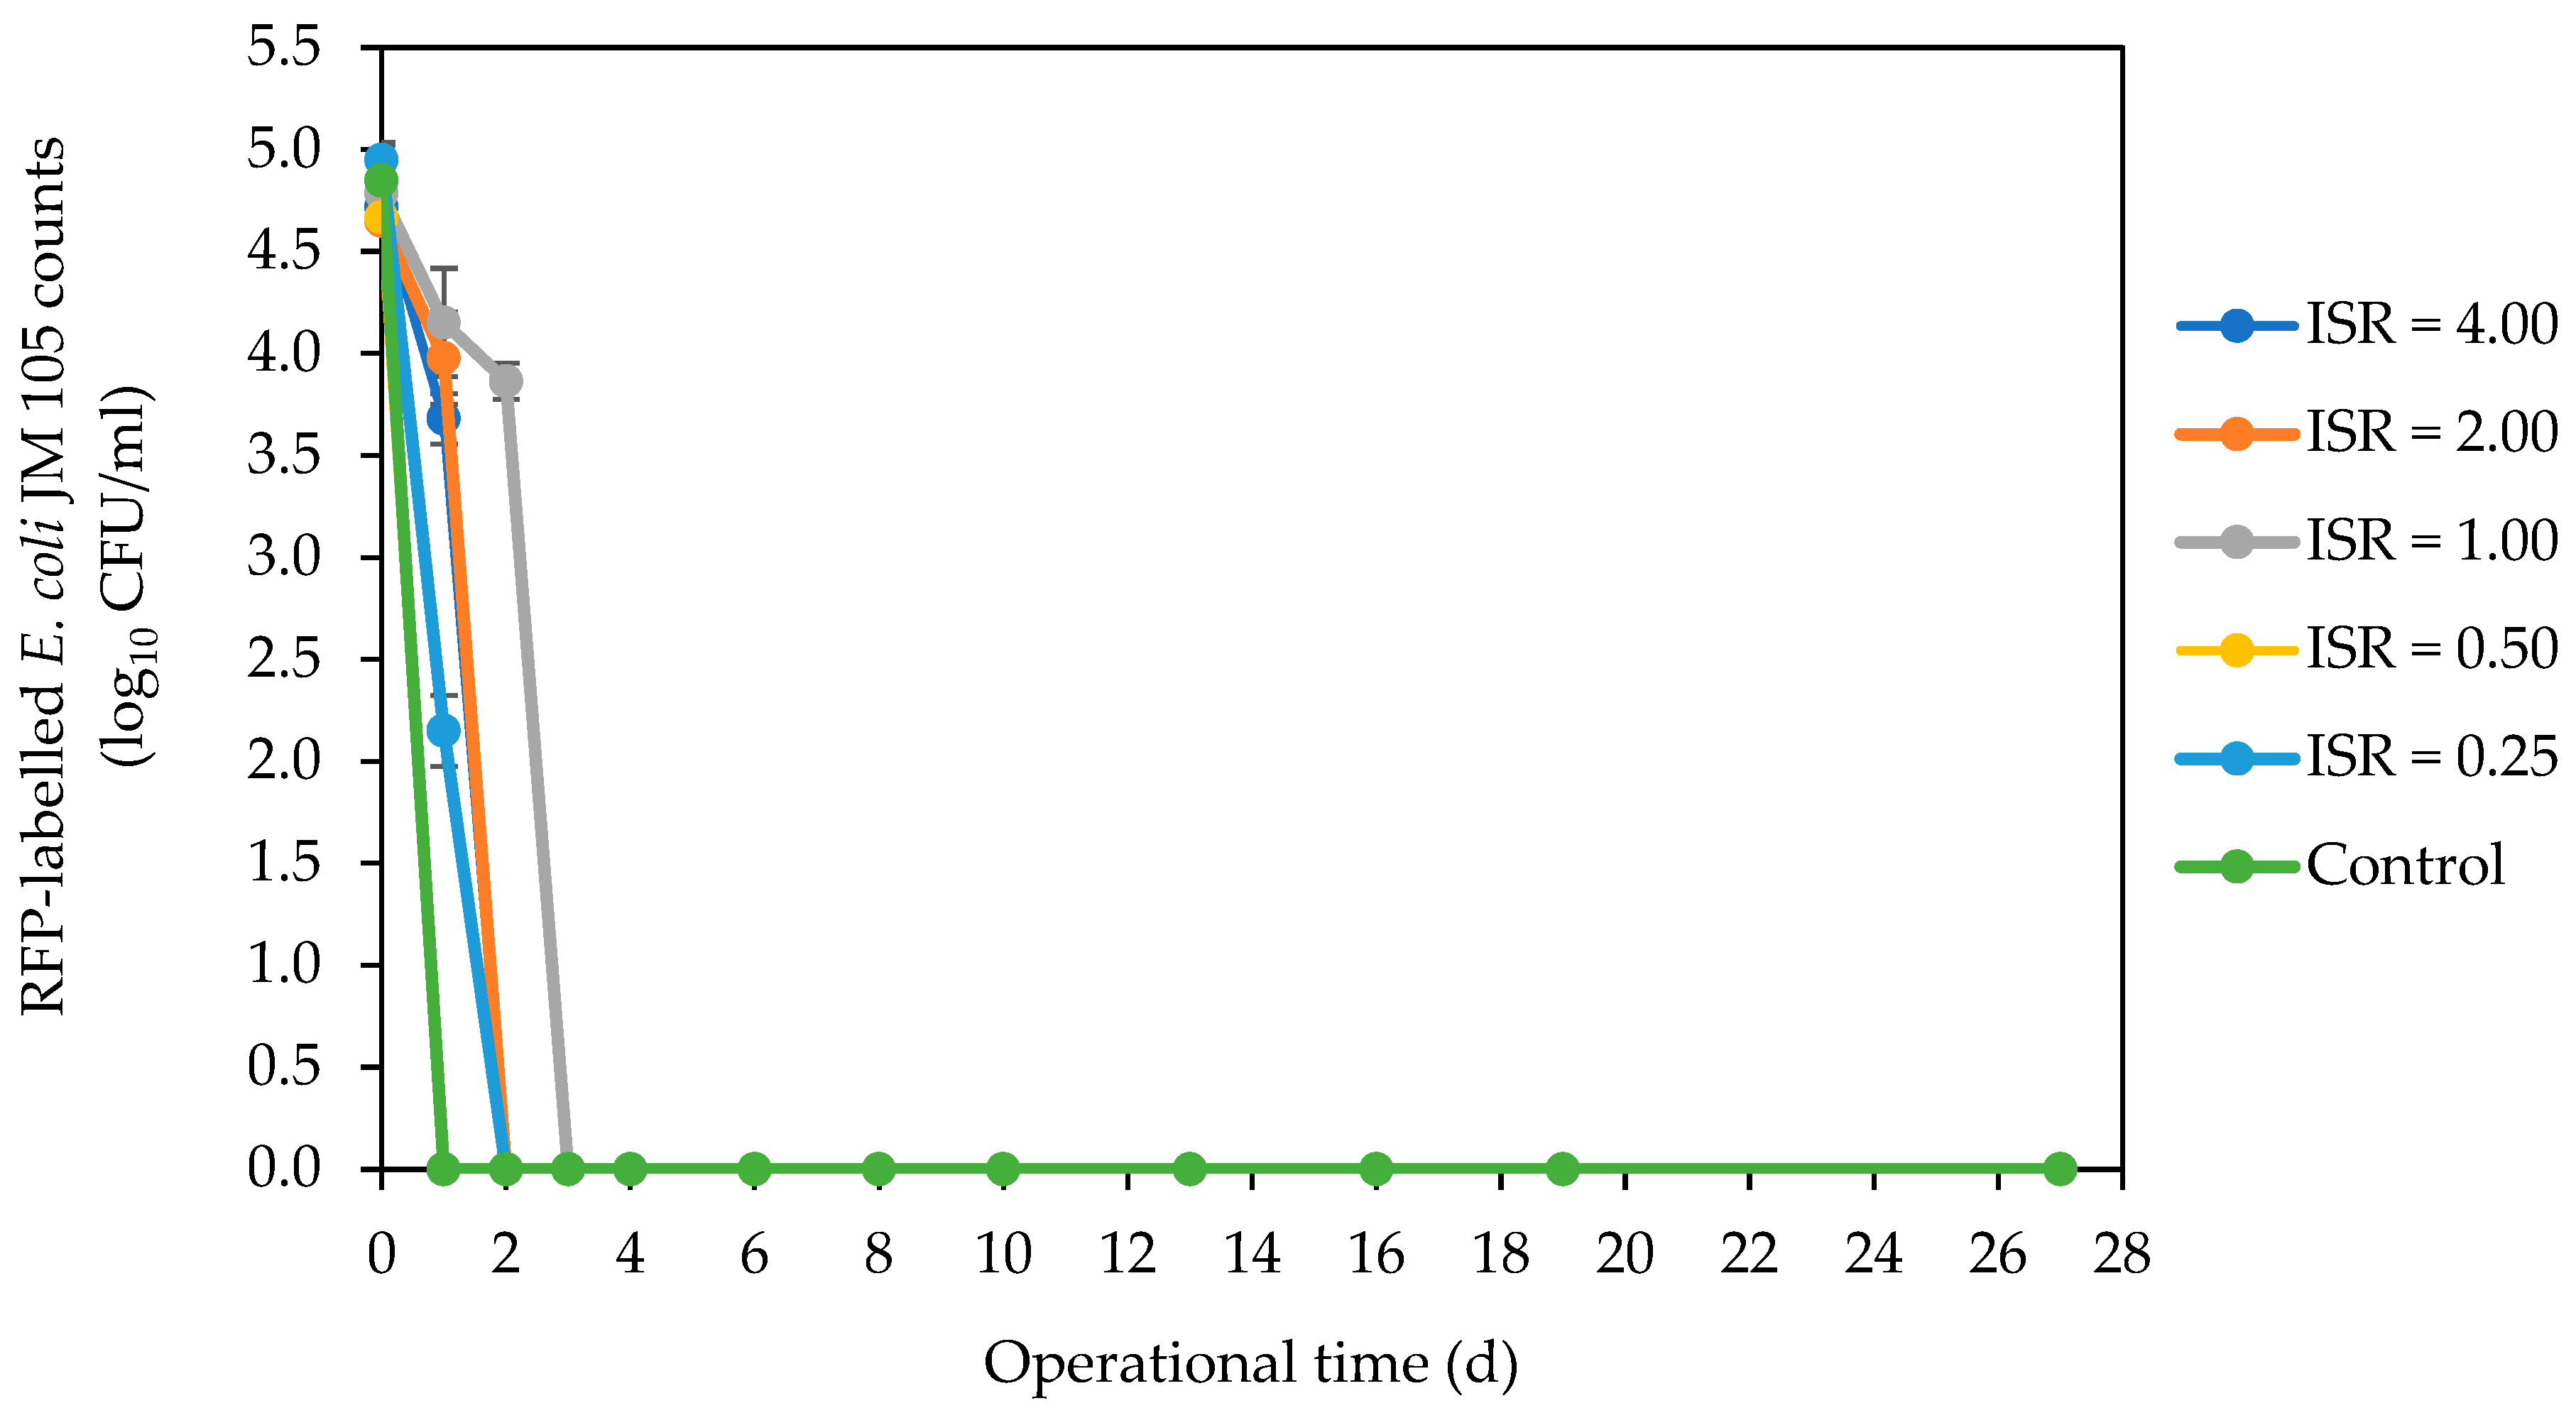
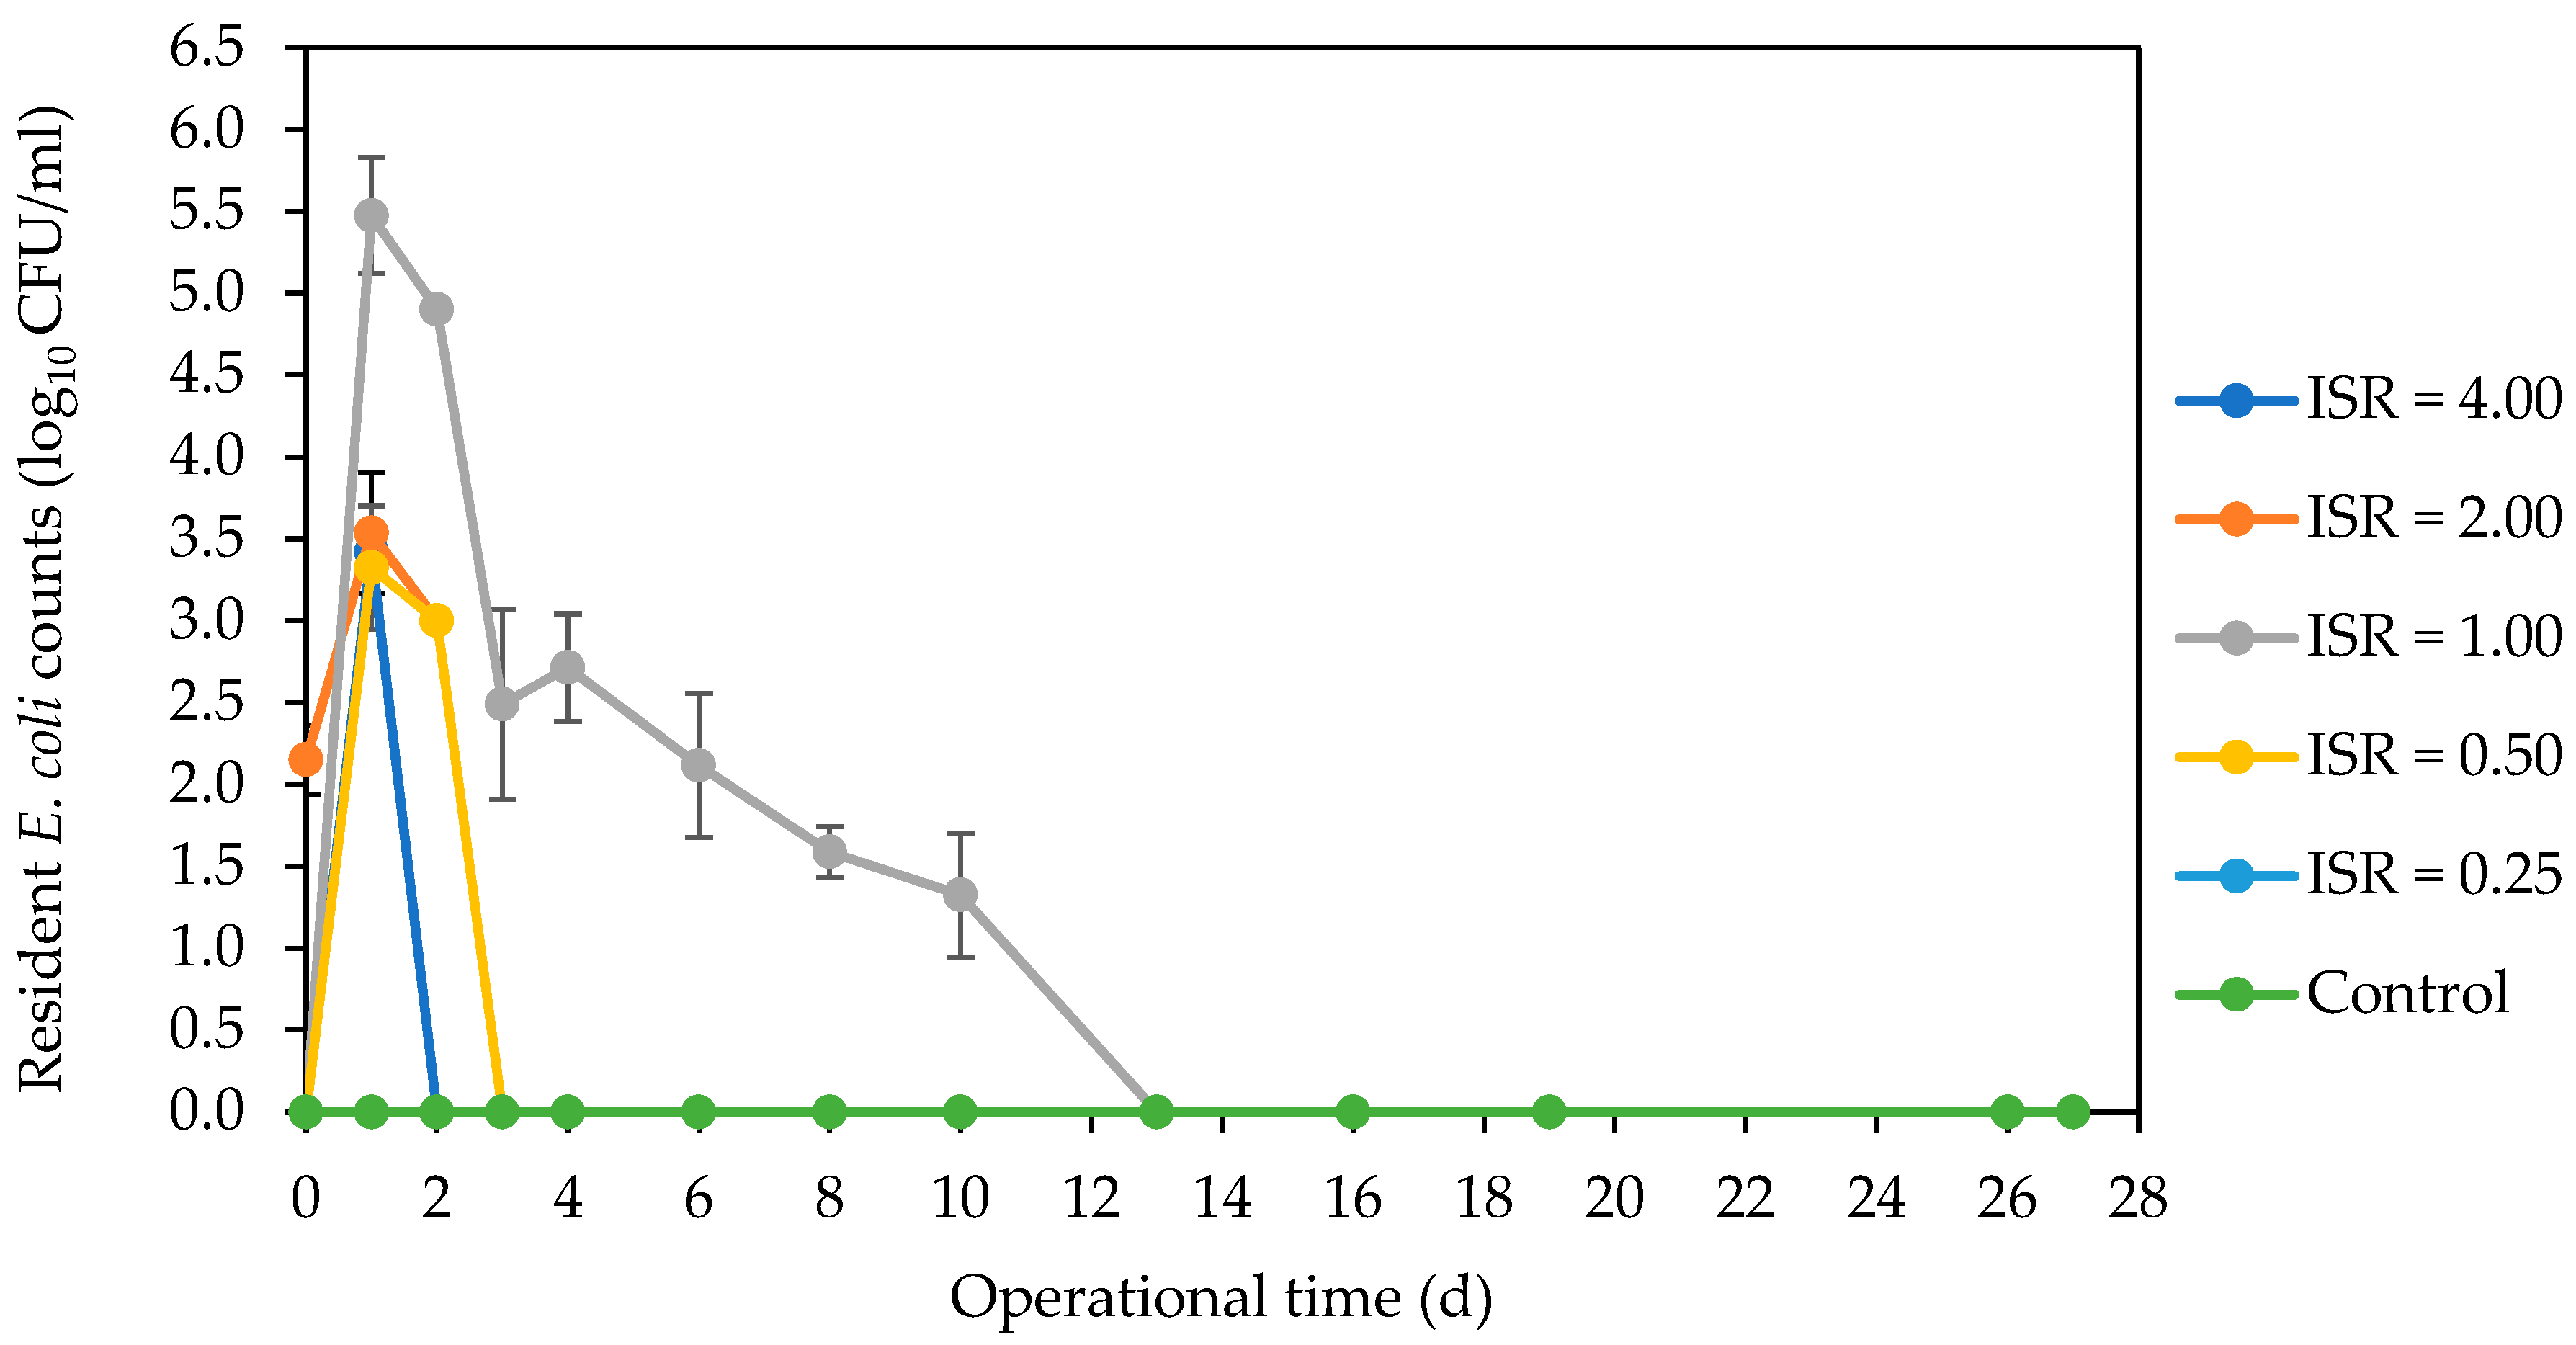
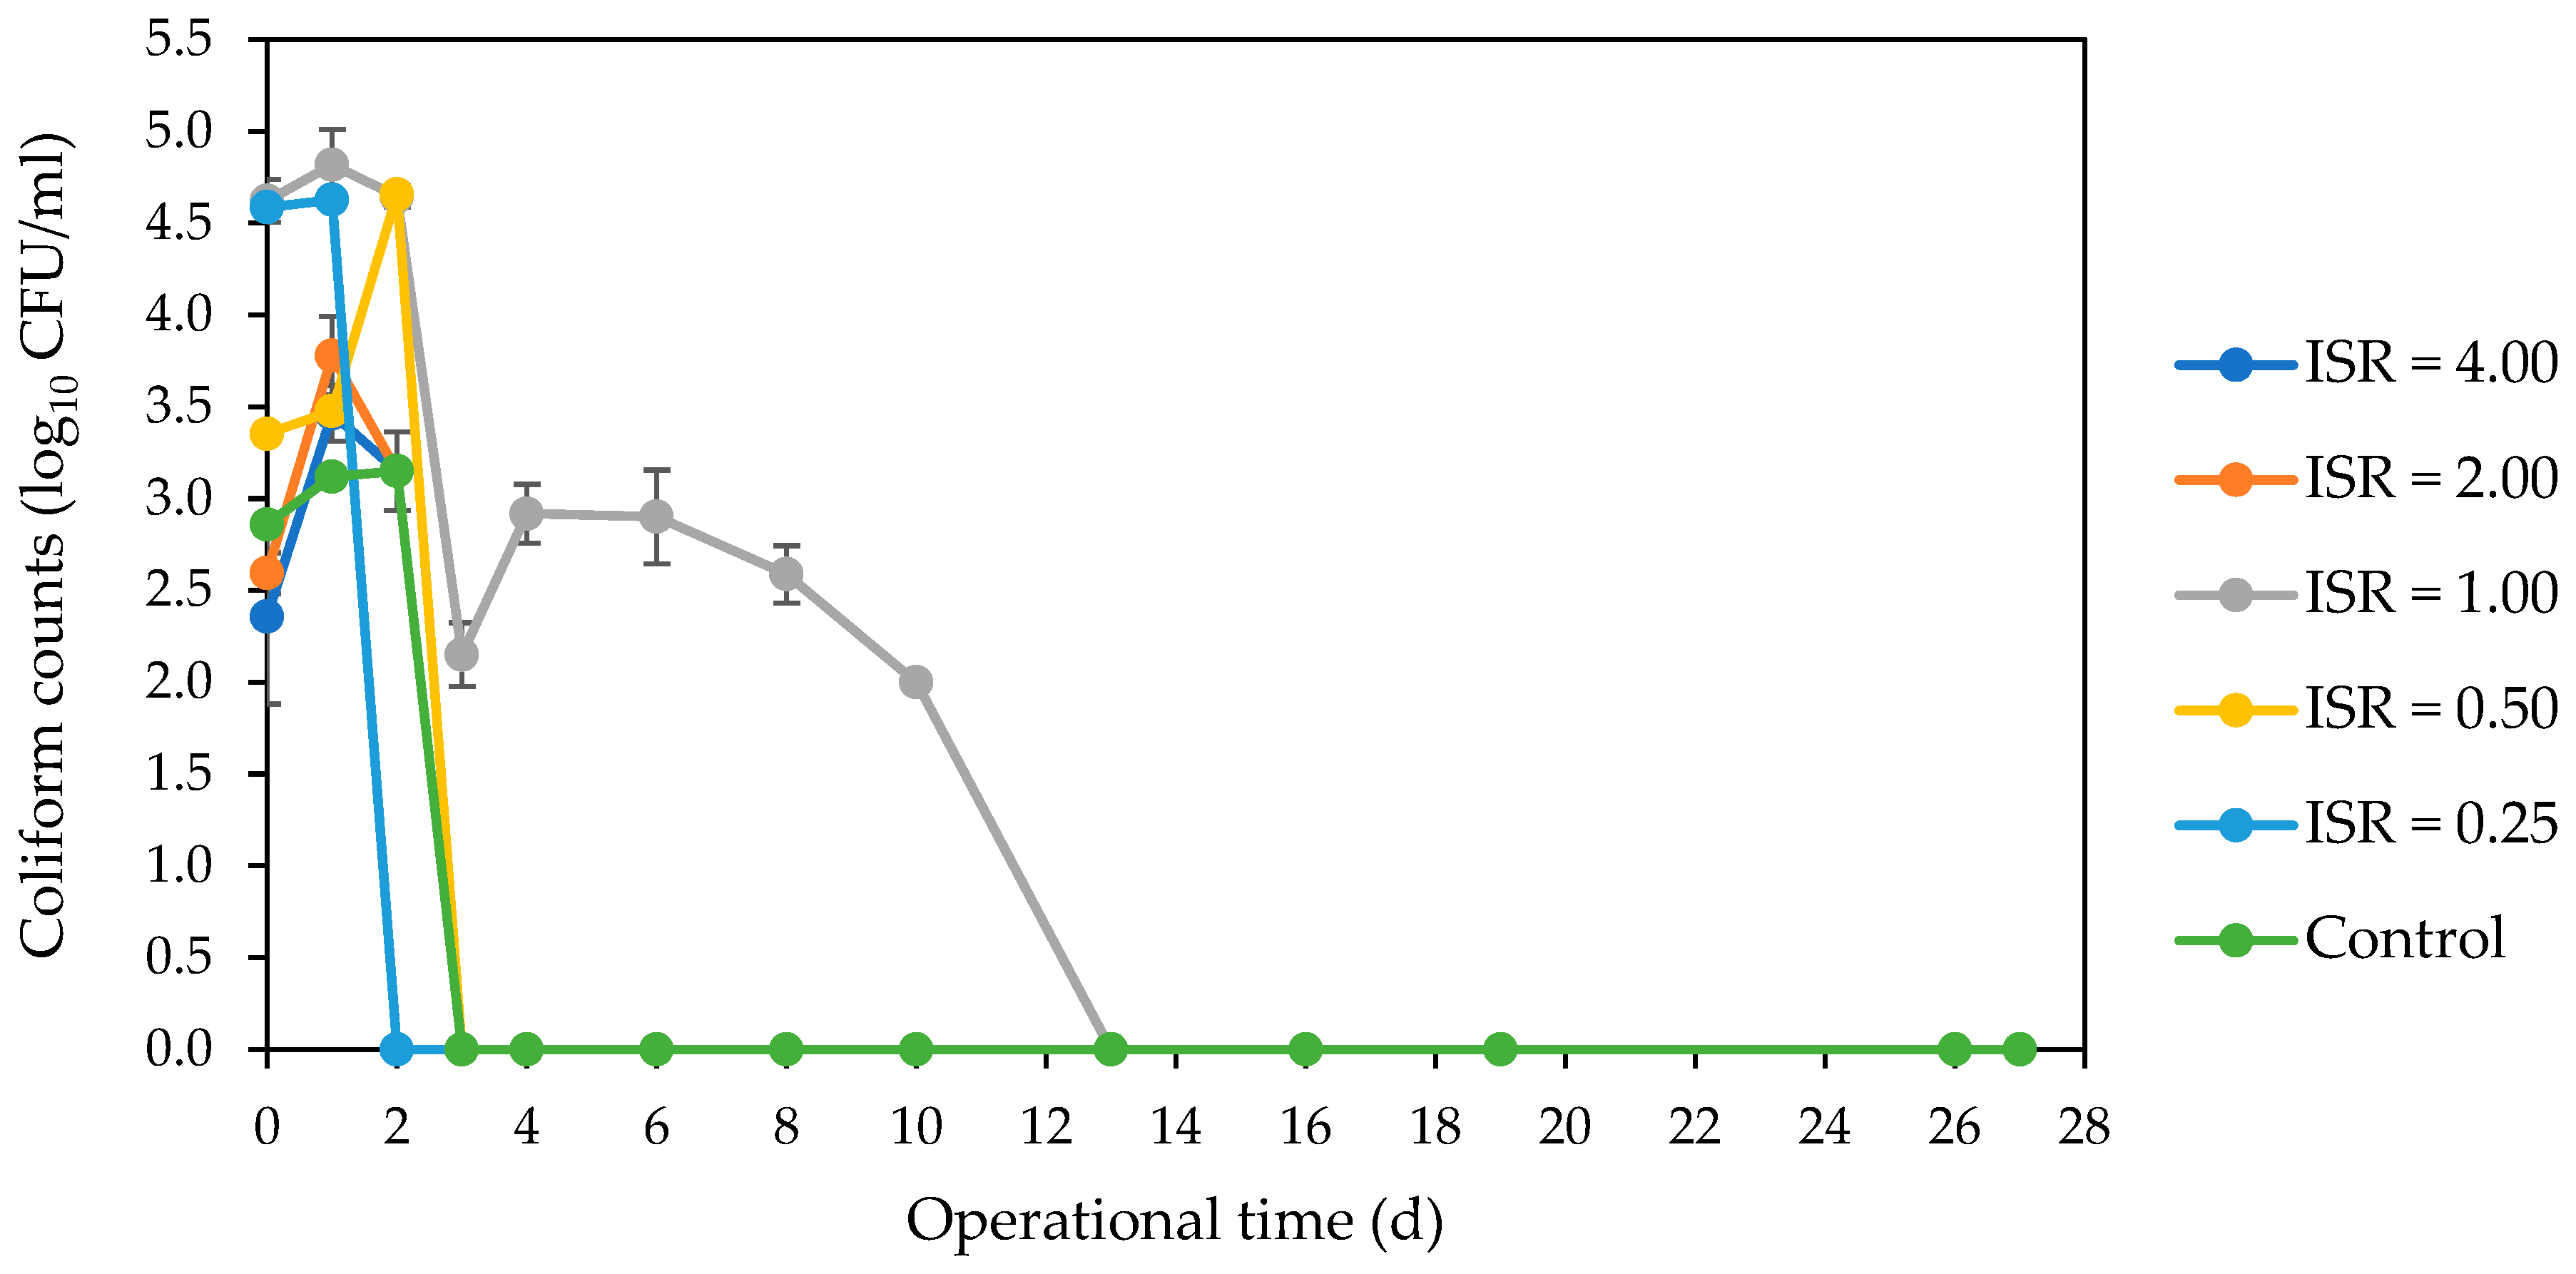
3.2.1. Marker E. coli Strain, Resident E. coli Strains and Coliforms
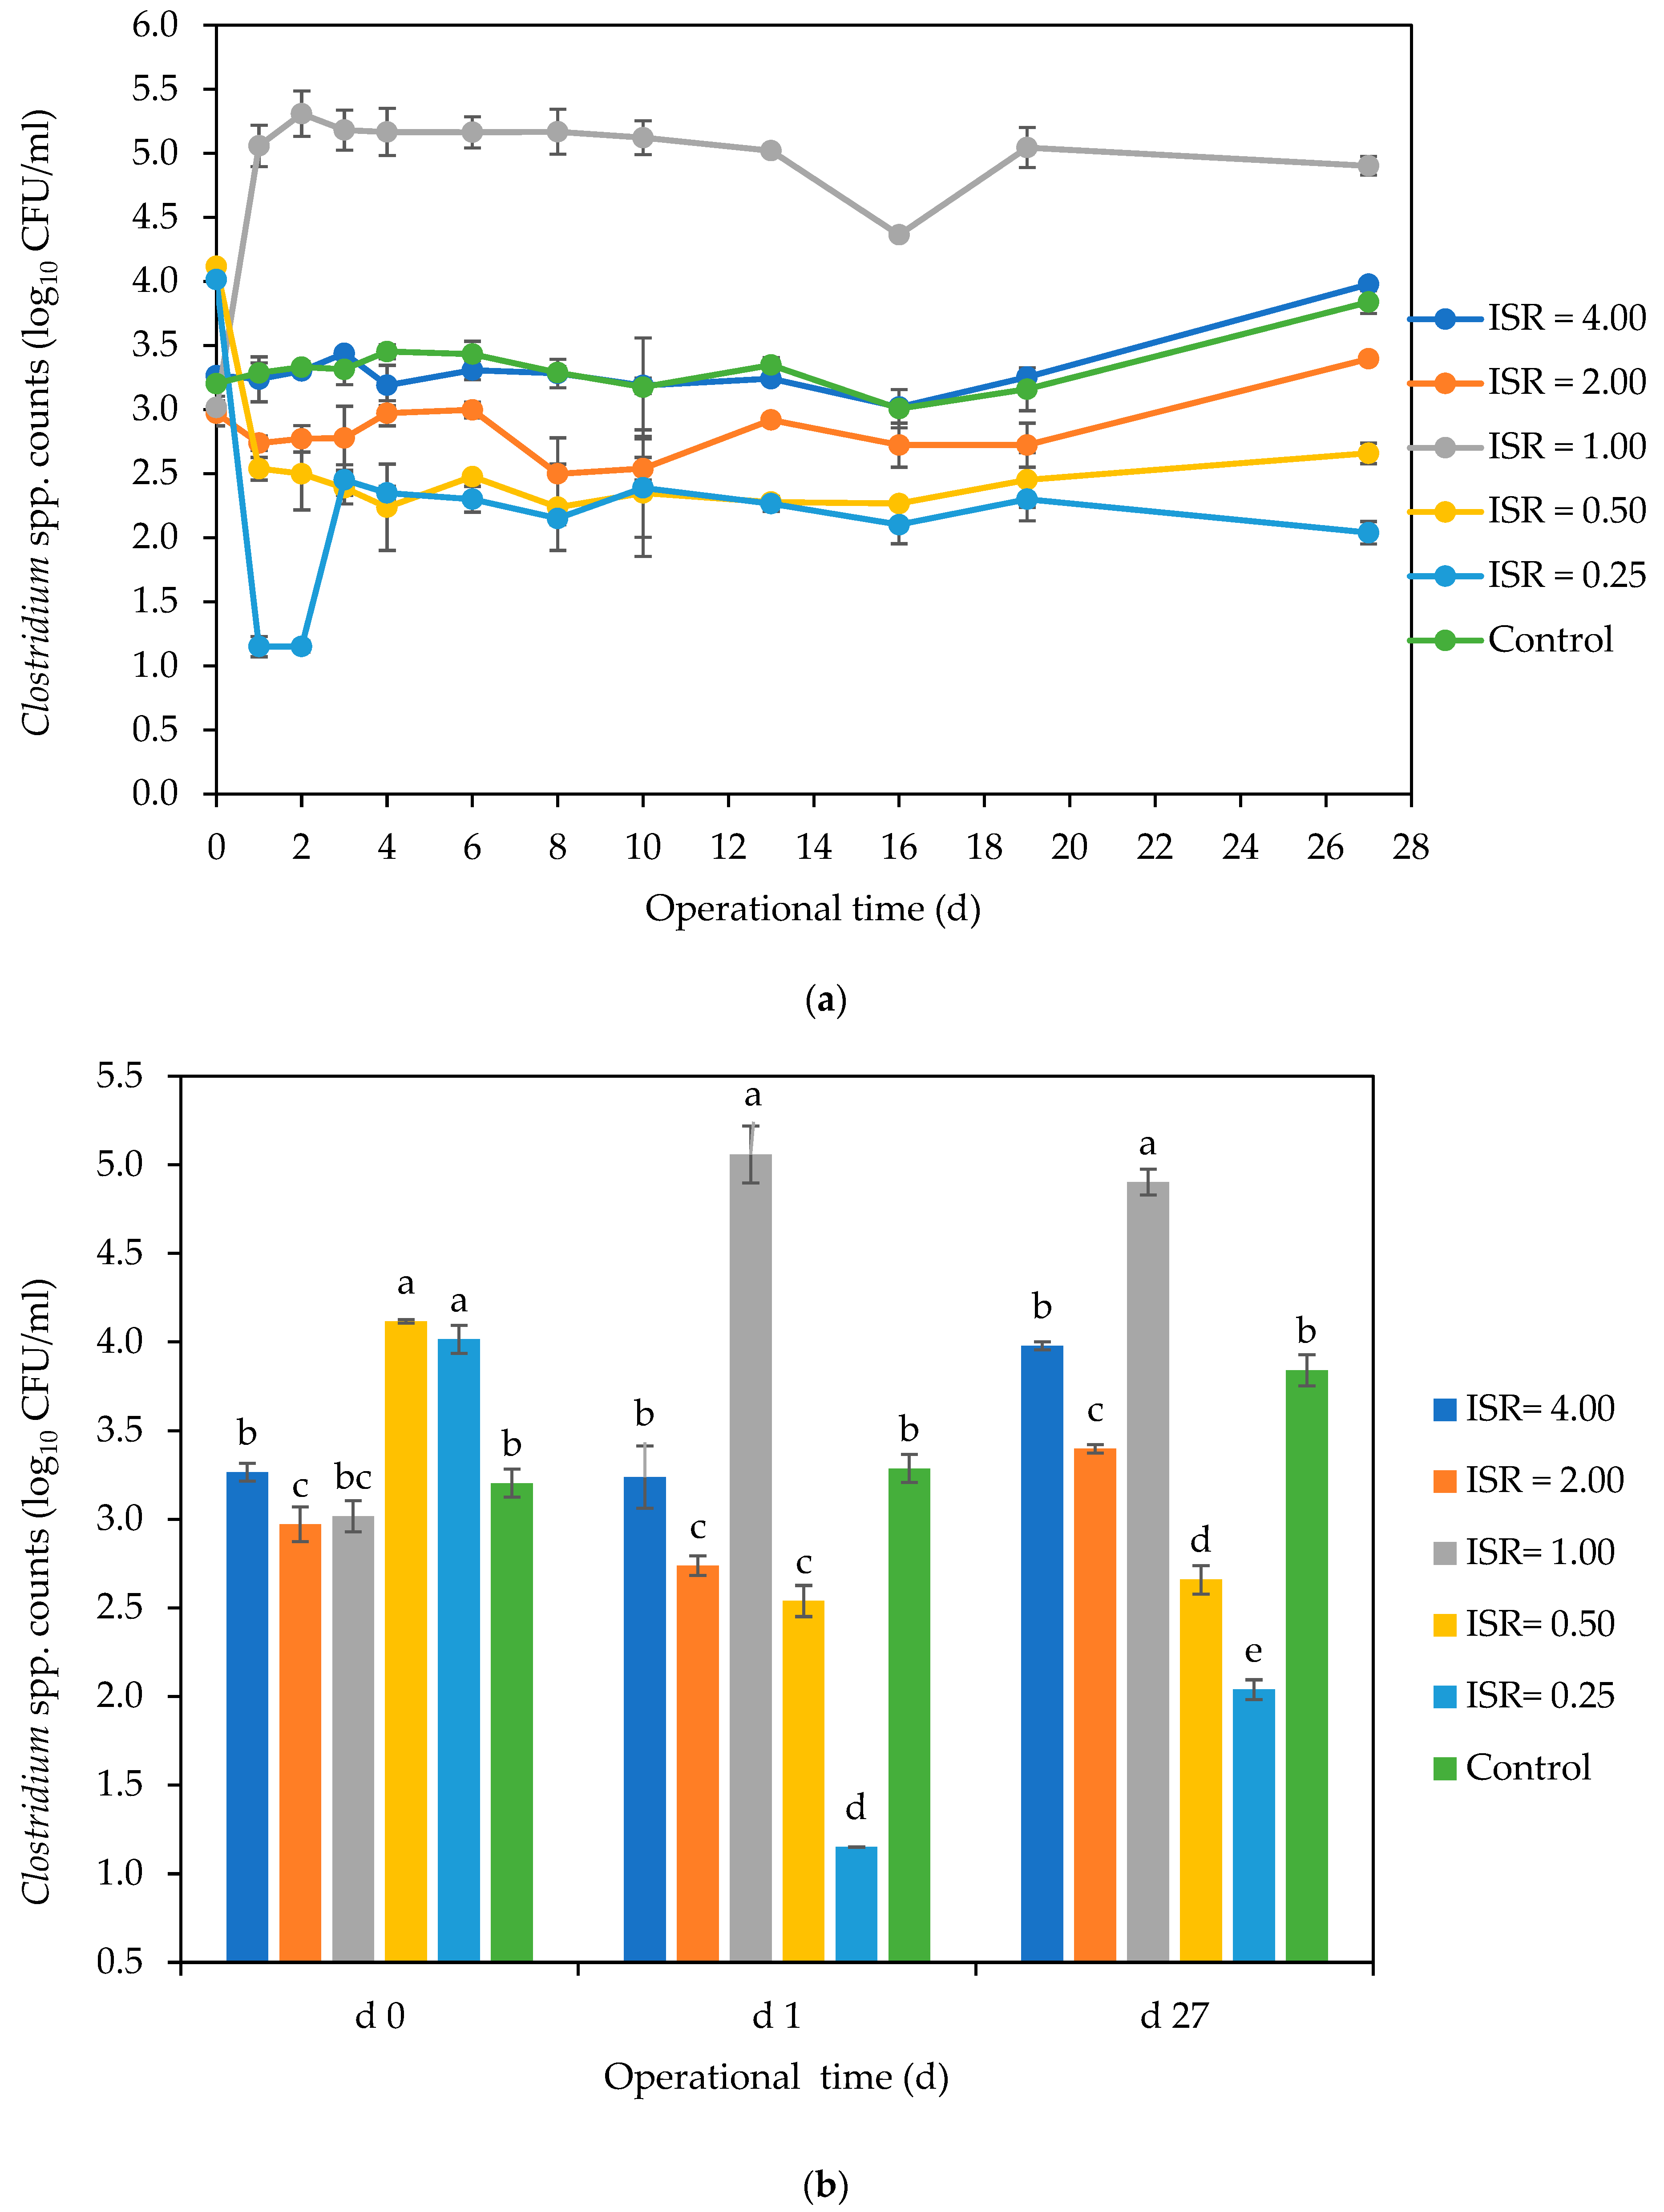
3.2.2. Clostridium spp.
3.2.3. Enterococcus spp.
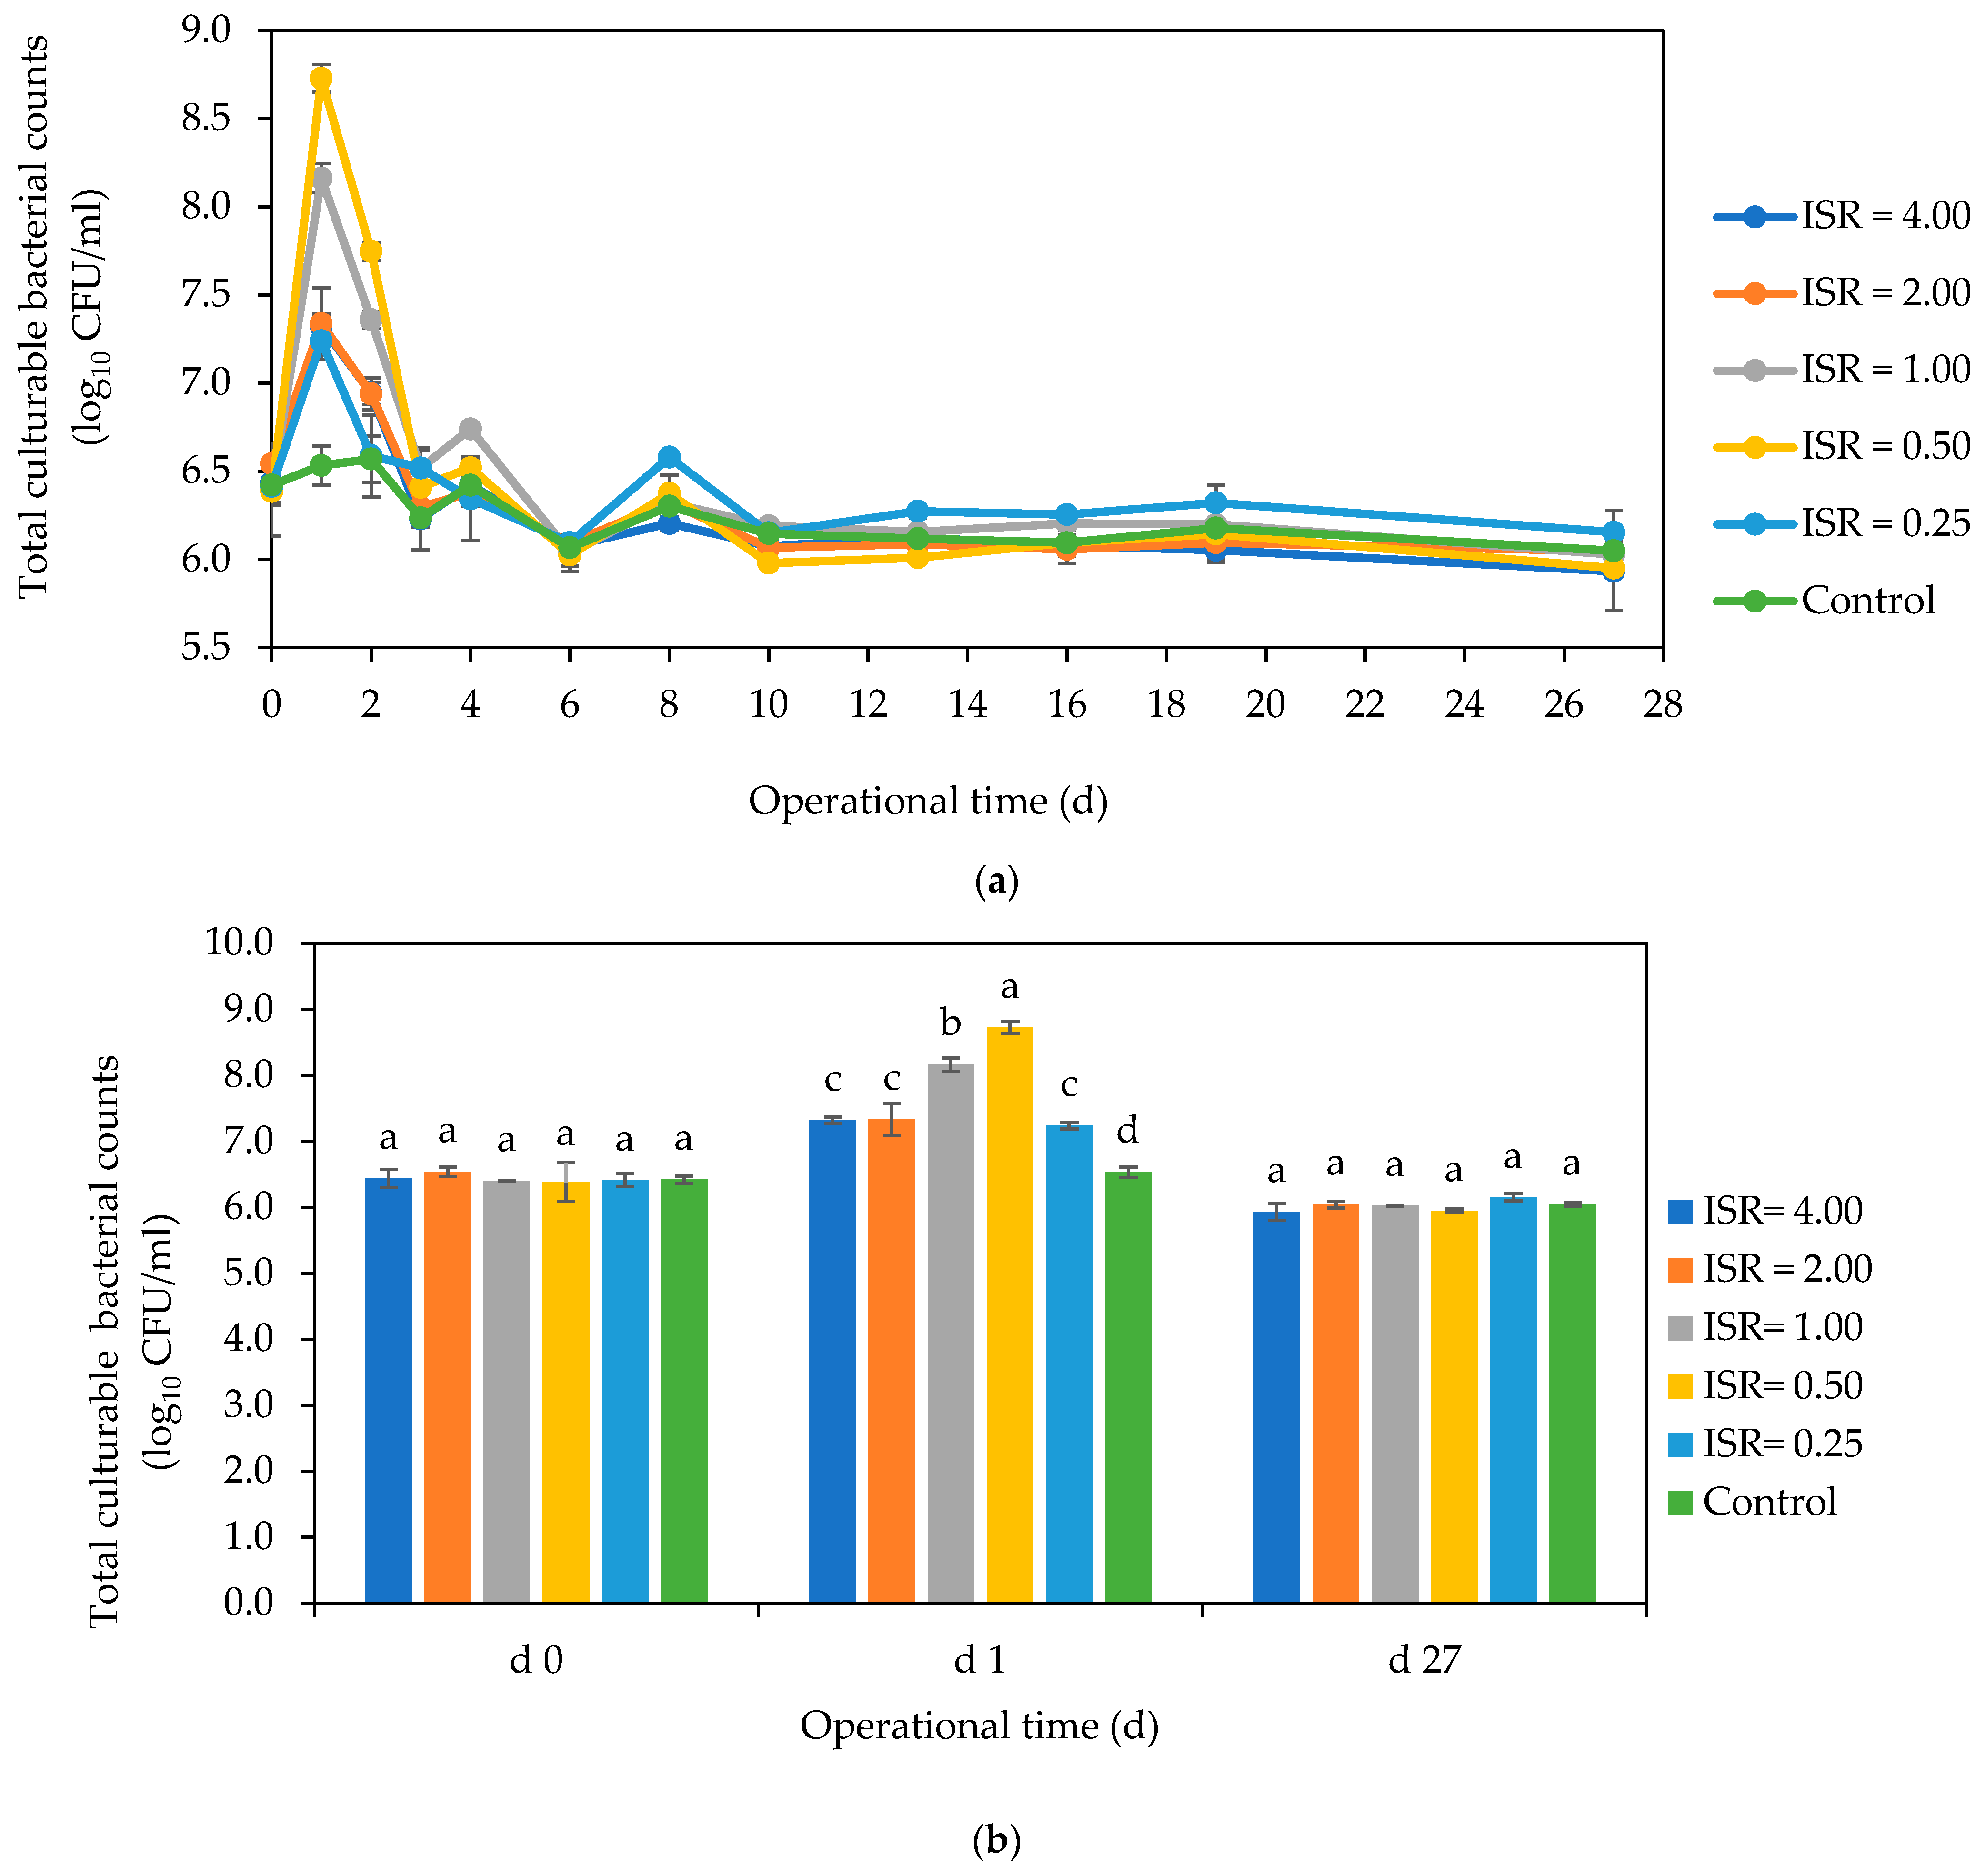
3.3. Total Culturable Aerobic Bacteria
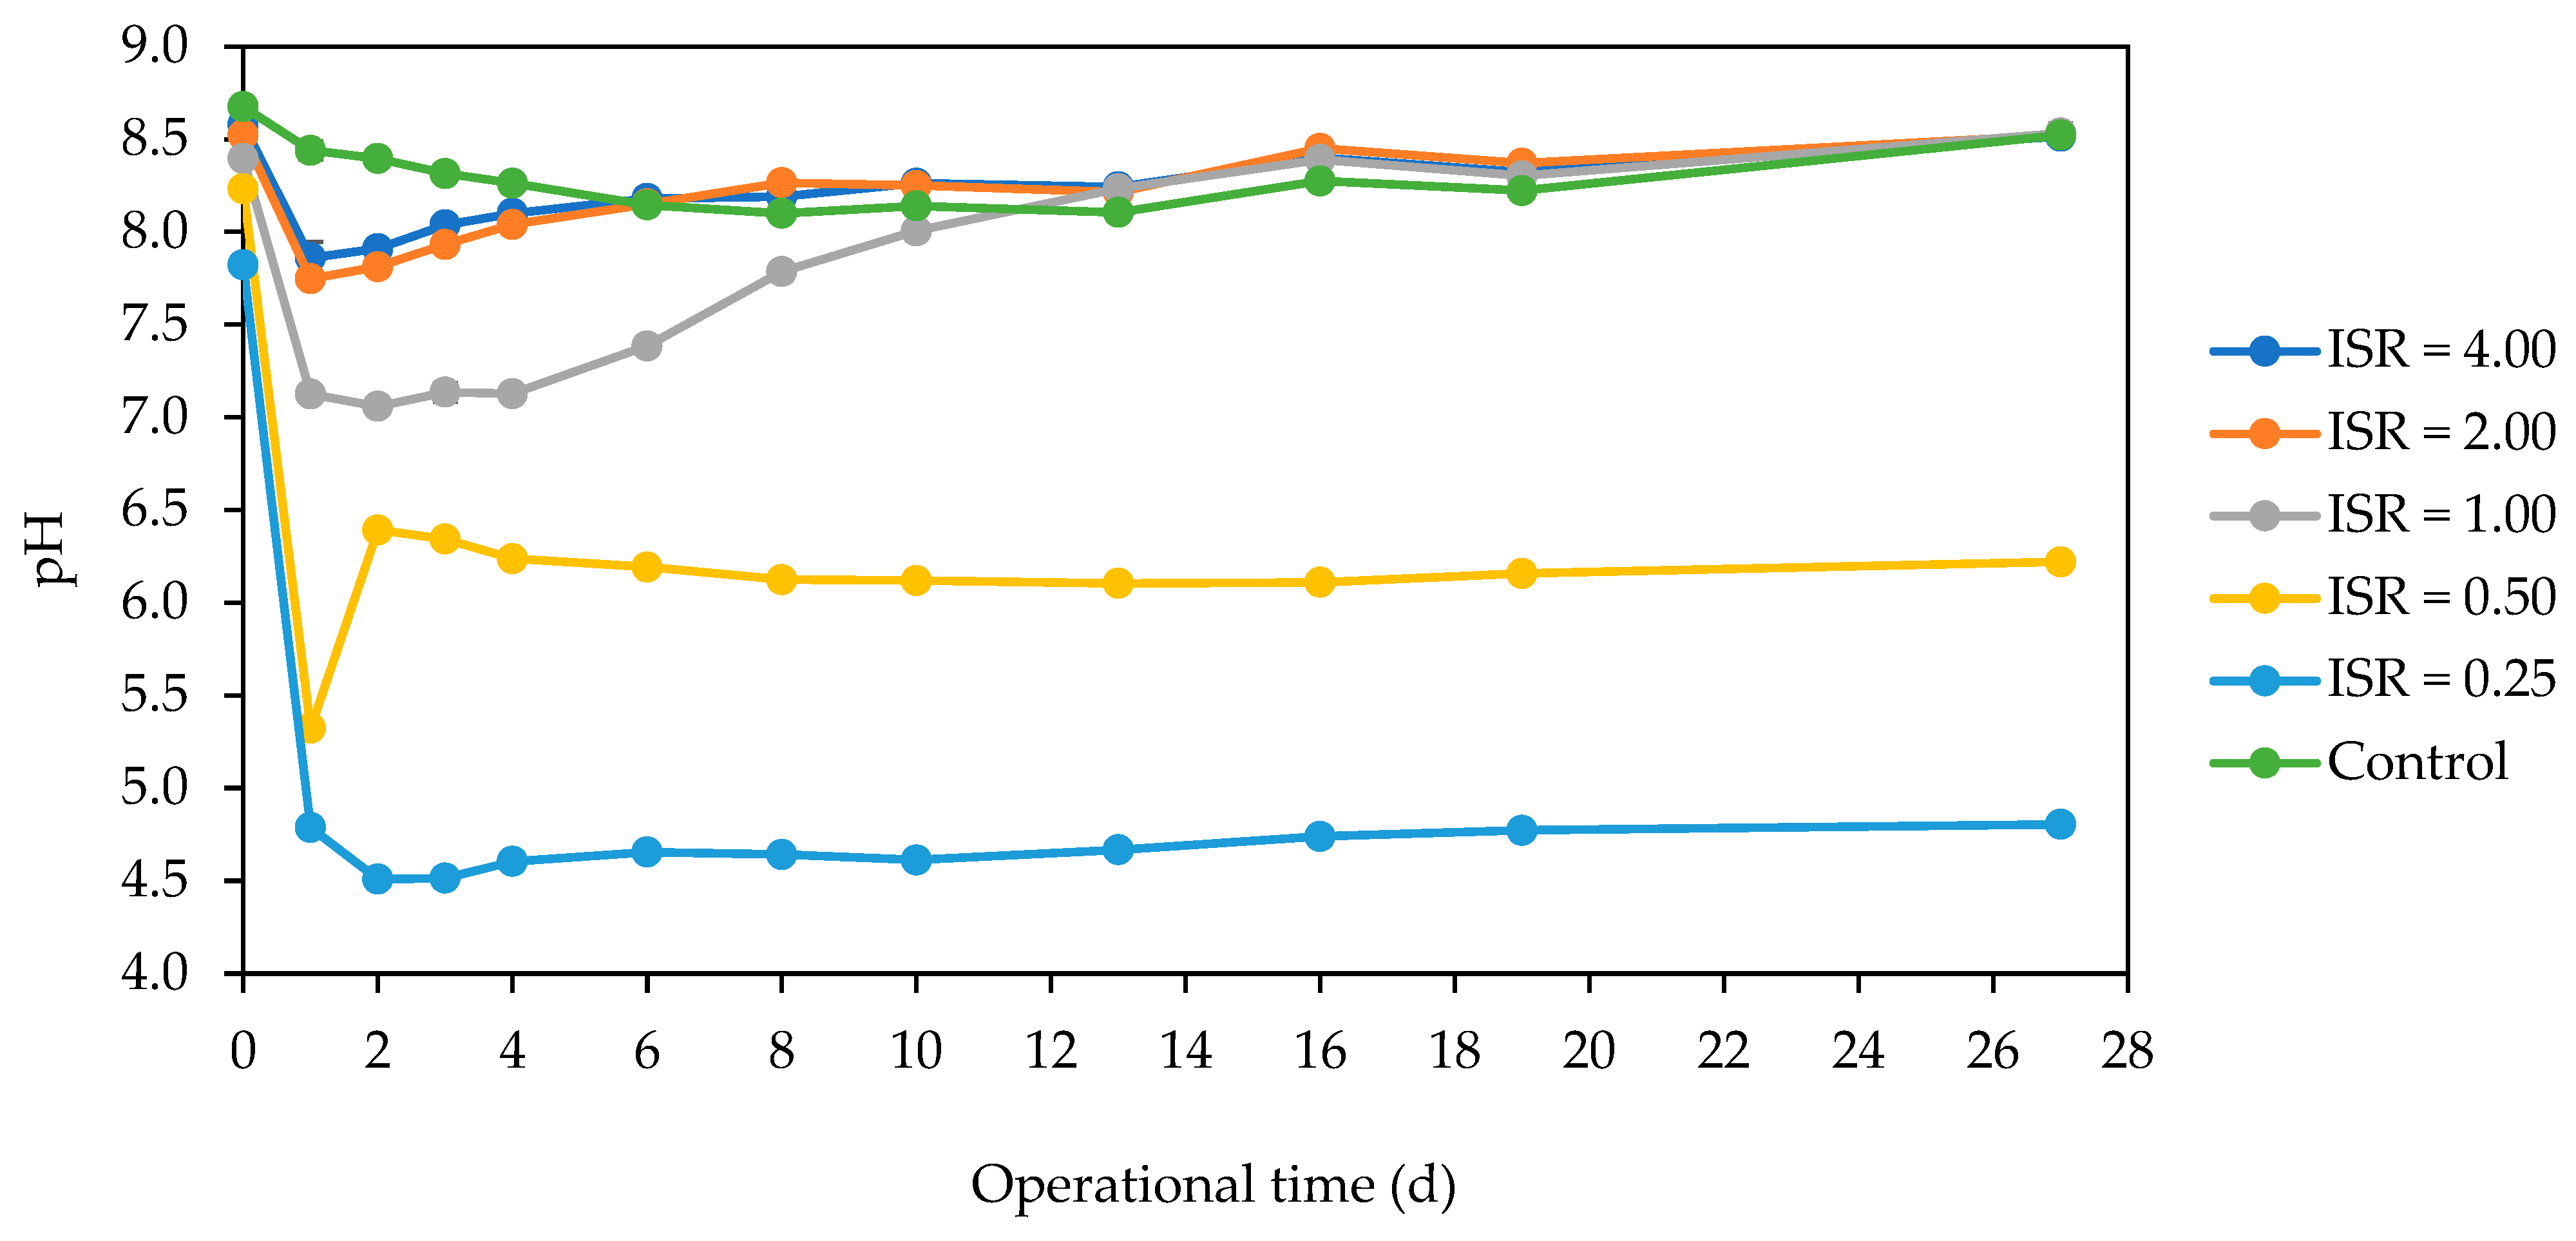
3.4. pH Dynamics during Batch AD
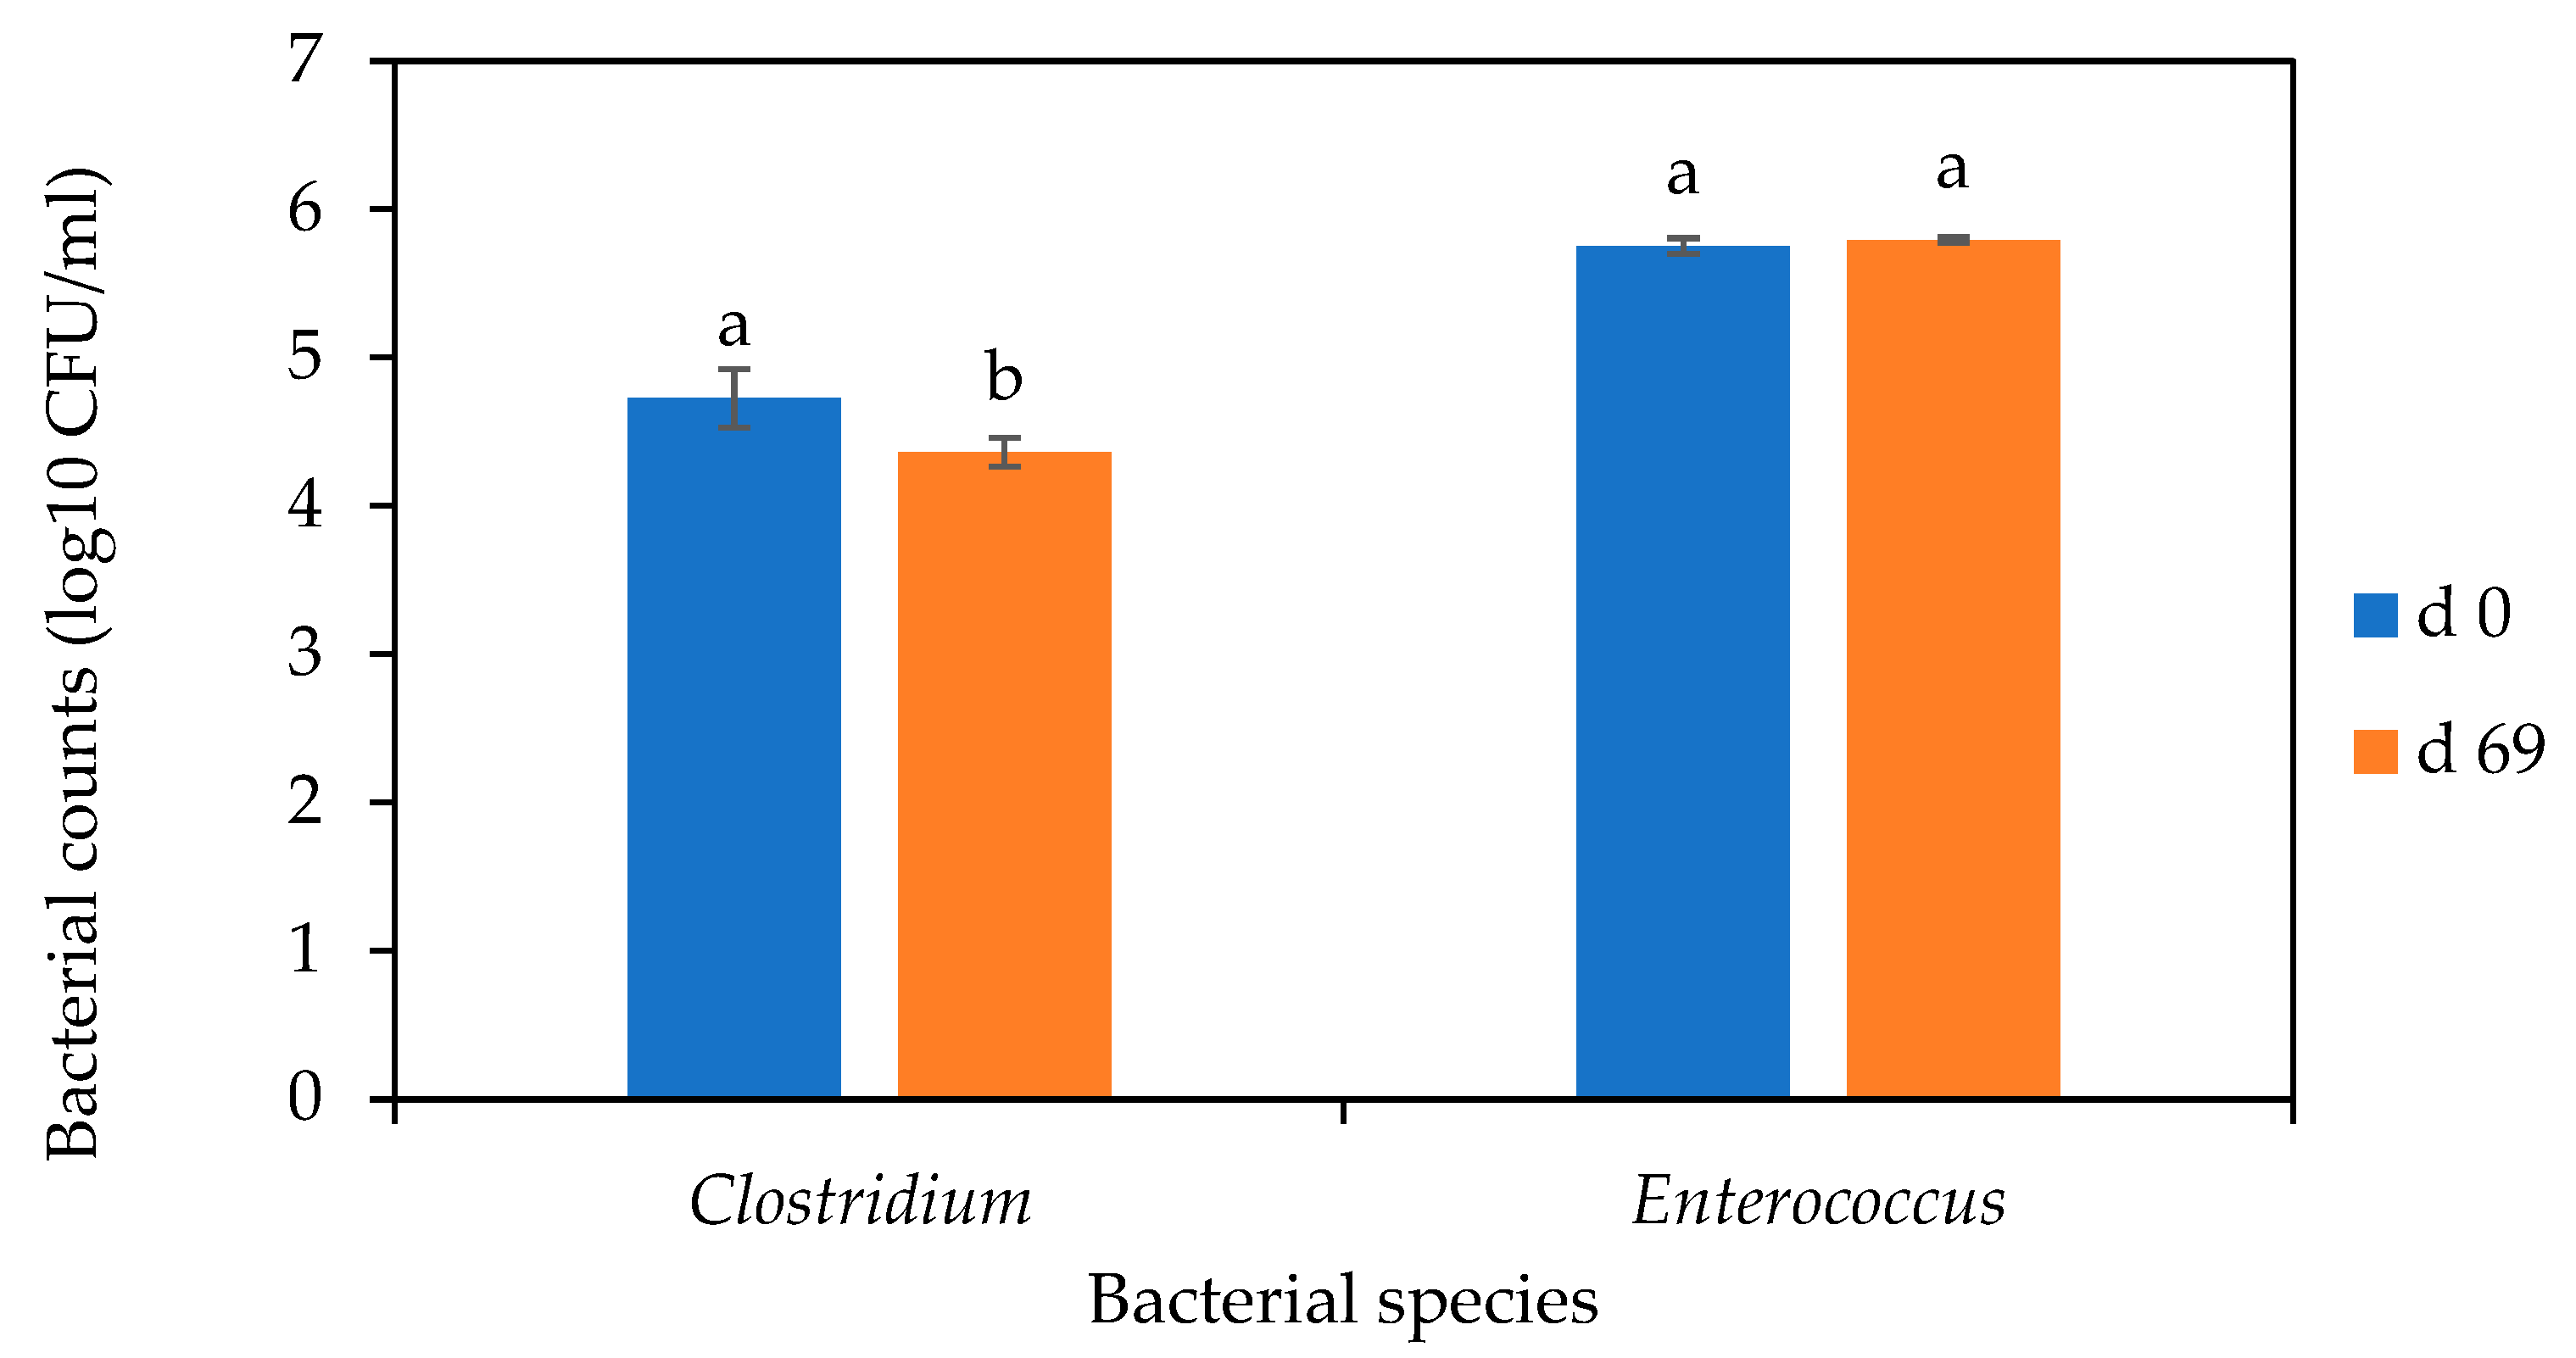
3.5. Fate of Clostridium and Enterococcus spp. during Secondary Digestion
3.6. Molecular Analyses of Microbial Communities
3.6.1. Identification of Bacterial Strains through Sanger Sequencing
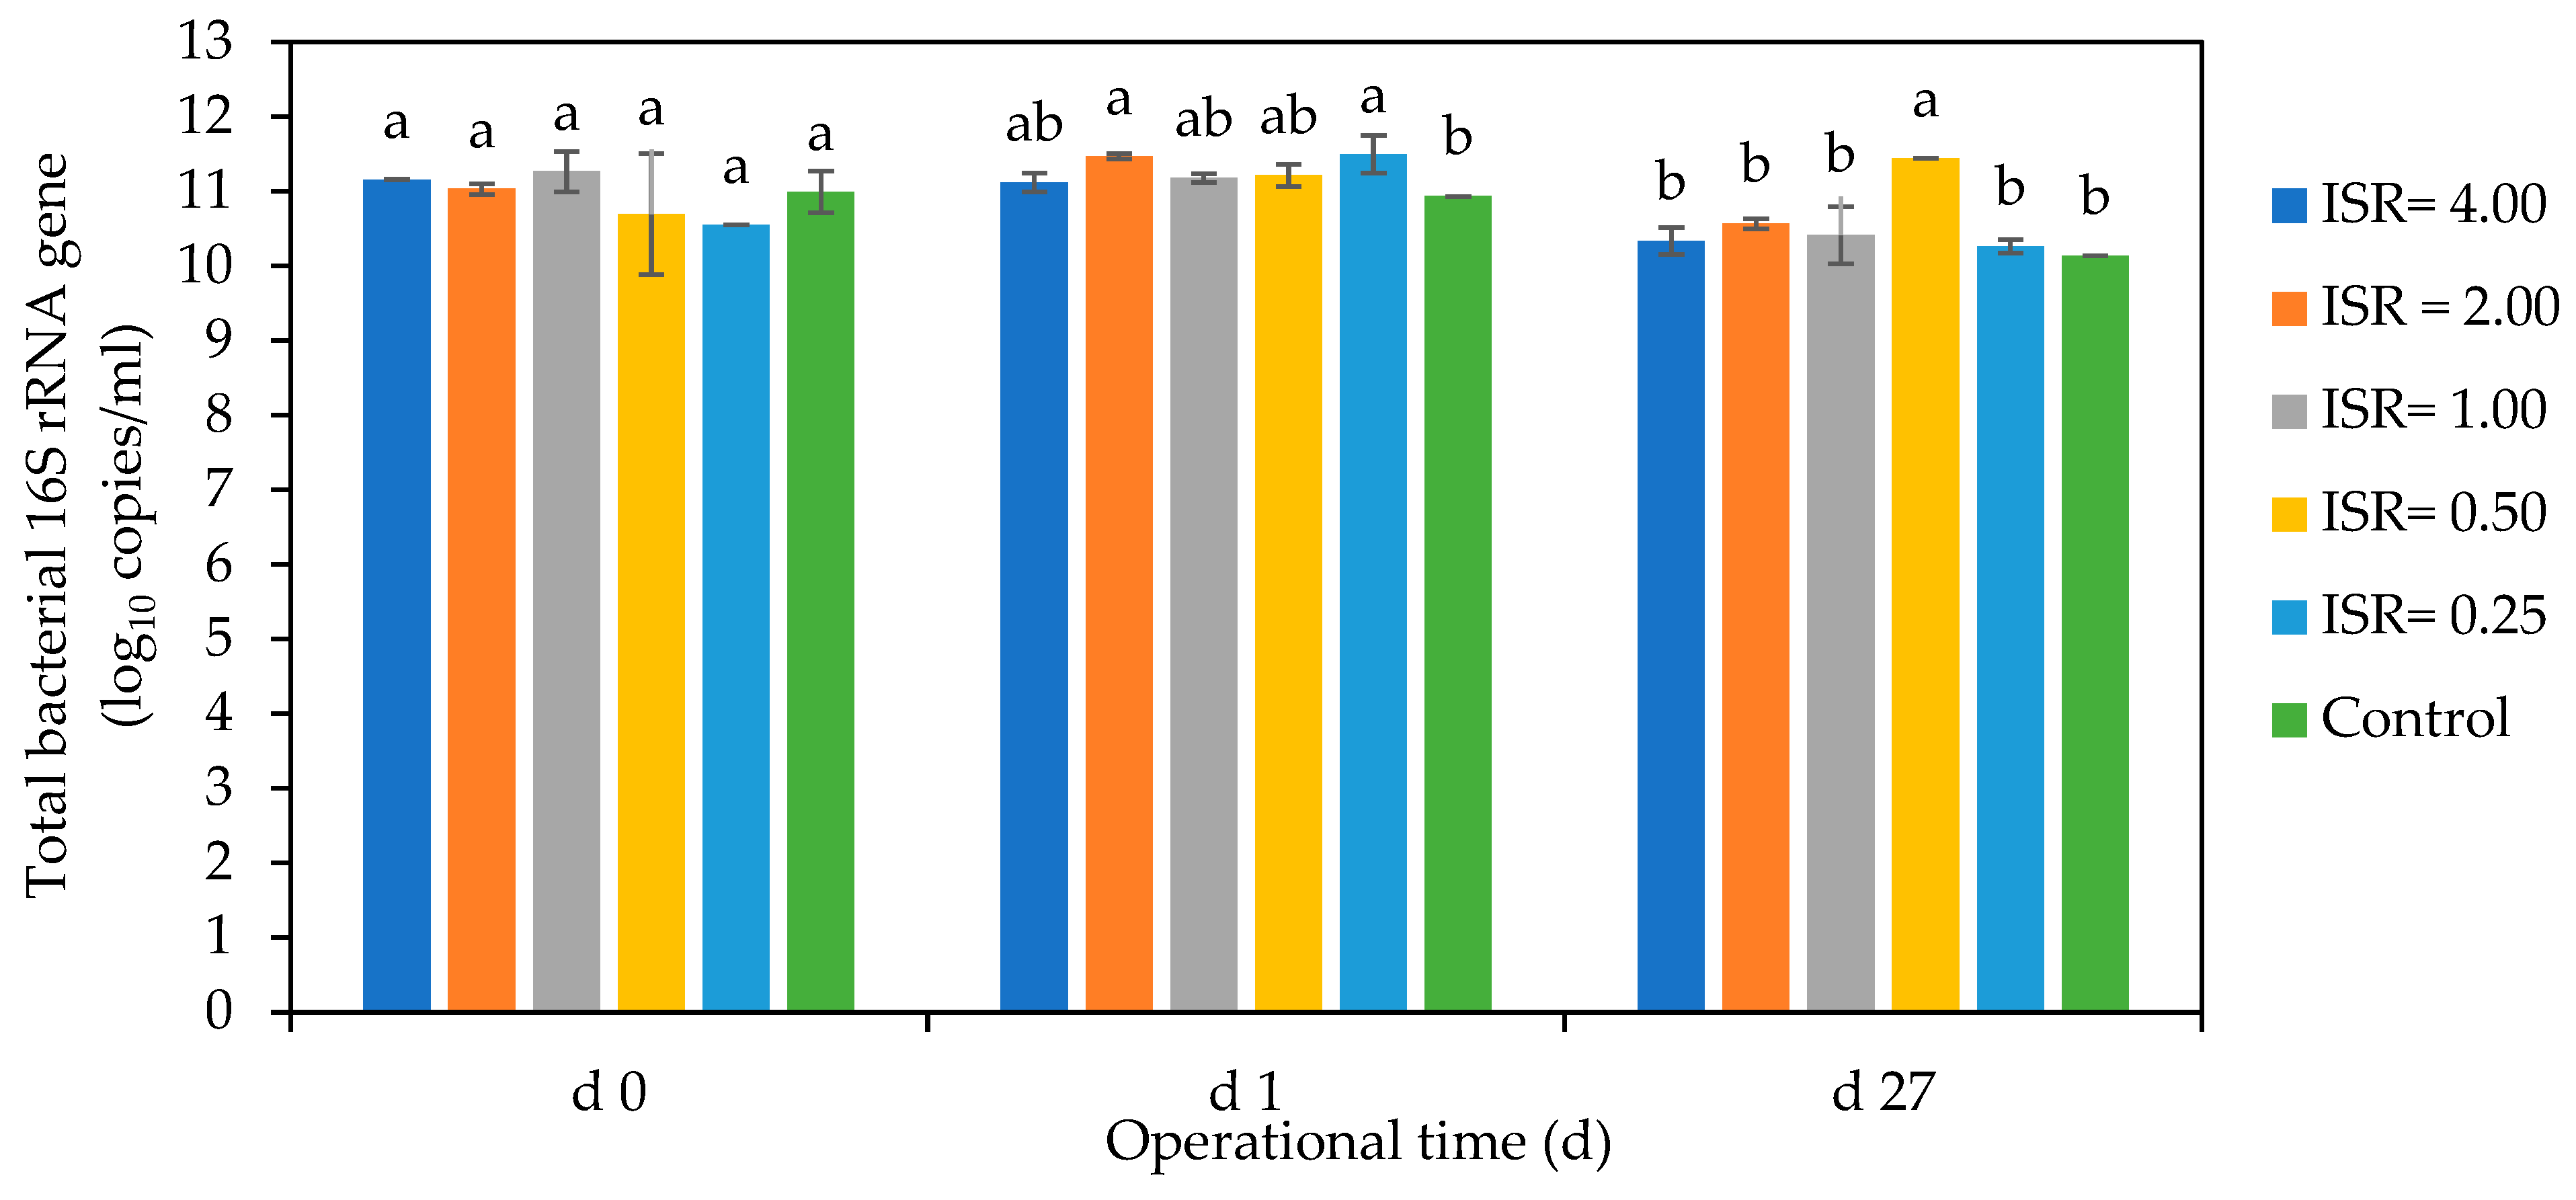
3.6.2. Enumeration of Microbial Communities through RT-qPCR
Bacterial Gene Copies
Fungal Gene Copies
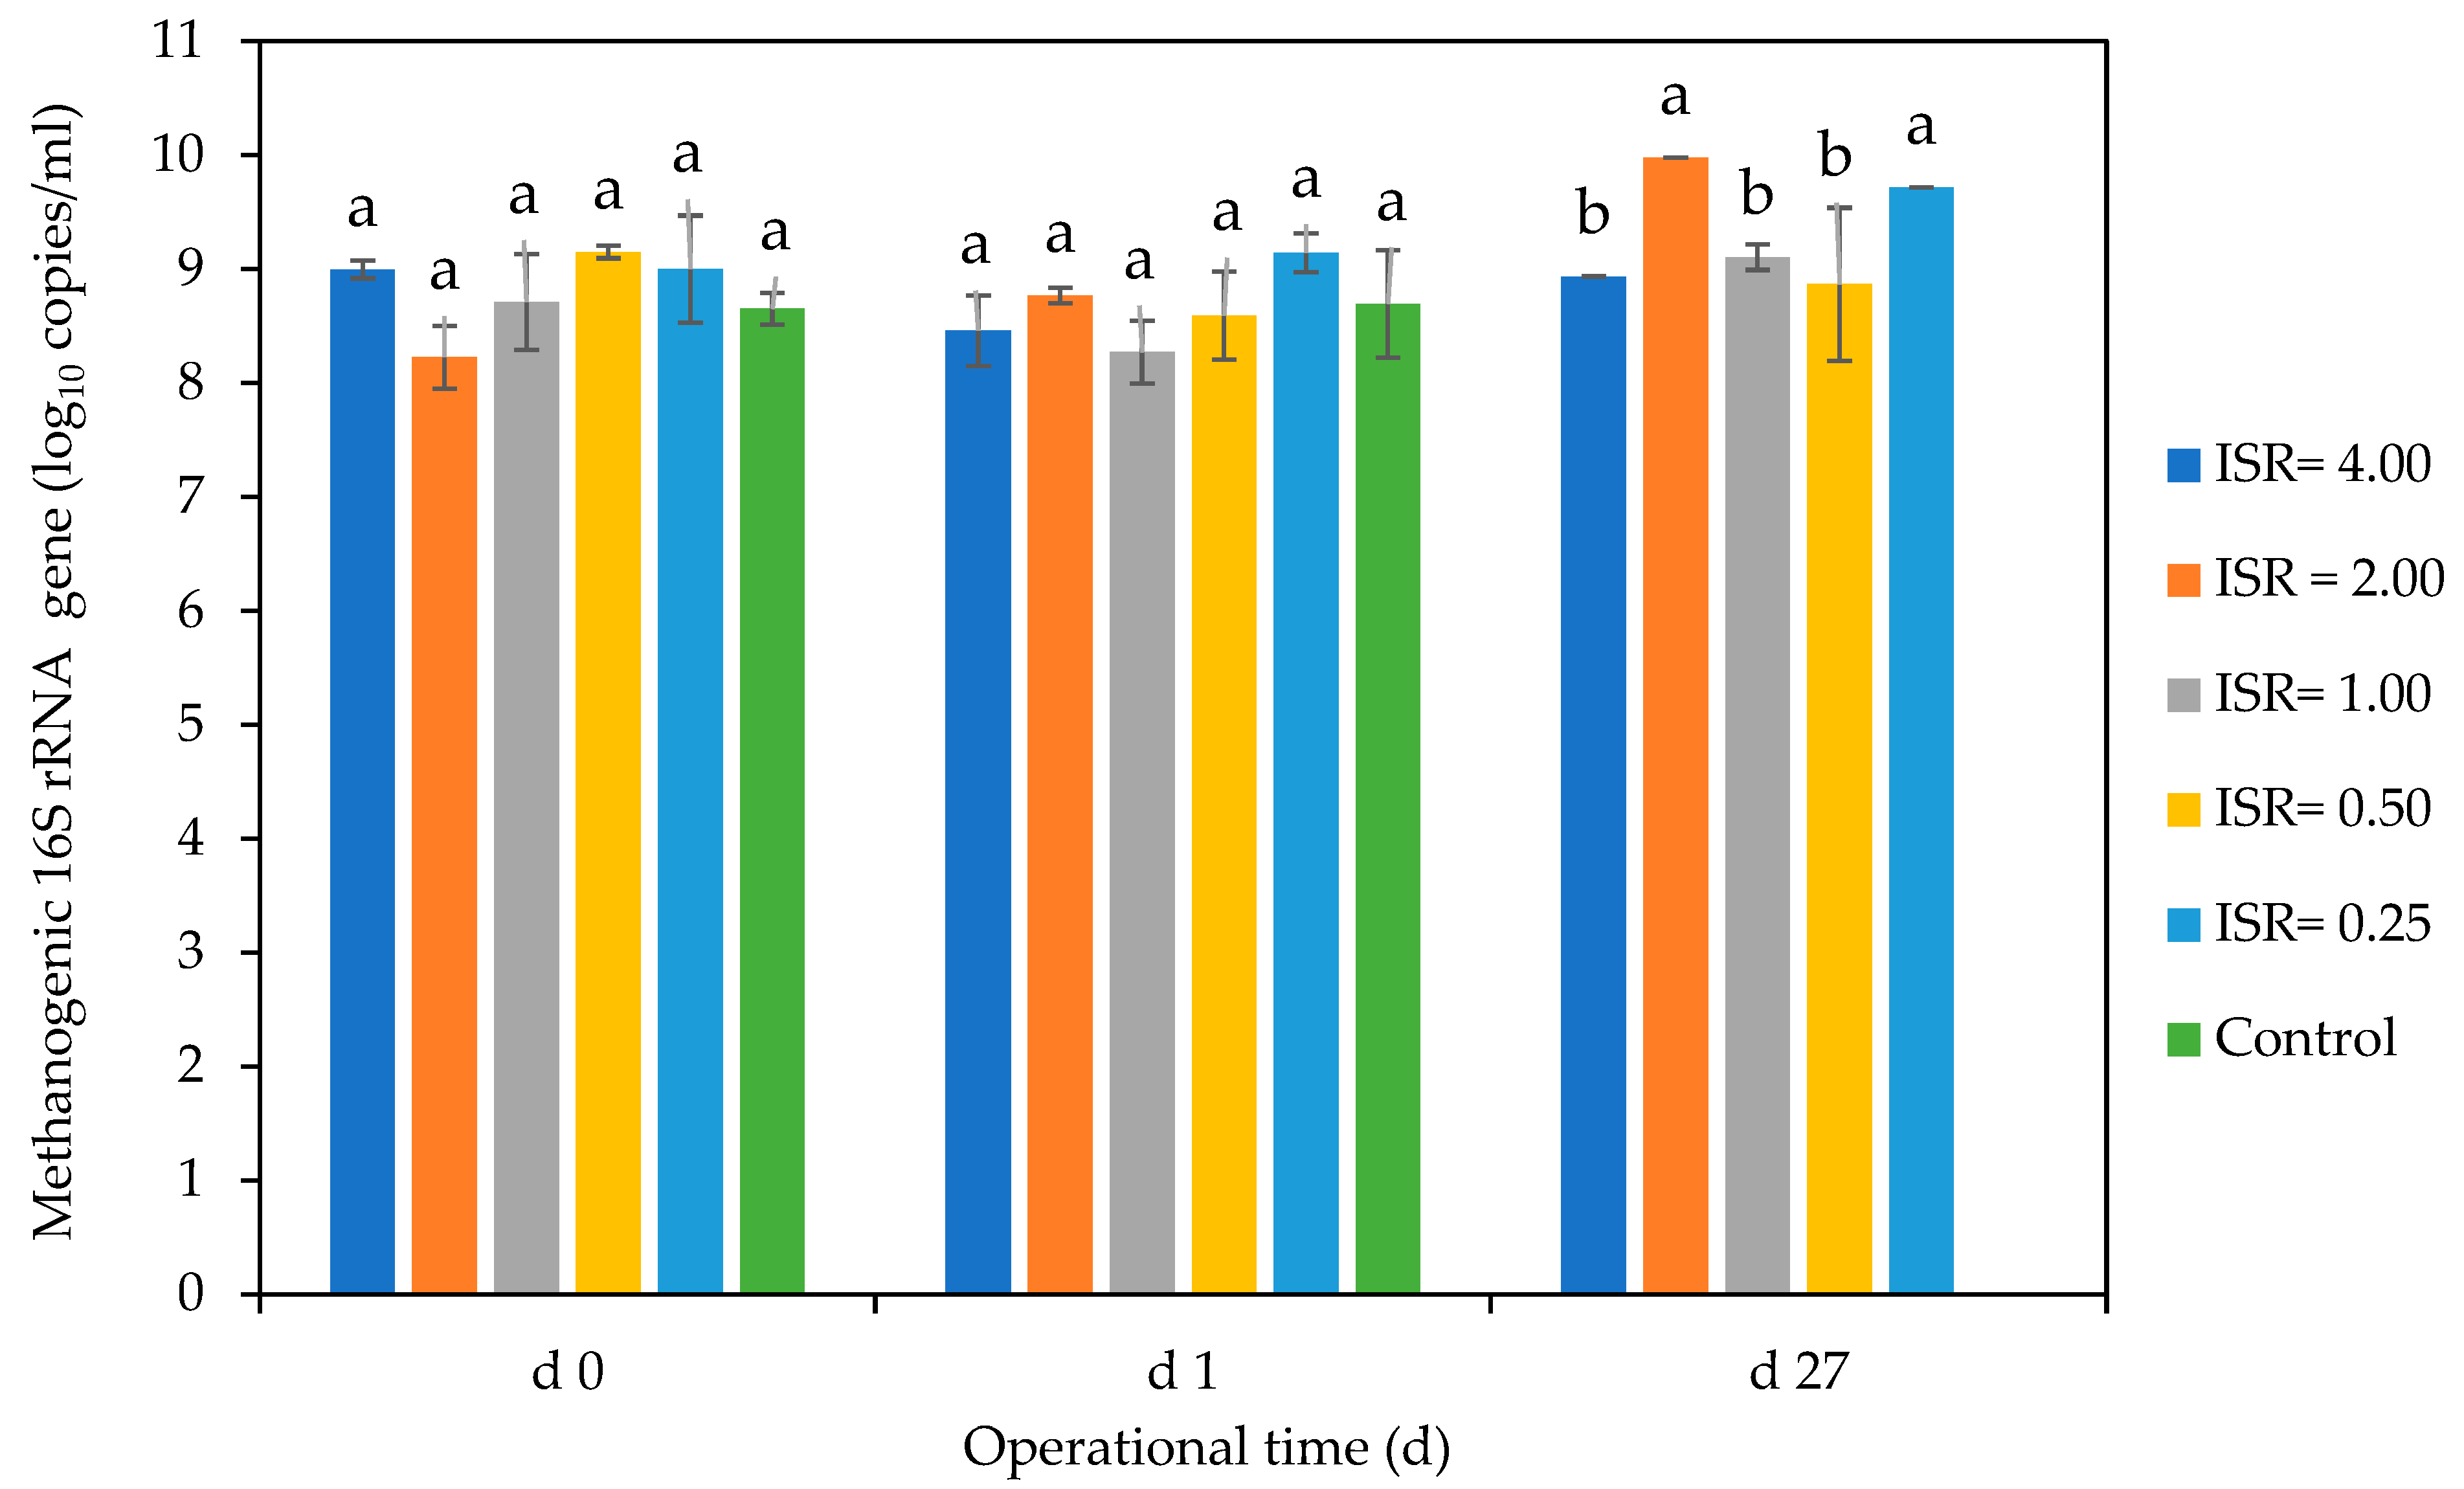
Methanogenic Gene Copies
4. Discussion
4.1. Inactivation of E. coli Strains and Coliforms across ISRs during AD of SFW
4.2. Fate of Clostridium and Enterococcus spp. during AD and Post AD Effluent Storage
4.3. Bacterial Species Identified through Sanger Sequencing during the AD of SFW
4.4. The Effect of ISR on Total Bacterial and Fungal Communities
4.5. Effect of ISRs on Methanogenic Gene Copies
5. Conclusions
Supplementary Materials
Author Contributions
Funding
Data Availability Statement
Acknowledgments
Conflicts of Interest
References
- López Velarde Santos, M.; Ventura Ramos, E.; Rodríguez Morales, J.A.; Oliver, H. Effect of inoculum source on the anaerobic digestion of mezcal vinasses at different substrate-inoculum ratios. Rev. Int. Contam. Ambient. 2020, 36, 81–95. [Google Scholar] [CrossRef]
- Zhang, J.; Zhang, L.; Loh, K.C.; Dai, Y.; Tong, Y.W. Enhanced anaerobic digestion of food waste by adding activated carbon: Fate of bacterial pathogens and antibiotic resistance genes. Biochem. Eng. J. 2017, 128, 19–25. [Google Scholar] [CrossRef]
- Riding, M.J.; Herbert, B.M.J.; Ricketts, L.; Dodd, I.; Ostle, N.; Semple, K.T. Harmonising conflicts between science, regulation, perception and environmental impact: The case of soil conditioners from bioenergy. Environ. Int. 2015, 75, 52–67. [Google Scholar] [CrossRef] [PubMed]
- Xing, B.S.; Wang, X.C. High-rate mesophilic co-digestion with food waste and waste activated sludge through a low-magnitude increasing loading regime: Performance and microorganism characteristics. Sci. Total Environ. 2021, 777, 146210. [Google Scholar] [CrossRef]
- Wang, X.; Wang, P.; Meng, X.; Ren, L. Performance and metagenomics analysis of anaerobic digestion of food waste with adding biochar supported nano zero-valent iron under mesophilic and thermophilic condition. Sci. Total Environ. 2022, 820, 153244. [Google Scholar] [CrossRef] [PubMed]
- Li, X.; Wu, M.; Xue, Y. Nickel-loaded shrimp shell biochar enhances batch anaerobic digestion of food waste. Bioresour. Technol. 2022, 352, 127092. [Google Scholar] [CrossRef]
- Jang, H.M.; Choi, S.; Shin, J.; Kan, E.; Mo Kim, Y. Additional reduction of antibiotic resistance genes and human bacterial pathogens via thermophilic aerobic digestion of anaerobically digested sludge. Bioresour. Technol. 2019, 273, 259–268. [Google Scholar] [CrossRef] [PubMed]
- Seruga, P.; Krzywonos, M.; Paluszak, Z.; Urbanowska, A.; Pawlak-Kruczek, H.; Niedźwiecki, Ł.; Pińkowska, H. Pathogen reduction potential in anaerobic digestion of organic fraction of municipal solid waste and food waste. Molecules 2020, 25, 275. [Google Scholar] [CrossRef]
- Ma, G.; Chen, Y.; Ndegwa, P. Anaerobic digestion process deactivates major pathogens in biowaste: A Meta-Analysis. Renew. Sustain. Energy Rev. 2022, 153, 111752. [Google Scholar] [CrossRef]
- Le Maréchal, C.; Druilhe, C.; Repérant, E.; Boscher, E.; Rouxel, S.; Le Roux, S.; Poëzévara, T.; Ziebal, C.; Houdayer, C.; Nagard, B.; et al. Evaluation of the occurrence of sporulating and nonsporulating pathogenic bacteria in manure and in digestate of five agricultural biogas plants. Microbiologyopen 2019, 8, e872. [Google Scholar] [CrossRef]
- Lorine, D.; Céline, D.; Caroline, L.M.; Frédéric, B.; Lorette, H.; Julie, B.; Laure, M.; Christine, Z.; Typhaine, P.; Sandra, R.; et al. Influence of operating conditions on the persistence of E. coli, Enterococci, Clostridium perfringens and Clostridioides difficile in semi-continuous mesophilic anaerobic reactors. Waste Manag. 2021, 134, 32–41. [Google Scholar] [CrossRef]
- Avery, L.M.; Anchang, K.Y.; Tumwesige, V.; Strachan, N.; Goude, P.J. Potential for pathogen reduction in anaerobic digestion and biogas generation in Sub-Saharan Africa. Biomass Bioenergy 2014, 70, 112–124. [Google Scholar] [CrossRef]
- Jex, A.R.; Stanley, K.K.; Lo, W.; Littman, R.; Verweij, J.J.; Campbell, B.E.; Nolan, M.J.; Pangasa, A.; Stevens, M.A.; Haydon, S.; et al. Detection of diarrhoeal pathogens in human faeces using an automated, robotic platform. Mol. Cell Probes 2012, 26, 11–15. [Google Scholar] [CrossRef] [PubMed]
- Nastasijevic, I.; Mitrovic, R.; Buncic, S. The occurrence of Escherichia coli O157 in/on faeces, carcasses and fresh meats from cattle. Meat Sci. 2009, 82, 101–105. [Google Scholar] [CrossRef]
- Mahmud, Z.H.; Islam, M.S.; Imran, K.M.; Hakim, S.A.I.; Worth, M.; Ahmed, A.; Hossan, S.; Haider, M.; Islam, M.R.; Hossain, F.; et al. Occurrence of Escherichia coli and faecal coliforms in drinking water at source and household point-of-use in Rohingya camps, Bangladesh. Gut Pathog. 2019, 11, 52. [Google Scholar] [CrossRef] [PubMed]
- Zhao, Q.; Liu, Y. Is anaerobic digestion a reliable barrier for deactivation of pathogens in biosludge? Sci. Total Environ. 2019, 668, 893–902. [Google Scholar] [CrossRef] [PubMed]
- Meegoda, J.N.; Li, B.; Patel, K.; Wang, L.B. A review of the processes, parameters, and optimization of anaerobic digestion. Int. J. Environ. Res. Public. Health 2018, 15, 2224. [Google Scholar] [CrossRef] [PubMed]
- Fang, W.; Zhang, P.; Gou, X.; Zhang, H.; Wu, Y.; Ye, J.; Zeng, G. Volatile fatty acid production from spent mushroom compost: Effect of total solid content. Int. Biodeterior. Biodegrad. 2016, 113, 217–221. [Google Scholar] [CrossRef]
- Akkermans, S.; Van Impe, J.F. Mechanistic modelling of the inhibitory effect of pH on microbial growth. Food Microbiol. 2018, 72, 214–219. [Google Scholar] [CrossRef]
- Slimane, K.; Fathya, S.; Assia, K.; Hamza, M. Influence of inoculums/substrate ratios (ISRs) on the mesophilic anaerobic digestion of slaughterhouse waste in batch mode: Process stability and biogas production. Energy Procedia 2014, 50, 57–63. [Google Scholar] [CrossRef]
- Fontana, A.; Soldano, M.; Bellassi, P.; Fabbri, C.; Gallucci, F.; Morelli, L.; Cappa, F. Dynamics of Clostridium genus and hard-cheese spoiling Clostridium species in anaerobic digesters treating agricultural biomass. AMB Express 2020, 10, 102. [Google Scholar] [CrossRef]
- Flores-Mendoza, A.P.; Hernández-García, H.; Cocotle-Ronzón, Y.; Hernandez-Martinez, E. Methanogenesis of raw cheese whey: pH and substrate–inoculum ratio evaluation at mesophyll temperature range. J. Chem. Technol. Biotechnol. 2020, 95, 1946–1952. [Google Scholar] [CrossRef]
- Ince, O.; Akyol, Ç.; Ozbayram, E.G.; Tutal, B.; Ince, B. Enhancing methane production from anaerobic co-digestion of cow manure and barley: Link between process parameters and microbial community dynamics. Environ. Prog. Sustain. Energy 2020, 39, 13292. [Google Scholar] [CrossRef]
- Khadka, A.; Parajuli, A.; Dangol, S.; Thapa, B.; Sapkota, L.; Carmona-Martínez, A.A.; Ghimire, A. Effect of the substrate to inoculum ratios on the kinetics of biogas production during the mesophilic anaerobic digestion of food waste. Energies 2022, 15, 834. [Google Scholar] [CrossRef]
- Gandhi, B.P.; Otite, S.V.; Fofie, E.A.; Lag-Brotons, A.J.; Ezemonye, L.I.; Semple, K.T.; Martin, A.D. Kinetic investigations into the effect of inoculum to substrate ratio on batch anaerobic digestion of simulated food waste. Renew. Energy 2022, 195, 311–321. [Google Scholar] [CrossRef]
- Arias, D.E.; Veluchamy, C.; Dunfield, K.E.; Habash, M.B.; Gilroyed, B.H. Hygienization and microbial metabolic adaptation during anaerobic co-digestion of swine manure and corn stover. Bioresour. Technol. 2020, 306, 123168. [Google Scholar] [CrossRef] [PubMed]
- Fagbohungbe, M.O.; Herbert, B.M.J.; Li, H.; Ricketts, L.; Semple, K.T. The Effect of substrate to inoculum ratios on the anaerobic digestion of human faecal material. Environ. Technol. Innov. 2015, 3, 121–129. [Google Scholar] [CrossRef]
- Ventour, L.; WRAP (Waste & Resources Action Programme). The Food We Waste. 2008. Available online: https://www.lefigaro.fr/assets/pdf/Etude%20gaspillage%20alimentaire%20UK2008.pdf (accessed on 18 December 2023).
- Lambertsen, L.; Sternberg, C.; Molin, S. Mini-Tn7 Transposons for site-specific tagging of bacteria with fluorescent proteins. Environ. Microbiol. 2004, 6, 726–732. [Google Scholar] [CrossRef] [PubMed]
- APHA. Standard Methods for Examination of Water and Wastewater, 21st ed.; APHA: Washington DC, USA, 2005. [Google Scholar] [CrossRef]
- Erickson, M.C.; Liao, J.; Ma, L.; Jiang, X.; Doyle, M.P. Thermal and nonthermal factors affecting survival of Salmonella and Listeria monocytogenes in animal manure-based compost mixtures. J. Food Prot. 2014, 77, 1512–1518. [Google Scholar] [CrossRef] [PubMed]
- Ding, T.; Liao, X.; Deng, Y.; Shen, C.; Feng, J. (Eds.) Viable but nonculturable bacteria. In Stress Responses of Foodborne Pathogens; Springer International Publishing: Cham, Switzerland, 2022; pp. 401–431. ISBN 978-3-030-90578-1. [Google Scholar]
- Lin, M.; Ren, L.; Mdondo Wandera, S.; Liu, Y.; Dong, R.; Qiao, W. Enhancing pathogen inactivation in pig manure by introducing thermophilic and hyperthermophilic hygienization in a two-stage anaerobic digestion process. Waste Manag. 2022, 144, 123–131. [Google Scholar] [CrossRef]
- Černý, M.; Vítězová, M.; Vítěz, T.; Bartoš, M.; Kushkevych, I. Variation in the distribution of hydrogen producers from the Clostridiales order in biogas reactors depending on different input substrates. Energies 2018, 11, 3270. [Google Scholar] [CrossRef]
- Derongs, L.; Druilhe, C.; Ziebal, C.; Le Maréchal, C.; Pourcher, A.M. Characterization of Clostridium perfringens isolates collected from three agricultural biogas plants over a one-year period. Int. J. Environ. Res. Public. Health 2020, 17, 5450. [Google Scholar] [CrossRef] [PubMed]
- Qin, S.; Wainaina, S.; Liu, H.; Soufiani, A.M.; Pandey, A.; Zhang, Z.; Awasthi, M.K.; Taherzadeh, M.J. Microbial dynamics during anaerobic digestion of sewage sludge combined with food waste at high organic loading rates in immersed membrane bioreactors. Fuel 2021, 303, 121276. [Google Scholar] [CrossRef]
- Liu, X.; Lendormi, T.; Lanoisellé, J.L. Conventional and innovative hygienization of feedstock for biogas production: Resistance of indicator bacteria to thermal pasteurization, pulsed electric field treatment, and anaerobic digestion. Energies 2021, 14, 1938. [Google Scholar] [CrossRef]
- Do, T.T.; Nolan, S.; Hayes, N.; O’Flaherty, V.; Burgess, C.; Brennan, F.; Walsh, F. Metagenomic and HT-qPCR analysis reveal the microbiome and resistome in pig slurry under storage, composting, and anaerobic digestion. Environ. Pollut. 2022, 305, 119271. [Google Scholar] [CrossRef] [PubMed]
- Logan, M.; Visvanathan, C. Management strategies for anaerobic digestate of organic fraction of municipal solid waste: Current status and future prospects. Waste Manag. Res. 2019, 37, 27–39. [Google Scholar] [CrossRef]
- Schilling, T.; Hoelzle, K.; Philipp, W.; Hoelzle, L.E. Survival of Salmonella typhimurium, Listeria monocytogenes, and ESBL carrying Escherichia coli in stored anaerobic biogas digestates in relation to different biogas input materials and storage temperatures. Agriculture 2022, 12, 67. [Google Scholar] [CrossRef]
- Carraturo, F.; Panico, A.; Giordano, A.; Libralato, G.; Aliberti, F.; Galdiero, E.; Guida, M. Hygienic assessment of digestate from a high solids anaerobic co-digestion of sewage sludge with biowaste by testing Salmonella typhimurium, Escherichia coli and SARS-CoV-2. Environ. Res. 2022, 206, 112585. [Google Scholar] [CrossRef]
- Subirats, J.; Sharpe, H.; Topp, E. Fate of clostridia and other spore-forming Firmicute bacteria during feedstock anaerobic digestion and aerobic composting. J. Environ. Manag. 2022, 309, 114643. [Google Scholar] [CrossRef]
- Ali, L.; Mustafa, M.; Xiao, Z.R.; Islam, W.; Ara, U.; Ajmal, M.; Khan, K.A.; Ghramh, H.A.; Yu, D. Responses of Enterococcus faecalis resistance and cytolysin up-regulation to nutrients in constructed mesocosms. J. King Saud. Univ. Sci. 2022, 34, 101680. [Google Scholar] [CrossRef]
- Govasmark, E.; Stäb, J.; Holen, B.; Hoornstra, D.; Nesbakk, T.; Salkinoja-Salonen, M. Chemical and microbiological hazards associated with recycling of anaerobic digested residue intended for agricultural use. Waste Manag. 2011, 31, 2577–2583. [Google Scholar] [CrossRef]
- Alfa, M.I.; Adie, D.B.; Igboro, S.B.; Oranusi, U.S.; Dahunsi, S.O.; Akali, D.M. Assessment of biofertilizer quality and health implications of anaerobic digestion effluent of cow dung and chicken droppings. Renew. Energy 2014, 63, 681–686. [Google Scholar] [CrossRef]
- Owamah, H.I.; Dahunsi, S.O.; Oranusi, U.S.; Alfa, M.I. Fertilizer and sanitary quality of digestate biofertilizer from the co-digestion of food waste and human excreta. Waste Manag. 2014, 34, 747–752. [Google Scholar] [CrossRef]
- Seo, K.W.; Choi, Y.S.; Gu, M.B.; Kwon, E.E.; Tsang, Y.F.; Rinklebe, J.; Park, C. Pilot-scale investigation of sludge reduction in aerobic digestion system with endospore-forming bacteria. Chemosphere 2017, 186, 202–208. [Google Scholar] [CrossRef]
- Vaerewijck, M.J.M.; De Vos, P.; Lebbe, L.; Scheldeman, P.; Hoste, B.; Heyndrickx, M. Occurrence of Bacillus sporothermodurans and other aerobic spore-forming species in feed concentrate for dairy cattle. J. Appl. Microbiol. 2001, 91, 1074–1084. [Google Scholar] [CrossRef] [PubMed]
- Vu, V.; Farkas, C.; Riyad, O.; Bujna, E.; Kilin, A.; Sipiczki, G.; Sharma, M.; Usmani, Z.; Gupta, V.K.; Nguyen, Q.D. Enhancement of the enzymatic hydrolysis efficiency of wheat bran using the Bacillus Strains and their consortium. Bioresour. Technol. 2022, 343, 126092. [Google Scholar] [CrossRef]
- Kumar, V.; Rawat, J.; Patil, R.C.; Barik, C.R.; Purohit, S.; Jaiswal, H.; Fartyal, N.; Goud, V.V.; Kalamdhad, A.S. Exploring the functional significance of novel cellulolytic bacteria for the anaerobic digestion of rice straw. Renew. Energy 2021, 169, 485–497. [Google Scholar] [CrossRef]
- Suryaletha, K.; Narendrakumar, L.; John, J.; Radhakrishnan, M.P.; George, S.; Thomas, S. Decoding the proteomic changes involved in the biofilm formation of Enterococcus faecalis SK460 to elucidate potential biofilm determinants. BMC Microbiol. 2019, 19, 146. [Google Scholar] [CrossRef] [PubMed]
- Cholley, A.C.; Traoré, O.; Hennequin, C.; Aumeran, C. Klebsiella pneumoniae survival and regrowth in endoscope channel biofilm exposed to glutaraldehyde and desiccation. Eur. J. Clin. Microbiol. Infect. Dis. 2020, 39, 1129–1136. [Google Scholar] [CrossRef] [PubMed]
- Gaca, A.O.; Lemos, J.A. Adaptation to Adversity: The intermingling of stress tolerance and pathogenesis in Enterococci. Microbiol. Mol. Biol. Rev. 2019, 83, e00008-19. [Google Scholar] [CrossRef]
- Alghamdi, F.; Shakir, M. The Influence of Enterococcus faecalis as a dental root canal pathogen on endodontic treatment: A Systematic review. Cureus 2020, 12, e7257. [Google Scholar] [CrossRef] [PubMed]
- De Maat, V.; Arredondo-Alonso, S.; Willems, R.J.L.; Van Schaik, W. Conditionally essential genes for survival during starvation in Enterococcus faecium E745. BMC Genom. 2020, 21, 568. [Google Scholar] [CrossRef] [PubMed]
- dos Santos Melo-Nascimento, A.O.; Anna, B.M.M.S.; Gonçalves, C.C.; Santos, G.; Noronha, E.; Parachin, N.; de Abreu Roque, M.R.; Bruce, T. Complete genome reveals genetic repertoire and potential metabolic strategies involved in lignin degradation by environmental ligninolytic Klebsiella variicola P1CD1. PLoS ONE 2020, 15, e0243739. [Google Scholar] [CrossRef] [PubMed]
- Demoling, F.; Figueroa, D.; Bååth, E. Comparison of factors limiting bacterial growth in different soils. Soil. Biol. Biochem. 2007, 39, 2485–2495. [Google Scholar] [CrossRef]
- Ratzke, C.; Barrere, J.; Gore, J. Strength of species interactions determines biodiversity and stability in microbial communities. Nat. Ecol. Evol. 2020, 4, 376–383. [Google Scholar] [CrossRef]
- Jeong, S.Y.; Kim, T.G. Determination of methanogenesis by nutrient availability via regulating the relative fitness of methanogens in anaerobic digestion. Sci. Total Environ. 2022, 838, 156002. [Google Scholar] [CrossRef]
- Maynaud, G.; Pourcher, A.M.; Ziebal, C.; Cuny, A.; Druilhe, C.; Steyer, J.P.; Wéry, N. Persistence and potential viable but non-culturable state of pathogenic bacteria during storage of digestates from agricultural biogas plants. Front. Microbiol. 2016, 7, 1469. [Google Scholar] [CrossRef]
- Yıldırım, E.; Ince, O.; Aydin, S.; Ince, B. Improvement of biogas potential of anaerobic digesters using rumen fungi. Renew. Energy 2017, 109, 346–353. [Google Scholar] [CrossRef]
- Aydin, S.; Yıldırım, E.; Ince, O.; Ince, B. Rumen anaerobic fungi create new opportunities for enhanced methane production from microalgae biomass. Algal Res. 2017, 23, 150–160. [Google Scholar] [CrossRef]
- Schnürer, A.; Schnürer, J. Fungal survival during anaerobic digestion of organic household waste. Waste Manag. 2006, 26, 1205–1211. [Google Scholar] [CrossRef]
- Vinzelj, J.; Joshi, A.; Insam, H.; Podmirseg, S.M. Employing anaerobic fungi in biogas production: Challenges & opportunities. Bioresour. Technol. 2020, 300, 122687. [Google Scholar]
- Abdullah, N.; Nawawi, A.; Othman, I. Fungal spoilage of starch-based foods in relation to its water activity (aw). J. Stored Prod. Res. 2000, 36, 47–54. [Google Scholar] [CrossRef]
- Nielsen, K.F.; Holm, G.; Uttrup, L.P.; Nielsen, P.A. Mould growth on building materials under low water activities. Influence of humidity and temperature on fungal growth and secondary metabolism. Int. Biodeterior. Biodegrad. 2004, 54, 325–336. [Google Scholar] [CrossRef]
- Yang, X.; Zhang, Z.; Li, S.; He, Q.; Peng, X.; Du, X.; Feng, K.; Wang, S.; Deng, Y. Fungal dynamics and potential functions during anaerobic digestion of food waste. Environ. Res. 2022, 212, 113298. [Google Scholar] [CrossRef] [PubMed]
- Traversi, D.; Villa, S.; Lorenzi, E.; Degan, R.; Gilli, G. Application of a real-time qPCR method to measure the methanogen concentration during anaerobic digestion as an indicator of biogas production capacity. J. Environ. Manag. 2012, 111, 173–177. [Google Scholar] [CrossRef]
- Li, Y.; Chen, Z.; Peng, Y.; Huang, W.; Liu, J.; Mironov, V.; Zhang, S. Deeper insights into the effects of substrate to inoculum ratio selection on the relationship of kinetic parameters, Microbial communities, and key metabolic pathways during the anaerobic digestion of food waste. Water Res. 2022, 217, 118440. [Google Scholar] [CrossRef]
- Hu, Y.; Ma, H.; Shi, C.; Kobayashi, T.; Xu, K.Q. Nutrient augmentation enhances biogas production from sorghum mono-digestion. Waste Manag. 2021, 119, 63–71. [Google Scholar] [CrossRef]
- Million, M.; Tidjani Alou, M.; Khelaifia, S.; Bachar, D.; Lagier, J.C.; Dione, N.; Brah, S.; Hugon, P.; Lombard, V.; Armougom, F.; et al. Increased gut redox and depletion of anaerobic and methanogenic prokaryotes in severe acute malnutrition. Sci. Rep. 2016, 6, 26051. [Google Scholar] [CrossRef]


| Bacteria | SFW (log10 CFU/mL) | Inoculum (log10 CFU/mL) |
|---|---|---|
| Total culturable bacteria | 5.57 ± 0.12 | 6.34 ± 0.02 |
| E. coli | - | - |
| Total coliforms | 4.47 ± 0.05 | 3.26 ± 0.24 |
| Non-lactose fermenting species (on MacConkey agar) | - | 5.75 ± 0.05 |
| Clostridium sp. | - | 3.37 ± 0.01 |
| Enterococcus sp. | 2.06 ± 0.08 | 6.90 ± 0.08 |
| Bacterial Strains | Accession Number |
|---|---|
| Escherichia coli DSM 30083 = JCM 1649 | CP033092.2 |
| Klebsiella pneumoniae A17 | KU711920.1 |
| Enterococcus dispar GS02 | KY569462.1 |
| Bacillus aerius SPF29 | MH160719.1 |
| Klebsiella michiganensis F107 | CP024643.1 |
| Bacillus sp. M-265 | MK634697.1 |
| Enterococcus faecium NMCC-203 | MN493726.1 |
| Bacillus encimensis RW13 | KY569474.1 |
| Proteus mirabilis LO01 | KX966458.1 |
Disclaimer/Publisher’s Note: The statements, opinions and data contained in all publications are solely those of the individual author(s) and contributor(s) and not of MDPI and/or the editor(s). MDPI and/or the editor(s) disclaim responsibility for any injury to people or property resulting from any ideas, methods, instructions or products referred to in the content. |
© 2024 by the authors. Licensee MDPI, Basel, Switzerland. This article is an open access article distributed under the terms and conditions of the Creative Commons Attribution (CC BY) license (https://creativecommons.org/licenses/by/4.0/).
Share and Cite
Otite, S.V.; Gandhi, B.P.; Agyabeng Fofie, E.; Lag-Brotons, A.J.; Ezemonye, L.I.; Martin, A.D.; Pickup, R.W.; Semple, K.T. Effect of the Inoculum-to-Substrate Ratio on Putative Pathogens and Microbial Kinetics during the Batch Anaerobic Digestion of Simulated Food Waste. Microorganisms 2024, 12, 603. https://doi.org/10.3390/microorganisms12030603
Otite SV, Gandhi BP, Agyabeng Fofie E, Lag-Brotons AJ, Ezemonye LI, Martin AD, Pickup RW, Semple KT. Effect of the Inoculum-to-Substrate Ratio on Putative Pathogens and Microbial Kinetics during the Batch Anaerobic Digestion of Simulated Food Waste. Microorganisms. 2024; 12(3):603. https://doi.org/10.3390/microorganisms12030603
Chicago/Turabian StyleOtite, Saanu Victoria, Bhushan P. Gandhi, Esther Agyabeng Fofie, Alfonso José Lag-Brotons, Lawrence I. Ezemonye, Alastair D. Martin, Roger W. Pickup, and Kirk T. Semple. 2024. "Effect of the Inoculum-to-Substrate Ratio on Putative Pathogens and Microbial Kinetics during the Batch Anaerobic Digestion of Simulated Food Waste" Microorganisms 12, no. 3: 603. https://doi.org/10.3390/microorganisms12030603