Inclusion Body Bead Size in E. coli Controlled by Physiological Feeding
by
 , and
, and
Julian Kopp
1, 
Christoph Slouka
1,*,
Daniel Strohmer
1,
Julian Kager
2,
Oliver Spadiut
2 and
Christoph Herwig
1,2 1
Christian Doppler Laboratory for Mechanistic and Physiological Methods for Improved Bioprocesses, Institute of Chemical Engineering, Vienna University of Technology, 1060 Vienna, Austria
2
Research Division Biochemical Engineering, Institute of Chemical Engineering, Vienna University of Technology, 1060 Vienna, Austria
*
Author to whom correspondence should be addressed.
Microorganisms 2018, 6(4), 116; https://doi.org/10.3390/microorganisms6040116
Submission received: 1 October 2018
/
Revised: 16 November 2018
/
Accepted: 22 November 2018
/
Published: 25 November 2018
(This article belongs to the Special Issue Recombinant Protein Expression in Microorganisms)
Abstract
:The Gram-negative bacterium E. coli is the host of choice for producing a multitude of recombinant proteins relevant in the pharmaceutical industry. Generally, cultivation is easy, media are cheap, and a high product titer can be obtained. However, harsh induction procedures combined with the usage of IPTG (isopropyl β-d-1 thiogalactopyranoside) as an inducer are often believed to cause stress reactions, leading to intracellular protein aggregates, which are so known as so-called inclusion bodies (IBs). Downstream applications in bacterial processes cause the bottleneck in overall process performance, as bacteria lack many post-translational modifications, resulting in time and cost-intensive approaches. Especially purification of inclusion bodies is notoriously known for its long processing times and low yields. In this contribution, we present screening strategies for determination of inclusion body bead size in an E. coli-based bioprocess producing exclusively inclusion bodies. Size can be seen as a critical quality attribute (CQA), as changes in inclusion body behavior have a major effect on subsequent downstream processing. A model-based approach was used, aiming to trigger a distinct inclusion body size: Physiological feeding control, using qs,C as a critical process parameter, has a high impact on inclusion body size and could be modelled using a hyperbolic saturation mechanism calculated in form of a cumulated substrate uptake rate. Within this model, the sugar uptake rate of the cells, in the form of the cumulated sugar uptake-value, was simulated and considered being a key performance indicator for determination of the desired size. We want to highlight that the usage of the mentioned screening strategy in combination with a model-based approach will allow tuning of the process towards a certain inclusion body size using a qs based control only. Optimized inclusion body size at the time-point of harvest should stabilize downstream processing and, therefore, increase the overall time-space yield. Furthermore, production of distinct inclusion body size may be interesting for application as a biocatalyst and nanoparticulate material.
1. Introduction
The gram-negative bacterium E. coli might be one of the best-characterized organisms and has found its place in many different industrial applications [1,2], because E. coli shows very fast replication rates [3,4] on comparatively cheap media [5]. However, the missing glycosylation pattern [1,6,7], as well as intracellular protein production, implies major drawbacks when compared to mammalian cells and yeasts as hosts [8]. Still, proteins that do not need major posttranslational modifications can be produced in bacteria at low costs in short process times [7]. The strain BL21(DE3) created by F. Studier and B. Moffatt back in 1986 [9] is often used on an industrial scale because of very low acetate formation, high replication rates and high production as an effect of the integrated T7-polymerase [9,10,11,12,13,14]. Repressing the lac operon with isopropyl β-d-1 thiogalactopyranoside (IPTG) is still state of the art in most industrial applications [15,16], as the pET-expression-system is known for high replication rates, leading to high amounts of the desired protein [3,12,16].
Inclusion bodies (IB) have emerged from their role as waste products [17] and even are purposely produced in many processes from the 1970s and 80s (e.g., interleukins, insulin) to nowadays [18]. IBs have been believed to be a result of diverse stress reactions, resulting in biologically inactive protein [18,19,20]. Their formation is generally based upon a self-aggregation and overwhelming of the refolding apparatus. Using strong promotors with high production of recombinant proteins, IBs are hard to prevent, but on the other hand side IBs also open up the door for the production of toxic proteins [21]. Intracellular stress can be caused by high temperatures, pH-shifts or due to high feeding rates [22]. However, some of these stress reactions tend to impact in higher yields of product [1]. Still, down-stream processing (DSP) and especially the refolding unit operation is the most time-consuming step in gaining the correctly folded product from E. coli cultivations [17,18,19,20], which requires significantly more technology and time, when purifying protein aggregates for pharmaceutical products [19,23]. In recent years IBs were found to exhibit not only inactive protein structures, but also parts which show enzyme activity [24]. These IBs are nowadays called non-classical Inclusion Bodies (ncIBs) and inherit highly active protein, directly without time-consuming refolding steps [25,26,27]. Active parts of the IB may also be directly used as biocatalysts in different reactions, combining the well mechanical properties with enzymatic reactivity. It has also been shown, that the size has an influence on the biological activity of the protein [28,29]. Beside their enzymatic usage, IBs may also be used based on their mechanical properties as they generally inhibit a distinct bead size combined with high mechanical stability. Therefore, application as nanoparticulate material and as material for tissue engineering is considered [17,28,30]. For all these mentioned applications, IB bead size can be regarded as critical quality attribute (CQA). Changes in size are known to be based on the harvest time during the cultivation. In a recent study, we analyzed detailed effects of classical process parameters pH and temperature on the IB bead size as a function of the induction time [22]. Therefore, control of IB size during the cultivation is an important issue as size is a CQA during these processes. Process performance needs to be directed towards optimal size needed in DSP for pharmaceutical relevant components.
Effects of feeding strategies onto product quality have been already investigated by Spadiut et al. [31] as alterations of the specific growth rate are known to have major influences onto product formation. As high recombinant protein production does implement changes in cell physiology, it is known that there is a decreased growth rate over the duration of induction time [32]. Also biomass formation does suffer from protein induction as it has been referred that biomass yields decrease over induction time, especially when compared to mock strains [33]. Helping to optimize feeding strategies, the term qs has been introduced, determining specific sugar uptake rates, per gram biomass in certain time intervals [31]. Within this study, it was also shown that a stepwise increase, such as a qs-ramp, is superior to a constant feeding profile in Pichia pastoris protein production. The influence of qs ramps onto inclusion body formation was performed by Reichelt et al. [34]. Within this study also the term “qs,crit” was determined, describing the maximum physiological substrate uptake rate. It was shown within this study, that the physiological feeding rate in E. coli is highly dependent onto process parameters and consists of a rather “dynamic nature”. Physiological capacities decline during induced bioprocesses leading to substrate accumulation [35].
In this study, we followed the hypothesis that the specific substrate uptake rate may be a suitable process parameter to steer IB CQA, such as IB size. We performed cultivations with a E. coli BL21(DE3) strain, producing a recombinant pharmaceutical protein coupled to a N-pro-fusion protein [36], expressed exclusively as an IB with the goal to control inclusion body size within the cells based on physiological feeding. Optimized process parameters for temperature (T) and pH were used throughout the whole work, derived in from a different previous study. The specific substrate feeding rate (qs,C) was adapted using glycerol and glucose and responses onto IB bead size were analyzed. Usage of glycerol as media is comparable cheap and since glycerol is regarded as a waste product [37] it might find further applications in future manufacturing. The degree of reduction on glycerol is slightly higher when compared to glucose and titer based productivity seemed to be positively influenced using glycerol as a primary carbon source [38]. We show that IB bead size can be adjusted via the amount of fed carbon source, when keeping T and pH constant during induction. Size variations could be detected throughout the cultivations using scanning electron microscopy. The knowledge generated by these cultivations is used to model IB size based on the glycerol consumption and predict IB size of a cultivation in real time. Using this model-based approach, a defined IB-size at the time point of harvest can be simulated, which should enhance performance as biomaterials or lead to optimized DSP for pharmaceutical products.
2. Materials and Methods
2.1. Bioreactor Cultivations
All cultivations were carried out with the strain E. coli BL21(DE3) consisting of the pet30a plasmid system. The target protein strain was linked to a N-pro fusion protein, which is only expressed as IB (no soluble form) [36]. All bioreactor and preculture cultivations were carried out using a defined minimal medium referred to DeLisa et al. (1999) [5]. Batch media and the preculture media had the same composition with different amounts of glycerol and glucose as carbon source (C-source) respectively. The C-source concentrations for the phases were following.
As pET30a has a Kanamycin resistance gene, antibiotic was added throughout all fermentations, in a final concentration of 0.02 g/L. Precultures were performed using 500 mL high yield flasks (containing the C-source concentrations given in Table 1 or 100 mL Erlenmeyer shake flasks for DasGIP systems). They were inoculated with 1.5 mL of bacteria solution stored in cryo stocks at −80 °C and subsequently cultivated for 20 h at 230 rpm in an Infors HR Multitron shaker (Infors, Bottmingen Switzerland) at 37 °C.
All cultivations were either performed in a Sartorius Biostat Cplus bioreactor (Sartorius, Göttingen, Germany) with 10 L working volume or in a DASGIP Bioreactor 4-parallel fermenter system (max. working V.: 1.7 L; Eppendorf, Hamburg, Germany). Cultivation offgas was analyzed by gas sensors-IR for CO2 and ZrO2 based for O2 (Blue Sens Gas analytics, Herten, Germany). The cultivations were controlled using Lucullus process control system (SecureCell, Schlieren, Switzerland) or the provided DAS-GIP-control system, DASware-control, which logged the process parameters. The reactors were continuously stirred at 1400 rpm.
During induction phase, pH was kept constant at 6.7 and temperature at 31.5 °C and controlled with base only (12.5% NH4OH), while acid (10% H3PO4) was added manually, if necessary. The pH was monitored using a pH-sensor EasyFerm Plus (Hamilton, Reno, NV, USA). Aeration was carried out using mixture of pressurized air and pure oxygen at 2 vvm. Oxygen was added accordingly to keep dissolved oxygen (dO2) always higher than 30%. The dissolved oxygen was monitored using a fluorescence dissolved oxygen electrode Visiferm DO (Hamilton, Reno, NV, USA).
2.2. Cultivation Scheme and qs Adaption
Inoculation was always done with one tenth of the batch media volume. Preculture showed an OD600 of approximately 7 after cultivation. The batch process, performed at 37 °C took around 6–7 h and was finished, visible by a drop in the CO2-signal. The 20 g/L of C-source usually resulted in a biomass of 9–10 g/L. After the batch was finished a non-induced fed-batch was started overnight, at 35 °C and adapting the qs,C, based on the biomass after the batch, in an exponential feed value to gain a biomass of approximately 30 g/L. The non-induced fed-batch generally tool about 16 h with a qs,C value of about 0.2 g/g/h. Afterwards qs,C was adapted to a certain point of interest, temperature was decreased to 31.5 °C and pH 6.7 and stabilized for 30 min before the inducer was added. Induction was always performed with a 0.5 mM IPTG and lasted for highest of 12 h.
For screening of IB bead size static feed-forward qs-controls were performed during induction phase [3,39]. Exponential feed was established according to Equation (1), an exponential feed-forward approach to keep qs,C constant [3,39,40,41]:
With F being the feedrate [g/h], qs,C the specific glycerol uptake rate [g/g/h], X(t) the absolute biomass [g], ρF the feed density [g/L] and cf the feed concentration [g/L] respectively. Real qs,C values for the cultivations were calculated after the run, based on DCW values and gravimetrical feed signals.
2.3. Analytics
2.3.1. Process Analytics
Samples were always taken after inoculation, upon end of the batch-phase and after the non-induced-fed batch was finished. During the induction period samples were either taken in 60 or 120 min intervals. Generally, biomass was measured using optical density (OD600) and dry cell weight (DCW). OD600 was measured using a Genesys 20 photometer (Thermo Scientific, Waltham, MA, USA). Since the linear range of the used photometer is between 0.1 and 0.8, samples were diluted with dH2O to stay within that range. The dry cell weight was determined by vortexing the sample, pipetting 1 mL of sample solution in a pre-tared 2 mL Eppendorf-Safe-Lock Tube (Eppendorf, Hamburg, Germany) and centrifuged for 10 min at 10,000 rpm at 4 °C. After centrifugation, the supernatant was used immediately for at-line HPLC measurement (see beneath), while the pellet was resuspended with 1 mL of 0.9% NaCl solution and centrifuged at the same conditions. Afterwards, the pellet was dried for at least 48 h at 105 °C.
Glycerol and glucose concentrations were measured via HPLC-method (Thermo Scientific, Waltham, MA, USA) using a Supelcogel-column; Eluent: 0.1% H3PO4; Flow: 0.5 mL/min or an Aminex HPLC column (Biorad, Hercules, CA, USA) on an Agilent 1100 System (Agilent Systems, Santa Clara, CA, USA) with 4 mM H2SO4 as running buffer at 0.6 mL/min. Using this method sugar accumulation could be detected as an indication for cell death during our cultivations. Standards had a concentration of 1 to 50 g/L glycerol and glucose respectively The HPLC run lasted always for 30 min and Chromatograms were analyzed using a Chromeleon Software (Dionex, Sunnyvale, CA, USA).
2.3.2. Product Analytics
IB Preparation:
5 mL fermentation broth samples were centrifuged at 4800 rpm at 4 °C. The supernatant is discarded and the pellet is resuspended to a DCW of about 4 g/L in lysis buffer (100 mM Tris, 10 mM EDTA at pH = 7.4). Afterwards, the sample was homogenized using a high-pressure homogenizer at 1500 bar for 10 passages (EmulsiflexC3; Avestin, Ottawa, ON, Canada). After centrifugation at 10,000 rpm and 4 °C the supernatant was discarded and the resulting IB pellet was washed twice with ultrapure water and aliquoted into pellets à 2 mL broth, centrifuged (14,000 rpm, 10 min 4 °C) and stored at −20 °C. Buffer washed samples (buffer A: 50 mM Tris, 0.5 M NaCl, 0.02% Tween 80; buffer B: 50 mM Tris, 5 mM EDTA) did not show differences in IB bead size, and only slight differences in purity pattern (compare to [22]).
IB Bead Size:
Washed and aliquoted IB samples were resuspended in ultrapure water. 100 µL of appropriate dilution of the suspension were pipetted on a gold-sputtered (10–50 nm) polycarbonate filter (Millipore-Merck, Darmstadt, Germany) using reusable syringe filter holders with a diameter of 13 mm (Sartorius, Göttingen, Germany). 100 µL of ultrapure water were added and pressurized air was used for subsequent filtration. Additional 200 µL of ultrapure water were used for washing. The wet filters were fixed on a SEM sample holder using graphite adhesive tape and subsequently sputtered with gold to increase the contrast of the sample. SEM was performed using a QUANTA FEI SEM (Thermo Fisher, Waltham, MA, USA) with a secondary electron detector [15]. The acceleration voltage of the electron beam was set between 3 to 5 kV. To determine the diameter of the IBs, 50 IBs on SEM pictures were measured using the ImageJ plugin Fiji (Laboratory for Optical and Computational Instrumentation (LOCI), University of Wisconsin-Madison, USA).
IB Titer:
For titer measurements, IB pellets were solubilized using solubilization buffer (7.5 M Guanidine Hydrochloride, 62 mM Tris at pH = 8). The filtered samples are quantified by HPLC analysis (UltiMate 3000; Thermo Fisher, Waltham, MA, USA) using a reversed phase column (EC 150/4.6 Nucleosil 300-5 C8; Macherey-Nagel, Düren, Germany). The product was quantified with an UV detector (Thermo Fisher, Waltham, MA, USA) at 214 nm using Novartis BVS Ref. 02 as standard. Mobile phase was composed of acetonitrile and water both supplemented with 0.1% (v/v) tetrafluoride acetic acid. A linear gradient from 30% (v/v) acetonitrile to 100% acetonitrile (ACN) was applied. A steep linear gradient from 10% ACN to 30 % ACN in 60 s was followed by a long linear gradient from 30% to 55% and by 3 regeneration steps.
3. Results
Within this study, we investigated size dependence based on physiological feeding in E. coli during cultivation. The time-dependent harvested and washed IBs were analyzed via SEM and diameter was measured subsequently. A correlation of the IB size based on the fed substrate could clearly be indicated. A hyperbolic relation of the size could be used to establish model-based approach to predict IB size for our model protein during cultivation.
3.1. Static qs,C Feed-Forwards Feeding for Size Determination
Within a screening approach, we tried to trigger the optimal feeding parameter for IB production in E. coli processes. Set-point alteration for the specific glycerol or glucose uptake rate qs,C, did influence the IB bead size respectively. Classical and physiological process parameters using glucose as carbon source had already been analyzed in recent work [22]. These findings resulted in the optimized pH and temperature parameters used in this study (T = 31.5 °C, pH = 6.7 for the induction phase). In Figure 1 an exemplary SEM picture of IBs including measurement of the size is given. With this size analysis technique, an IB size standard deviation could be determined with an uncertainty of about 10%. We think that this 10% value is based on biological divergence of the sample, rather than measurement error. These pictures were used to define IB size dependence of an individual cultivation (Figure 1b). At later induction times, decrease in size and increase in standard deviation indicated ongoing cell death measured via flow cytometry and sugar accumulation (compare to Ref. [22,38]).
We tested four different setpoints for qs,C during the induction phase for both carbon sources and analyzed the resulting IB sizes. At high qs,C early C-source accumulation could be observed with present product degradation. For easy comparison between different physiological feeding strategies and different used C-sources, the cumulative sugar uptake value, dSn [g/g], (Equation (2)) could be used making a normalization on the fed mass C-source in respect to the total biomass at the induction time [34]:
with mC [g] being the fed mass of C-source, dt [h] the respective time interval and X(t0) [g] the total biomass at the start of induction. The induction time scale can now be exchanged for the dSn value during the induction phase. Low qs,C values result in a low dSn value, while high qs,C increases the values, as a high amount of C-source is fed throughout the process. The interaction between the IB bead size and dSn is presented in Figure 2a, comparing four runs with glycerol as C-source. Single bead size was strongly affected by the fed substrate starting with about 350 nm (threshold of the measurement principle) to a size over 600 nm in mean. A modified hyperbolic kinetic term could be used to describe this behavior of the mean diameters of the IBs in Equation (3):
replacing the maximum reaction speed term of a Monod kinetic with the maximum IB size (IBsize,max) and the substrate dependence through the respective dSn value. Km defines the trigger point where half of the possible size is reached and may, therefore, be used as transition value for change of low sizes towards large IB-size interesting for further downstream applications. High feeding rates might help to reach this trigger point earlier, hence physiological limitations such as µ-decrease over induction time have to be considered, in order to prevent cell death. The results of the fit are given in Figure 2b for both C-sources.
The previously mentioned hyperbolic fit can be seen by observing Figure 2b as IB-size is highly dependent on the amount of fed C-source. The performed fit yielded following constants for all cultivations at the constant parameters T and pH are given in Table 2. KM represents the mass glycerol needed for 1 g of biomass to reach IBsize,max/2.
Both C-sources showed very similar results using the fit given in Equation (3). This is actually surprising, as cellular uptake mechanism for glucose and glycerol are very different and are thought to influence production of recombinant proteins. IB bead size could not be influenced by the C-source (as differences seen here were within the standard deviation), but only by the respective amount of fed C-source (provided that T and pH are not altered during the induction phase). Km and IBsize, max are highly product and induction dependent. Very small sizes were not easily accessible using SEM based techniques. Therefore, the highest error was to be expected in the approximation of the early induction times, as filter porosity was above the threshold. Maximum IB size was observed at approximately 620 nm for our model protein. IBsize, max therefore may reflect a physiological or physical limitation of IB growth inside E. coli cells.
3.2. Model-Based Approach for Prediction of IB Bead Size
These relations were the basis for the model workflow used for determination of size in real time during a process, based on the applied feeding strategy given in the discussion chapter. We applied the dSn principle for a cultivation in order to keep viable cell concentration high and receive a high product titer. The exact feeding strategy using the dSn value over induction time is given in Figure 3a (blue rectangles). A high qs,C of glycerol was varied from 0.5 g/g/h to 0.1 g/g/h at a dSn value of 4 g/g. Corresponding size measurements are given in Figure 3a (red circles). As size and titer do show a linear correlation, the shift from a high to a qs,C should result in optimal size at the time-point of harvest.
Exchanging a static feeding strategy with the feeding control shown in Figure 3a, does implement a size growth even at late induction times and is triggering maximum size towards the time-point of harvest. Optimized feeding strategies, varying µ over induction time, seem to boost the overall product titer [34]. The probability density plot shown in Figure 3b presents the size as a function of induction time for the given run. For establishment of the probability plot, we estimated a normal distribution of our IBs and used the standard deviation of our measurements using the SEM techniques. Within this cultivation only little deviation could be monitored towards end of induction time as qs,C was adapted to 20% of the previous feeding rate.
4. Discussion
Based on the qs,C experiments with feed-forward approach, we derived empirical relation for IB size during our cultivation (compare to Figure 2b). For receiving IBs with defined size, low qs,C values can be recommended, as protein aggregation is a very fast process, and therefore size alterations might be difficult to trigger. Very small defined sizes could be produced in the beginning and sizes are longer stable at these feeding rates. Altering induction strength with lactose showed similar dependence by using green fluorescent protein as model protein for mixed feed development [42]. Within this study, it was shown that IB-size is tunable by adjusting the lactose concentration as inducer. It was shown that low levels of lactose resulted in sizes only as big as 400 nm but using higher concentrations of lactose for induction, IB-bead sizes move up to 600 nm. However, this variation in size seems to be a result from insufficient induction, resulting from eventually given low lactose feeding rates. We want to highlight that inclusion body size is highly dependent on the amount of the fed C-source, given that the system is fully induced with IPTG. Based on these results, glycerol-fed cultivations resulted in identical size for IB beads compared to glucose, although glycerol does open up major advantages on a cultivation side. The derived straightforward dependence of the IB bead size based on hyperbolic saturation kinetics could be easily used in a model-based approach. Online application of the model during the process would help to reduce or even replace complex offline analytics.
Process control can generally be performed by applying mechanistic of empirical models for prediction of the performed process or for at least several key performance indicators (KPI) [43,44,45]. Regularly, the prediction of biomass and inhibiting metabolites are the quantities of interest and are tried to be simulated for predictive control of the bioprocess. Prediction of product attributes within the cultivation is challenging—especially in high dynamic microbial processes. For the development of our model, mechanistic links were established using the software Matlab 2017. Within this model only time of the induced fed batch was simulated, as no inclusion bodies were formed within batch and non-induced-fed batch (FB)-cultivation. Static inputs for the model consisted of volume [L], substrate in fermentation broth [g/L] and biomass [g/L] at timepoint tinduction = 0 h. Further feed concentration [g/L], YX/S [g/L] and qs,max [g/g/h] were needed for modelling the behavior of the induction phase. Defining basic mass equations on fed-batch process behavior, prediction of classic process parameters like volume, substrate metabolization, biomass formation was established via the differential terms given beneath. Due to simplification, volume increase during fermentation was calculated via feed addition only:
With S being the substrate [g], Fin the feed [mL/h], cGlu the feed concentration [g/L], DCW the dry cell weight [g/L], qs the specific substrate feeding rate [g/g/h] – simulated in the model – and qx the specific biomass generation rate [g/g/h] based on qs. This enabled us to simulate the process based on the inputs received from the static qs,C experiments. Size could be easily modeled using the already presented hyperbolic saturation terms as helper equation in the model. Figure 4a shows the modeled size estimation based on the previously established kinetics in Equation (3). As acceptance criteria for product-based attributes we used 10% error of the model for size.
Size was well described by the model, resulting in only small variations, still lying within the standard deviation. Using the given model size estimation down to the beginning of the induction phase can be made, even if no analytical method is available for direct determination (e.g., SEM threshold). As size and titer show a linear correlation (compare to Figure 4b) overall product formation can be increased, applying the qs,C shift from 0.5 to 0.1 g/g/h. Therefore, also titer could be estimated for a fixed process based on the presented model approach. Standard deviation of IB-bead size (plotted in Figure 3a also increases over time, which is in correlation with literature [42].
Model-based approaches for estimation of different feeding strategies can be easily used for adaption of control for IB based products. Deriving data from two to three fed-batch cultivations with different static qs,C values is necessary to establish this model-based approach. Afterwards the optimized feeding strategy for the desired protein can be simulated and experimentally confirmed. This straightforward methodology makes this model-based approach a high beneficial tool for process development in the light of quality by design criteria in the industry.
5. Conclusions
In this work we aimed for analyzing the effect of varying the specific substrate feeding rate on IB CQA, such as IB size. Different cultivations could be easily compared using the previously established dSn value, as cumulated sugar uptake rate can be presented neatly arranged. Performing cultivations with altered feeding rates, showed, that maximum size was achieved at a dSn value of approximately 4 g/g. Feeding beneath a dSn value of 4 g/g resulted in highly time-resolved results, which might be useful for model development. As low feeding rates did not exceed the trigger-point in IB-formation (defined here as Km-value) these feeding strategies may not find an application in production scale, as IB titer is too low for further ongoing DSP applications, but are maybe interesting for other IB based products. Applying a qs-shift during induction phase boosted IB-formation even after dSn = 4 g/g was exceeded. Application of this feeding strategy kept cells in a viable state and further will help to achieve maximum size within shorter induction times. The relations for size based dSn approach could be used for process design but also for modelling of given product dependences.
We are currently investigating our model with other additional strains, trying to establish product-independent robust Upstream Processing. Triggering optimal IB-bead-size at the time-point of harvest will help to improve the cost-and time-intensive downstream processing.
Author Contributions
J.K. (Julian Kopp), C.S. and D.S. performed the cultivations. J.K. (Julian Kager) provided the modeling platform and helped during modeling workflow. J.K. (Julian Kopp) developed the model. C.S. and O.S. drafted the manuscript. O.S. and C.H. and gave valuable scientific input.
Acknowledgments
We thank the Christian Doppler Society for funding of this project.
Conflicts of Interest
The authors declare no conflict of interest.
Abbreviations
| CDW | cell dry weight [g/L] |
| CQA | critical quality attribute |
| dSn | cumulative sugar uptake rate [g/g] |
| DSP | downstream processing |
| Fin | Feed into the reactor [mL/h] |
| HPLC | high pressure liquid chromatography |
| IB | inclusion body |
| qs,C | specific substrate uptake rate [g/g/h] |
| SEM | scanning electron microscopy |
| T | temperature [°C] |
References
- Gupta, S.K.; Shukla, P. Microbial platform technology for recombinant antibody fragment production: A review. Crit. Rev. Microbiol. 2017, 43, 31–42. [Google Scholar] [CrossRef] [PubMed]
- Walsh, G. Biopharmaceutical benchmarks 2010. Nat. Biotechnol. 2010, 28, 917–924. [Google Scholar] [CrossRef] [PubMed]
- Wurm, D.J.; Veiter, L.; Ulonska, S.; Eggenreich, B.; Herwig, C.; Spadiut, O. The E. coli pET expression system revisited-mechanistic correlation between glucose and lactose uptake. Appl. Microbiol. Biotechnol. 2016, 100, 8721–8729. [Google Scholar] [CrossRef] [PubMed]
- Meuris, L.; Santens, F.; Elson, G.; Festjens, N.; Boone, M.; Dos Santos, A.; Devos, S.; Rousseau, F.; Plets, E.; Houthuys, E.; et al. GlycoDelete engineering of mammalian cells simplifies N-glycosylation of recombinant proteins. Nat. Biotechnol. 2014, 32, 485–489. [Google Scholar] [CrossRef] [PubMed]
- DeLisa, M.P.; Li, J.; Rao, G.; Weigand, W.A.; Bentley, W.E. Monitoring GFP-operon fusion protein expression during high cell density cultivation of Escherichia coli using an on-line optical sensor. Biotechnol. Bioeng. 1999, 65, 54–64. [Google Scholar] [CrossRef]
- Baeshen, M.N.; Al-Hejin, A.M.; Bora, R.S.; Ahmed, M.M.; Ramadan, H.A.; Saini, K.S.; Baeshen, N.A.; Redwan, E.M. Production of Biopharmaceuticals in E. coli: Current Scenario and Future Perspectives. J. Microbiol. Biotechnol. 2015, 25, 953–962. [Google Scholar] [PubMed]
- Spadiut, O.; Capone, S.; Krainer, F.; Glieder, A.; Herwig, C. Microbials for the production of monoclonal antibodies and antibody fragments. Trends Biotechnol. 2014, 32, 54–60. [Google Scholar] [CrossRef] [PubMed] [Green Version]
- Cass, B.; Pham, P.L.; Kamen, A.; Durocher, Y. Purification of recombinant proteins from mammalian cell culture using a generic double-affinity chromatography scheme. Protein Expr. Purif. 2005, 40, 77–85. [Google Scholar] [CrossRef] [PubMed]
- Studier, F.W.; Moffatt, B.A. Use of bacteriophage T7 RNA polymerase to direct selective high-level expression of cloned genes. J. Mol. Biol. 1986, 189, 113–130. [Google Scholar] [CrossRef]
- Steen, R.; Dahlberg, A.E.; Lade, B.N.; Studier, F.W.; Dunn, J.J. T7 RNA polymerase directed expression of the Escherichia coli rrnB operon. EMBO J. 1986, 5, 1099–1103. [Google Scholar] [CrossRef] [PubMed]
- Studier, F.W.; Rosenberg, A.H.; Dunn, J.J.; Dubendorff, J.W. Use of T7 RNA polymerase to direct expression of cloned genes. Methods Enzym. 1990, 185, 60–89. [Google Scholar]
- Dubendorff, J.W.; Studier, F.W. Controlling basal expression in an inducible T7 expression system by blocking the target T7 promoter with lac repressor. J. Mol. Biol. 1991, 219, 45–59. [Google Scholar] [CrossRef]
- Neubauer, P.; Hofmann, K. Efficient use of lactose for the lac promoter-controlled overexpression of the main antigenic protein of the foot and mouth disease virus in Escherichia coli under fed-batch fermentation conditions. FEMS Microbiol. Rev. 1994, 14, 99–102. [Google Scholar] [CrossRef] [PubMed]
- Lyakhov, D.L.; He, B.; Zhang, X.; Studier, F.W.; Dunn, J.J.; McAllister, W.T. Pausing and termination by bacteriophage T7 RNA polymerase. J. Mol. Biol. 1998, 280, 201–213. [Google Scholar] [CrossRef] [PubMed]
- Dvorak, P.; Chrast, L.; Nikel, P.I.; Fedr, R.; Soucek, K.; Sedlackova, M.; Chaloupkova, R.; Lorenzo, V.; Prokop, Z.; Damborsky, J. Exacerbation of substrate toxicity by IPTG in Escherichia coli BL21 (DE3) carrying a synthetic metabolic pathway. Microb. Cell Factories 2015, 14, 201. [Google Scholar] [CrossRef] [PubMed]
- Marbach, A.; Bettenbrock, K. LAC operon induction in Escherichia coli: Systematic comparison of IPTG and TMG induction and influence of the transacetylase LacA. J. Biotechnol. 2012, 157, 82–88. [Google Scholar] [CrossRef] [PubMed]
- García-Fruitós, E.; Vázquez, E.; Díez-Gil, C.; Corchero, J.L.; Seras-Franzoso, J.; Ratera, I.; Veciana, J.; Villaverde, A. Bacterial inclusion bodies: Making gold from waste. Trends Biotechnol. 2012, 30, 65–70. [Google Scholar] [CrossRef] [PubMed]
- Ramón, A.; Señorale-Pose, M.; Marín, M. Inclusion bodies: Not that bad…. Front. Microbiol 2014, 5, 56. [Google Scholar] [CrossRef] [PubMed]
- Palmer, I.; Wingfield, P.T. Preparation and extraction of insoluble (inclusion-body) proteins from Escherichia coli. Curr. Protoc. Protein Sci. 2012. [Google Scholar] [CrossRef]
- Villaverde, A.; Corchero, J.L.; Seras-Franzoso, J.; Garcia-Fruitós, E. Functional protein aggregates: Just the tip of the iceberg. Nanomedicine 2015, 10, 2881–2891. [Google Scholar] [CrossRef] [PubMed]
- Berlec, A.; Strukelj, B. Current state and recent advances in biopharmaceutical production in Escherichia coli, yeasts and mammalian cells. J. Ind. Microbiol. Biotechnol. 2013, 40, 257–274. [Google Scholar] [CrossRef] [PubMed]
- Slouka, C.; Kopp, J.; Hutwimmer, S.; Strahammer, M.; Strohmer, D.; Eitenberger, E.; Schwaighofer, A.; Herwig, C. Custom Made Inclusion Bodies: Impact of classical process parameters and physiological parameters on Inclusion Body quality attributes. Microb. Cell Factories 2018, 17, 148. [Google Scholar] [CrossRef] [PubMed]
- Wingfield, P.T. Preparation of Soluble Proteins from Escherichia coli. Curr. Protoc. Protein Sci. 2014. [Google Scholar] [CrossRef]
- Hrabárová, E.; Achbergerová, L.; Nahálka, J. Insoluble protein applications: The use of bacterial inclusion bodies as biocatalysts. In Insoluble Proteins; Springer: New York, NY, USA, 2015; pp. 411–422. [Google Scholar]
- Peternel, Š.; Komel, R. Isolation of biologically active nanomaterial (inclusion bodies) from bacterial cells. Microb. Cell Factories 2010, 9, 66. [Google Scholar] [CrossRef] [PubMed] [Green Version]
- Jevševar, S.; Gaberc-Porekar, V.; Fonda, I.; Podobnik, B.; Grdadolnik, J.; Menart, V. Production of nonclassical inclusion bodies from which correctly folded protein can be extracted. Biotechnol. Prog. 2005, 21, 632–639. [Google Scholar] [CrossRef] [PubMed]
- García-Fruitós, E.; González-Montalbán, N.; Morell, M.; Vera, A.; Ferraz, R.M.; Arís, A.; Ventura, S.; Villaverde, A. Aggregation as bacterial inclusion bodies does not imply inactivation of enzymes and fluorescent proteins. Microb. Cell Factories 2005, 4, 27. [Google Scholar] [CrossRef] [PubMed] [Green Version]
- García-Fruitós, E.; Rodríguez-Carmona, E.; Díez-Gil, C.; Ferraz, R.M.; Vázquez, E.; Corchero, J.L.; Cano-Sarabia, M.; Ratera, I.; Ventosa, N.; Veciana, J. Surface cell growth engineering assisted by a novel bacterial nanomaterial. Adv. Mater. 2009, 21, 4249–4253. [Google Scholar] [CrossRef]
- García-Fruitós, E.; Arís, A.; Villaverde, A. Localization of functional polypeptides in bacterial inclusion bodies. Appl. Environ. Microbiol. 2007, 73, 289–294. [Google Scholar] [CrossRef] [PubMed]
- Díez-Gil, C.; Krabbenborg, S.; García-Fruitós, E.; Vazquez, E.; Rodríguez-Carmona, E.; Ratera, I.; Ventosa, N.; Seras-Franzoso, J.; Cano-Garrido, O.; Ferrer-Miralles, N. The nanoscale properties of bacterial inclusion bodies and their effect on mammalian cell proliferation. Biomaterials 2010, 31, 5805–5812. [Google Scholar] [CrossRef] [PubMed]
- Spadiut, O.; Zalai, D.; Dietzsch, C.; Herwig, C. Quantitative comparison of dynamic physiological feeding profiles for recombinant protein production with Pichia pastoris. Bioprocess Biosyst. Eng. 2014, 37, 1163–1172. [Google Scholar] [CrossRef] [PubMed]
- Scott, M.; Gunderson, C.W.; Mateescu, E.M.; Zhang, Z.; Hwa, T. Interdependence of cell growth and gene expression: Origins and consequences. Science 2010, 330, 1099–1102. [Google Scholar] [CrossRef] [PubMed]
- Rozkov, A.; Avignone-Rossa, C.; Ertl, P.; Jones, P.; O’Kennedy, R.; Smith, J.; Dale, J.; Bushell, M. Characterization of the metabolic burden on Escherichia coli DH1 cells imposed by the presence of a plasmid containing a gene therapy sequence. Biotechnol. Bioeng. 2004, 88, 909–915. [Google Scholar] [CrossRef] [PubMed]
- Reichelt, W.N.; Thurrold, P.; Brillmann, M.; Kager, J.; Fricke, J.; Herwig, C. Generic biomass estimation methods targeting physiologic process control in induced bacterial cultures. Eng. Life Sci. 2016, 16, 720–730. [Google Scholar] [CrossRef]
- Reichelt, W.N.; Brillmann, M.; Thurrold, P.; Keil, P.; Fricke, J.; Herwig, C. Physiological capacities decline during induced bioprocesses leading to substrate accumulation. Biotechnol. J. 2017, 12, 1600547. [Google Scholar] [CrossRef] [PubMed]
- Achmüller, C.; Kaar, W.; Ahrer, K.; Wechner, P.; Hahn, R.; Werther, F.; Schmidinger, H.; Cserjan-Puschmann, M.; Clementschitsch, F.; Striedner, G.; et al. N(pro) fusion technology to produce proteins with authentic N termini in E. Coli. Nat. Methods 2007, 4, 1037–1043. [Google Scholar] [CrossRef] [PubMed]
- Martínez-Gómez, K.; Flores, N.; Castañeda, H.M.; Martínez-Batallar, G.; Hernández-Chávez, G.; Ramírez, O.T.; Gosset, G.; Encarnación, S.; Bolivar, F. New insights into Escherichia coli metabolism: Carbon scavenging, acetate metabolism and carbon recycling responses during growth on glycerol. Microb. Cell Factories 2012, 11, 46. [Google Scholar] [CrossRef] [PubMed]
- Kopp, J.; Slouka, C.; Ulonska, S.; Kager, J.; Fricke, J.; Spadiut, O.; Herwig, C. Impact of Glycerol as Carbon Source onto Specific Sugar and Inducer Uptake Rates and Inclusion Body Productivity in E. coli BL21 (DE3). Bioengineering 2017, 5, 1. [Google Scholar] [CrossRef] [PubMed]
- Wurm, D.J.; Herwig, C.; Spadiut, O. How to Determine Interdependencies of Glucose and Lactose Uptake Rates for Heterologous Protein Production with E. coli. Methods Mol. Biol. 2017, 1586, 397–408. [Google Scholar] [PubMed]
- Slouka, C.; Wurm, D.J.; Brunauer, G.; Welzl-Wachter, A.; Spadiut, O.; Fleig, J.; Herwig, C. A Novel Application for Low Frequency Electrochemical Impedance Spectroscopy as an Online Process Monitoring Tool for Viable Cell Concentrations. Sensors 2016, 16, 1900. [Google Scholar] [CrossRef] [PubMed]
- Wurm, D.J.; Hausjell, J.; Ulonska, S.; Herwig, C.; Spadiut, O. Mechanistic platform knowledge of concomitant sugar uptake in Escherichia coli BL21(DE3) strains. Sci. Rep. 2017, 7, 45072. [Google Scholar] [CrossRef] [PubMed]
- Wurm, D.J.; Quehenberger, J.; Mildner, J.; Eggenreich, B.; Slouka, C.; Schwaighofer, A.; Wieland, K.; Lendl, B.; Rajamanickam, V.; Herwig, C. Teaching an old pET new tricks: Tuning of inclusion body formation and properties by a mixed feed system in E. coli. Appl. Microbiol. Biotechnol. 2018, 102, 667–676. [Google Scholar] [CrossRef] [PubMed]
- Kroll, P.; Hofer, A.; Stelzer, I.V.; Herwig, C. Workflow to set up substantial target-oriented mechanistic process models in bioprocess engineering. Process. Biochem. 2017, 62, 24–36. [Google Scholar] [CrossRef]
- Sagmeister, P.; Wechselberger, P.; Jazini, M.; Meitz, A.; Langemann, T.; Herwig, C. Soft sensor assisted dynamic bioprocess control: Efficient tools for bioprocess development. Chem. Eng. Sci. 2013, 96, 190–198. [Google Scholar] [CrossRef]
- Ehgartner, D.; Sagmeister, P.; Herwig, C.; Wechselberger, P. A novel real-time method to estimate volumetric mass biodensity based on the combination of dielectric spectroscopy and soft-sensors. J. Chem. Technol. Biotechnol. 2015, 90, 262–272. [Google Scholar] [CrossRef]
Figure 1.
(a) Inclusion body (IB) beads at time point of harvest (12 h of induction) including measurement bars (white) after homogenization and subsequent washing with ultrapure water; (b) IB bead size at qs,C of 0.4 g/g/h using glycerol as C-source. Late degradation is based on reduction in the viable cell concentration.

Figure 2.
(a) IB-bead size dependencies on the amount of fed glycerol shown calculated as dSn value (b) dependence of the IB bead diameter when compared between glucose and glycerol.
Figure 2.
(a) IB-bead size dependencies on the amount of fed glycerol shown calculated as dSn value (b) dependence of the IB bead diameter when compared between glucose and glycerol.
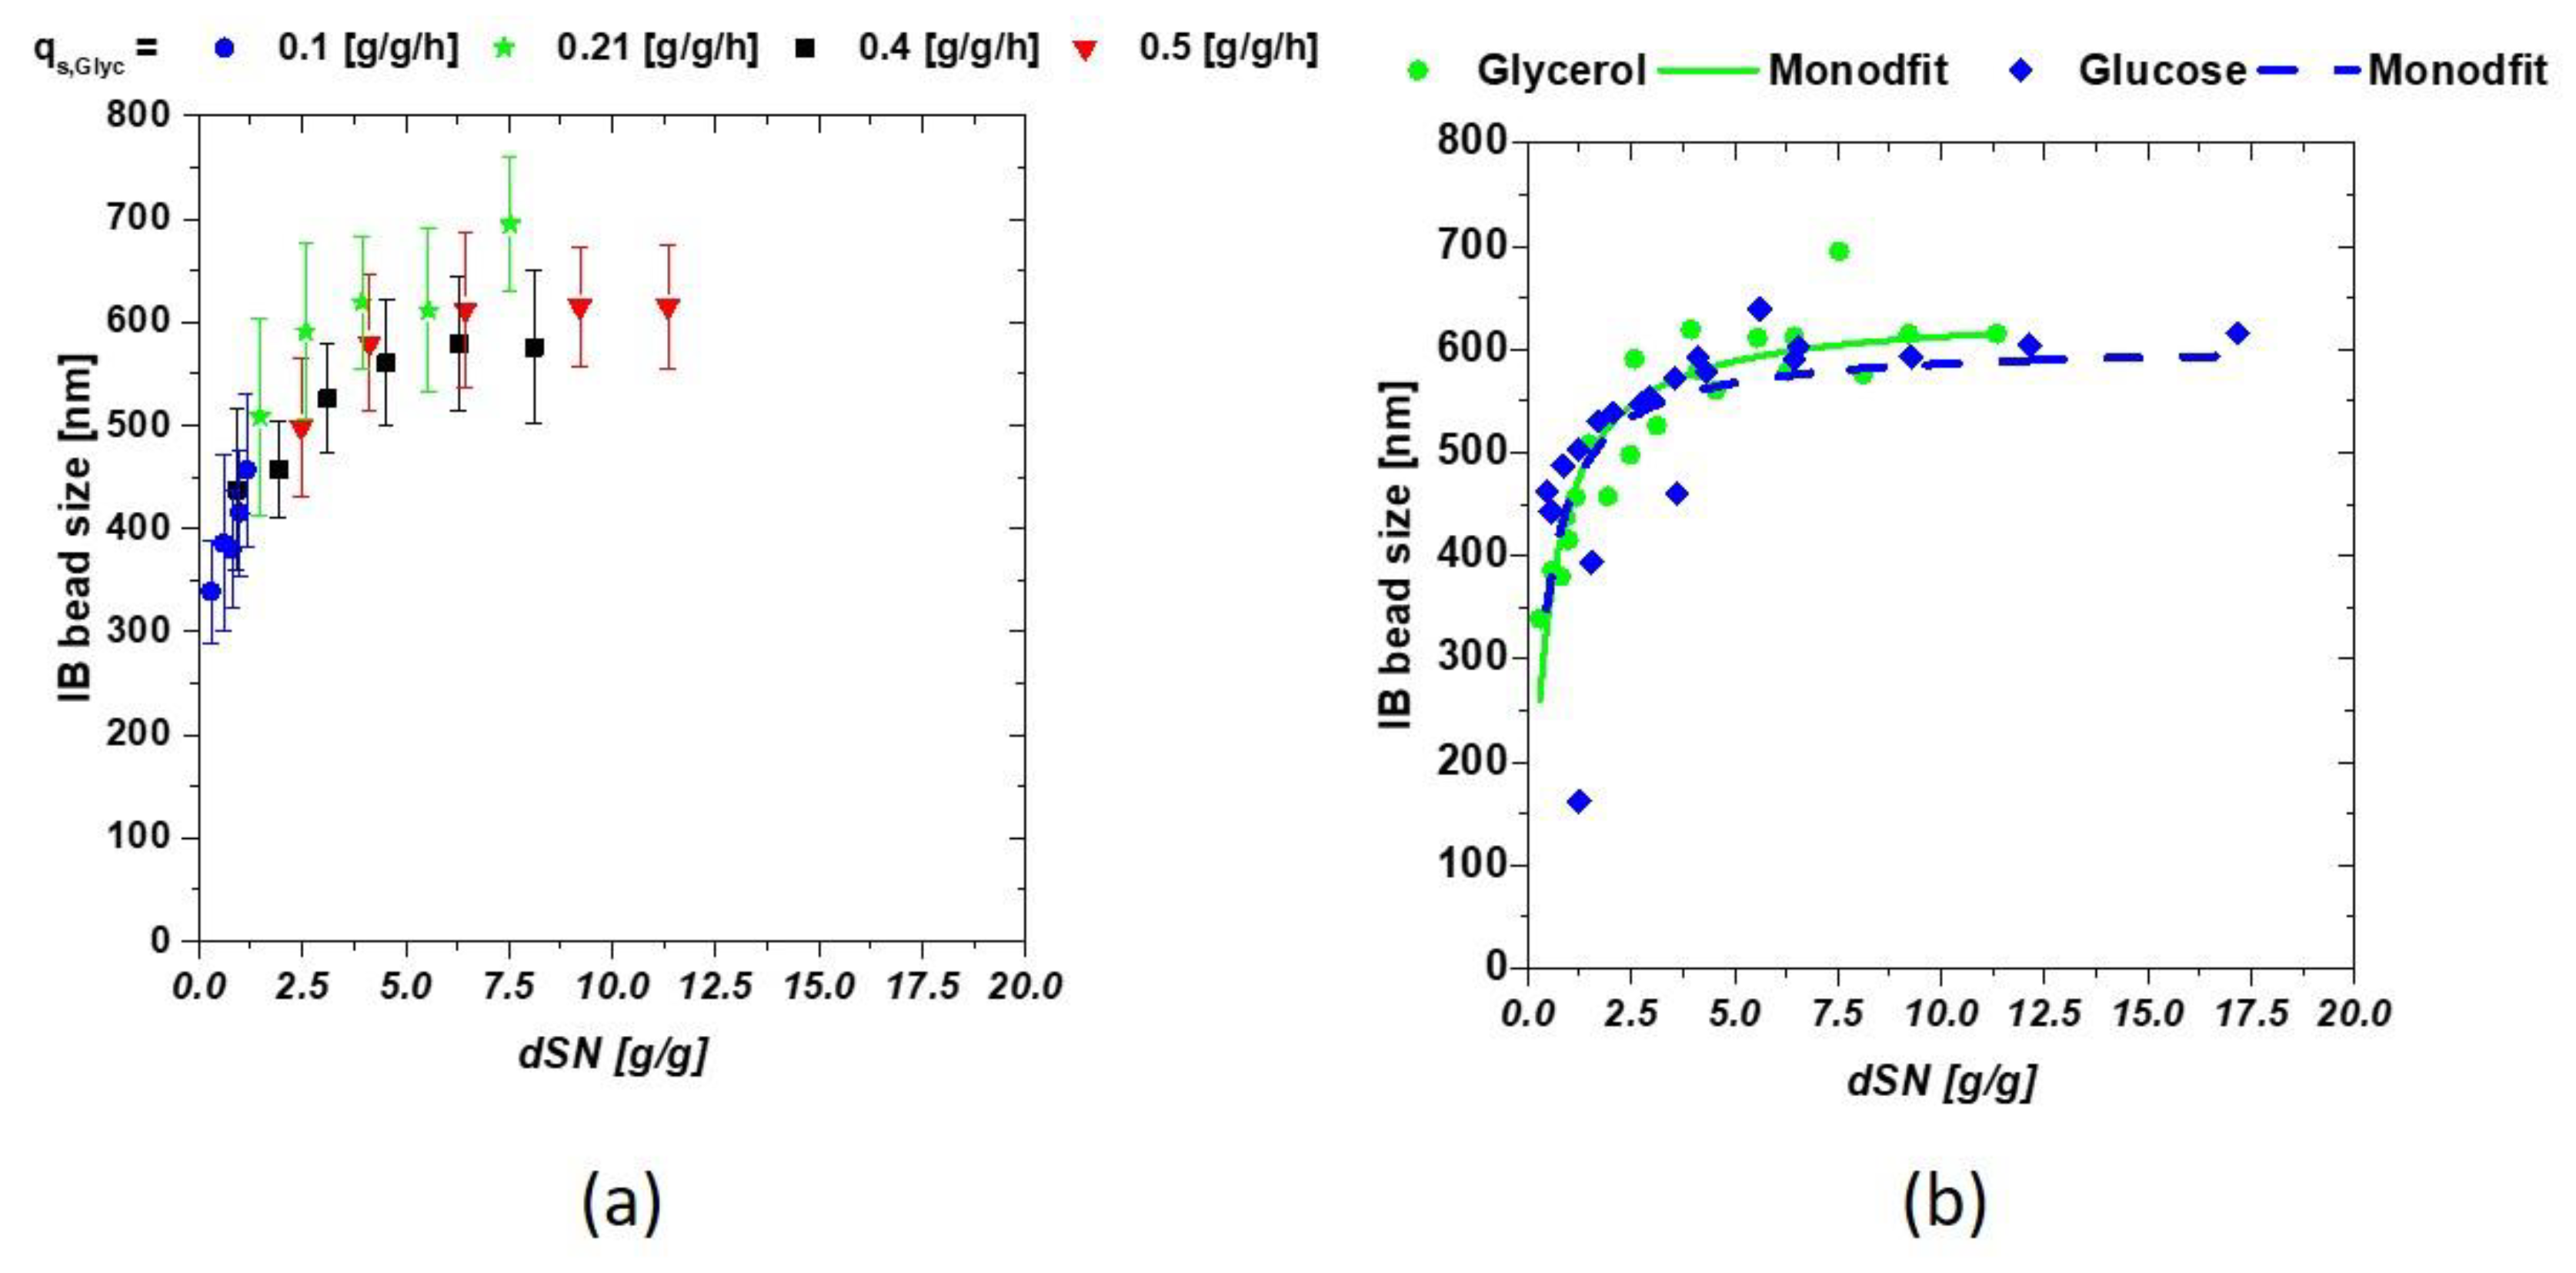
Figure 3.
(a) Model cultivation with change in the qs,C from 0.5 g/g/h to 0.1 g/g/h at a dSn value of about 4 g/g. The lower qs,C value results in a high viable cell concentration at late induction times; (b) probability density plot of cultivations as a function of induction time.
Figure 3.
(a) Model cultivation with change in the qs,C from 0.5 g/g/h to 0.1 g/g/h at a dSn value of about 4 g/g. The lower qs,C value results in a high viable cell concentration at late induction times; (b) probability density plot of cultivations as a function of induction time.
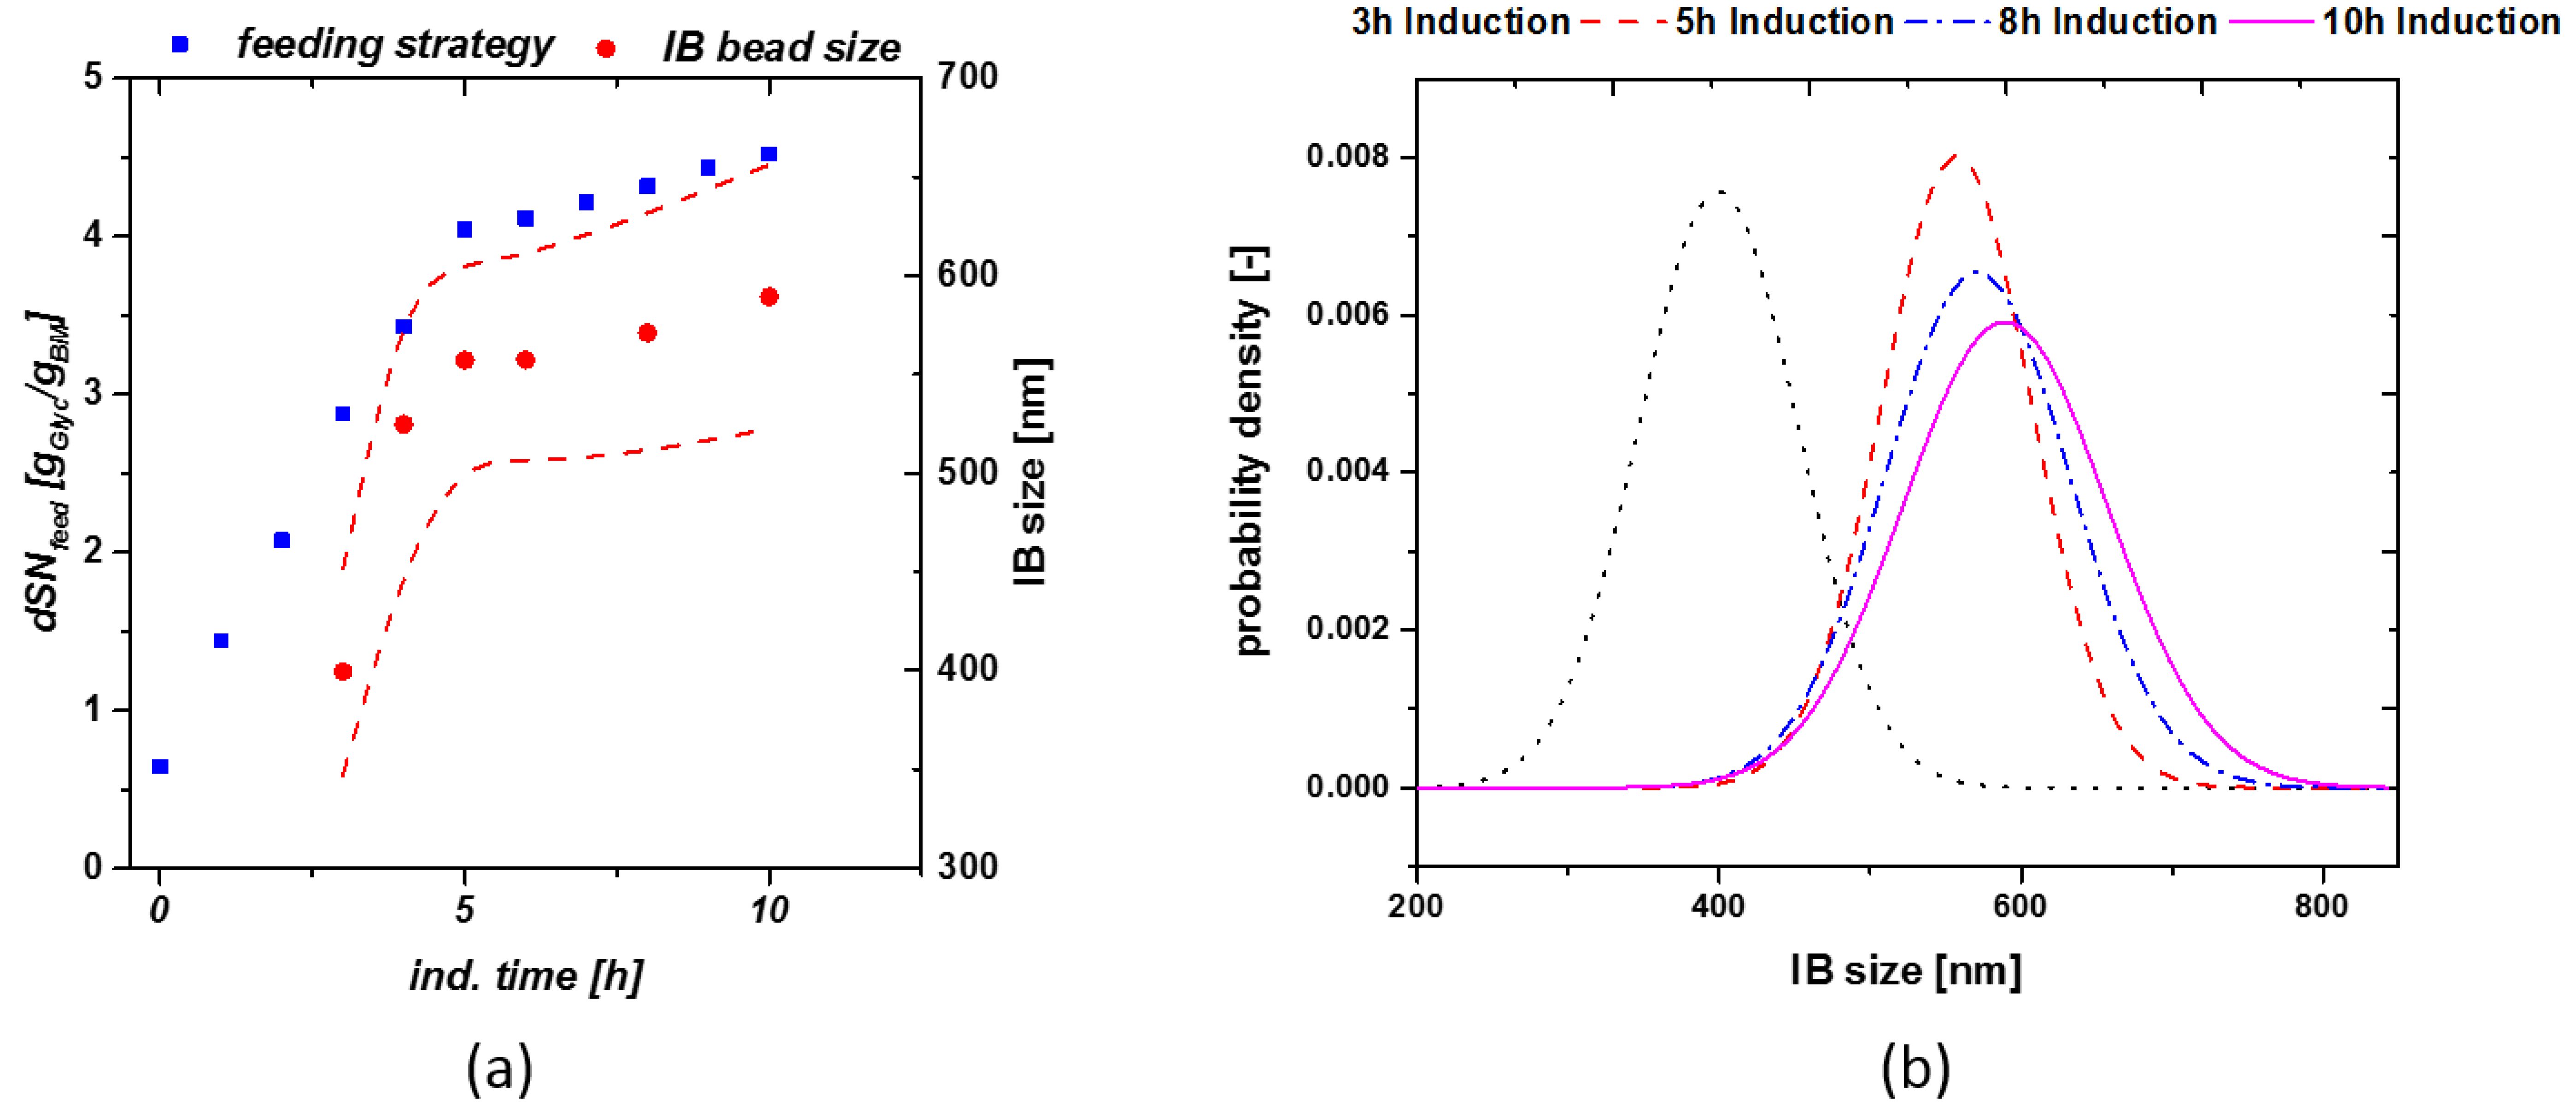
Figure 4.
(a) Size modeling including real measured data with standard deviations. Especially early sizes could only be described using the model-based approach; (b) Size-titer correlation for fermentation with feeding strategy implied in Figure 3a.
Figure 4.
(a) Size modeling including real measured data with standard deviations. Especially early sizes could only be described using the model-based approach; (b) Size-titer correlation for fermentation with feeding strategy implied in Figure 3a.


Table 1.
Respective sugar concentrations in media composition.
| Phase | Amount of C-source |
|---|---|
| Preculture | 8 g/L |
| Batch-Media | 20 g/L |
| Feed | either 300 g/L or 600 g/L |
Table 2.
Fitting results for hyperbolic-fit Equation (3) for IB bead size dependence.
| Fit Parameters | Glucose | Glycerol |
|---|---|---|
| Km [g/g] | 0.33 +/− 0.14 | 0.42 +/− 0.06 |
| IBsize,max [nm] | 605.4 +/− 37 | 638 +/− 17 |
© 2018 by the authors. Licensee MDPI, Basel, Switzerland. This article is an open access article distributed under the terms and conditions of the Creative Commons Attribution (CC BY) license (http://creativecommons.org/licenses/by/4.0/).
Share and Cite
MDPI and ACS Style
Kopp, J.; Slouka, C.; Strohmer, D.; Kager, J.; Spadiut, O.; Herwig, C. Inclusion Body Bead Size in E. coli Controlled by Physiological Feeding. Microorganisms 2018, 6, 116. https://doi.org/10.3390/microorganisms6040116
AMA Style
Kopp J, Slouka C, Strohmer D, Kager J, Spadiut O, Herwig C. Inclusion Body Bead Size in E. coli Controlled by Physiological Feeding. Microorganisms. 2018; 6(4):116. https://doi.org/10.3390/microorganisms6040116
Chicago/Turabian StyleKopp, Julian, Christoph Slouka, Daniel Strohmer, Julian Kager, Oliver Spadiut, and Christoph Herwig. 2018. "Inclusion Body Bead Size in E. coli Controlled by Physiological Feeding" Microorganisms 6, no. 4: 116. https://doi.org/10.3390/microorganisms6040116
Note that from the first issue of 2016, this journal uses article numbers instead of page numbers. See further details here.