Article

A Genome-Scale Metabolic Model of Thalassiosira pseudonana CCMP 1335 for a Systems-Level Understanding of Its Metabolism and Biotechnological Potential

by
Ahmad Ahmad
1,2,
Archana Tiwari
2,*,† and
Shireesh Srivastava
1,*
1
Systems Biology for Biofuel Group, International Centre for Genetic Engineering and Biotechnology (ICGEB), New Delhi 110067, India
2
Department of Biotechnology, Noida International University (NIU), Noida 203201, India
*
Authors to whom correspondence should be addressed.
Current affiliation: Diatom Research Lab. Amity Institute of Biotechnology, Amity University, Noida 201313 (U.P.), India.
Microorganisms 2020, 8(9), 1396; https://doi.org/10.3390/microorganisms8091396
Submission received: 30 June 2020 / Revised: 31 July 2020 / Accepted: 7 August 2020 / Published: 11 September 2020
(This article belongs to the Special Issue Genome-Scale Modeling of Microorganisms in the Real World)

Abstract

:
Thalassiosira pseudonana is a transformable and biotechnologically promising model diatom with an ability to synthesise nutraceuticals such as fucoxanthin and store a significant amount of polyglucans and lipids including omega-3 fatty acids. While it was the first diatom to be sequenced, a systems-level analysis of its metabolism has not been done yet. This work presents first comprehensive, compartmentalized, and functional genome-scale metabolic model of the marine diatom Thalassiosira pseudonana CCMP 1335, which we have termed iThaps987. The model includes 987 genes, 2477 reactions, and 2456 metabolites. Comparison with the model of another diatom Phaeodactylum tricornutum revealed presence of 183 unique enzymes (belonging primarily to amino acid, carbohydrate, and lipid metabolism) in iThaps987. Model simulations showed a typical C3-type photosynthetic carbon fixation and suggested a preference of violaxanthin–diadinoxanthin pathway over violaxanthin–neoxanthin pathway for the production of fucoxanthin. Linear electron flow was found be active and cyclic electron flow was inactive under normal phototrophic conditions (unlike green algae and plants), validating the model predictions with previous reports. Investigation of the model for the potential of Thalassiosira pseudonana CCMP 1335 to produce other industrially useful compounds suggest iso-butanol as a foreign compound that can be synthesized by a single-gene addition. This work provides novel insights about the metabolism and potential of the organism and will be helpful to further investigate its metabolism and devise metabolic engineering strategies for the production of various compounds.

1. Introduction

Diatoms are unique unicellular photosynthetic eukaryotic microbes that have silica incorporated in their cell wall [1]. They play a significant role in global carbon and silicon recycling [1] and contribute about half of aquatic primary production and a quarter of the total primary productivity [2]. They are attractive organisms that can be exploited as cell factories to convert atmospheric CO2 into a wide range of industrially and medically useful compounds [3,4,5]. Diatoms primarily store glucose in the form chrysolaminarin [6], a polyglucan (primarily composed of β(1→3) linked glucose monomers) which can be used as renewable feedstock for fermentation and subsequent production of platform chemicals. Furthermore, their ability to store a significant amount of lipids (20–30% and in some species up to 45–60% of the dry cell weight) [7] and synthesize nutraceuticals such as omega-3 fatty acids [7,8] and fucoxanthins [3,9] makes them attractive organisms.
Thalassiosira pseudonana is a model diatom. It was the first diatom chosen for genome sequencing due to its utility in physiological and silica biomineralization [10] studies. It is also considered to be a potential drug delivery vehicle for cancer treatment during chemotherapy [11]. The ability to grow in marine water makes it an attractive organism for large-scale cultures needed for the bioenergy applications, as it will not compete with freshwater and land. Unsurprisingly, various studies have applied genetic engineering in T. pseudonana for enhanced production/accumulation of lipids, TAGs, and omega-3 fatty acids [12,13,14].
Genome-scale metabolic models (GEMs) make it possible to simulate metabolic behavior of the organism and predict internal metabolism under different conditions [15,16,17]. The GEMs contain a majority of the metabolic reactions present in an organism based on its annotated genome sequence [18,19]. A large number of GEMs of a variety of organisms ranging from prokaryotes [20,21] to eukaryotes [15,22,23] have been reconstructed and utilized to analyze their metabolic behavior. Moreover, the GEMs of photosynthetic organisms, e.g., microalgae (Chlamydomonas [24,25], Chlorella [26], and Nannochloropsis [15,27]) and the diatom (Phaeodactylum tricornutum [28,29]) have been reconstructed and used to analyze the process of photosynthesis and metabolism under light and dark conditions. While there are two published GEMs available for P. tricornutum, a GEM for T. pseudonana is still not available. P. tricornutum and T. pseudonana have been segregated under taxonomically distinct subgroups (order and genus) [30,31]. They have been kept in two different groups, pennate, and centric for P. tricornutum and T. pseudonana, respectively [32], based on arrangement of frustules on their cell wall. Si+ was found to be an essential nutritional component for the growth of T. pseudonana [33] while it was non-essential for the growth of P. tricornutum [34,35]. Moreover, under phosphorus (P) stress, genes related to Calvin cycle, fatty acid biosynthesis, and PEPCK (phosphoenolpyruvate carboxykinase) show differential regulation in T. pseudonana and P. tricornutum [33]. Thus, a GEM of P. tricornutum cannot be used to investigate the metabolism and biotechnological potential of a significantly different organism, T. pseudonana, as suggested by a recent work where eight different strains of the same organism (E. coli) were found to be physiologically different [21]. Therefore, it is imperative to work on the GEM of the same strain to perform systems level studies.
In this work, we present the first high-quality manually-curated GEM (iThaps987) of T. pseudonana, to overcome this gap and perform its systems level investigation. The model iThaps987 includes 987 genes, 2477 reactions, and 2456 metabolites. The FBA analysis revealed the CO2 fixation by C3/Calvin–Benson–Bassham (CBB) cycle. The different pathway routes for biosynthesis of fucoxanthin were explored for their activity and the results indicate a preference for the violaxanthin–diadinoxanthin pathway over the violaxanthin–neoxanthin pathway. The features of this model were compared to the previously published P. tricornutum model (iLB1025) [28]. The work also focuses on the potential of T. pseudonana to photosynthetically produce some industrially useful compounds.

2. Materials and Methods

2.1. Reconstruction of a Genome-Scale Metabolic Model

The genome-scale metabolic model of Thalassiosira pseudonana, iThaps987, was reconstructed and analysed using established protocols and an approach described for a number other organisms such as Geobacillus thermoglucosidasius [20], Salmonella typhimurium [17], and Arabidopsis thaliana [36]. The model was reconstructed using the python-based metabolic modeling tool ‘ScrumPy’ [37]. The model was reconstructed based on organism-specific data obtained from BioCyc [38] database and the annotated genome sequence from the National Center for Biotechnology Information (NCBI) database. The macromolecular composition of Thalassiosira pseudonana biomass was measured to construct the biomass reaction which provides molar fractions of metabolites required to make a gram of biomass. Information from various biological database were used as per requirement. For example, reaction directionalities were taken from BioCyc [38] and MetaCyc [39] database and the metabolite formulae that were missing in Biocyc database were taken from KEGG [40] database or from previously published models [15,20,41].

2.2. Draft Model

The Pathway Genome Database (PGDB) for Thalassiosira pseudonana (Thaps, v19.5) was downloaded from BioCyc and extracted to obtain a flat-files database. The PGDB of Thalassiosira pseudonana has information related to reactions, their genes and sequences. ScrumPy tool was used to fetch these flat-file databases using the inbuilt module ‘PyoCyc’. Finally, a draft model was created by obtaining all the reactions of the database.
The initial draft model included several non-specific metabolites, e.g., ‘Aldoses’, ‘Fatty aldehydes’, and reactions—e.g., ‘DNA-LIGASE’—that would create uncertainties in the model. The draft model was refined iteratively using literature, biological database(s), and previously published models until a final, robust model is obtained. In the first round of refinement, the non-specific metabolites and reactions were removed from the model. In the subsequent step, each reaction was checked and corrected, wherever required, for mass balance in terms of carbon, nitrogen, phosphorus, and sulfur. Further refinements were carried out as explained below.

2.3. Gap-Filling of the Model

The draft model obtained after the initial refining was unable to synthesise some essential biomass precursors, indicating an absence of at least one key reaction that participates in the synthesis of the corresponding precursor. The absence of such key reactions results in gaps in the network. These gaps in the draft model were manually identified by performing optimisations for production of all the biomass precursors one by one. Those precursors which were unable to be produced by the draft model were termed as gapped metabolites. The presence of gapped metabolites in a model indicates existence of some missing links (reactions/pathways), also known as gapped reactions/pathways, in the network. These gaps were filled manually by searching for biosynthetic pathways and reactions that will ensure biosynthesis of these biomass precursors, thereby filling those gaps in the network. The gene sequences of these added reactions were subjected to BLAST searches against the Thalassiosira pseudonana genome sequence.

2.4. Compartments in the Model

Thalassiosira pseudonana is a eukaryotic microbe and has different compartments for different functions. All reactions of the model were localized into three different compartments: cytosol, chloroplast, and mitochondrion. The sub-cellular localisation of reactions was obtained using ngLoc web-server [42]. A reaction was assigned to cytosol if no subcellular localization could be obtained.

2.5. Energy Requirements

A characteristic feature of all organisms is to grow and maintain their structural integrity. They require energy to perform these two basic functions of life. This energy is required in the form of the cellular currency ‘ATP’. The energy (ATP) required for growth is termed as growth-associated ATP maintenance (GAM). The GAM accounts for energy required to synthesize precursors, polymerize purine and pyrimidine bases and amino acids to form DNA and proteins, respectively, and polymerize cell wall precursors, etc. The other type of energy (ATP) which accounts to maintain cellular structure and integrity is termed Non growth-associated ATP maintenance (NGAM). As the values of GAM and NGAM are not available for this strain, the values from the GEM of Phaeodactylum tricornutum [29] were used. Similar assumptions are regularly employed in cases where the actual values are not available. For example, the GEM of Synechococcus sp. BDU130192 had utilized ATP maintenance values from previously published models of Synechococcus sp. PCC 7002 [41], while the GEMs of Thermus thermophilus HB27 [43], and tomato (Solanum lycopersicum L.) [44] have utilized ATP maintenance values from previously published models of E.coli and Arabidopsis thaliana models, respectively. We have also evaluated the effect of variation of NGAM on intracellular flux distributions.

2.6. Measurement of Biomass Composition for Setting Up the Biomass Equation

The biomass equation was formulated by experimental measurement of important biomass components like proteins, carbohydrates, lipids, DNA, and RNA while the minor components—e.g., pigments—were taken from previously published models [28]. Further details on the methods used to measure the biomass composition are provided in Supplementary File S07.

2.7. Model Simulations

The genome scale metabolic model, iThaps987, representing the metabolic reactions of T. pseudonana was reconstructed as a ScrumPy-readable text file (Supplementary file S01) as well as mat format (Supplementary file S03) and is compatible with COBRA Toolbox and ScrumPy modeling packages. An Excel file of the model is also provided (Supplementary file S02).
The model was analyzed using ‘Flux Balance Analysis’ (FBA), a constraint-based modeling (CBM) approach based on linear programming technique using ScrumPy. FBA determines the internal flux distribution which satisfies the steady state assumption besides some other constraints. According to the steady state assumption, the concentrations of intracellular metabolites remain steady (i.e., they do not vary with time). This implies that the compounds taken in by the cell should either go towards biomass production or towards the formation some byproducts. Overall, the carbon, nitrogen, etc. should be balanced in the determined flux distributions. The FBA approach optimizes any metabolic property, e.g., biomass formation reaction, or other reaction(s) within the constraints provided. In this study, minimization of total cellular fluxes was used as the cellular objective function [20]. For simulating photoautotrophic conditions, biomass reaction (growth rate) was fixed at the experimentally measured value of 0.024 h−1 (see supplementary file S07) while the import and export of nutrients including CO2 and photon intake were left free. The linear programming problem for minimization of total fluxes was formulated as
Minimize   i = 1 n v i
subject   to   S . v = 0
v Biomass   =   t
v ATP_Maintenance   =   ATP   Maintenance
where S is the stoichiometry matrix, v is the reactions flux vector, n is number of reactions,   v Biomass is the flux through the biomass reaction, t is some positive value (measured growth rate) and i is iteration.

2.8. Simulations of Si+ Limited Conditions

In order to analyse the effect of silica limitation on chrysolaminarin production, a virtual transport reaction was added to the model for transport of chrysolaminarin from cytosol to an ‘extracellular’ compartment. That is, the accumulation of chrysolaminarin is assumed as ‘export’. The CO2 intake rate was fixed to 2.05 mmol/(gDCW.h) while the silica uptake rate was varied from 0 mmol/(gDCW.h) to 0.05 mmol/(gDCW.h) and minimization of total flux was used as the objective function.

2.9. Reaction Essentiality Analysis

The FBA approach (with minimization of total fluxes as objective) was used to perform the reaction essentiality analysis. The flux through each reaction was fixed to zero at a time while the flux through biomass reaction (growth rate) was fixed to the experimentally observed value at the time of simulations. A reaction was defined as essential if fixing the flux through the reaction to zero results in an infeasible optimization.
Minimize   i = 1 n v i
subject   to   S . v = 0
v Biomass   =   t
v j = 0
v ATP_Maintenance   =   ATP   Maintenance
where, S is the stoichiometry matrix, v is the reactions flux vector, v j is the reaction that is being ‘deleted’, n is number of reactions,   v Biomass is the flux through the biomass reaction, t is some positive value (measured growth rate) and v i is ith value in flux vector.

2.10. Maximum Theoretical Yields for Various Industrial Compounds

Diatoms can be exploited as cell factories [4]. Therefore, we explored the model for its potential to produce various native and non-native compounds. The maximum theoretical yield for each product was predicted by: (i) constraining the biomass reactions to 80% of its wild-type growth rate, (ii) setting the exchange reaction of the corresponding product as the objective function. The transport and exchange reactions were added wherever required to the model.
The maximum theoretical yields for the heterologous products were predicted by adding the required external reactions and constraining the model as done for indigenous products. The MetaCyc database contains pathways and their respective reactions as mini modules, e.g., pathway for ‘styrene’ biosynthesis contains specific reactions that synthesises ‘styrene’. Using an in-house script, the presence of these specific reactions was checked in iThaps987, and the missing reactions were ‘temporarily’ added to the model.
The linear programming formulation to perform FBA for the production of the native and heterologous products is
Maximise   i n c i . v i
subject   to   S . v = 0
v Biomass   =   t
v ATP_Maintenance   =   ATP   Maintenance
Max   Yield   ( x ) = v o b j v c
where S is the stoichiometry matrix, v is the reactions flux vector and c is the objective function. In this case, the objective function is the exchange reaction(s) for product formation. v o b j and v c are the fluxes through the objective function and the carbon source, respectively and x is maximum theoretical yield of the target product. Note that the biomass production flux vBiomass was kept as 80% of the measured growth rate. The maximum yields (x) were obtained as a ratio of product formation to carbon intake rates.

3. Results

3.1. Gap Filling

The draft model was subjected to manual gap finding analysis, which identified only 62 orphan enzymes additionally required (absent in the T. pseudonana genome) for biomass-precursor biosynthesis. Out of these 62 enzymes, 21 were already present in the PGDB of T. pseudonana while the 14 enzymes were found in P. tricornutum or Chlamydomonas reinhardtii genomes. Also, there are 19 orphan metabolic reactions present in the model that do not have any associated Enzyme Commission (EC) number. A list of gap-filling reactions is summarised in Supplementary File S04.

3.2. General Properties of the Model

The final model, iThaps987, contains 987 genes, 2477 reactions, and 2456 metabolites. The model comprises of 2389 metabolic, and 88 transport and exchange reactions. The model has three compartments, namely cytosol, chloroplast, and mitochondrion. A total 1125 reactions operate in cytosol while 887 are present in chloroplast and 377 reactions are located in mitochondrion (Table 1). In terms of metabolites, 1024 metabolites are present in cytosol followed by 984 in chloroplast and 467 in mitochondrion (Table 1).
The model iThaps987 is the second largest in terms of the number of reactions compared to other publicly available models of diatoms (Table 2).

3.3. Comparison of iThaps987 Model with P. tricornutum Model, iLB1025

The iThaps987 model was compared with iLB1025, the GEM of another diatom, P. tricornutum, to investigate similarity and differences between the two models. The models were compared primarily based on Enzyme Commission (EC) numbers. The comparison revealed 483 enzymes are common in both models (see Figure S3) and 183 enzymes are unique in iThaps987 and 191 in iLB1025, respectively (Figure 1a). Further analysis of the common enzymes revealed that enzymes related to amino acid metabolism were the most common between the two models (128), followed by the enzymes related to fatty acid (79) and carbohydrate (70) metabolism, respectively. The enzymes related to vitamins and cofactor (59), nucleotide and carotenoid (34) metabolism also had a significant number of common enzymes. There were other pathways which had slightly fewer enzymes common to both models—e.g., nitrogen metabolism, oxidative phosphorylation, and photosynthesis. Supplementary File S05 contains comparison of enzymes of both models. Furthermore, the analysis of these 183 unique enzymes present in iThaps987 revealed that most of the unique enzymes participate in carbohydrate and amino acids metabolism (40 and 38 respectively), followed by lipid metabolism pathways with 29 enzymes. Pathways related to vitamins and co-factor metabolism, pigments, and nucleotides have relatively fewer unique enzymes (Figure 1b).
Figure 1c shows the distribution of unique enzymes in sub-pathways of main pathway categories. Among the 38 unique enzymes that participate in amino acid metabolism, most relate to arginine and proline metabolism, followed by glycine, serine, and threonine metabolism and phenylalanine, tyrosine, and tryptophan biosynthesis. Regarding the carbohydrate metabolism, pyruvate metabolism has highest number of unique enzymes (9) followed by glycolysis (8), fructose-mannose metabolism (5), and pentose phosphate pathways (4). The nine unique enzymes of pyruvate metabolism are phosphoenolpyruvate synthase, lactoylglutathione lyase, pyruvate dehydrogenase (quinone), propionate CoA-transferase, hydroxyacylglutathione hydrolase, pyruvate formate-lyase, malate dehydrogenase (oxaloacetate-decarboxylating), L-lactate dehydrogenase (cytochrome), and phosphoenolpyruvate carboxykinase (diphosphate). Sub-pathways of lipids metabolism- glycerophospholipid (8) and fatty acid (8) metabolism have equal number of unique enzymes while arachidonic acid (3) and glycerolipid (1) pathways have lesser number of enzymes. Among the vitamins and co-factor metabolism pathways, almost all sub-pathways have approximately the same number of unique enzymes. Porphyrin and chlorophyll (6) and carotenoids (3) metabolism pathways have more unique enzymes than other sub-pathways of the pigment metabolism pathway. The Supplementary File S05 has a list of all unique enzymes present in T. pseudonana.

3.4. Model Simulations

For the photoautotrophic simulations, the growth rate was fixed to the experimentally determined value of 0.024 h−1 (see Supplementary File S07 for the growth curve). The CO2 and photon uptake rates were predicted to be 1.05 and 13.02 mmol/(gDCW.h), respectively. These uptake rates are within the physiological ranges suggested by previous reports [15,28]. The nitrate uptake rate was found to be 0.19 mmol/(gDCW.h). The model simulations predicted O2 evolution of 1.51 mmol/(gDCW.h). Thus, the O2/CO2 ratio was predicted to be 1.43 which is very close to the value 1.37 obtained with the Phaeodactylum tricornutum model iLB1025 [28] for the same growth rate.

3.5. Light-Driven Generation of ATP and NADPH: Light Reaction

The light-driven growth simulations (photoautotrophic growth) showed CO2 fixation by the C3 cycle by utilising ATP and NADPH produced during light reactions in chloroplast. The photon directs the photolysis of water and electron flow from water to NADPH involving both photosystems PSII and PSI.
During the electron flow, protons are pumped in thylakoid lumen which generates an electrochemical gradient across the thylakoid membrane. This gradient provides the force (proton motive force) for plastidial ATP synthesis by ATP synthase complex. The flux distribution reveals that under normal photoautotrophic condition, the cyclic electron flow (CEF), which only allows production of ATP, is inactive. Flux through the linear electron flow (LEF), that facilitates simultaneous and coupled biosynthesis of ATP and NADPH, was found to be 3.4 mmol/(gDCW.h).

3.6. Carbon Fixation by the CBB Cycle (C3 Cycle): Dark Reaction

CO2 is fixed by the enzyme Rubisco that converts three molecules of CO2 and three molecules of ribulose 1,5-bisphosphate (RUBP) into six molecules of 3-phosphoglycerate (3PGA) which is finally reduced to glyceraldehyde-3-phosphate (GAP). The carbon flux is mainly distributed through GAP to three different routes—i.e., the CBB cycle for the regeneration of RUBP—the pentose phosphate pathway and the upper part of glycolysis in chloroplast. About 0.3% of the carbon goes to lower part of glycolysis to form PEP, PYR, and acetyl CoA while 6.7% forms hydroxypyruvate. The rest 92.7% of the carbon flux goes to form GAP (Figure 2). The carbon from GAP is further diverged into two routes—firstly, towards fructose 1,6-DP formation that leads to synthesis of storage carbohydrate and secondly towards the pentose phosphate pathway (PPP) which leads to recycling of RUBP formation in C3 cycle.
In chloroplast, the acetyl-CoA initiates fatty acid synthesis [28,33,45] using the ATP and NAD(P)H generated during photosynthesis. The fluxes through fatty acid synthesis reactions were found to be very low. The carotenoids biosynthesis also takes place in chloroplast [46]. Phosphoenol pyruvate (PEP) and pyruvate form farnesyl pyrophosphate (FPP) through a series of reactions and finally the FPP gets converted through a cascade of reactions into carotenoids like beta-carotenoids, astaxanthin, etc. A very small amount of flux goes through these carotenoid biosynthesis reactions.
Interestingly, the model predicts that the pyruvate that takes part in TCA cycle in mitochondrion comes from chloroplast via cytosol through inter-compartmental transporters. The pyruvate gets converted into acetyl-CoA which participates in the TCA (tricarboxylic acid cycle). The flux through pyruvate to alpha-ketoglutarate is 0.03 mmol/(gDCW.h) (Figure 2). Although a complete TCA cycle is present in model, only a few initial and final reactions carry fluxes. The partial activity of the TCA cycle in diatoms has also been reported in previous studies [29].
Urea cycle was found to be partially active under normal growth conditions. The flux through carbamoyl phosphate synthase, which converts ammonium and carbonate ions (inside mitochondrion) to carbamoyl phosphate, was found to be 0.004 mmol/(gDCW.h). Carbamoyl-phosphate then reacts with l-ornithine to form l-citrulline which is then transported to cytoplasm. In cytoplasm, l-citrulline reacts with l-aspartate to form arginosuccinate which, in turn, dissociates into arginine and fumarate. The flux through all above reactions is same (0.004 mmol/(gDCW.h)). The last reaction of the urea cycle, which converts arginine to urea and l-ornithine, is not active under normal conditions. Only upon increasing the nitrate uptake rate without increasing the growth rate is this reaction activated.

3.7. Simulation of Si+ Limited Condition

According to previous reports, T. pseudonana accumulates a significant (20–25%) amount of chrysolaminarin [47]. In order to analyze the effect of silica limitation on chrysolaminarin production, Si+ transport was varied and the effect on the flux through chrysolaminarin production was calculated (see Section 2.8 for more details) [48]. The simulation results show that at very low flux of silica transport, chrysolaminarin production is the highest and biomass production is the lowest (Figure 3). It can be observed that with an increase in silica transport, biomass formation flux increases, and chrysolaminarin production decreases.
A comparison of the flux distribution under Si-replete and Si-limiting conditions revealed reduced photon intake and O2 released for the same CO2 intake rate (Figure 2). The reduced O2 production under Si+ limited conditions is in agreement with a previous study in Thalassiosira weissflogii [49]. That study has shown a reduced activity of PSII, the site of O2 production, under Si+-limiting condition. Similarly, the reduced photon intake under Si+ limitation is also in agreement with a previous report [49]. Flux through all pathways was reduced upon Si-limitation, while carbohydrate-synthesis flux was significantly increased.

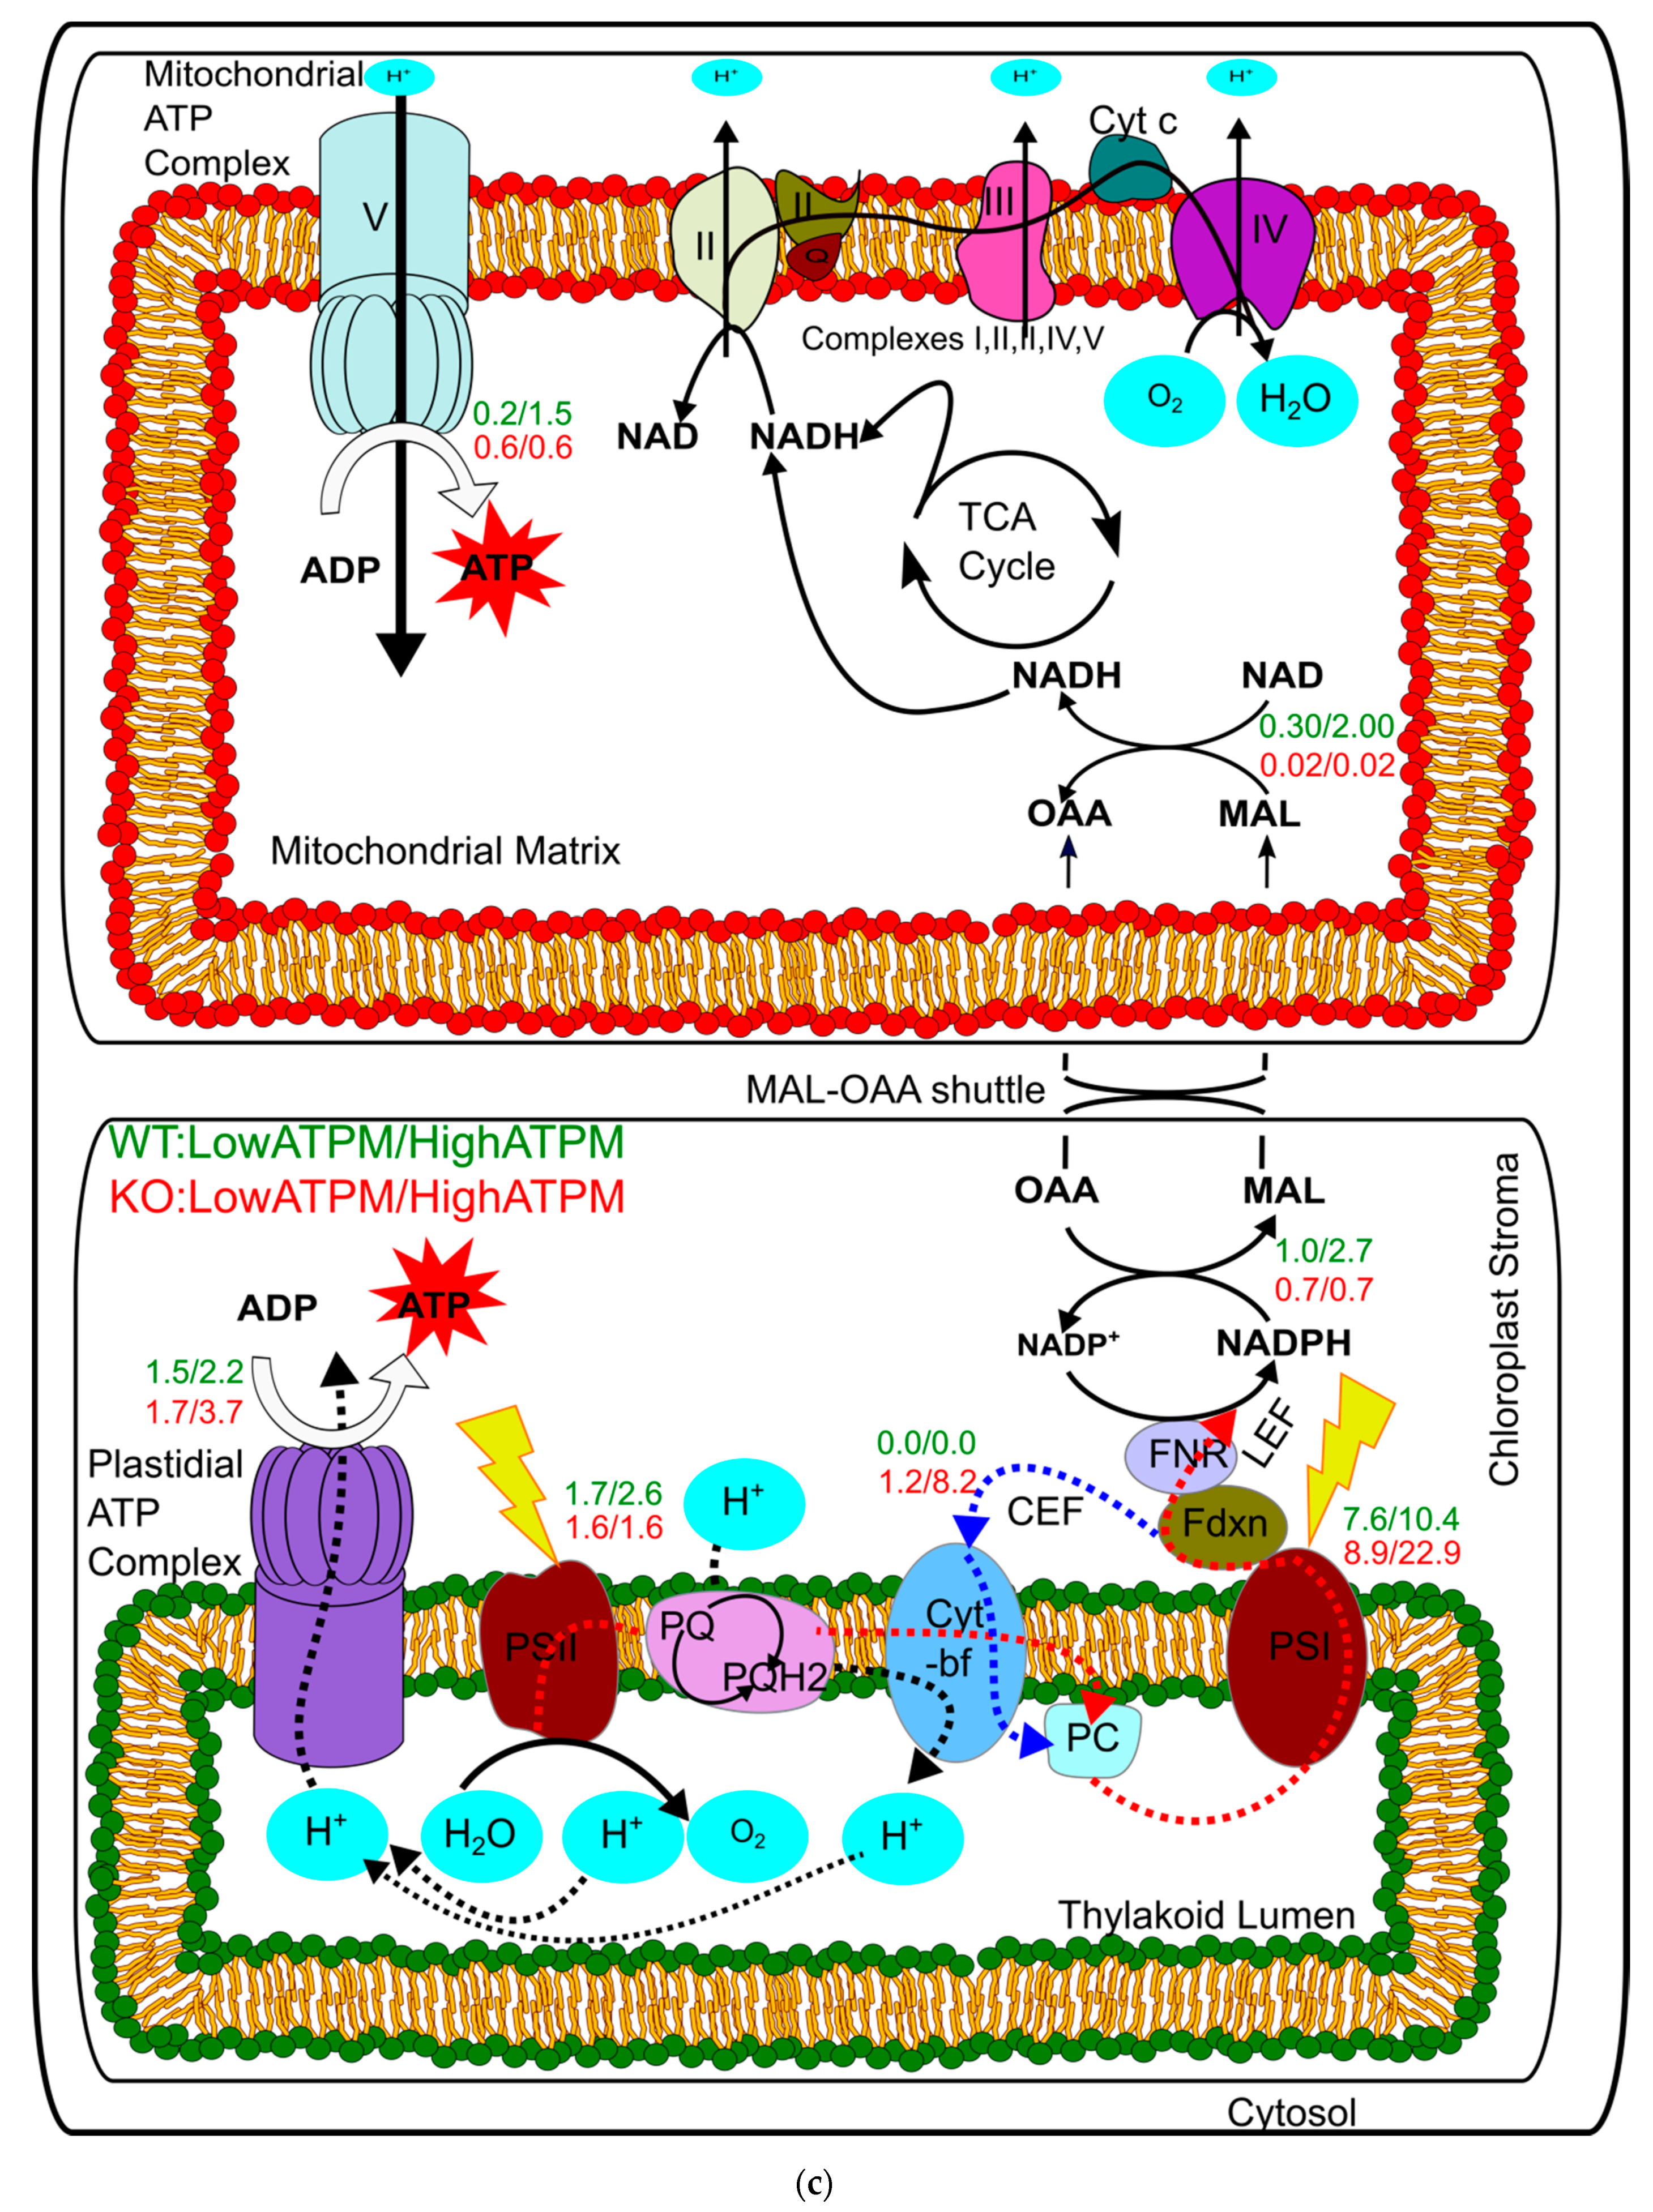
3.8. Effect of Maintenance Energy on Flux Predictions

We evaluated the effect of varying ATP maintenance values on metabolism. The range of ATPM chosen for the scanning analysis was 0–8 mmol/(gDCW.h). This range was chosen because the lowest ATPM value of 0.36 mmol/(gDCW.h) has been reported for Lactobacillus planetarium [28] while the highest, 7.6 mmol/(gDCW.h) [28], has been reported for E. coli. At ATPM value of zero, the ATP is synthesized primarily in chloroplast while a very small fraction of ATP is synthesized in mitochondrion. As the ATPM demand increases, both mitochondria as well as chloroplast contribute to ATP production. However, the increase in the mitochondrial ATP synthesis was simulated to be more in comparison to the increase in plastidial ATP synthesis (Figure 4a) and finally, the ratio of plastidial ATP synthesis to mitochondrial ATP synthesis reaches to about 0.8 (Figure 4a).
The effect of ATPM values on various reactions reveal that as ATPM increases, more photons are absorbed and the flux through linear electron flow via the PSII and PSI increases. The cyclic electron flow (CEF) remains inactive. The flux through oxaloacetate–malate valve was also increased (Figure 4b). Simulations performed while knocking out (fixing the flux to zero) the oxaloacetate–malate valve resulted in shifting the ATP production from mitochondria to chloroplast by activating the CEF (Figure 4c).
The results also show that as ATPM increases, more photons are absorbed, more O2 is consumed in mitochondria and more O2 is produced in the chloroplast. The O2 production increases with O2 consumption linearly (Figure S2). This trend of O2 production vs. O2 consumption is in agreement with previous reports [28,50].

3.9. Photoautotrophic Production of Industrially-Relevant Compounds

Diatoms are potential organisms for photoautotrophic production of various medically and industrially useful products [3,4,5,10]. They contain various valuable natural compounds like lipids, fucoxanthin pigments, etc. We investigated the potential of this organism to produce some native and non-native metabolites. The compound malate is used as a precursor for the production of biodegradable polymers, and in pharmaceutical, food, and beverages industries. Succinate is used as growth regulator in agriculture as well as precursor for many useful industrial compounds like 1,4-butanediol, tetrahydrofuran, and polybutylene succinate. Citrate is mainly used in food and pharmaceutical industries. Among the non-native compounds, 2-methyl succinate, styrene, and isobutanol are used as pharmaceutical, biopolyester, and biofuel, respectively.
The model iThaps987 was used to investigate the potential of T. pseudonana metabolic network to produce various native and non-native compounds (Table 3). The theoretical yields (mol product produced/mol CO2 consumed) of these products were predicted by the model using the FBA approach by fixing the growth rate to 80% of the wild type growth rate and maximizing for product formation. Among the native metabolites, malate, and succinate have same yield of 0.22 while citrate has a yield of 0.14. Among non-native compounds, isobutanol and PHB (polyhydroxybutyrate), have a maximum yield of 0.22 followed by 2-methylsuccinate with 0.17 and styrene with 0.17. Additionally, isobutanol production should require the least metabolic engineering, i.e., introduction of only a single heterologous gene.

3.10. Reaction Deletion Analysis to Identify Essential Reactions

The reaction-deletion analysis revealed a total of 327 essential reactions under photoautotrophic condition. Figure 5 shows the distributions of total and essential reactions across different pathways. The fatty acid metabolism pathway has the highest numbers of essential reactions followed by the nucleotide and pigment metabolism pathways. The low percent of essential reactions in T. pseudonana across the metabolic pathways suggests the presence of alternative pathways/routes for the biosynthesis of biomass precursors.

4. Discussion

Diatoms are a major constituent of phytoplanktons and play a central role in marine primary productivity. They can also be exploited as potential feedstock for biotechnological processes. Although a considerable progress has been made in understanding their basic and molecular biology, much remains to be done in the domain of systems biology. In this report, a first genome-scale metabolic model of T. pseudonana was used to interrogate different aspects of metabolism and biotechnological potential of the T. pseudonana in a systems approach. The model iThaps987 is mass balanced and does not contain any thermodynamically infeasible cycles.
During the course of model reconstruction, we identified a number of previously unannotated genes in T. pseudonana. Therefore, the model can be used for improvement of genome annotation. The draft model lacked the “PHOSACETYLTRANS-RXN” reaction but BLAST search revealed that locus “XP_002287976.1” codes for the same enzyme. The reactions “ISOCITRATE-DEHYDROGENASE-NAD+-RXN” is coded by the gene locus “XP_002290637.1”, “MALATE-DEHYDROGENASE-NADP+-RXN” by the gene locus “XP_002296311.1” and “MALATE--COA-LIGASE-RXN” by the gene locus “XP_002286405.1”. All of these gene loci were labelled as “hypothetical protein” or “predicted protein”.
Comparison with the metabolic model (iLB1025) of another diatom P. tricornutum revealed common and unique features of the model, iThaps987 (see Section 3.3 and Figure S3 for more details). It was interesting to note that a large number of unique enzymes in the T. pseudonana metabolic model are involved in pyruvate metabolism.
The simulations results predicted a typical C3 type carbon fixation (Figure 3) in spite of the presence of C4-type carbon-fixing enzyme genes. A previous study, using 14CO2 labelling, has shown that indeed C3 type carbon fixation is active under normal photoautotrophic condition [51]. The model prediction was very well in agreement with the previous study.
The ATP in the chloroplast can be generated either by the linear electron flow (LEF) or by the cyclic electron flow (CEF). The ATP synthesized by LEF is tightly coupled with NADPH production whereas the ATP synthesized by the CEF does not generate any NADPH. The model simulation indicates that the plastidial ATP was synthesized exclusively by LEF. This prediction is also in agreement with the experimental observation by [50] that the CEF around PSI is negligible in diatoms. Also, we performed the simulations by changing the photon uptake ratio between PSII/PSI to 2:1 and 4:1 to explore the effect of PSII/PSI ratio on flux distribution and specially on the flux through CEF. There was no significant change in the flux distributions under both conditions except that the flux through PSII was increased to 3.5 (mmol/(gDCW.h)) from 1.7 (mmol/(gDCW.h)) (almost doubled). CEF was still inactive.
The model was further utilized to explore the effect of different ATPM values on metabolism (Figure 4b). The increase in ATP demand at higher ATPM values causes plastidial ATP synthase to produce more ATP by absorbing more photons. The simulation reveals that even at higher ATPM value, only LEF is responsible for plastidial ATP synthesis (as shown by [50]) along-with NADPH production. This deviates the ATP/NADPH ratio. Mitochondrion plays an important role to optimize the disturbed ATP/NADPH ratio in chloroplast. The chloroplastic enzyme malate dehyrogenase converts oxaloacetate to malate by converting NADPH to NADP. The malate was then transported to mitochondrion via the malate–oxaloacetate valve (while oxaloacetate is shuttled to chloroplast). The mitochondrial enzyme malate dehydrogenase converts the malate back to oxaloacetate by converting NAD to NADH. This NADH is then utilized by mitochondrial ATP synthase to produce more ATP. The ratio of mitochondrial ATP to plastidial ATP production was close to zero at low ATPM (Figure 4a) but as ATPM increases, the ratio also increases. Therefore, the ATP/NADPH ratio was optimized by mitochondrial ATP synthesis. This is in agreement with [50] which found that a part of the photosynthate is channelled to mitochondrion in order to regulate the ATP/NADPH ratio in chloroplast. Only when we block the malate valve in mitochondrion, the CEF is activated. Further analysis revealed that blocking malate valve leads to a higher photon uptake and if we fix photon uptake to the previous value then solution becomes infeasible. This result indicates the important role played by the mitochondrion and the malate valve in optimizing photosynthesis (Figure 4c). The GEM, iThaps987 has ‘2-oxoglutarate-malate shuttle’ besides ‘malate–oxaloacetate shuttle’ for exchange of metabolites between mitochondrion and chloroplast. Amongst these, the ‘malate–oxaloacetate shuttle’ plays a major role in translocation of photosynthate from chloroplast to mitochondrion. ‘Malate–aspartate shuttle’ was found to be absent in the iThaps987 model as it was in iLB1025.
Unlike other unicellular organisms such as bacteria, cyanobacteria, yeast, and green algae, diatoms have a complete urea cycle [52]. However, model simulations suggest that under normal photoautotrophic conditions, urea cycle is only partially active. Only upon excessive nitrogen (NO3) intake does the last reaction of urea cycle get activated to flush out the excess nitrogen in the form of urea.
The simulations for Si-limited condition revealed a trade-off between formation of storage product and biomass production under nutrient-limiting condition. The carbon was partitioning between biomass and chrysolaminarin at various levels of silica. Under stressed conditions (very low silica), most of the carbon goes to chrysolaminarin while at higher silica intake flux, the carbon flux shifts towards biomass formation.
The systems analyses of iThaps987 with respect to its biotechnological potential revealed iso-butanol as the non-native product that can be produced with the introduction of only a single foreign gene “kivD’. On the contrary, two genes ‘kivD and ADH2′ are required in the P. tricornutum model.
The reconstructed GEM can also be utilized to reveal new systems-level insights about the organism. For example, integration of expression data to the available GEM could provide novel insights into metabolic regulation under different conditions. The model is provided in ScrumPy as well as in mat format that can be used for further studies. Some studies have performed transcriptomic and proteomic analysis of T. pesudonana under different conditions [53,54,55]. The model can be integrated with omics data (such as transcriptomics or proteomics), which would provide further constraints to the fluxes, thus narrowing the FBA solution space and improving the prediction of the simulated flux distribution. Finally, 13C-MFA can be performed in different conditions to validate the predicted FBA solutions.

5. Conclusions

This report presents the first publicly available, comprehensive, and manually curated genome scale metabolic model of Thalassiosira pseudonana. Several results obtained by the model were found to be in agreement with previous reports. The model was used to probe the metabolic engineering needed to produce various native and heterologous industrially relevant compounds that can be produced by the organism. The model will be a useful tool for systems-level investigation of Thalassiosira pseudonana.

Supplementary Materials

The following are available online at https://www.mdpi.com/2076-2607/8/9/1396/s1, S1: GEM in ScrumPy format; S2: GEM in Excel format; S3: GEM in MATLAB mat file format; S4: List of gap-filling reactions; S5: List of common and unique enzymes in iThaps987; S6: Biomass reaction calculation; S7: Methods and growth curve.

Author Contributions

Conceptualization, S.S. and A.T.; Methodology, A.A.; Software, A.A.; Validation, A.A.; Formal analysis, A.A.; Investigation, A.A.; Resources, S.S.; Data curation, A.A.; Writing—original draft preparation, A.A.; Writing—review and editing, S.S. and A.T.; Supervision, S.S. and A.T. All authors have read and agreed to the published version of the manuscript.

Funding

This research was funded by Department of Biotechnology (DBT), India.

Acknowledgments

The authors thank the Department of Biotechnology (DBT), India, for funding the research.

Conflicts of Interest

The authors declare no conflict of interest. The funders had no role in the design of the study; in the collection; analyses; or interpretation of data; in the writing of the manuscript; or in the decision to publish the results.

References

  1. Tréguer, P.; Nelson, D.M.; Van Bennekom, A.J.; Demaster, D.J.; Leynaert, A.; Quéguiner, B. The silica balance in the world ocean: A reestimate. Science 1995, 268, 375–379. [Google Scholar] [CrossRef] [PubMed]
  2. Nelson, D.M.; Tréguer, P.; Brzezinski, M.A.; Leynaert, A.; Quéguiner, B. Production and dissolution of biogenic silica in the ocean: Revised global estimates, comparison with regional data and relationship to biogenic sedimentation. Glob. Biogeochem. Cycles 1995, 9, 359–372. [Google Scholar] [CrossRef]
  3. Peng, J.; Yuan, J.P.; Wu, C.F.; Wang, J.H. Fucoxanthin, a marine carotenoid present in brown seaweeds and diatoms: Metabolism and bioactivities relevant to human health. Mar. Drugs 2011, 9, 1806–1828. [Google Scholar] [CrossRef] [PubMed]
  4. Butler, T.; Kapoore, R.V.; Vaidyanathan, S. Phaeodactylum tricornutum: A Diatom Cell Factory. Trends Biotechnol. 2020, 38, 606–622. [Google Scholar] [CrossRef] [PubMed]
  5. Hildebrand, M.; Davis, A.K.; Smith, S.R.; Traller, J.C.; Abbriano, R. The place of diatoms in the biofuels industry. Biofuels 2012, 3, 221–240. [Google Scholar] [CrossRef] [Green Version]
  6. Chiovitti, A.; Molino, P.; Crawford, S.A.; Teng, R.; Spurck, T.; Wetherbee, R. The glucans extracted with warm water from diatoms are mainly derived from intracellular chrysolaminaran and not extracellular polysaccharides. Eur. J. Phycol. 2004, 39, 117–128. [Google Scholar] [CrossRef]
  7. Sayanova, O.; Mimouni, V.; Ulmann, L.; Morant-Manceau, A.; Pasquet, V.; Schoefs, B.; Napier, J.A. Modulation of lipid biosynthesis by stress in diatoms. Philos. Trans. R. Soc. B Biol. Sci. 2017, 372, 20160407. [Google Scholar] [CrossRef] [Green Version]
  8. Li, X.; Marella, T.K.; Tao, L.; Li, R.; Tiwari, A.; Li, G. Optimization of growth conditions and fatty acid analysis for three freshwater diatom isolates. Phycol. Res. 2017, 65, 177–187. [Google Scholar] [CrossRef]
  9. Marella, T.K.; Tiwari, A. Marine diatom Thalassiosira weissflogii based biorefinery for co-production of eicosapentaenoic acid and fucoxanthin. Bioresour. Technol. 2020, 307, 123245. [Google Scholar] [CrossRef]
  10. Richthammer, P.; Börmel, M.; Brunner, E.; van Pée, K.-H. Biomineralization in Diatoms: The Role of Silacidins. ChemBioChem 2011, 12, 1362–1366. [Google Scholar] [CrossRef]
  11. Delalat, B.; Sheppard, V.C.; Rasi Ghaemi, S.; Rao, S.; Prestidge, C.A.; McPhee, G.; Rogers, M.L.; Donoghue, J.F.; Pillay, V.; Johns, T.G.; et al. Targeted drug delivery using genetically engineered diatom biosilica. Nat. Commun. 2015, 6, 1–11. [Google Scholar] [CrossRef] [Green Version]
  12. Trentacoste, E.M.; Shrestha, R.P.; Smith, S.R.; Glé, C.; Hartmann, A.C.; Hildebrand, M.; Gerwick, W.H. Metabolic engineering of lipid catabolism increases microalgal lipid accumulation without compromising growth. Proc. Natl. Acad. Sci. USA 2013, 110, 19748–19753. [Google Scholar] [CrossRef] [Green Version]
  13. Cook, O.; Hildebrand, M. Enhancing LC-PUFA production in Thalassiosira pseudonana by overexpressing the endogenous fatty acid elongase genes. J. Appl. Phycol. 2016, 28, 897–905. [Google Scholar] [CrossRef]
  14. Manandhar-Shrestha, K.; Hildebrand, M. Characterization and manipulation of a DGAT2 from the diatom Thalassiosira pseudonana: Improved TAG accumulation without detriment to growth, and implications for chloroplast TAG accumulation. Algal Res. 2015, 12, 239–248. [Google Scholar] [CrossRef] [Green Version]
  15. Shah, A.R.; Ahmad, A.; Srivastava, S.; Jaffar Ali, B.M. Reconstruction and analysis of a genome-scale metabolic model of Nannochloropsis gaditana. Algal Res. 2017, 26, 354–364. [Google Scholar] [CrossRef]
  16. Poolman, M.G.; Kundu, S.; Shaw, R.; Fell, D.A. Responses to Light Intensity in a Genome-Scale Model of Rice Metabolism. Plant. Physiol. 2013, 162, 1060–1072. [Google Scholar] [CrossRef] [PubMed] [Green Version]
  17. Hartman, H.B.; Fell, D.A.; Rossell, S.; Jensen, P.R.; Woodward, M.J.; Thorndahl, L.; Jelsbak, L.; Olsen, J.E.; Raghunathan, A.; Daefler, S.; et al. Identification of potential drug targets in Salmonella enterica sv. Typhimurium using metabolic modelling and experimental validation. Microbiology 2014, 160, 1252–1266. [Google Scholar] [CrossRef] [PubMed] [Green Version]
  18. Thiele, I.; Palsson, B. A protocol for generating a high-quality genome-scale metabolic reconstruction. Nat. Protoc. 2010, 5, 93–121. [Google Scholar] [CrossRef] [Green Version]
  19. Fell, D.A.; Poolman, M.G.; Gevorgyan, A. Building and analysing genome-scale metabolic models. Biochem. Soc. Trans. 2010, 38, 1197–1201. [Google Scholar] [CrossRef] [Green Version]
  20. Ahmad, A.; Hartman, H.B.; Krishnakumar, S.; Fell, D.A.; Poolman, M.G.; Srivastava, S. A Genome Scale Model of Geobacillus thermoglucosidasius (C56-YS93) reveals its biotechnological potential on rice straw hydrolysate. J. Biotechnol. 2017, 251, 30–37. [Google Scholar] [CrossRef] [Green Version]
  21. Monk, J.M.; Koza, A.; Campodonico, M.A.; Machado, D.; Seoane, J.M.; Palsson, B.O.; Herrgård, M.J.; Feist, A.M. Multi-omics Quantification of Species Variation of Escherichia coli Links Molecular Features with Strain Phenotypes. Cell Syst. 2016, 3, 238–251. e12. [Google Scholar] [CrossRef] [PubMed] [Green Version]
  22. Safak Yilmaz, L.; Walhout, A.J.M. A Caenorhabditis elegans Genome-Scale Metabolic Network Model. Cell Syst. 2016, 2, 297–311. [Google Scholar] [CrossRef] [PubMed] [Green Version]
  23. Brunk, E.; Sahoo, S.; Zielinski, D.C.; Altunkaya, A.; Dräger, A.; Mih, N.; Gatto, F.; Nilsson, A.; Preciat Gonzalez, G.A.; Aurich, M.K.; et al. Recon3D enables a three-dimensional view of gene variation in human metabolism. Nat. Biotechnol. 2018, 36, 272–281. [Google Scholar] [CrossRef] [PubMed]
  24. Gomes de Oliveira Dal’Molin, C.; Quek, L.-E.; Palfreyman, R.W.; Nielsen, L.K. AlgaGEM—A genome-scale metabolic reconstruction of algae based on the Chlamydomonas reinhardtii genome. BMC Genom. 2011, 12, S5. [Google Scholar]
  25. Imam, S.; Schäuble, S.; Valenzuela, J.; Lõpez García De Lomana, A.; Carter, W.; Price, N.D.; Baliga, N.S. A refined genome-scale reconstruction of Chlamydomonas metabolism provides a platform for systems-level analyses. Plant. J. 2015, 84, 1239–1256. [Google Scholar] [CrossRef] [PubMed] [Green Version]
  26. Zuñiga, C.; Li, C.-T.; Huelsman, T.; Levering, J.; Zielinski, D.C.; McConnell, B.O.; Long, C.P.; Knoshaug, E.P.; Guarnieri, M.T.; Antoniewicz, M.R.; et al. Genome-Scale Metabolic Model for the Green Alga Chlorella vulgaris UTEX 395 Accurately Predicts Phenotypes under Autotrophic, Heterotrophic, and Mixotrophic Growth Conditions. Plant. Physiol. 2016, 172, 589–602. [Google Scholar] [CrossRef] [Green Version]
  27. Loira, N.; Mendoza, S.; Paz Cortés, M.; Rojas, N.; Travisany, D.; Di Genova, A.; Gajardo, N.; Ehrenfeld, N.; Maass, A. Reconstruction of the microalga Nannochloropsis salina genome-scale metabolic model with applications to lipid production. BMC Syst. Biol. 2017, 11, 66. [Google Scholar] [CrossRef]
  28. Levering, J.; Broddrick, J.; Dupont, C.L.; Peers, G.; Beeri, K.; Mayers, J.; Gallina, A.A.; Allen, A.E.; Palsson, B.O.; Zengler, K. Genome-Scale Model Reveals Metabolic Basis of Biomass Partitioning in a Model Diatom. PLoS ONE 2016, 11, e0155038. [Google Scholar] [CrossRef] [Green Version]
  29. Kim, J.; Fabris, M.; Baart, G.; Kim, M.K.; Goossens, A.; Vyverman, W.; Falkowski, P.G.; Lun, D.S. Flux balance analysis of primary metabolism in the diatom Phaeodactylum tricornutum. Plant. J. 2016, 85, 161–176. [Google Scholar] [CrossRef] [Green Version]
  30. LEWIN, J.C. The taxonomic position of Phaeodactylum tricornutum. J. Gen. Microbiol. 1958, 18, 427–432. [Google Scholar] [CrossRef] [Green Version]
  31. Kociolek, J.P.; Theriot, E.C.; Williams, D.M.; Julius, M.; Stoermer, E.F.; Kingston, J.C. Centric and araphid diatoms. In Freshwater Algae of North America: Ecology and Classification; Elsevier Inc.: Amsterdam, The Netherlands, 2015; pp. 653–708. ISBN 9780123858771. [Google Scholar]
  32. Bowler, C.; Falciatore, A.  Phaeodactylum tricornutum. Trends Genet. 2019, 35, 706–707. [Google Scholar] [CrossRef]
  33. Brembu, T.; Mühlroth, A.; Alipanah, L.; Bones, A.M. The effects of phosphorus limitation on carbon metabolism in diatoms. Philos. Trans. R. Soc. B Biol. Sci. 2017, 372, 20160406. [Google Scholar] [CrossRef] [PubMed]
  34. Zhao, P.; Gu, W.; Wu, S.; Huang, A.; He, L.; Xie, X.; Gao, S.; Zhang, B.; Niu, J.; Peng Lin, A.; et al. Silicon enhances the growth of Phaeodactylum tricornutum Bohlin under green light and low temperature. Sci. Rep. 2014, 4, 1–10. [Google Scholar] [CrossRef] [PubMed] [Green Version]
  35. Martino, A.D.; Meichenin, A.; Shi, J.; Pan, K.; Bowler, C. Genetic and phenotypic characterization of Phaeodactylum tricornutum (Bacillariophyceae) accessions 1. J. Phycol. 2007, 43, 992–1009. [Google Scholar] [CrossRef]
  36. Poolman, M.G.; Miguet, L.; Sweetlove, L.J.; Fell, D.A. A Genome-Scale Metabolic Model of Arabidopsis and Some of Its Properties. Plant. Physiol. 2009, 151, 1570–1581. [Google Scholar] [CrossRef] [Green Version]
  37. Poolman, M.G. ScrumPy: Metabolic modelling with Python. Syst. Biol. 2006, 153, 375–378. [Google Scholar] [CrossRef]
  38. Karp, P.D.; Billington, R.; Caspi, R.; Fulcher, C.A.; Latendresse, M.; Kothari, A.; Keseler, I.M.; Krummenacker, M.; Midford, P.E.; Ong, Q.; et al. The BioCyc collection of microbial genomes and metabolic pathways. In Briefings in Bioinformatics; Oxford University Press: Oxford, UK, 2019; Volume 20, pp. 1085–1093. [Google Scholar]
  39. MetaCyc Database of Metabolic Pathways and Enzymes|Nucleic Acids Research|Oxford Academic. Available online: https://academic.oup.com/nar/article/46/D1/D633/4559117 (accessed on 21 May 2020).
  40. Ogata, H.; Goto, S.; Sato, K.; Fujibuchi, W.; Bono, H.; Kanehisa, M. KEGG: Kyoto encyclopedia of genes and genomes. Nucleic Acids Res. 1999, 27, 29–34. [Google Scholar] [CrossRef] [Green Version]
  41. Ahmad, A.; Pathania, R.; Srivastava, S. Biochemical characteristics and a genome-scale metabolic model of an indian euryhaline cyanobacterium with high polyglucan content. Metabolites 2020, 10, 177. [Google Scholar] [CrossRef]
  42. King, B.R.; Vural, S.; Pandey, S.; Barteau, A.; Guda, C. NgLOC: Software and web server for predicting protein subcellular localization in prokaryotes and eukaryotes. BMC Res. Notes 2012, 5, 351. [Google Scholar] [CrossRef] [Green Version]
  43. Lee, N.-R.; Lakshmanan, M.; Aggarwal, S.; Song, J.-W.; Karimi, I.A.; Lee, D.-Y.; Park, J.-B. Genome-scale metabolic network reconstruction and in silico flux analysis of the thermophilic bacterium Thermus thermophilus HB27. Microb. Cell Fact. 2014, 13, 61. [Google Scholar] [CrossRef] [Green Version]
  44. Yuan, H.; Cheung, C.Y.M.; Poolman, M.G.; Hilbers, P.A.J.; Van Riel, N.A.W. A genome-scale metabolic network reconstruction of tomato (Solanum lycopersicum L.) and its application to photorespiratory metabolism. Plant. J. 2016, 85, 289–304. [Google Scholar] [CrossRef] [Green Version]
  45. Yi, Z.; Xu, M.; Di, X.; Brynjolfsson, S.; Fu, W. Exploring valuable lipids in diatoms. Front. Mar. Sci. 2017, 4, 17. [Google Scholar] [CrossRef] [Green Version]
  46. Athanasakoglou, A.; Kampranis, S.C. Diatom isoprenoids: Advances and biotechnological potential. Biotechnol. Adv. 2019, 37, 107417. [Google Scholar] [CrossRef] [PubMed]
  47. Hildebrand, M.; Manandhar-Shrestha, K.; Abbriano, R. Effects of chrysolaminarin synthase knockdown in the diatom Thalassiosira pseudonana: Implications of reduced carbohydrate storage relative to green algae. Algal Res. 2017, 23, 66–77. [Google Scholar] [CrossRef]
  48. Klanchui, A.; Dulsawat, S.; Chaloemngam, K.; Cheevadhanarak, S.; Prommeenate, P.; Meechai, A. An improved genome-scale metabolic model of Arthrospira platensis C1 (iAK888) and its application in glycogen overproduction. Metabolites 2018, 8, 84. [Google Scholar] [CrossRef] [Green Version]
  49. Direct Impact of Silicate on the Photosynthetic Performance of the Diatom Thalassiosira weissflogii Assessed by On- and Off-Line PAM Fluorescence Measurements|Journal of Plankton Research|Oxford Academic. Available online: https://academic.oup.com/plankt/article/21/2/269/1432210 (accessed on 24 July 2020).
  50. Bailleul, B.; Berne, N.; Murik, O.; Petroutsos, D.; Prihoda, J.; Tanaka, A.; Villanova, V.; Bligny, R.; Flori, S.; Falconet, D.; et al. Energetic coupling between plastids and mitochondria drives CO 2 assimilation in diatoms. Nature 2015, 524, 366–369. [Google Scholar] [CrossRef] [Green Version]
  51. Roberts, K.; Granum, E.; Leegood, R.C.; Raven, J.A. C3 and C4 pathways of photosynthetic carbon assimilation in marine diatoms are under genetic, not environmental, control. Plant. Physiol. 2007, 145, 230–235. [Google Scholar] [CrossRef] [Green Version]
  52. Allen, A.E.; Dupont, C.L.; Oborník, M.; Horák, A.; Nunes-Nesi, A.; McCrow, J.P.; Zheng, H.; Johnson, D.A.; Hu, H.; Fernie, A.R.; et al. Evolution and metabolic significance of the urea cycle in photosynthetic diatoms. Nature 2011, 473, 203–207. [Google Scholar] [CrossRef]
  53. Dyhrman, S.T.; Jenkins, B.D.; Rynearson, T.A.; Saito, M.A.; Mercier, M.L.; Alexander, H.; Whitney, L.P.; Drzewianowski, A.; Bulygin, V.V.; Bertrand, E.M.; et al. The Transcriptome and Proteome of the Diatom Thalassiosira pseudonana Reveal a Diverse Phosphorus Stress Response. PLoS ONE 2012, 7, e33768. [Google Scholar] [CrossRef] [Green Version]
  54. Carvalho, R.N.; Bopp, S.K.; Lettieri, T. Transcriptomics Responses in Marine Diatom Thalassiosira pseudonana Exposed to the Polycyclic Aromatic Hydrocarbon Benzo[a]pyrene. PLoS ONE 2011, 6, e26985. [Google Scholar] [CrossRef] [Green Version]
  55. Shrestha, R.P.; Tesson, B.; Norden-Krichmar, T.; Federowicz, S.; Hildebrand, M.; Allen, A.E. Whole transcriptome analysis of the silicon response of the diatom Thalassiosira pseudonana. BMC Genom. 2012, 13, 499. [Google Scholar] [CrossRef] [Green Version]
Figure 1. Comparison of two diatom GEMs. (a) A Venn diagram showing common and unique enzymes in iThaps987 and iLB1025 models. (b) Distribution of unique enzymes iThaps987 in various main pathway categories. (c) Distribution of unique enzymes in sub-pathways of main pathway categories. The color coding follows the colors used for the corresponding pathway in (b).
Microorganisms 08 01396 g001aMicroorganisms 08 01396 g001b
Figure 2. Flux-map showing flux distributions under Si-rich/Si-limited condition. Chloroplast are shown in green color while mitochondria are shown in red. Photosynthesis, lipid, and fucoxanthin synthesis occurs in chloroplast while the TCA cycle and part of the urea cycle occurs in mitochondria. Other major pathways are located in cytosol. The flux through pathways was simulated by fixing the measured growth rate and using the minimization of total flux as the objective function.
Microorganisms 08 01396 g002
Figure 3. Effect Si+ transport variation on biomass and chrysolaminarin production. For these simulations, the Si+-transport was varied from zero to the value obtained under Si+ replete condition (0.05 mmol/(gDCW.h) and the fluxes through biomass and chrysolaminarin biosynthesis reactions are presented.
Microorganisms 08 01396 g003
Figure 4. Simulated effect of variation of maintenance ATP (ATPM) values on metabolism. (a) Effect of ATPM values on the ratio of mitochondrial and plastidial ATP synthesis. The flux through ATPM reaction was varied and the effect on plastidial and mitochondrial ATP synthesis reactions was simulated. (b) Effect of ATPM values on flux through different reactions of the model, iThaps987. PSI: Photosystem-I, PSII: photosystem-II, Photon_tx: Photon transport, Plastidial_ATP_Synthase: Plastdial ATP synthesis reaction, Mitochondrial_ATP_Synthase: Mitochondrial ATP synthesis reaction, OAA_MAL_Chlo_tx: Malate–oxaloacetate shuttle_chloroplast_transport, OAA_MAL_Mito_tx: Malate–oxaloacetate shuttle_ mitochondria_transport. (c): The figure shows the fluxes under low (1.5 mmol/(gDW.h)) and high (7.5 mmol/(gDW.h)) ATP maintenance values. The values written in green were obtained from simulations performed under normal wild-type conditions while the values written in red were obtained from simulations performed by knocking out the transporter for mitochondrial malate–oxaloacetate shuttle. LEF: Linear Electron Flow, CEF: Cyclic Electron Flow, PSI: Photo-system I, PSII: Photo-system II, PQ: Plastoquinone, PC: Plastocyanin, Fdxn: Ferredoxin.
Microorganisms 08 01396 g004aMicroorganisms 08 01396 g004b
Figure 5. Distribution of total and essential reactions of the model across various subsystems.
Microorganisms 08 01396 g005
Table 1. Distribution of reactions and metabolites in different compartments of the model iThaps987.
CytosolChloroplastMitochondrionTransport
Reactions112588737788
Metabolites1024984467-
Table 2. Comparison of the iThaps987 model with other published models of diatoms.
Microorganism P. tricornutumP. tricornutumT. pseudonana
Genome size (Mbp) 27.4527.4532.61
Genes in the model 1027 (10,392) -987
Number of reactions/metabolites 2156 */2172 849/5872477/2456
Compartments 643
Reference [28][29]This study
* Levering et al. had given two models in the same publication; one is normal model with 2156 reactions and the other model is lipid metabolism specific model having 4456 reactions.
Table 3. Simulated maximum theoretical yields of various native and non-native products under photoautotrophic conditions.
S.NProductYield Photoautotrophic (mol/mol carbon)No. of Added ReactionsAdded Genes
NativeiThaps987
1Malate0.220
2Succinate0.220
3Citrate0.140
Non-Native
42-MethylSuccinate0.174cimA, leuC, leuD, ER
5Styrene0.112(PAL, PAL1, encP), FDC1
6iso-butanol0.221kivD
7Valencene0.062Valcs, Vals, Tps1
8Farnesyl-PP0.06 afs
9Naringenin0.063PAL, (CHI1 and CHI2),CHS-A
105-Amino-Levulinate0.171hemA or HemT
11Isoprene0.174Isps, IspG, IspH *
(* catalyses 2 reactions)
12PHB0.222phbB, phbC
14Citramalate0.171cimA

