
An Integrated, Tentative Remote-Sensing Approach Based on NDVI Entropy to Model Canine Distemper Virus in Wildlife and to Prompt Science-Based Management Policies

 ,
,  , ,
, ,  and
and
Abstract
:Simple Summary
Abstract
1. Introduction
2. Study Area
3. Materials and Methods
4. Results
5. Discussion
6. Conclusions
Author Contributions
Funding
Institutional Review Board Statement
Informed Consent Statement
Data Availability Statement
Acknowledgments
Conflicts of Interest
References
- Di Blasio, A.; Irico, L.; Caruso, C.; Miceli, I.; Robetto, S.; Peletto, S.; Varello, K.; Giorda, F.; Mignone, W.; Rubinetti, F.; et al. Canine Distemper Virus as an Emerging Multihost Pathogen in Wild Carnivores in Northwest Italy. J. Wildl. Dis. 2019, 55, 844–856. [Google Scholar] [CrossRef] [PubMed]
- Origgi, F.; Plattet, P.; Sattler, U.; Robert, N.; Casaubon, J.; Mavrot, F.; Pewsner, M.; Wu, N.; Giovannini, S.; Oevermann, A.; et al. Emergence of Canine Distemper Virus Strains with Modified Molecular Signature and Enhanced Neuronal Tropism Leading to High Mortality in Wild Carnivores. Vet. Pathol. 2012, 49, 913–929. [Google Scholar] [CrossRef] [PubMed] [Green Version]
- Martella, V.; Elia, G.; Buonavoglia, C. Canine Distemper Virus. Vet. Clin. N. Am. Small Anim. Pract. 2008, 38, 787–797. [Google Scholar] [CrossRef] [PubMed]
- Duque-Valencia, J.; Sarute, N.; Olarte-Castillo, X.A.; Ruíz-Sáenz, J. Evolution and Interspecies Transmission of Canine Distemper Virus—an Outlook of the Diverse Evolutionary Landscapes of a Multi-Host Virus. Viruses 2019, 11, 582. [Google Scholar] [CrossRef] [Green Version]
- Deem, S.L.; Spelman, L.H.; Yates, R.A.; Montali, R.J. Canine Distemper in Terrestrial Carnivores: A Review. J. Zoo Wildl. Med. 2000, 31, 441–451. [Google Scholar]
- Headley, S.A.; Amude, A.M.; Alfieri, A.F.; Bracarense, A.P.F.; Alfieri, A.A. Epidemiological Features and the Neuropathological Manifestations of Canine Distemper Virus-Induced Infections in Brazil: A Review. Semin. Ciênc. Agrár. 2012, 33, 1945–1978. [Google Scholar] [CrossRef] [Green Version]
- Roscoe, D.E. Epizootiology of Canine Distemper in New Jersey Raccoons. J. Wildl. Dis. 1993, 29, 390–395. [Google Scholar] [CrossRef]
- Monne, I.; Fusaro, A.; Valastro, V.; Citterio, C.; Dalla Pozza, M.; Obber, F.; Trevisiol, K.; Cova, M.; De Benedictis, P.; Bregoli, M.; et al. A Distinct CDV Genotype Causing a Major Epidemic in Alpine Wildlife. Vet. Microbiol. 2011, 150, 63–69. [Google Scholar] [CrossRef] [Green Version]
- Botti, V.; Navillod, F.V.; Domenis, L.; Orusa, R.; Pepe, E.; Robetto, S.; Guidetti, C. Salmonella spp. and Antibiotic-Resistant Strains in Wild Mammals and Birds in North-Western Italy from 2002 to 2010. Vet. Ital 2013, 49, 195–202. [Google Scholar]
- Di Martino, B.; Di Profio, F.; Melegari, I.; Di Felice, E.; Robetto, S.; Guidetti, C.; Orusa, R.; Martella, V.; Marsilio, F. Molecular Detection of Kobuviruses in European Roe Deer (Capreolus Capreolus) in Italy. Arch. Virol. 2015, 160, 2083–2086. [Google Scholar] [CrossRef]
- Frölich, K.; Czupalla, O.; Haas, L.; Hentschke, J.; Dedek, J.; Fickel, J. Epizootiological Investigations of Canine Distemper Virus in Free-Ranging Carnivores from Germany. Vet. Microbiol. 2000, 74, 283–292. [Google Scholar] [CrossRef]
- Orusa, T.; Orusa, R.; Viani, A.; Carella, E.; Borgogno Mondino, E. Geomatics and EO Data to Support Wildlife Diseases Assessment at Landscape Level: A Pilot Experience to Map Infectious Keratoconjunctivitis in Chamois and Phenological Trends in Aosta Valley (NW Italy). Remote Sens. 2020, 12, 3542. [Google Scholar] [CrossRef]
- Meentemeyer, R.K.; Haas, S.E.; Václavík, T. Landscape Epidemiology of Emerging Infectious Diseases in Natural and Human-Altered Ecosystems. Annu. Rev. Phytopathol. 2012, 50, 379–402. [Google Scholar] [CrossRef] [PubMed] [Green Version]
- Orusa, T.; Mondino, E.B. Landsat 8 Thermal Data to Support Urban Management and Planning in the Climate Change Era: A Case Study in Torino Area, NW Italy. In Proceedings of the Remote Sensing Technologies and Applications in Urban Environments IV; International Society for Optics and Photonics: Strasbourg, France, 2019; Volume 11157, p. 111570O. [Google Scholar]
- Gianni, L.; Marco, B.; Tommaso, O. Lessico e Nuvole: Le Parole del Cambiamento Climatico, 2nd ed.; Università di Torino: Turin, Italy, 2020. (In Italian) [Google Scholar]
- Latini, G.; Bagliani, M.; Orusa, T. Lessico e Nuvole: Le Parole del Cambiamento Climatico, 1st ed.; Università di Torino: Turin, Italy, 2019. (In Italian) [Google Scholar]
- Hansen, M.C.; Potapov, P.V.; Moore, R.; Hancher, M.; Turubanova, S.A.; Tyukavina, A.; Thau, D.; Stehman, S.V.; Goetz, S.J.; Loveland, T.R.; et al. High-Resolution Global Maps of 21st-Century Forest Cover Change. Science 2013, 342, 850–853. [Google Scholar] [CrossRef] [PubMed] [Green Version]
- Kennedy, R.E.; Yang, Z.; Gorelick, N.; Braaten, J.; Cavalcante, L.; Cohen, W.B.; Healey, S. Implementation of the LandTrendr Algorithm on Google Earth Engine. Remote Sens. 2018, 10, 691. [Google Scholar] [CrossRef] [Green Version]
- Kumar, L.; Mutanga, O. Google Earth Engine Applications since Inception: Usage, Trends, and Potential. Remote Sens. 2018, 10, 1509. [Google Scholar] [CrossRef] [Green Version]
- Palaniyandi, M. The Role of Remote Sensing and GIS for Spatial Prediction of Vector-Borne Diseases Transmission: A Systematic Review. J. Vector Borne Dis. 2012, 49, 197. [Google Scholar]
- Dandois, J.P.; Ellis, E.C. High Spatial Resolution Three-Dimensional Mapping of Vegetation Spectral Dynamics Using Computer Vision. Remote Sens. Environ. 2013, 136, 259–276. [Google Scholar] [CrossRef] [Green Version]
- Anyamba, A.; Linthicum, K.J.; Tucker, C.J. Climate-Disease Connections: Rift Valley Fever in Kenya. Cad. Saude Publica 2001, 17, S133–S140. [Google Scholar] [CrossRef]
- Chretien, J.-P.; Anyamba, A.; Small, J.; Britch, S.; Sanchez, J.L.; Halbach, A.C.; Tucker, C.; Linthicum, K.J. Global Climate Anomalies and Potential Infectious Disease Risks: 2014–2015. PLoS Curr. 2015, 7, 49. [Google Scholar] [CrossRef]
- Ravanelli, R.; Nascetti, A.; Cirigliano, R.V.; Di Rico, C.; Leuzzi, G.; Monti, P.; Crespi, M. Monitoring the Impact of Land Cover Change on Surface Urban Heat Island through Google Earth Engine: Proposal of a Global Methodology, First Applications and Problems. Remote Sens. 2018, 10, 1488. [Google Scholar] [CrossRef] [Green Version]
- Epstein, P.R. Climate and Health. Science 1999, 285, 347–348. [Google Scholar] [CrossRef] [PubMed] [Green Version]
- Lash, R.R.; Brunsell, N.A.; Peterson, A.T. Spatiotemporal Environmental Triggers of Ebola and Marburg Virus Transmission. Geocarto Int. 2008, 23, 451–466. [Google Scholar] [CrossRef]
- Herbreteau, V.; Salem, G.; Souris, M.; Hugot, J.-P.; Gonzalez, J.-P. Thirty Years of Use and Improvement of Remote Sensing, Applied to Epidemiology: From Early Promises to Lasting Frustration. Health Place 2007, 13, 400–403. [Google Scholar] [CrossRef] [PubMed]
- Pinzon, J.E.; Wilson, J.M.; Tucker, C.J.; Arthur, R.; Jahrling, P.B.; Formenty, P. Trigger Events: Enviroclimatic Coupling of Ebola Hemorrhagic Fever Outbreaks. Am. J. Trop. Med. Hyg. 2004, 71, 664–674. [Google Scholar] [CrossRef] [PubMed]
- Decaro, N.; Martella, V.; Saif, L.J.; Buonavoglia, C. COVID-19 from Veterinary Medicine and One Health Perspectives: What Animal Coronaviruses Have Taught Us. Res. Vet. Sci. 2020, 131, 21. [Google Scholar] [CrossRef]
- Capua, I.; Cattoli, G. One Health (r) Evolution: Learning from the Past to Build a New Future. Viruses 2018, 10, 725. [Google Scholar] [CrossRef] [Green Version]
- Capua, I. Circular Health: Empowering the One Health Revolution; EGEA Spa: Venice, Italy, 2020. [Google Scholar]
- Gras, P.; Knuth, S.; Börner, K.; Marescot, L.; Benhaiem, S.; Aue, A.; Wittstatt, U.; Kleinschmit, B.; Kramer-Schadt, S. Landscape Structures Affect Risk of Canine Distemper in Urban Wildlife. Front. Ecol. Evol. 2018, 6, 136. [Google Scholar] [CrossRef] [Green Version]
- Anderson, K.; Gaston, K.J. Lightweight Unmanned Aerial Vehicles Will Revolutionize Spatial Ecology. Front. Ecol. Environ. 2013, 11, 138–146. [Google Scholar] [CrossRef] [Green Version]
- Orusa, T.; Borgogno Mondino, E. Exploring Short-Term Climate Change Effects on Rangelands and Broad-Leaved Forests by Free Satellite Data in Aosta Valley (Northwest Italy). Climate 2021, 9, 47. [Google Scholar] [CrossRef]
- Scagliarini, A.; Dal Pozzo, F.; Gallina, L.; Vaccari, F.; Morganti, L. TaqMan Based Real Time PCR for the Quantification of Canine Distemper Virus. Vet. Res. Commun. 2007, 31, 101. [Google Scholar] [CrossRef] [PubMed]
- Eisler, D.L.; McNabb, A.; Jorgensen, D.R.; Isaac-Renton, J.L. Use of an Internal Positive Control in a Multiplex Reverse Transcription-PCR to Detect West Nile Virus RNA in Mosquito Pools. J. Clin. Microbiol. 2004, 42, 841–843. [Google Scholar] [CrossRef] [Green Version]
- Gorelick, N.; Hancher, M.; Dixon, M.; Ilyushchenko, S.; Thau, D.; Moore, R. Google Earth Engine: Planetary-Scale Geospatial Analysis for Everyone. Remote Sens. Environ. 2017, 202, 18–27. [Google Scholar] [CrossRef]
- Yin, F.; Lewis, P.E.; Gomez-Dans, J.; Wu, Q. A Sensor-Invariant Atmospheric Correction Method: Application to Sentinel-2/MSI and Landsat 8/OLI. 2019, Volume 1, p. 46. Available online: https://www.researchgate.net/publication/331107511_A_sensor-invariant_atmospheric_correction_method_application_to_Sentinel-2MSI_and_Landsat_8OLI (accessed on 14 March 2022).
- MarcYin. MarcYin/SIAC: For Doi; Zenodo: Bruxelles, Belgium, 2019. [Google Scholar]
- MarcYin. MarcYin/SIAC_GEE: To Publish the Code; Zenodo: Bruxelles, Belgium, 2019. [Google Scholar]
- Conrad, O.; Bechtel, B.; Bock, M.; Dietrich, H.; Fischer, E.; Gerlitz, L.; Wehberg, J.; Wichmann, V.; Böhner, J. System for Automated Geoscientific Analyses (SAGA) v. 2.1. 4. Geosci. Model Dev. 2015, 8, 1991–2007. [Google Scholar] [CrossRef] [Green Version]
- QGIS Development Team; QGIS Geographic Information System. Open Source Geospatial Foundation Project; Open Source Geospatial Foundation: Chicago, IL, USA, 2018. [Google Scholar]
- Carlson, T.N.; Ripley, D.A. On the Relation between NDVI, Fractional Vegetation Cover, and Leaf Area Index. Remote Sens. Environ. 1997, 62, 241–252. [Google Scholar] [CrossRef]
- Grizonnet, M.; Michel, J.; Poughon, V.; Inglada, J.; Savinaud, M.; Cresson, R. Orfeo ToolBox: Open Source Processing of Remote Sensing Images. Open Geospat. Data Softw. Stand. 2017, 2, 15. [Google Scholar] [CrossRef] [Green Version]
- McInerney, D.; Kempeneers, P. Orfeo Toolbox. In Open Source Geospatial Tools; Springer: Berlin/Heidelberg, Germany, 2015; pp. 199–217. [Google Scholar]
- De Marinis, P.; De Petris, S.; Sarvia, F.; Manfron, G.; Momo, E.J.; Orusa, T.; Corvino, G.; Sali, G.; Borgogno, E.M. Supporting Pro-Poor Reforms of Agricultural Systems in Eastern DRC (Africa) with Remotely Sensed Data: A Possible Contribution of Spatial Entropy to Interpret Land Management Practices. Land 2021, 10, 1368. [Google Scholar] [CrossRef]
- Qian, S.S. Environmental and Ecological Statistics with R; Chapman and Hall/CRC: Boston, MA, USA, 2016. [Google Scholar]
- Ramachandran, K.M.; Tsokos, C.P. Mathematical Statistics with Applications in R; Academic Press: Cambridge, MA, USA, 2020. [Google Scholar]
- Wikle, C.K.; Zammit-Mangion, A.; Cressie, N. Spatio-Temporal Statistics with R; Chapman and Hall/CRC: Boston, MA, USA, 2019. [Google Scholar]
- Hammer, Ø.; Harper, D.; Ryan, P. PAST-Palaeontological Statistics. Palaeontol. Electron. 2001, 4, 1–9. [Google Scholar]
- Hammer, Ø. PAST PAleontological STatistics Version 2.17 Reference Manual; Natural History Museum, University of Oslo: Oslo, Norway, 2012. [Google Scholar]
- Acosta-Jamett, G.; Surot, D.; Cortés, M.; Marambio, V.; Valenzuela, C.; Vallverdu, A.; Ward, M. Epidemiology of Canine Distemper and Canine Parvovirus in Domestic Dogs in Urban and Rural Areas of the Araucanía Region in Chile. Vet. Microbiol. 2015, 178, 260–264. [Google Scholar] [CrossRef] [PubMed]
- Martinez-Gutierrez, M.; Ruiz-Saenz, J. Diversity of Susceptible Hosts in Canine Distemper Virus Infection: A Systematic Review and Data Synthesis. BMC Vet. Res. 2016, 12, 78. [Google Scholar] [CrossRef] [PubMed] [Green Version]
- Muenchow, J.; Schratz, P.; Brenning, A. RQGIS: Integrating R with QGIS for Statistical Geocomputing. R J. 2017, 9, 409–428. [Google Scholar] [CrossRef]
- Lin, L.; Hao, Z.; Post, C.J.; Mikhailova, E.A.; Yu, K.; Yang, L.; Liu, J. Monitoring Land Cover Change on a Rapidly Urbanizing Island Using Google Earth Engine. Appl. Sci. 2020, 10, 7336. [Google Scholar] [CrossRef]


| Sentinel-2 Bands (B*) | Central Wavelength (nm) | Bandwidth (nm) | Geometric Resolution (m) |
|---|---|---|---|
| B1–Coastal aerosol | 442.7 | 21 | 60 |
| B2–Blue | 492.4 | 66 | 10 |
| B3–Green | 559.8 | 36 | 10 |
| B4–Red | 664.6 | 31 | 10 |
| B5–Vegetation red edge | 704.1 | 15 | 20 |
| B6–Vegetation red edge | 740.5 | 15 | 20 |
| B7–Vegetation red edge | 782.8 | 20 | 20 |
| B8–NIR | 832.8 | 106 | 10 |
| B8A–Narrow NIR | 864.7 | 21 | 20 |
| B9–Water vapor | 945.1 | 20 | 60 |
| B10–SWIR–Cirrus | 1373.5 | 31 | 60 |
| B11–SWIR | 1613.7 | 91 | 20 |
| B12–SWIR | 2202.4 | 175 | 20 |
| Animal Species | CDV Prevalence (%) | Number of Samples Analyzed | Positive for CDV |
|---|---|---|---|
| red fox | 58 | 281 | 164 |
| wolf | 37.5 | 18 | 3 |
| beech marten | 51 | 47 | 24 |
| badger | 47.5 | 101 | 48 |
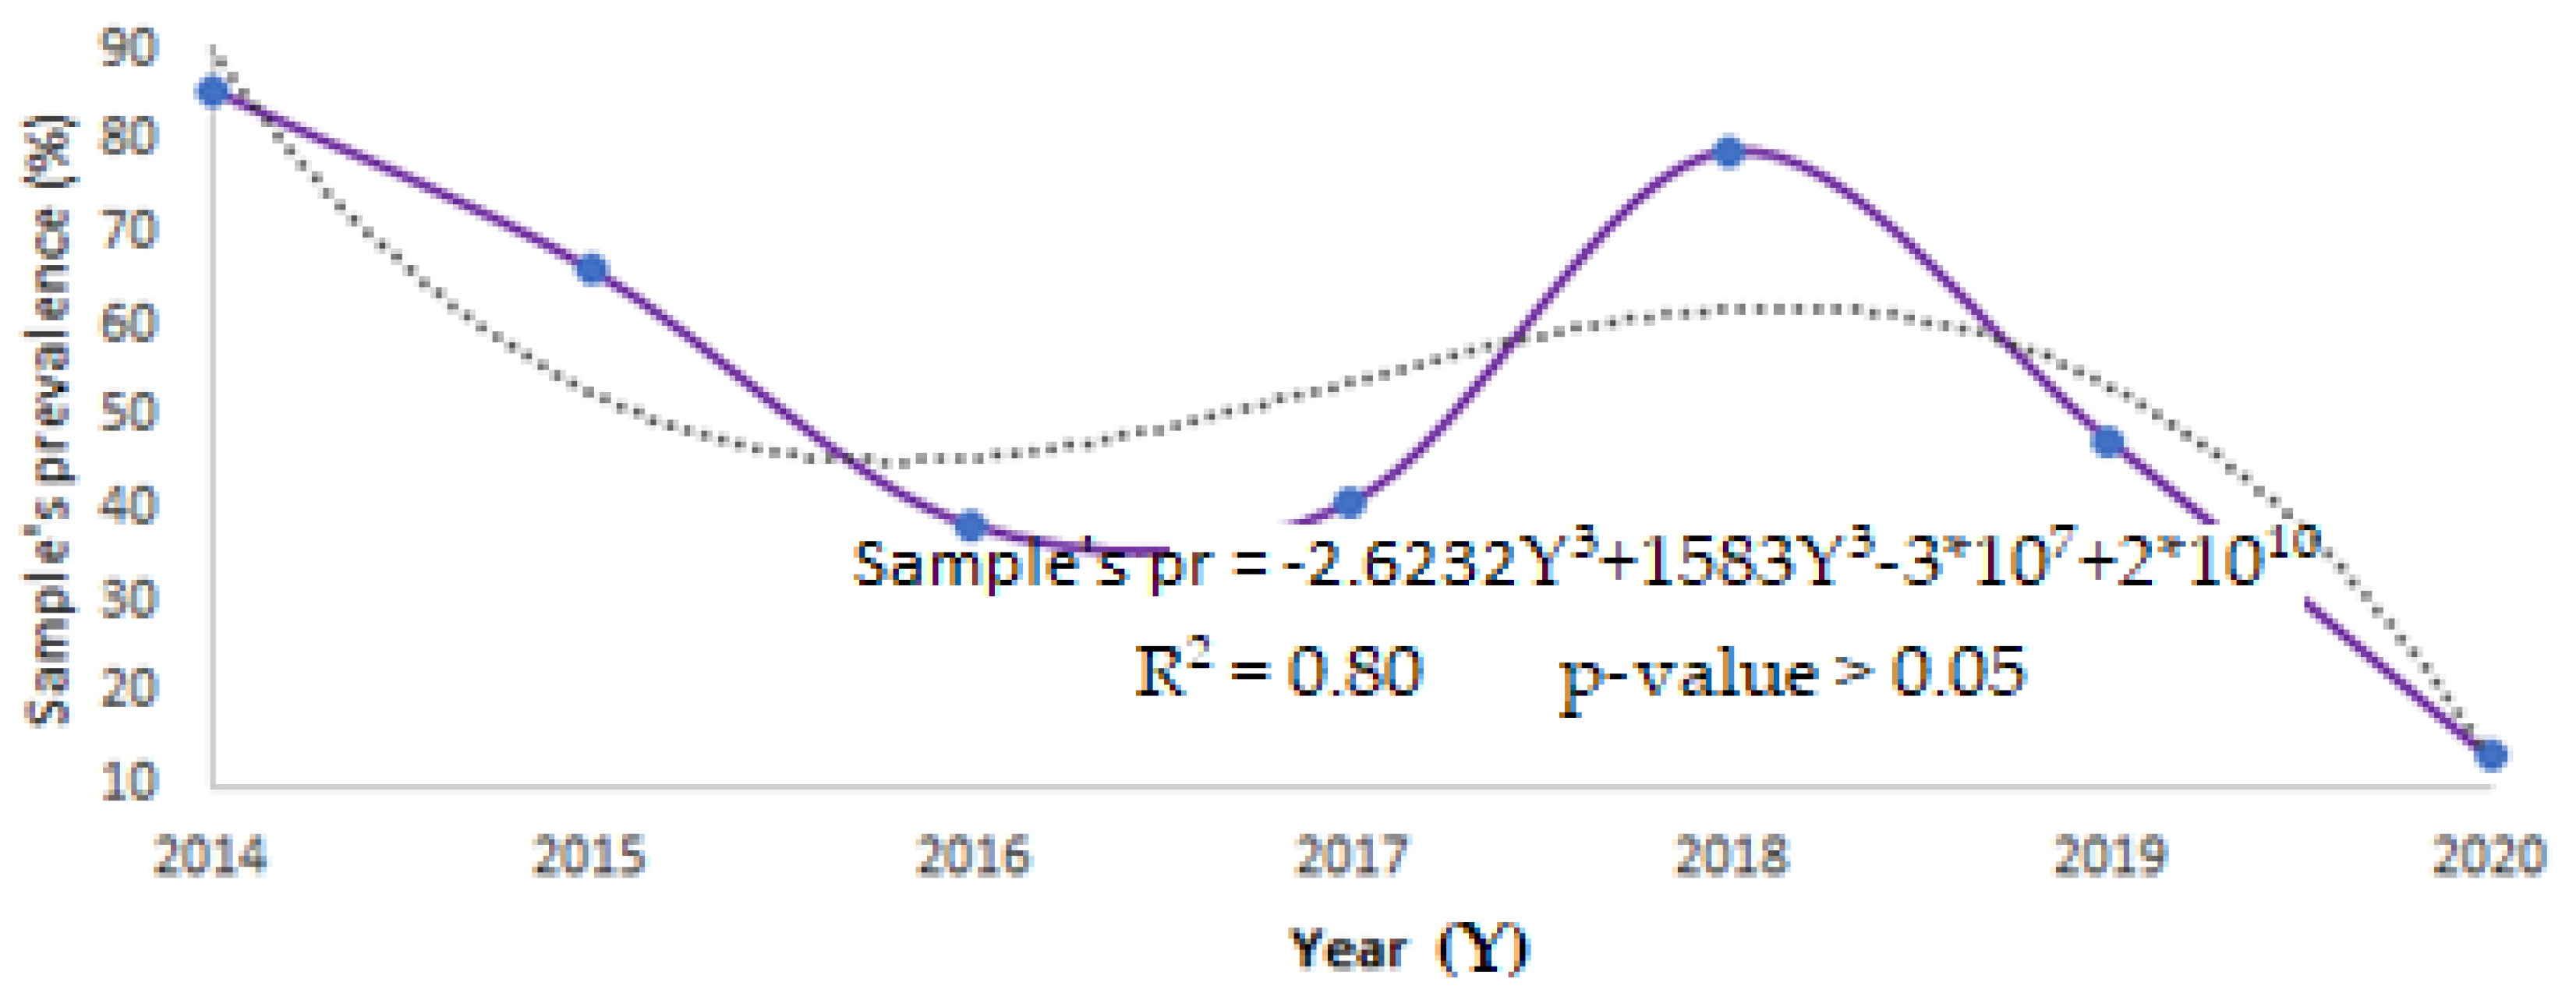
| Year | CDV Prevalence (%) |
|---|---|
| 2014 | 85.7 |
| 2015 | 66.2 |
| 2016 | 38.5 |
| 2017 | 40.8 |
| 2018 | 79.0 |
| 2019 | 47.5 |
| 2020 | 13.2 |
Publisher’s Note: MDPI stays neutral with regard to jurisdictional claims in published maps and institutional affiliations. |
© 2022 by the authors. Licensee MDPI, Basel, Switzerland. This article is an open access article distributed under the terms and conditions of the Creative Commons Attribution (CC BY) license (https://creativecommons.org/licenses/by/4.0/).
Share and Cite
Carella, E.; Orusa, T.; Viani, A.; Meloni, D.; Borgogno-Mondino, E.; Orusa, R. An Integrated, Tentative Remote-Sensing Approach Based on NDVI Entropy to Model Canine Distemper Virus in Wildlife and to Prompt Science-Based Management Policies. Animals 2022, 12, 1049. https://doi.org/10.3390/ani12081049
Carella E, Orusa T, Viani A, Meloni D, Borgogno-Mondino E, Orusa R. An Integrated, Tentative Remote-Sensing Approach Based on NDVI Entropy to Model Canine Distemper Virus in Wildlife and to Prompt Science-Based Management Policies. Animals. 2022; 12(8):1049. https://doi.org/10.3390/ani12081049
Chicago/Turabian StyleCarella, Emanuele, Tommaso Orusa, Annalisa Viani, Daniela Meloni, Enrico Borgogno-Mondino, and Riccardo Orusa. 2022. "An Integrated, Tentative Remote-Sensing Approach Based on NDVI Entropy to Model Canine Distemper Virus in Wildlife and to Prompt Science-Based Management Policies" Animals 12, no. 8: 1049. https://doi.org/10.3390/ani12081049