

Cage-Free Pullets Minimally Affected by Stocking Density Stressors

 , , , , and
Abstract
:Simple Summary
Abstract
1. Introduction
2. Materials and Methods
2.1. Study Design and Housing
2.2. Bird Condition and Welfare Assessment
2.3. Organ Collection
2.4. Blood Collection and Analysis
2.5. Statistical Analysis
3. Results
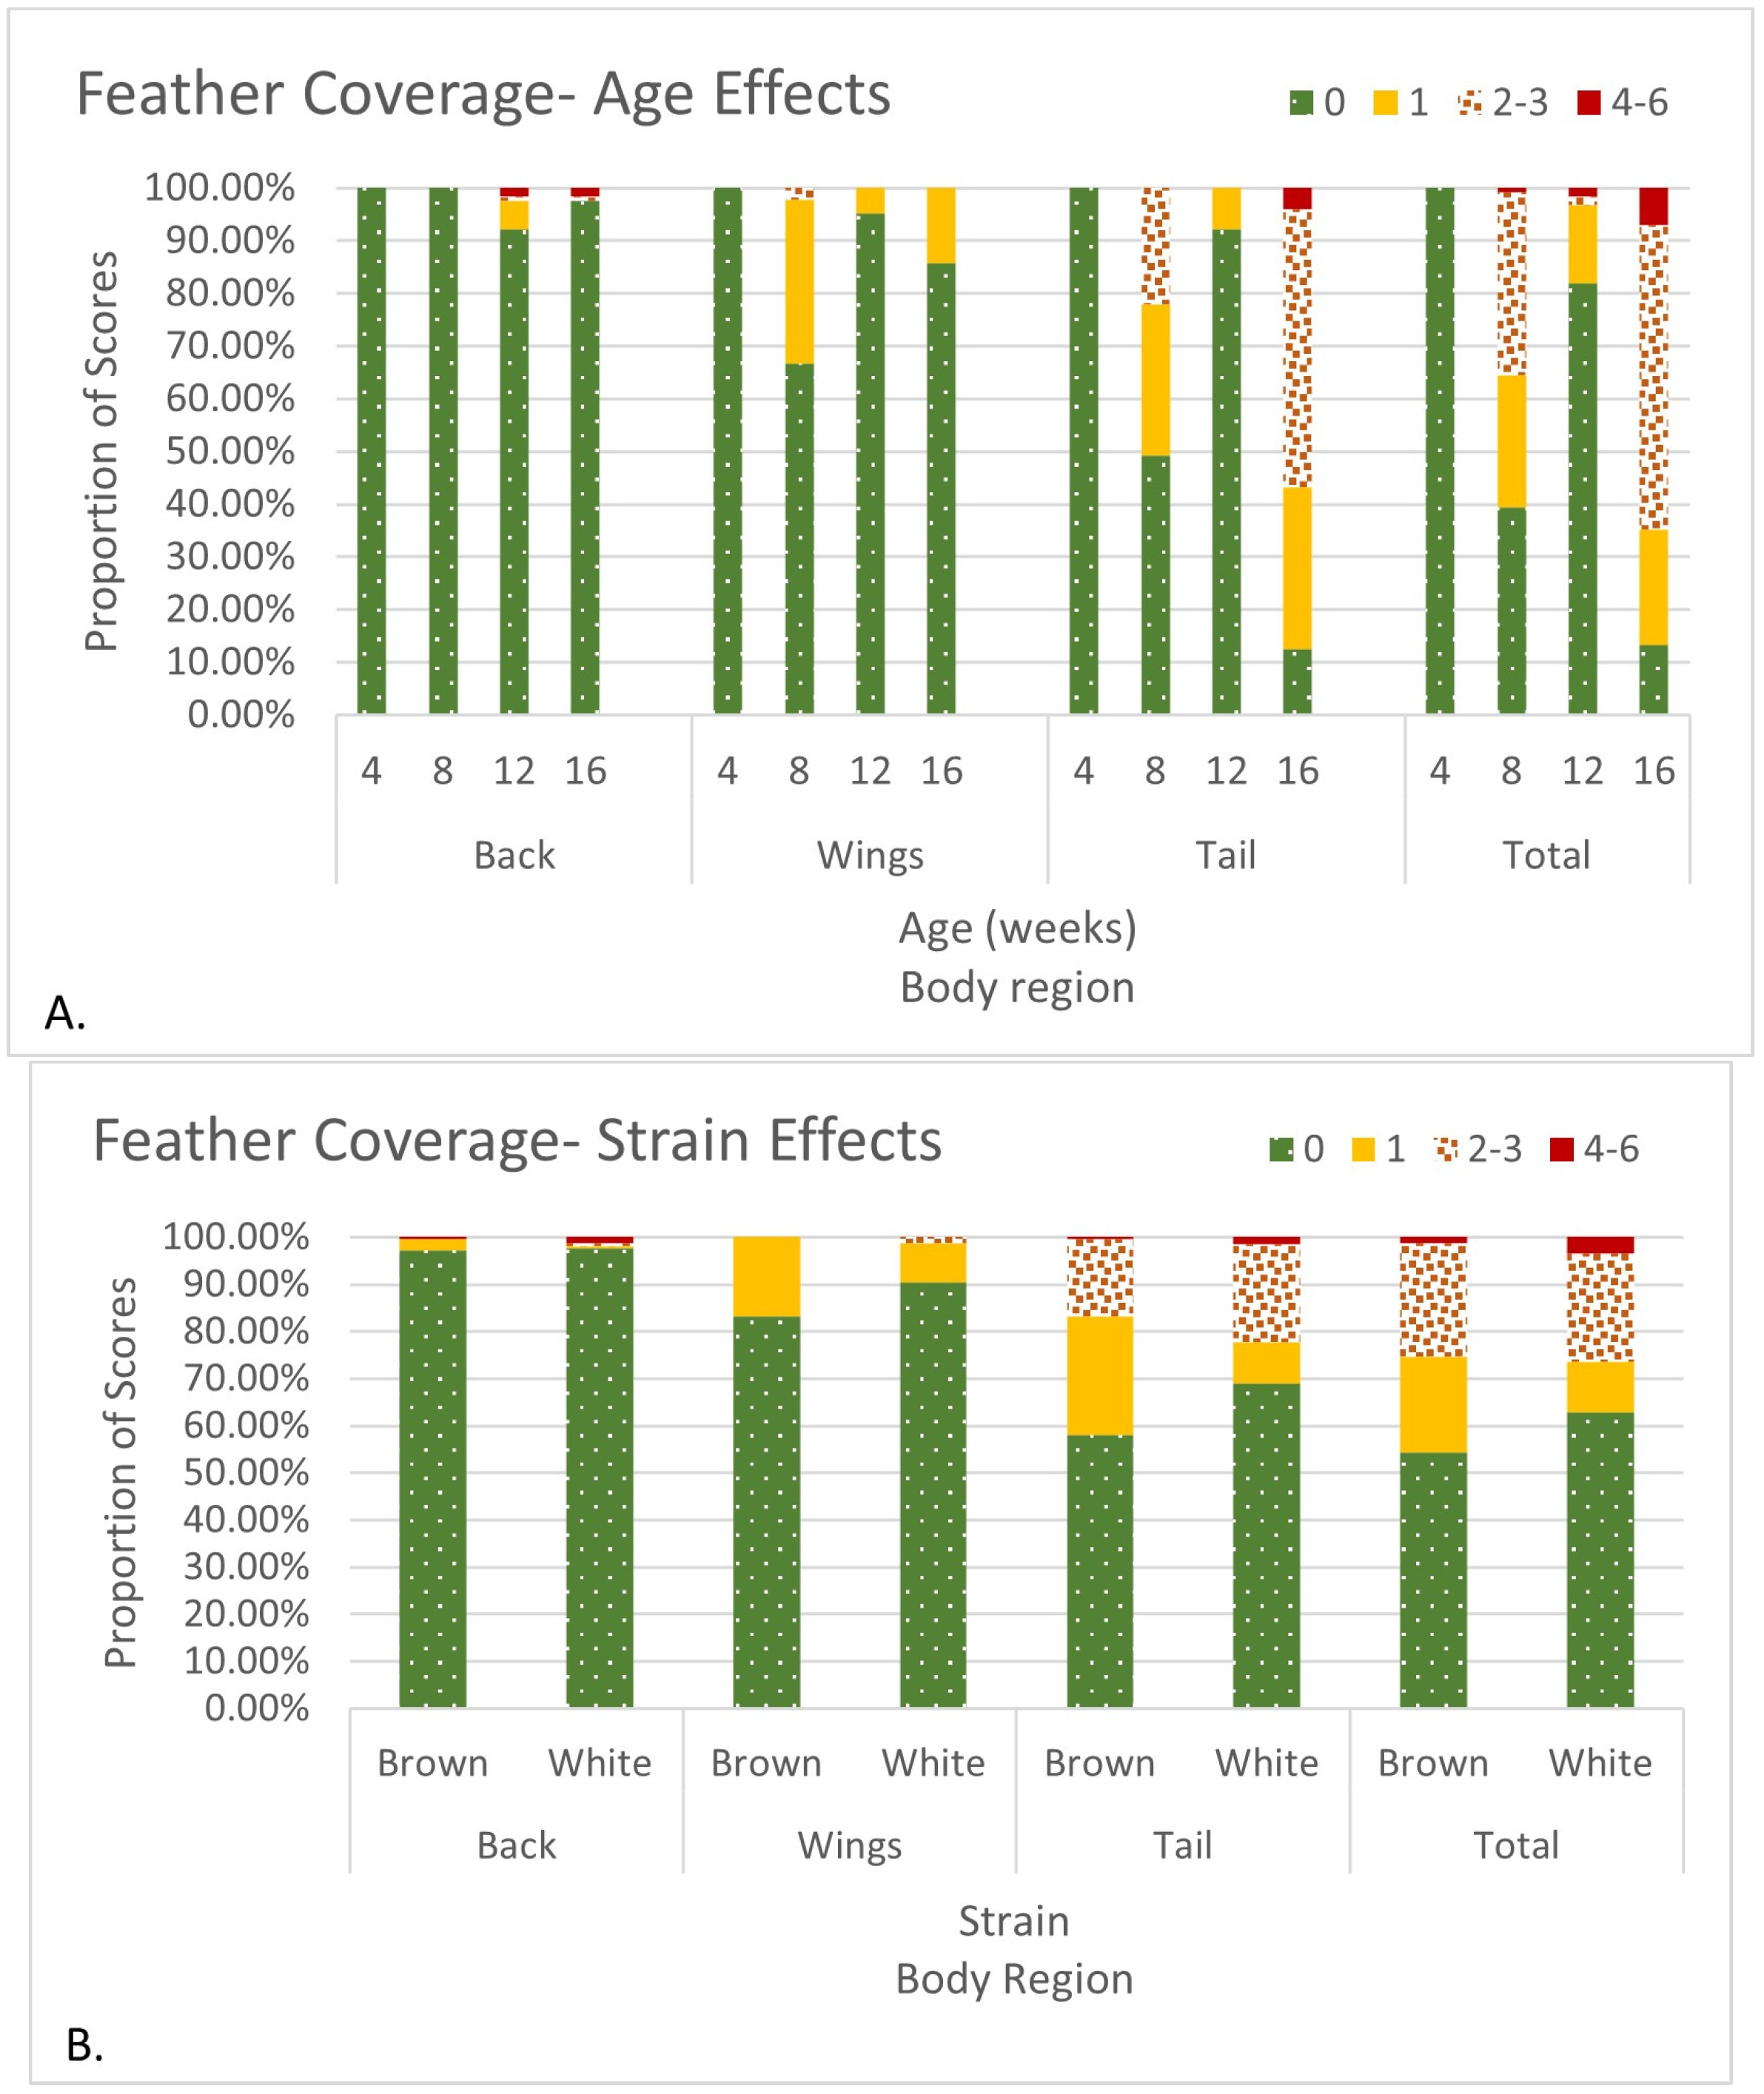
3.1. Bird Condition
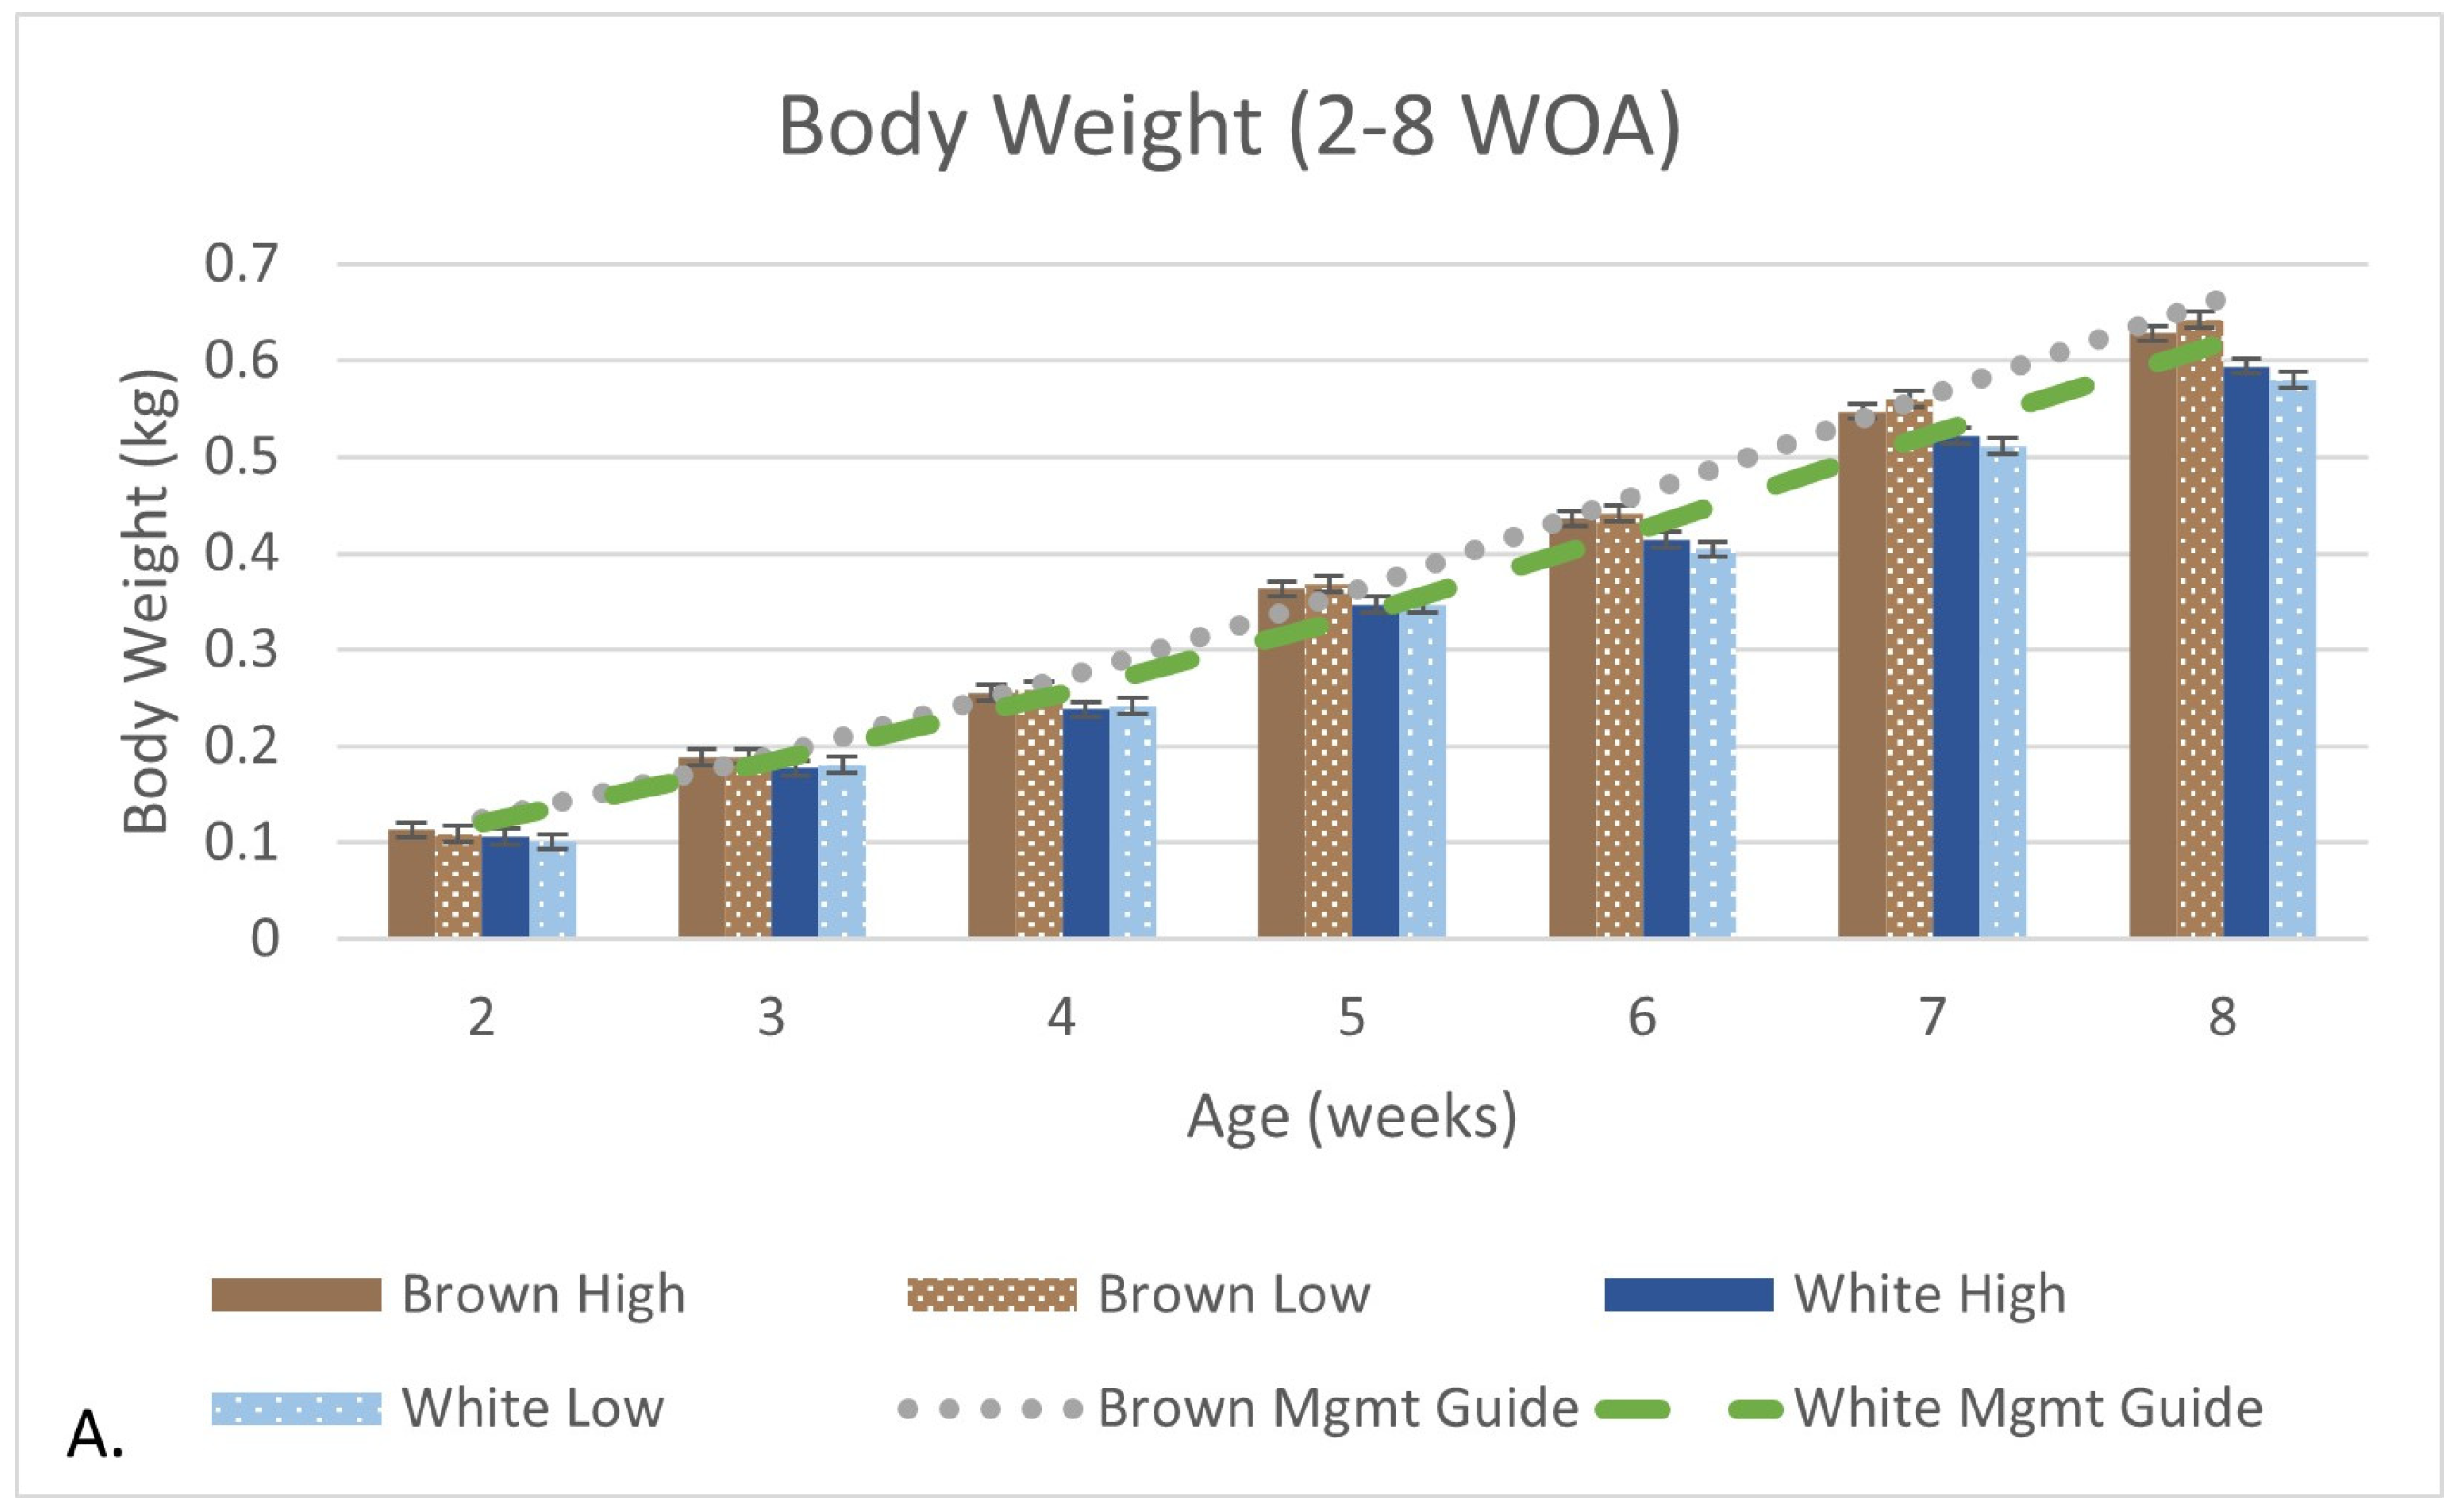
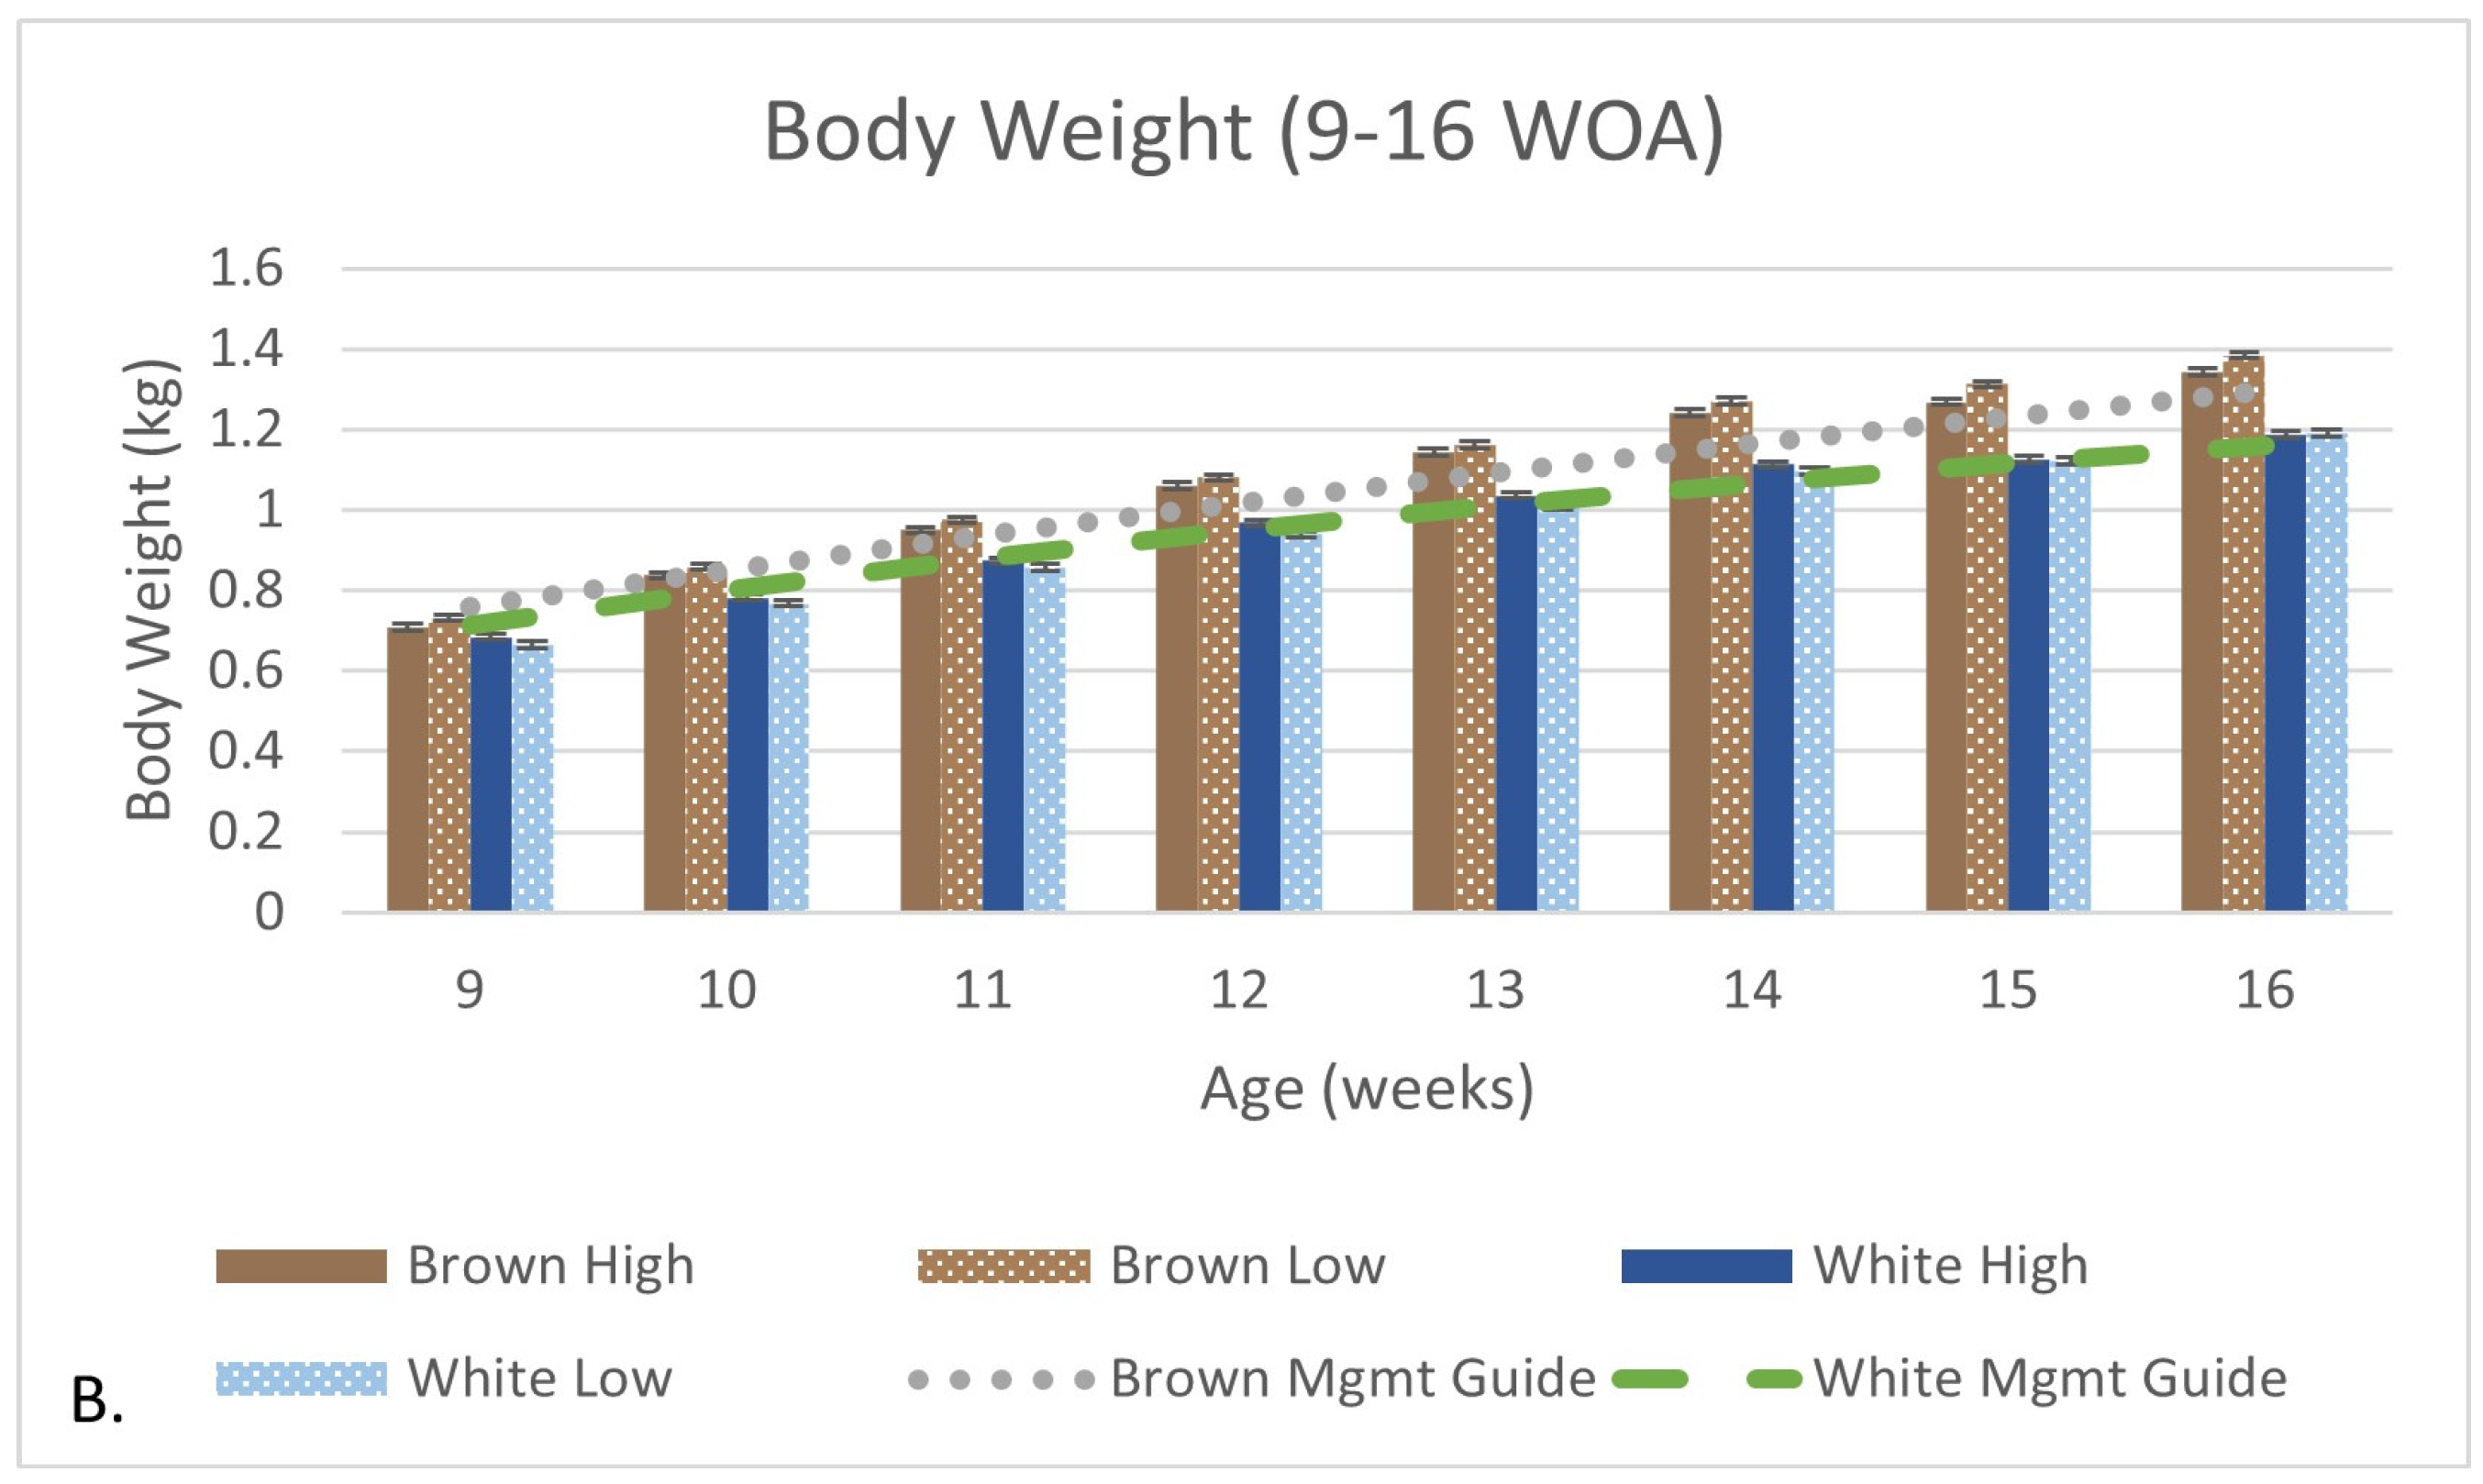
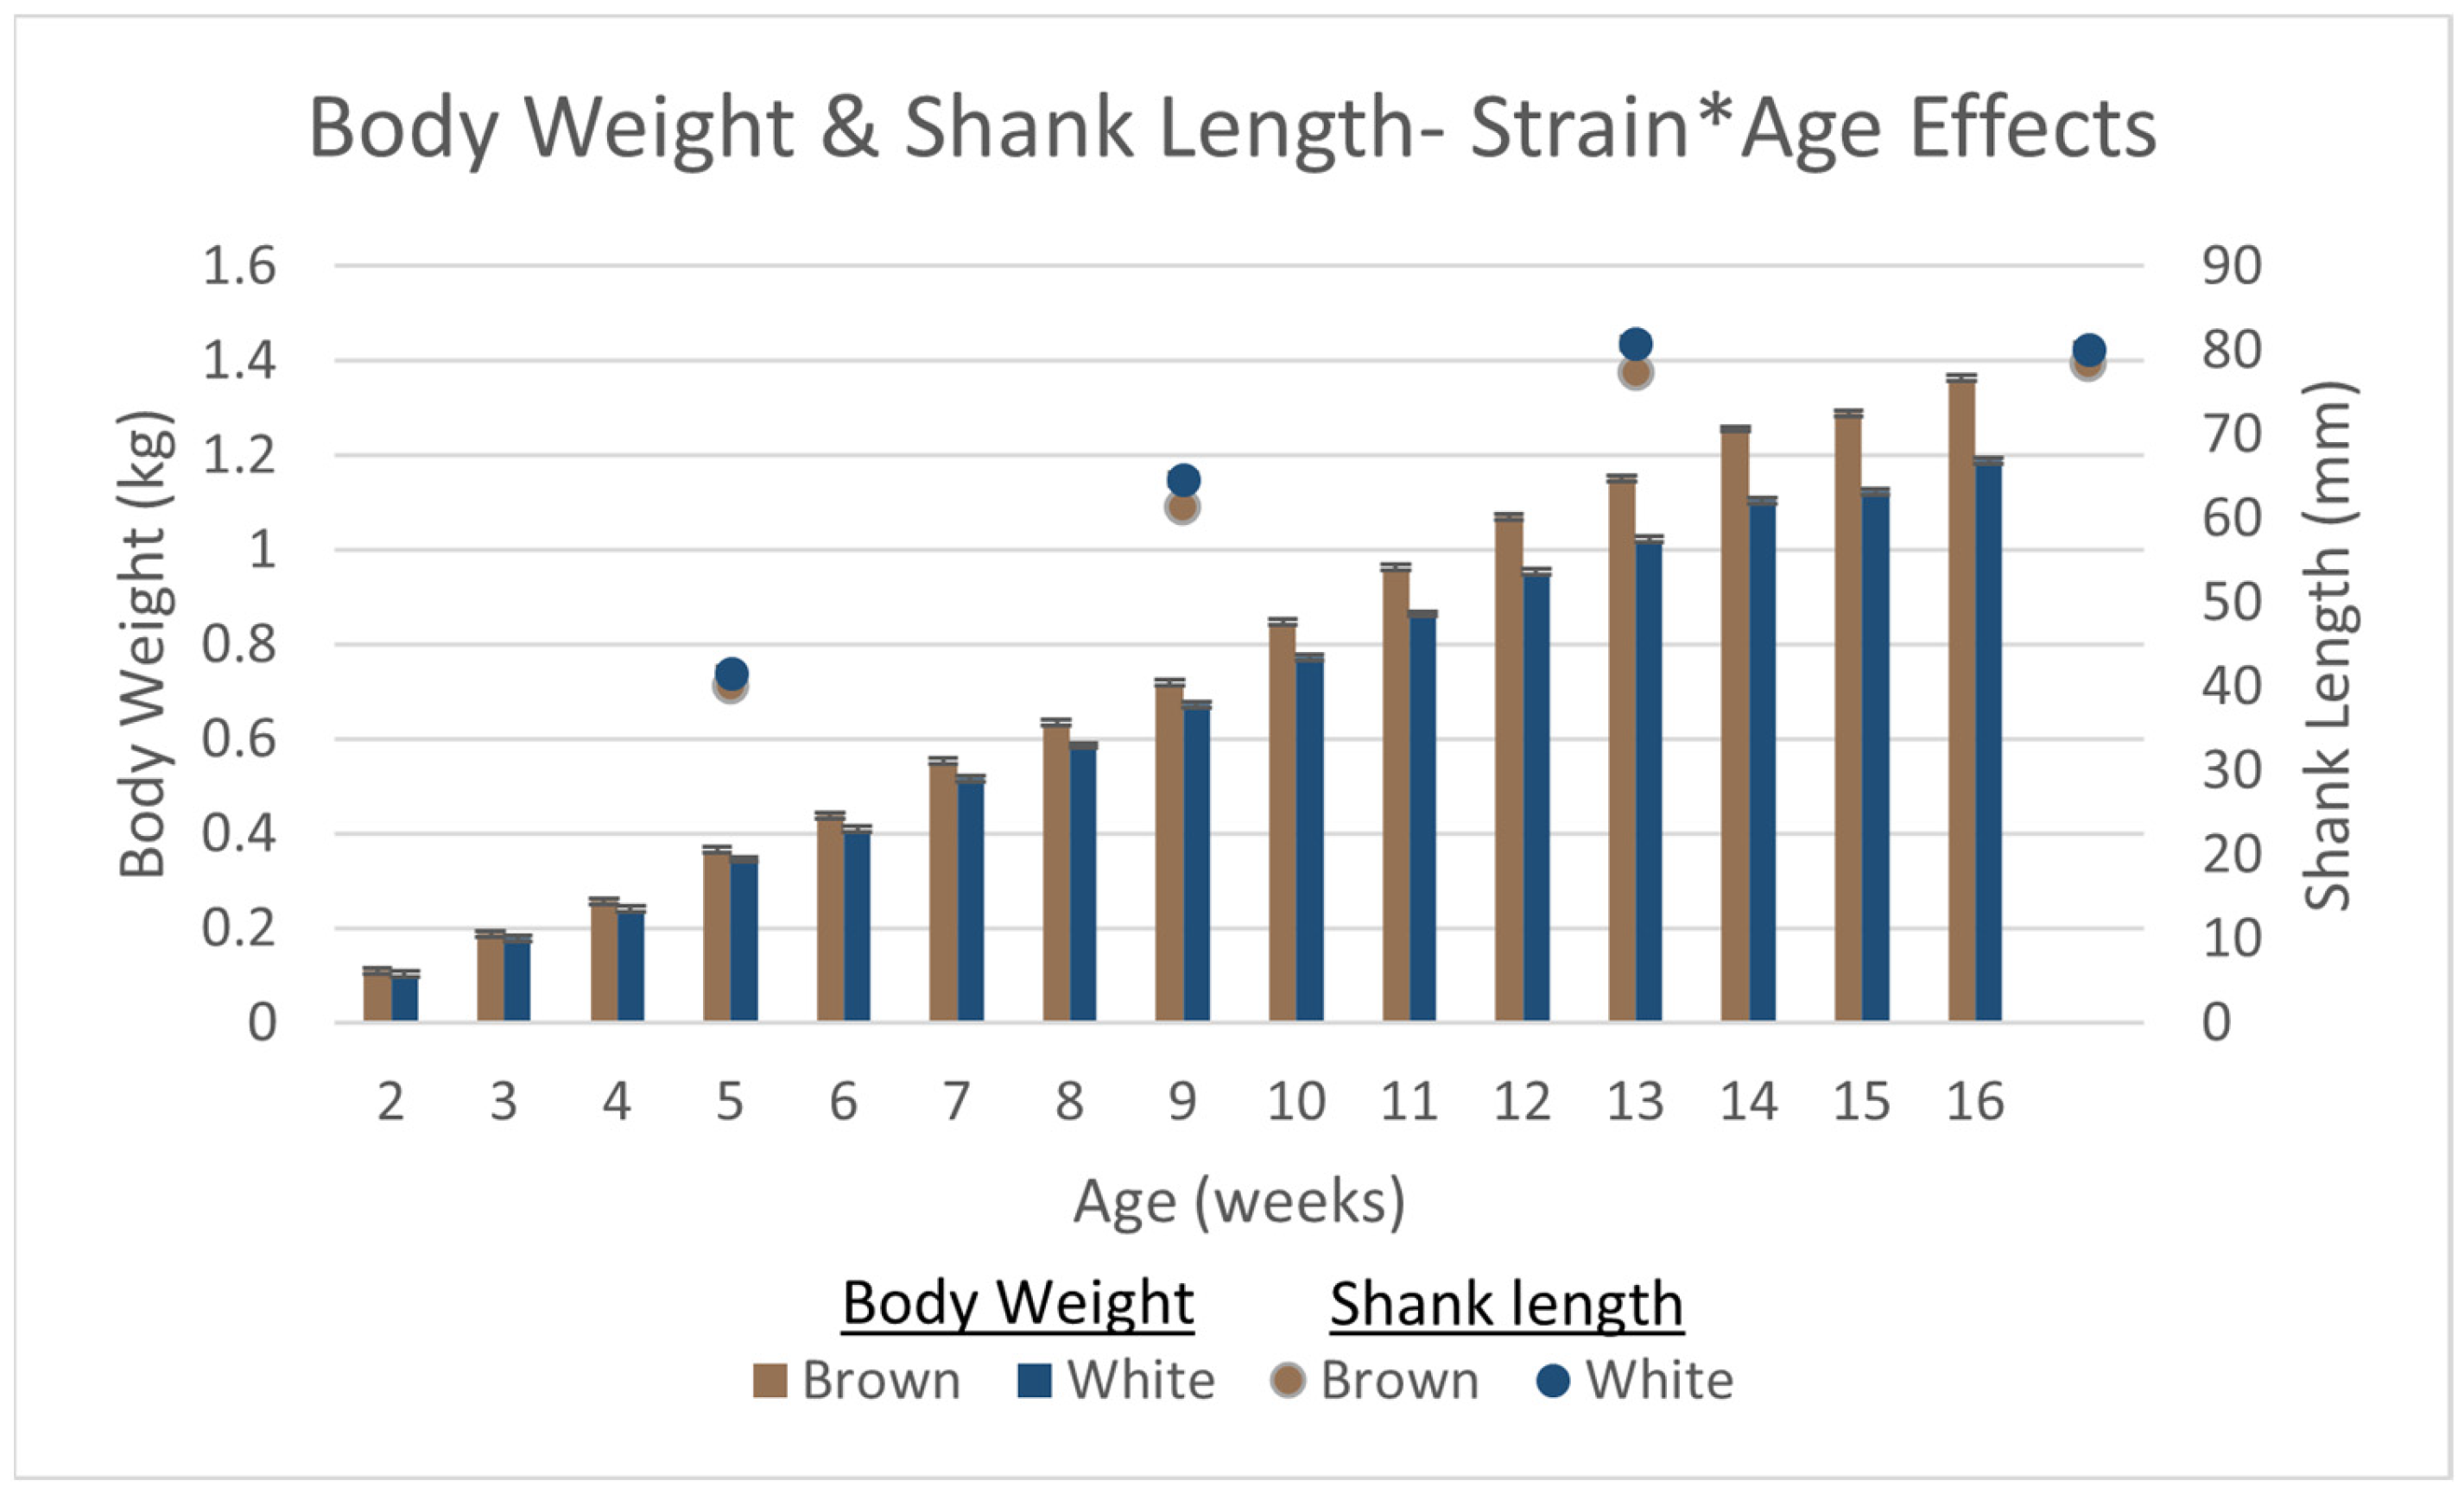
3.2. Production and Growth Parameters
3.3. Blood Parameters
3.3.1. Differential WBC Count
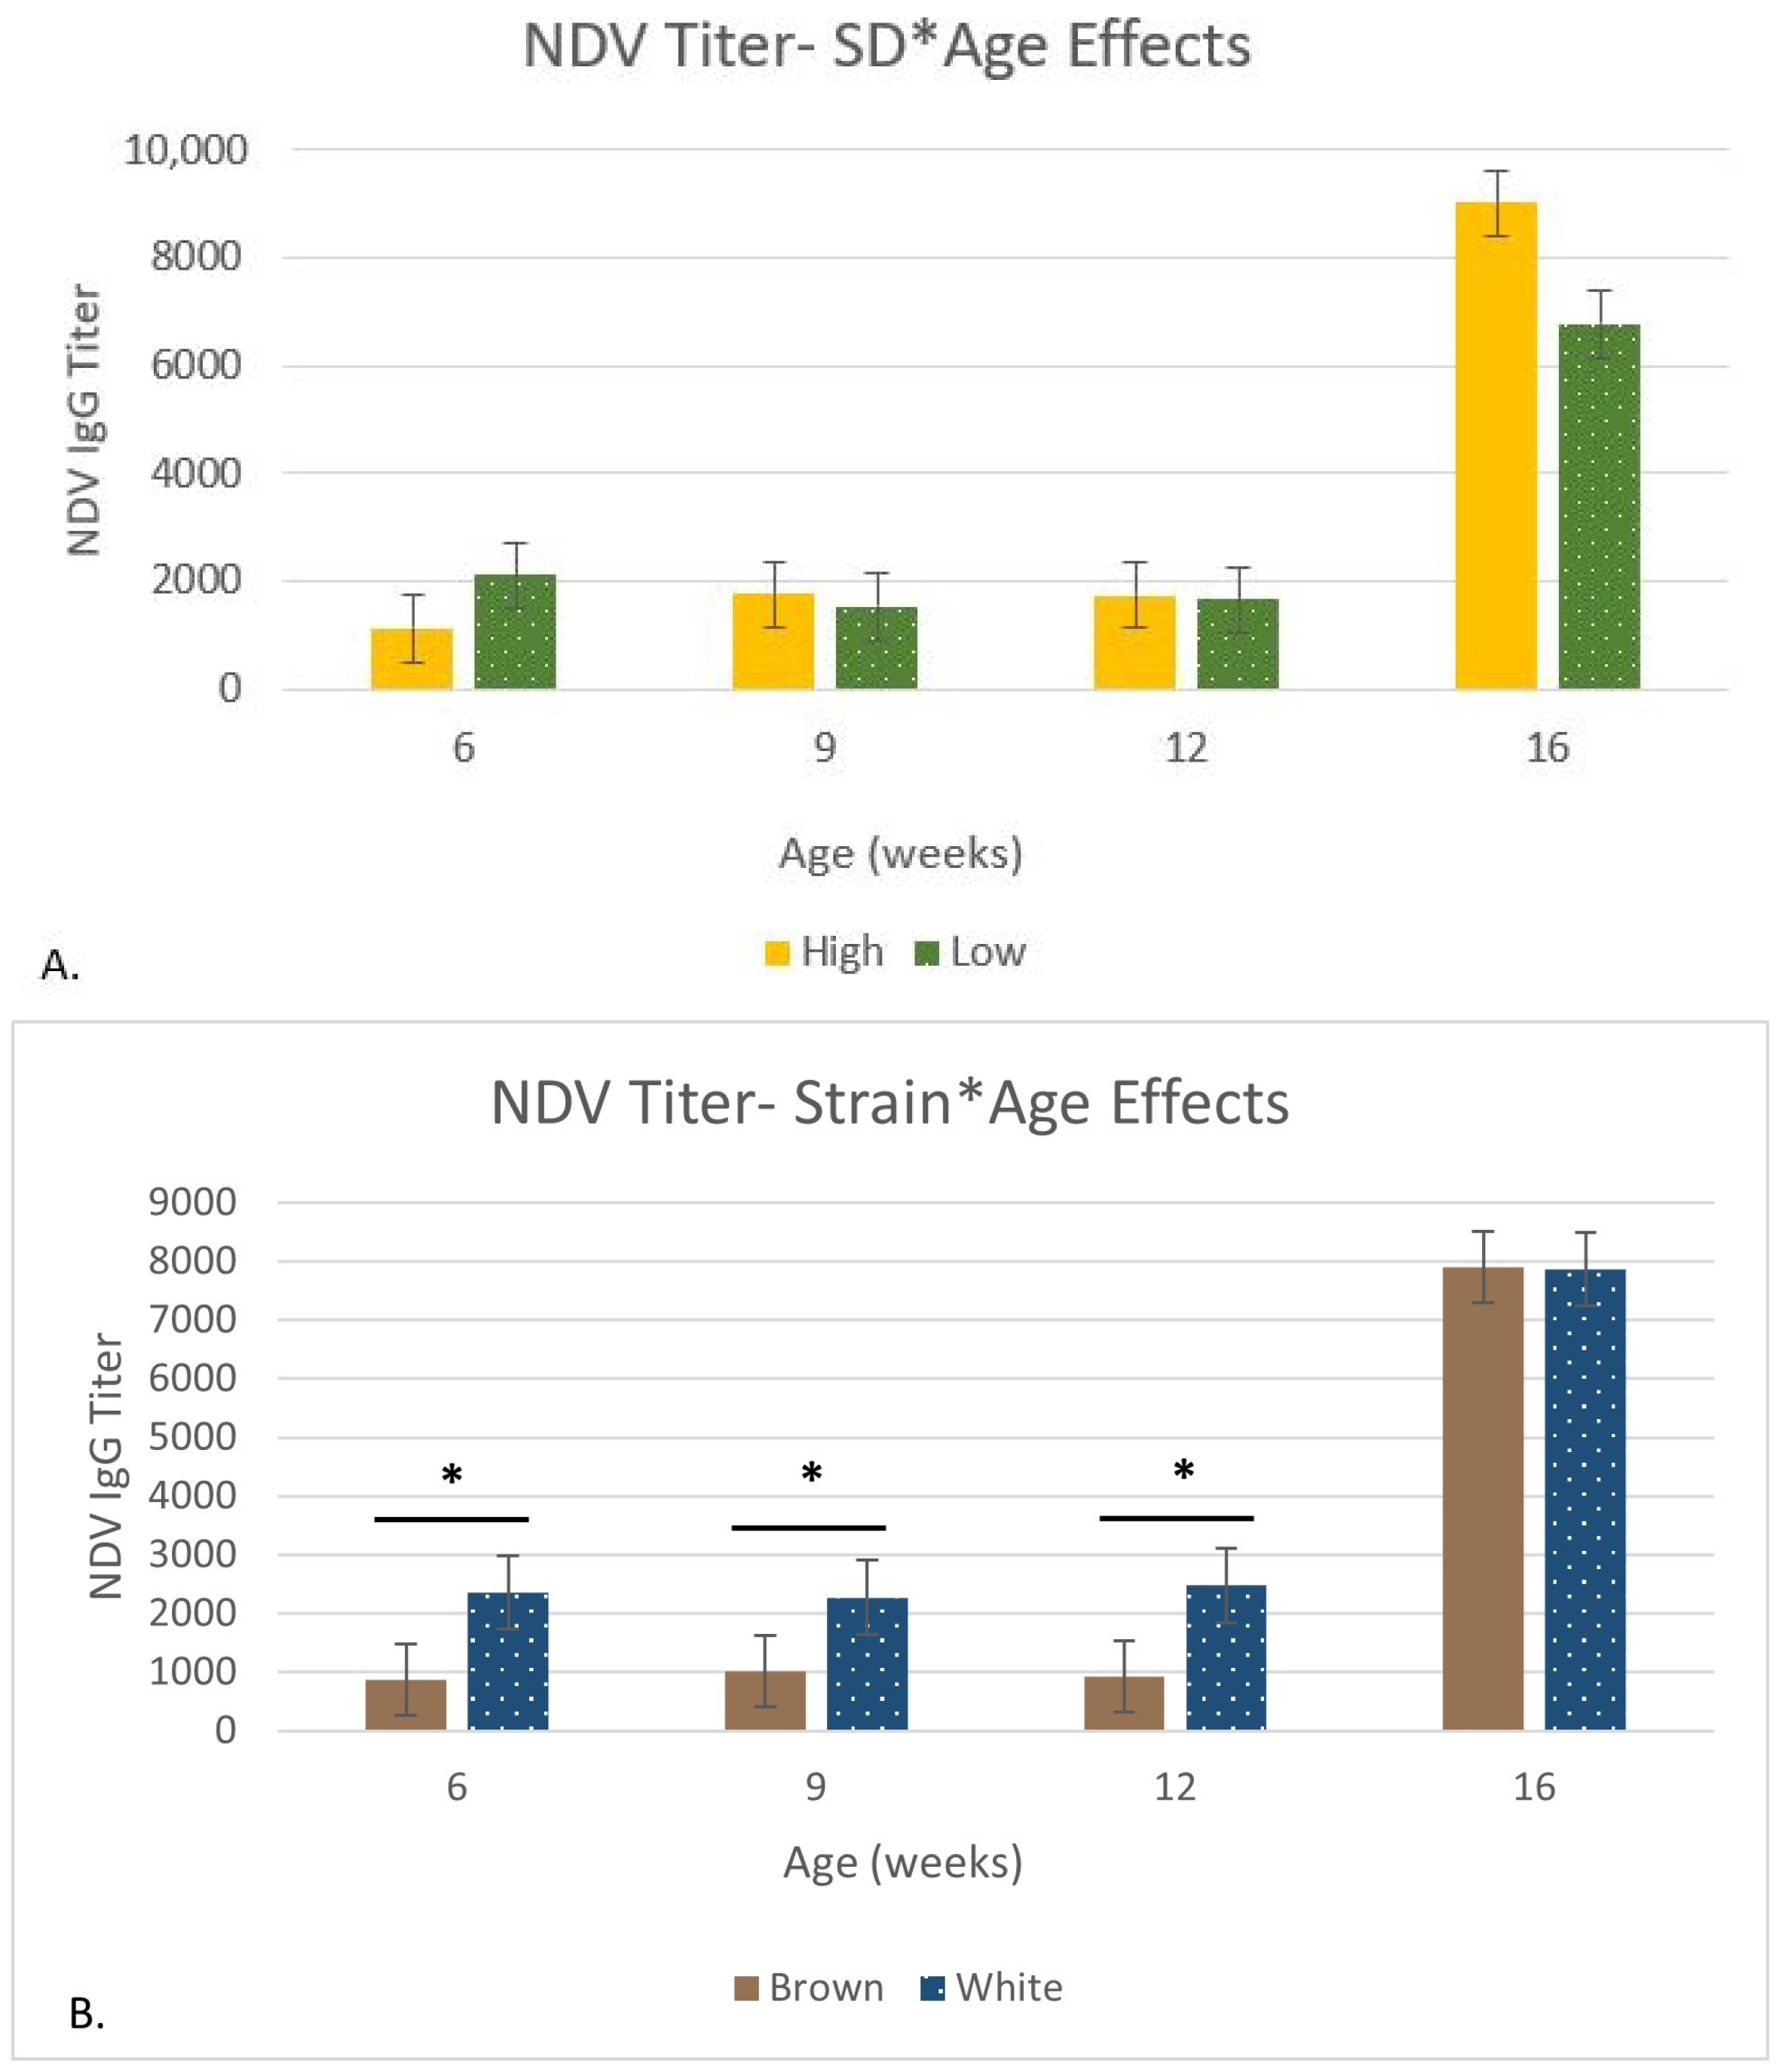
3.3.2. H:L Ratio, Corticosterone, and Cortisol
3.4. Metabolic Changes
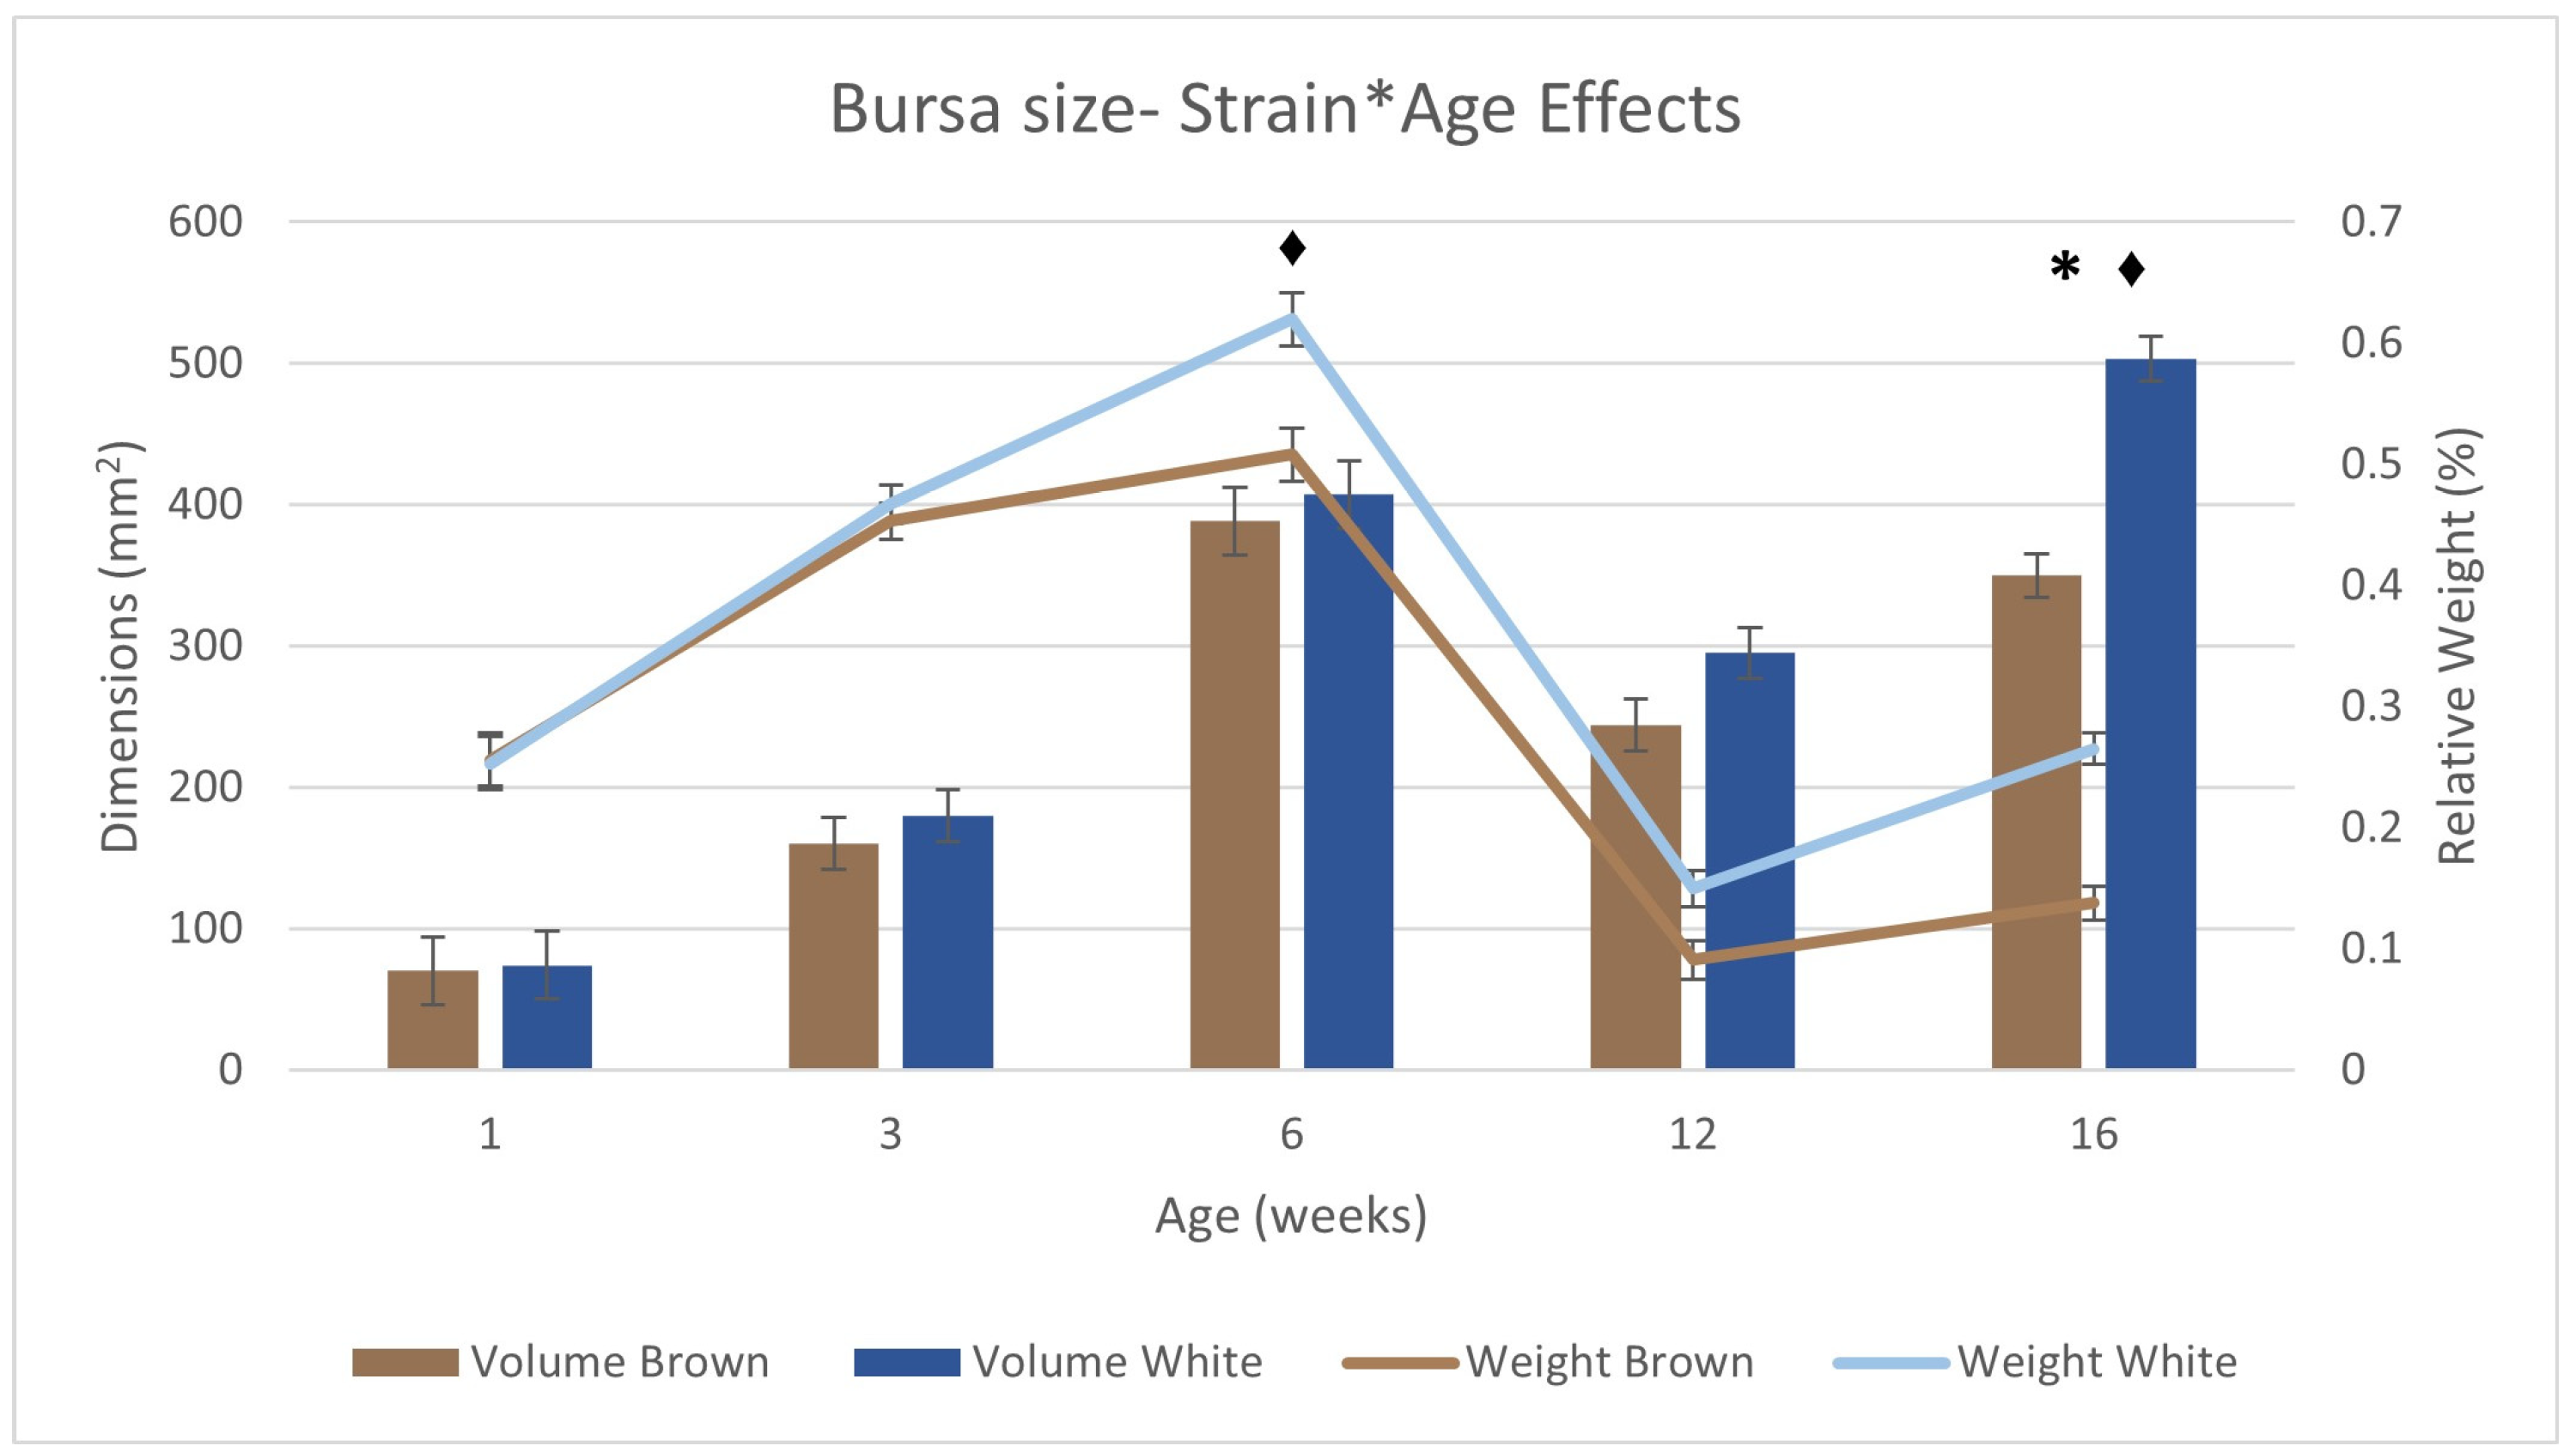
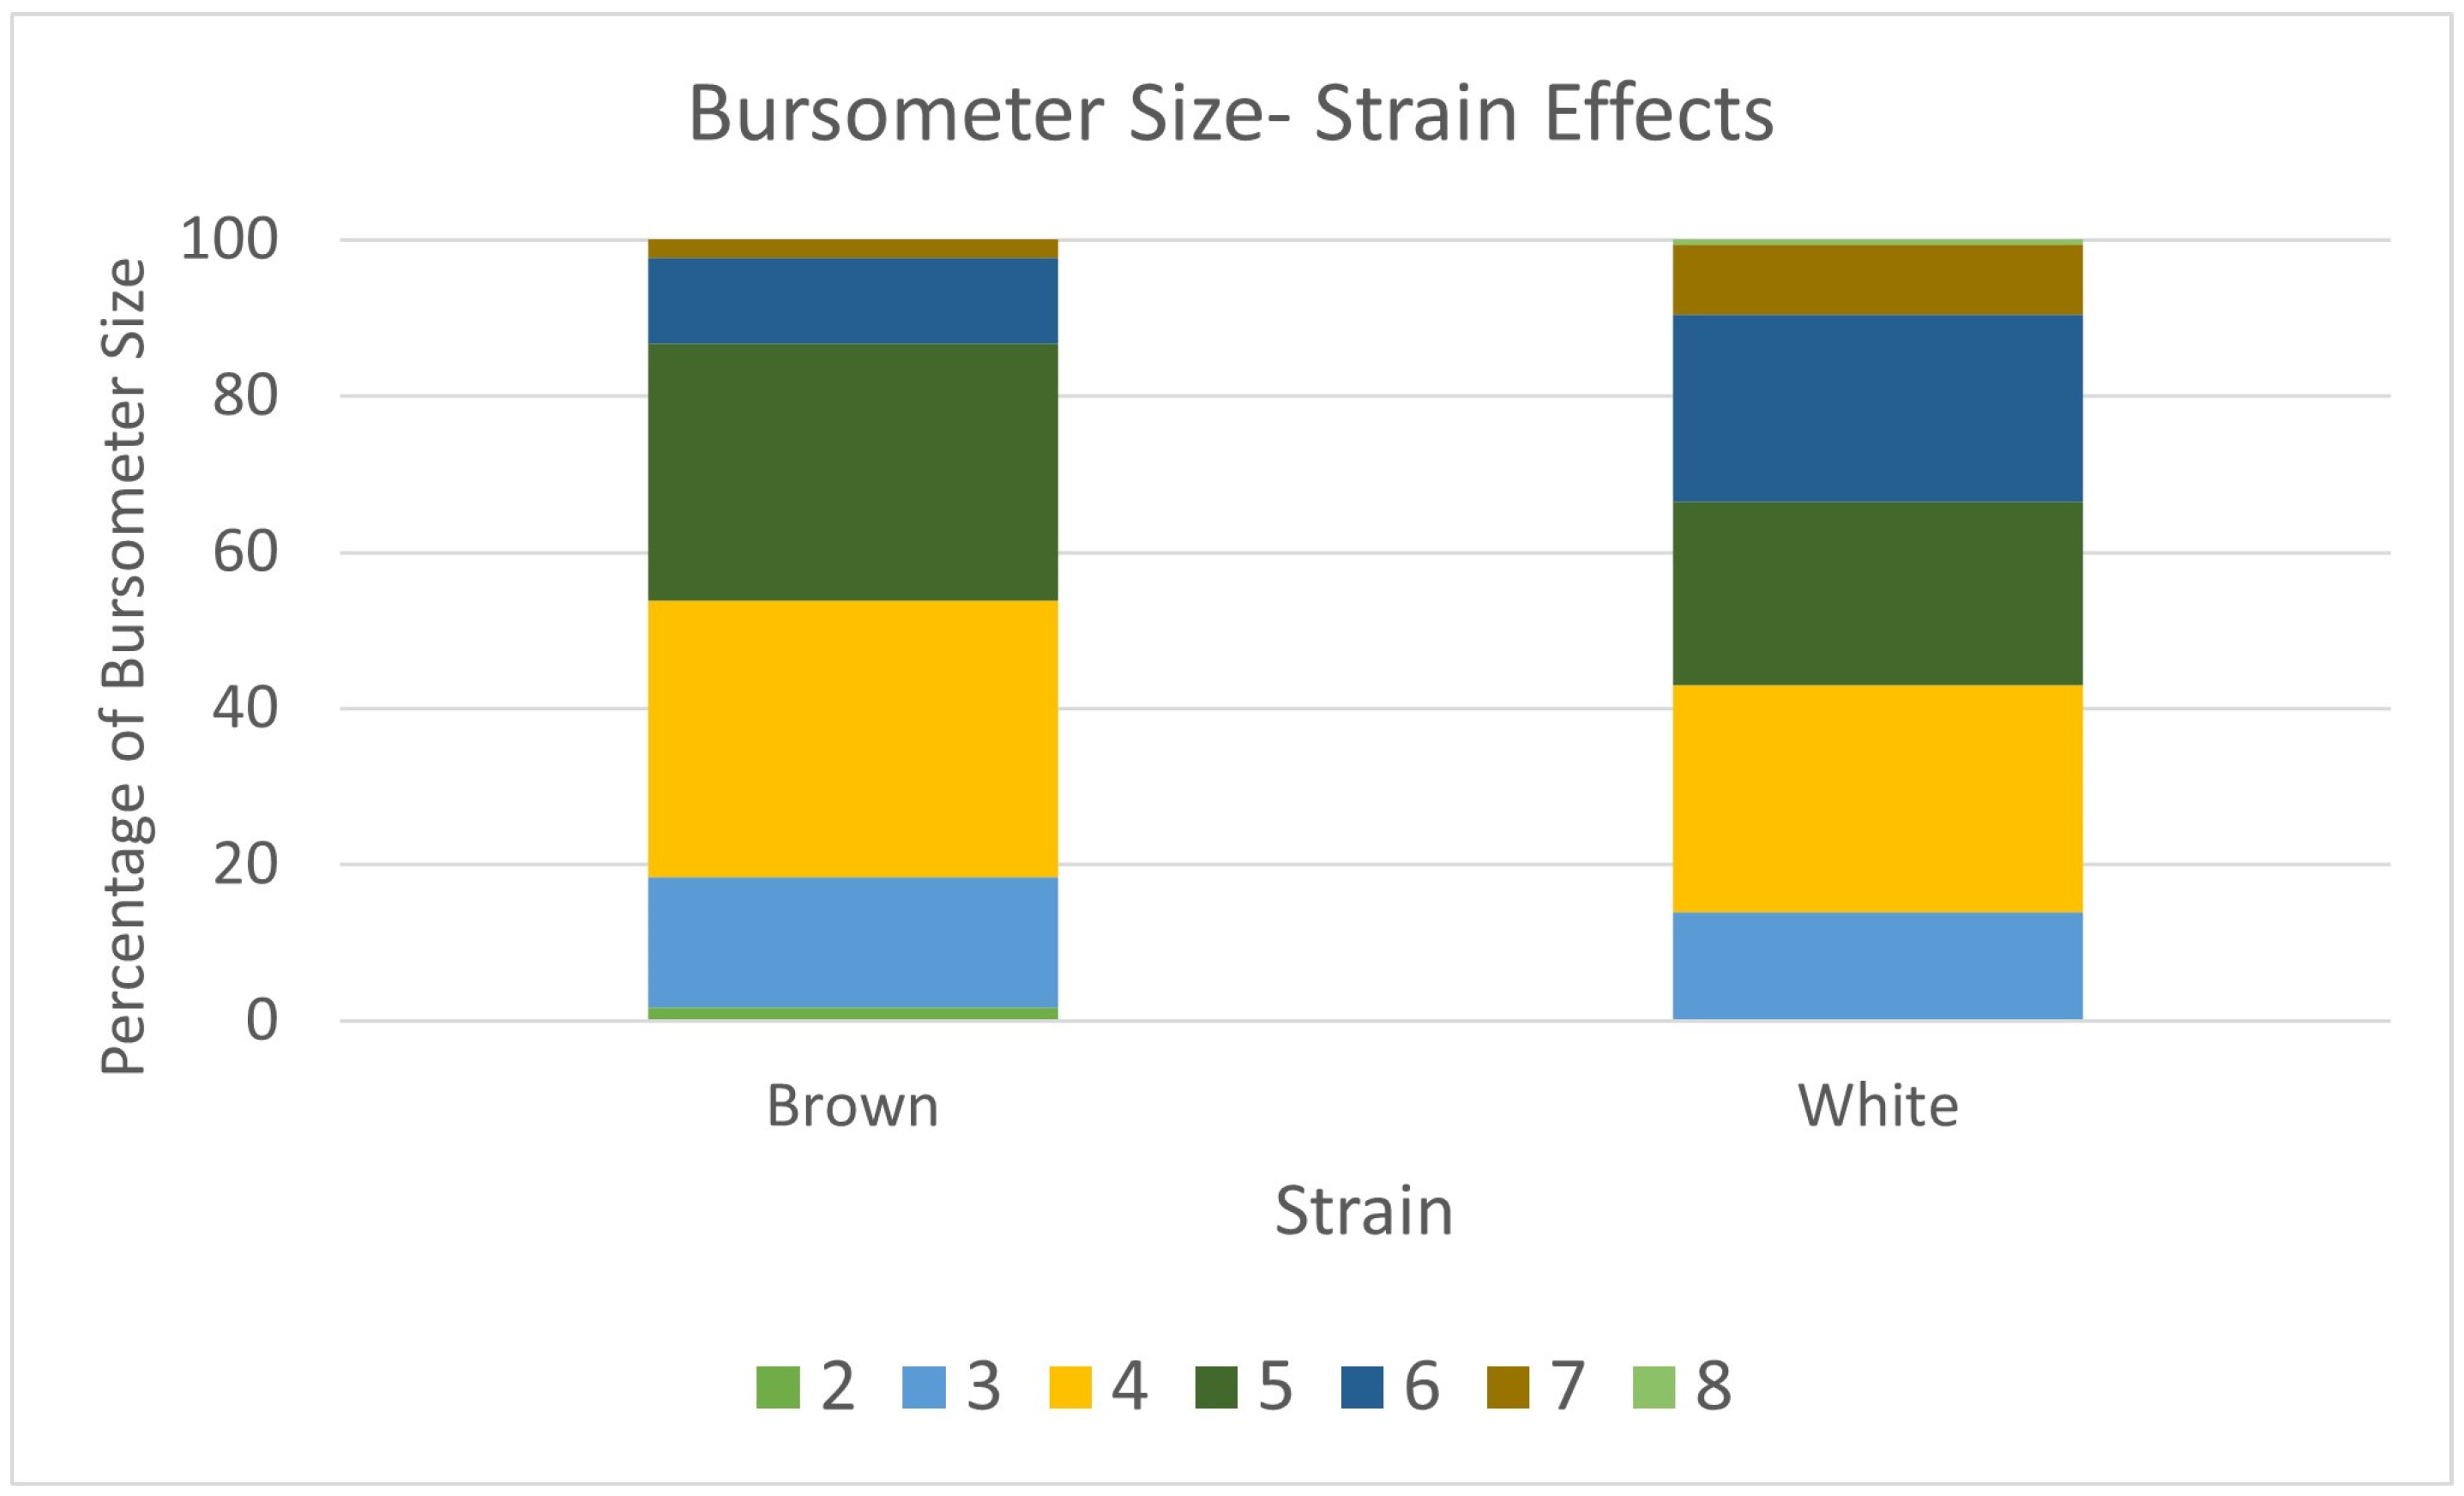
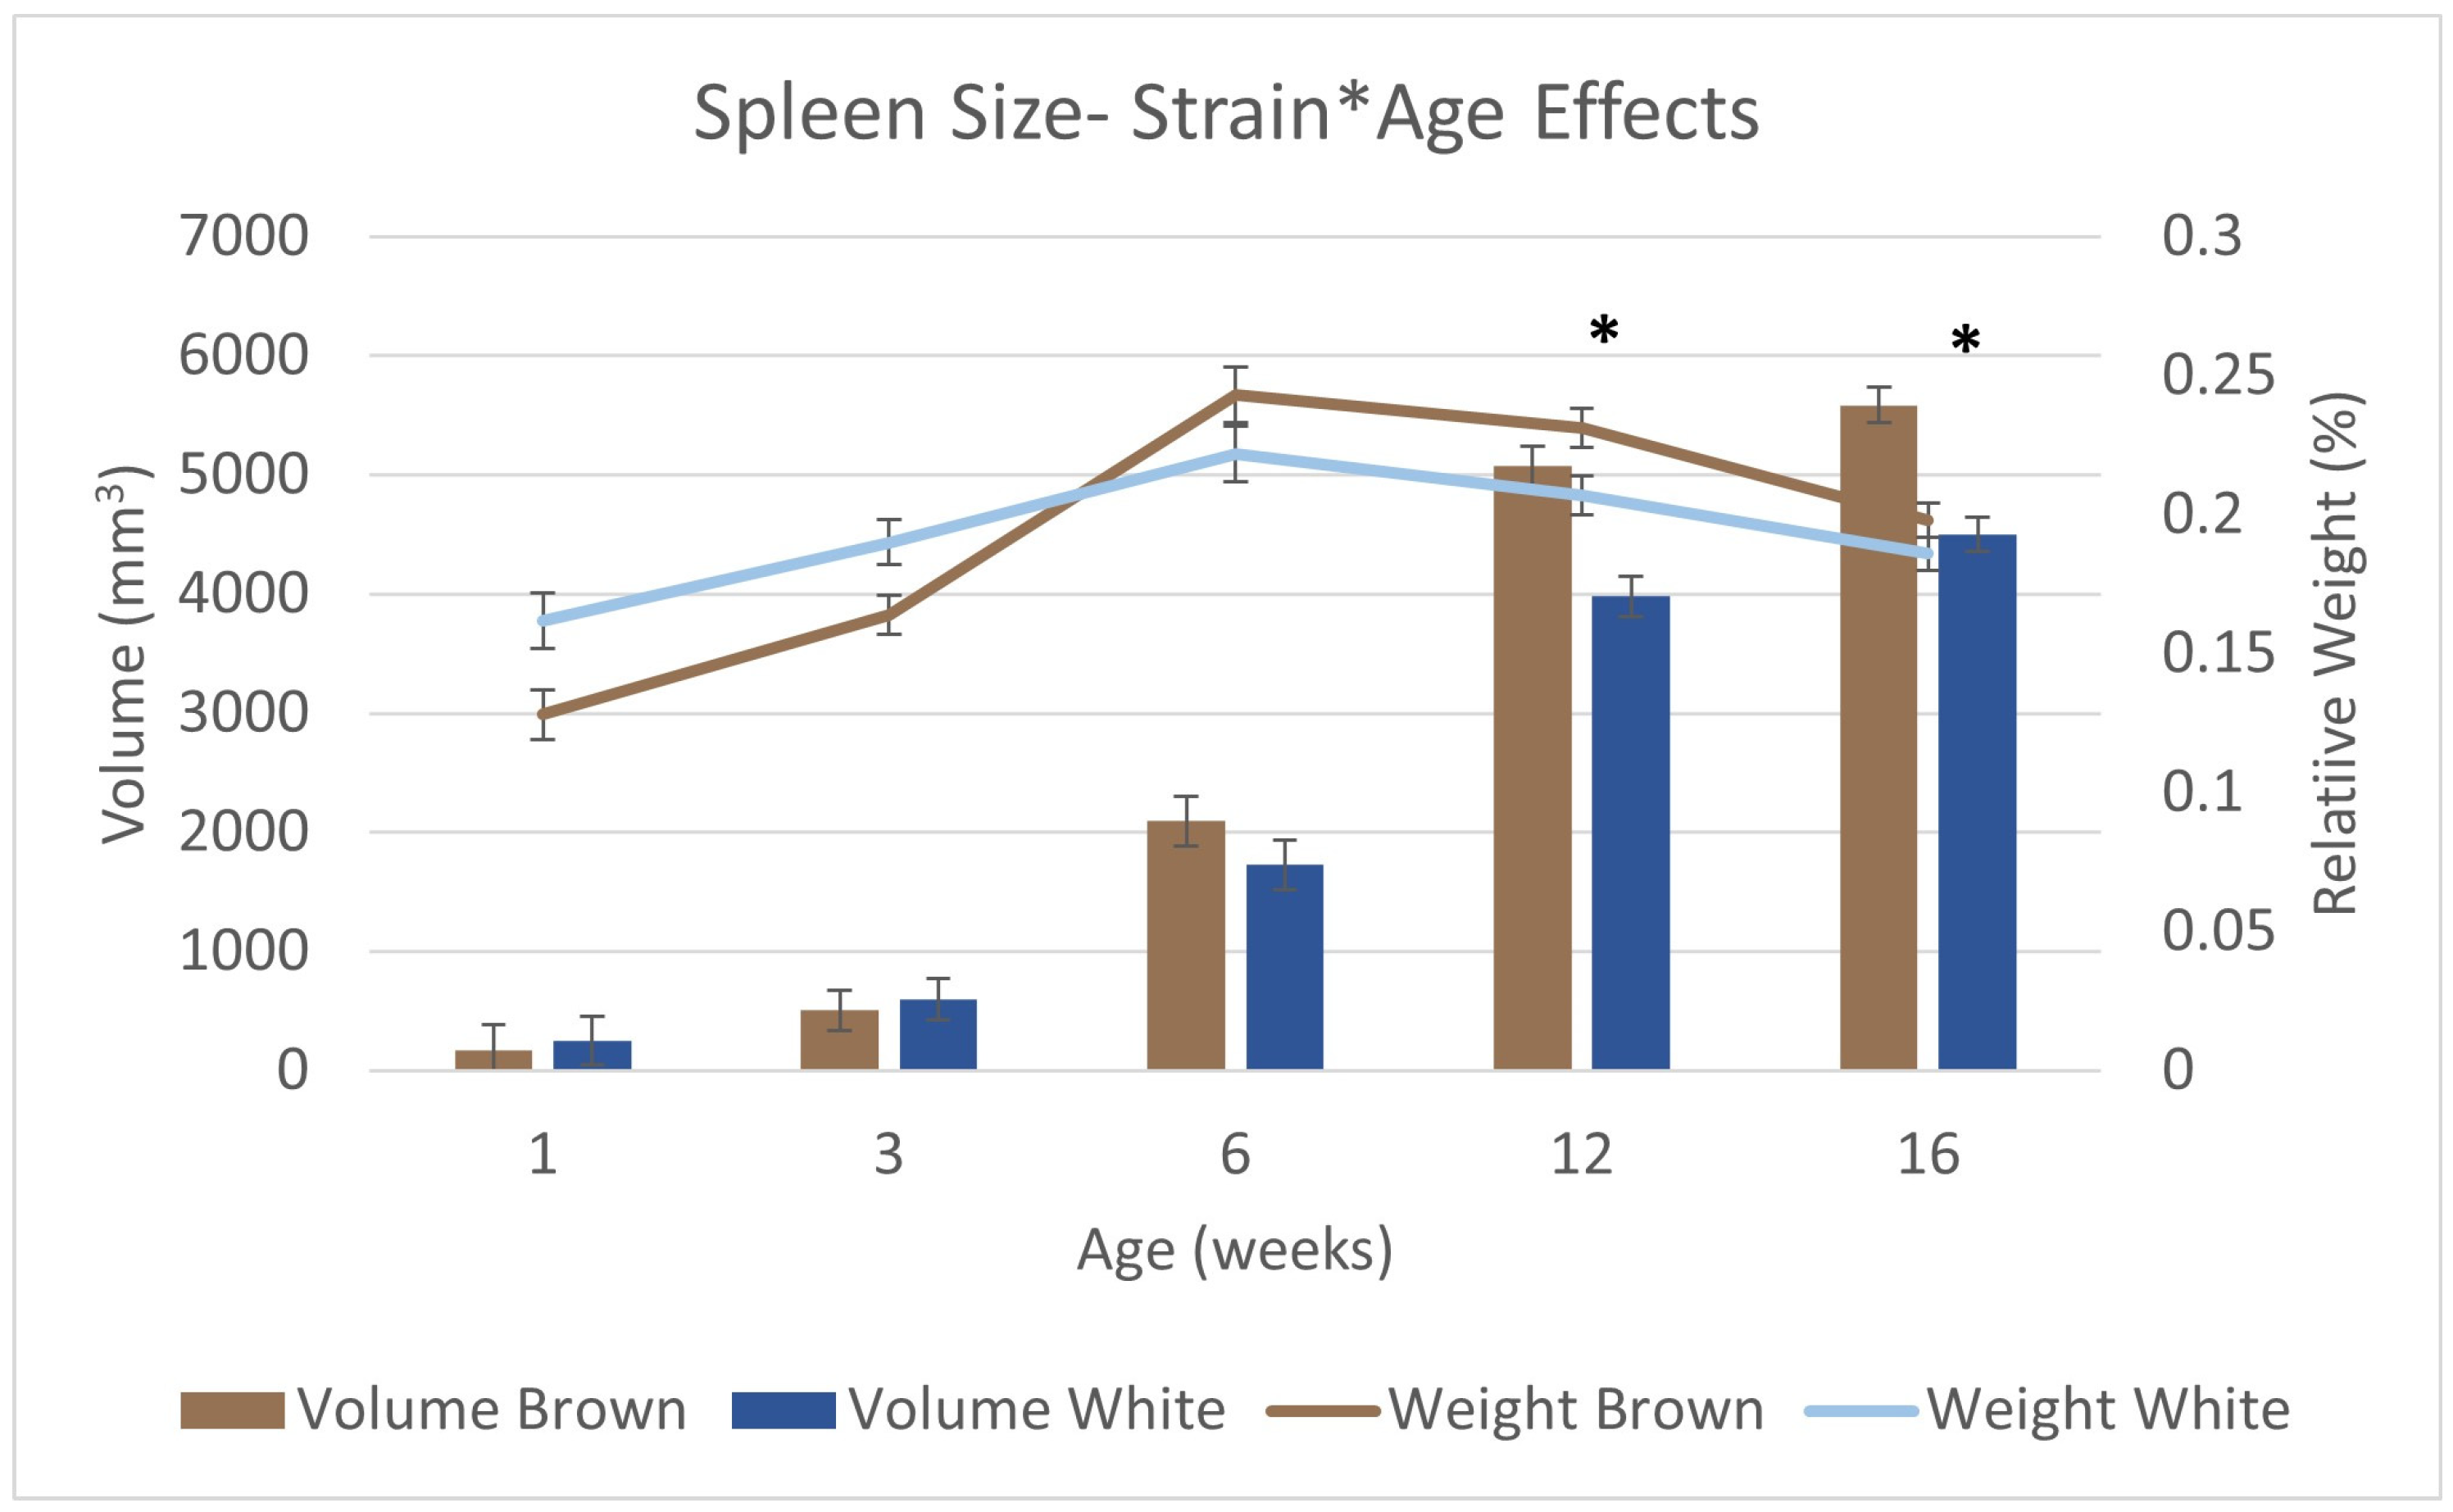
3.5. Immune Organ Size and Immune Function
4. Discussion
5. Conclusions
Author Contributions
Funding
Institutional Review Board Statement
Informed Consent Statement
Data Availability Statement
Acknowledgments
Conflicts of Interest
Appendix A

| Nutrients/Age (WOA) | 0 to 3 | 4 to 8 | 9 to 16 |
|---|---|---|---|
| ME Poultry, Kcal/kg | 3030.6 | 3048.8 | 3142.3 |
| Crude Protein, % | 20.25 | 18.50 | 14.74 |
| Calcium, % | 1.06 | 1.00 | 0.90 |
| Av. Phosphorus, % | 0.49 | 0.46 | 0.37 |
| Sodium, % | 0.18 | 0.17 | 0.16 |
| Chloride, % | 0.29 | 0.27 | 0.26 |
| Dig. Methionine, % | 0.51 | 0.43 | 0.35 |
| Dig. Methionine + Cysteine, % | 0.83 | 0.73 | 0.61 |
| Dig. Lysine, % | 1.23 | 1.08 | 0.72 |
| Dig. Threonine, % | 0.81 | 0.73 | 0.55 |

References
- Ibarburu, M. Flock Trends and Projections. Egg Industry Center. 4 April 2020. Available online: https://www.eggindustrycenter.org/browse/files/3aa25476a2e4455eb0fd25589c76ee87/download (accessed on 7 July 2022).
- Krause, E.T.; Schrader, L. Suggestions to Derive Maximum Stocking Densities for Layer Pullets. Animals 2019, 9, 348. [Google Scholar] [CrossRef] [PubMed]
- Widowski, T.M.; Classen, H.; Newberry, R.C.; Petrik, M.; Schwean-Lardner, K.; Cottee, S.Y.; Cox, B. Code of Practice for the Care and Handling of Pullets, Layers, and Spent Fowl: Poultry (Layers); Review of Scientific Research on Priority Issues; Poultry (Layer) Code of Practice Scientific Committee: Lacomb, AB, Canada, 2013. [Google Scholar]
- Janczak, A.M.; Riber, A.B. Review: Review of rearing-related factors affecting the welfare of laying hens. Poult. Sci. 2015, 94, 1454–1469. [Google Scholar] [CrossRef] [PubMed]
- Jensen, L. The Effects of Stocking Density on the Growth, Behaviour, and Welfare of Layer Pullets in Two Cage Systems. Master’s Thesis, The University of Guelph, Guelph, ON, Canada, 2019. [Google Scholar]
- Von Eugen, K.; Nordquist, R.E.; Zeinstra, E.; van der Staay, F.J. Stocking Density Affects Stress and Anxious Behavior in the Laying Hen Chick During Rearing. Animals 2019, 9, 53. [Google Scholar] [CrossRef]
- Campbell, D.L.M.; de Haas, E.N.; Lee, C. A review of environmental enrichment for laying hens during rearing in relation to their behavioral and physiological development. Poult. Sci. 2019, 98, 9–28. [Google Scholar] [CrossRef] [PubMed]
- Hester, P.Y. Impact of Science and Management on the Welfare of Egg Laying Strains of Hens. Poult. Sci. 2005, 84, 687–696. [Google Scholar] [CrossRef]
- United Egg Producers. Facts & Stats. 2021. Available online: https://unitedegg.com/facts-stats/ (accessed on 20 July 2022).
- Mench, J.A. Encyclopedia of Animal Science; Pond, W.G., Bell, A.W., Eds.; Marcel Dekker, Inc.: New York, NY, USA, 2005; pp. 202–205. [Google Scholar]
- Appleby, M.C. What causes crowding? Effects of space, facilities and group size on behaviour, with particular reference to furnished cages for hens. Anim. Welf. 2004, 13, 313–320. [Google Scholar] [CrossRef]
- Vanhonacker, F.; Verbeke, W.; VanPoucke, E.; Buijs, S.; Tuyttens, F.A.M. Societal concern related to stocking density, pen size and group size in farm animal production. Livest. Sci. 2009, 123, 16–22. [Google Scholar] [CrossRef]
- Simitzis, P.E.; Kalogeraki, E.; Goliomytis, M.; Charismiadou, M.A.; Triantaphyllopoulos, K.; Ayoutanti, A.; Niforou, K.; Hager-Theodorides, A.L.; Deligeorgis, S.G. Impact of stocking density on broiler growth performance, meat characteristics, behavioral components and indicators of physiological and oxidative stress. Br. Poult. Sci. 2012, 53, 721–730. [Google Scholar] [CrossRef]
- Wells, R.G. The effect of carrying stocking density on the development and subsequent laying performance of floor-reared pullets. Br. Poult. Sci. 1972, 13, 13–25. [Google Scholar] [CrossRef]
- Huber-Eicher, B.; Audige’, L. Analysis of risk factors for the occurrence of feather pecking in laying hen growers. Br. Poult. Sci. 1999, 40, 599–604. [Google Scholar] [CrossRef]
- Koelkebeck, K.; Anderson, K.; Schwean-Lardner, K.; Coufal, C.; Siegford, J.; Webster, A.B.; Cheng, H. Guide for the Care and Use of Agricultural Animals in Research and Teaching, 4th ed.; Poultry Science Association: Champaign, IL, USA, 2020; pp. 177–198. [Google Scholar]
- Spindler, B.; Clauss, M.; Briese, A.; Hartung, J. Planimetric measurement of floor space covered by pullets. Berl. Munch. Tierarztl. Wochenschr. 2013, 126, 156–162. [Google Scholar]
- Shupe, W.D.; Quisenberry, J.H. Effect of certain rearing and laying house environments on performance of incross egg production type pullets. Poult. Sci. 1961, 40, 1165–1171. [Google Scholar] [CrossRef]
- Hughes, B.O.; Duncan, I.J.H. The influence of strain and environmental factors upon feather pecking and cannibalism in fowls. Br. Poult. Sci. 1972, 13, 525–547. [Google Scholar] [CrossRef] [PubMed]
- Meunier-Salaun, M.C.; Huon, F.; Faure, J.M. Lack of influence of pullet rearing conditions on the hen’s performance. Br. Poult. Sci. 1984, 25, 541–546. [Google Scholar] [CrossRef] [PubMed]
- Na-Lampang, P.; Craig, J.V. Cage- and floor-rearing effects on productivity, nervousness, feather condition, and livability of white leghorn layers. Poult. Sci. 1990, 69, 902–909. [Google Scholar] [CrossRef]
- Hansen, I.; Braastad, B.O. Effect of rearing density on pecking behavior and plumage condition of laying hens in two types of aviary. Appl. Anim. Behav. Sci. 1994, 40, 263–272. [Google Scholar] [CrossRef]
- Nicol, C.J.; Brown, S.N.; Glen, E.; Pope, S.J.; Short, F.J.; Warriss, P.D.; Zimmerman, P.H.; Wilkins, L.J. Effects of stocking density, flock size and management on the welfare of laying hens in single-tier aviaries. Br. Poult. Sci. 2006, 47, 135–146. [Google Scholar] [CrossRef]
- Huo, X.; Na-Lampang, P. Effects of stocking density on feather pecking and aggressive behavior in Thai crossbred chickens. Agric. Nat. Resour. 2016, 50, 396–399. [Google Scholar] [CrossRef]
- Liebers, C.J.; Schwarzer, A.; Erhard, M.; Schmidt, P.; Louton, H. The influence of environmental enrichment and stocking density on the plumage and health conditions of laying hen pullets. Poult. Sci. 2019, 98, 2474–2488. [Google Scholar] [CrossRef]
- Hofmann, T.; Schmucker, S.; Grashorn, M.; Stefanski, V. Short- and long-term consequences of stocking density during rearing on the immune system and welfare of laying hens. Poult. Sci. 2021, 100, 101243. [Google Scholar] [CrossRef]
- Knierim, U.; Jung, L.; Gieseke, D. Assessing and Improving Poultry Welfare in Commercial Production Systems. Lohmann Information. Available online: https://lohmann-breeders.com/lohmanninfo/assessing-and-improving-poultry-welfare-in-commercial-production-systems/ (accessed on 10 May 2022).
- Maxwell, M.H.; Robertson, G.W.; Spence, S.; McCorquodale, C.C. Comparison of haematological values in restricted-and ad libitum-fed domestic fowls: White blood cells and thrombocytes. Br. Poult. Sci. 1990, 31, 399–405. [Google Scholar] [CrossRef] [PubMed]
- Shlosberg, A.; Bellaiche, M.; Zeitlin, G.; Ya-Acobi, M.; Cahaner, A. Hematocrit values and mortality from ascites in cold-stressed broilers from parents selected by hematocrit. Poult. Sci. 1996, 75, 1–5. [Google Scholar] [CrossRef] [PubMed]
- Patterson, P.H.; Siegel, H.S. Impact of cage density on pullet performance and blood parameters of stress. Poult. Sci. 1998, 77, 32–40. [Google Scholar] [CrossRef] [PubMed]
- Mumma, J.O.; Thaxton, J.P.; Vizzier-Thaxton, Y.; Dodson, W.L. Physiological stress in laying hens. Poult. Sci. 2006, 85, 761–769. [Google Scholar] [CrossRef] [PubMed]
- Salahi, A.; Khabisi, M.M.; Anissian, A. Effects of infectious bursal disease (IBD) on shank length and diameter, body weight and mortality in broiler breeder at rearing period. Turk. J. Vet. Anim. Sci. 2014, 38, 34–39. [Google Scholar] [CrossRef]
- Hau, M.; Casagrande, S.; Ouyang, J.Q.; Baugh, A.T. Glucocorticoid-mediated phenotypes in vertebrates: Multilevel variation and evolution. Adv. Study Behav. 2016, 48, 41–115. [Google Scholar]
- Scanes, C.G. Biology of stress in poultry with emphasis on glucocorticoids and the heterophil to lymphocyte ratio. Poult. Sci. 2016, 95, 2208–2215. [Google Scholar] [CrossRef] [PubMed]
- Virden, W.S.; Kidd, M.T. Physiological stress in broilers: Ramifications on nutrient digestibility and responses. J. Appl. Poult. Res. 2009, 18, 338–347. [Google Scholar] [CrossRef]
- Lohmann Tierzucht. Lohmann Brown-Lite Layers: Management Guide. 2020. Available online: https://lohmann-breeders.com/media/2020/07/ManagementGuideBrownLiteNorthAmerica.pdf (accessed on 2 December 2019).
- Gast, R.K.; Jones, D.R.; Guraya, R.; Anderson, K.E.; Karcher, D.M. Applied research note: Internal organ colonization and horizontal transmission of experimental Salmonella Enteritidis and Salmonella Kentucky infection in vaccinated laying hens in indoor cage-free housing. J. Appl. Poult. Res. 2021, 30, 100132. [Google Scholar] [CrossRef]
- Welfare Quality®. Welfare Quality® Assessment Protocol for Poultry (Broilers, Laying Hens); Welfare Quality® Consortium: Lelystad, The Netherlands, 2009. [Google Scholar]
- Morrissey, K.L.H.; Widowski, T.; Leeson, S.; Sandilands, V.; Arnone, A.; Torrey, S. The effect of dietary alterations during rearing on feather condition in broiler breeder females. Poult. Sci. 2014, 93, 1636–1643. [Google Scholar] [CrossRef]
- Arrazola, A.; Mosco, E.; Widowski, T.M.; Guerin, M.T.; Kiarie, E.G.; Torrey, S. The effect of alternative feeding strategies for broiler breeder pullets: Welfare and performance during rearing. Poult. Sci. 2019, 98, 3377–3390. [Google Scholar] [CrossRef] [PubMed]
- Collins, W.M.; Nordskog, A.W.; Skoglund, W.C. Repeatability of body measurements in broiler-type chickens. Poult. Sci. 1964, 43, 759–764. [Google Scholar] [CrossRef]
- Lerner, M. Shank length as a criterion of inherent size. Poult. Sci. 1937, 16, 213–215. [Google Scholar] [CrossRef]
- Latshaw, J.D.; Bishop, B.L. Estimating body weight and body composition of chickens by using noninvansive measurements. Poult. Sci. 2001, 80, 868–873. [Google Scholar] [CrossRef] [PubMed]
- Debes, A.A.; Hasaan, S.F.; El-Rehem, H.A.H.A.; Eshera, A.A.; Bashandy, M.G. Relationship of shank length with some productive and physiological parameters of Matrouh chicken strain. J. Anim. Poult. Prod. Mansoura Univ. 2015, 6, 741–753. [Google Scholar] [CrossRef]
- Walberg, J. White blood cell counting techniques in birds. Semin. Avian Exot. Pet Med. 2001, 10, 72–76. [Google Scholar] [CrossRef]
- Davis, A.K.; Maney, D.L.; Maerz, J.C. The use of leukocyte profiles to measure stress in vertebrates: A review for ecologists. Funct. Ecol. 2008, 22, 760–772. [Google Scholar] [CrossRef]
- Maxwell, M.H.; Robertson, G.W. The avian heterophil leucocyte: A review. World’s Poult. Sci. J. 1998, 54, 155–178. [Google Scholar] [CrossRef]
- Sakas, P.S. Understanding Avian Laboratory Tests. As Adapted from Essentials of Avian Medicine: A Practitioner’s Guide, 2nd ed.; Niles Animal Hospital and Bird Medical Center: Niles, IL, USA, 2002. [Google Scholar]
- Nowaczewski, S.; Kontecka, H. Haematological indices, size of erythrocytes and haemoglobin saturation in broiler chickens kept in commercial conditions. Anim. Sci. Pap. Rep. 2012, 30, 181–190. [Google Scholar]
- Siegel, P.B.; Gross, W.B. Livestock Handling and Transport, 2nd ed.; Grandin, T., Ed.; CABI Publishing: Wallingford, UK, 2000; pp. 27–41. [Google Scholar] [CrossRef]
- Weimer, S.L.; Wideman, R.F.; Scanes, C.G.; Mauromoustakos, K.D.; Christensen, Y. Vizzier-Thaxton. Animal Well-Being and Behavior: An evaluation of methods for measuring stress in broiler chickens. Poult. Sci. 2018, 97, 3381–3389. [Google Scholar] [CrossRef]
- Lentfer, T.L.; Pendl, H.; Gebhardt-Henrich, S.G.; Frohlich, E.K.F.; Von Borell, E. H/L ratio as a measurement of stress in laying hens—Methodology and reliability. Br. Poult. Sci. 2015, 56, 157–163. [Google Scholar] [CrossRef] [PubMed]
- Gross, W.B.; Siegel, H.S. Evaluation of the heterophil/lymphocyte ratio as a measure of stress in chickens. Avian Dis. 1983, 27, 972–979. [Google Scholar] [CrossRef] [PubMed]
- Laakko, T.; Fraser, P. Rapid changes in the lymphopoietic and granulopoeitic compartments of the marrow caused by stress levels of corticosterone. Immunology 2002, 105, 111–119. [Google Scholar] [CrossRef] [PubMed]
- Shini, S.; Shini, A.; Huff, G.R. Effects of chronic and repeated corticosterone administration in rearing chickens on physiology, the onset of lay and egg production of hens. Physiol. Behav. 2009, 98, 73–77. [Google Scholar] [CrossRef] [PubMed]
- Maxwell, M.H. Avian blood leucocyte responses to stress. World’s Poult. Sci. J. 1993, 49, 34–43. [Google Scholar] [CrossRef]
- Pendl, H.; Tizard, I. Current Therapy in Avian Medicine and Surgery, 1st ed.; Speer, B.L., Ed.; Elsevier: St. Louis, MO, USA, 2016; pp. 400–432. [Google Scholar] [CrossRef]
- Schmidt, K.L.; Soma, K.K. Cortisol and corticosterone in the songbird immune and nervous systems: Local vs. systemic levels during development. Am. J. Physiol. Regul. Integr. Comp. Physiol. 2008, 295, R103–R110. [Google Scholar] [CrossRef] [PubMed]
- Wada, H.; Hahn, T.P.; Breuner, C.W. Development of stress reactivity in white-crowned sparrow nestlings: Total corticosterone response increases with age, while free corticosterone response remains low. Gen. Comp. Endocrinol. 2007, 150, 405–413. [Google Scholar] [CrossRef] [PubMed]
- Puvadolpirod, S.; Thaxton, J.P. Model of physiological stress in chickens 2. Dosimetry of Adrenocorticotropin. Poult. Sci. 2000, 79, 370–376. [Google Scholar] [CrossRef] [PubMed]
- Puvadolpirod, S.; Thaxton, J.P. Model of physiological stress in chickens 1. Response parameters. Poult. Sci. 2000, 79, 363–369. [Google Scholar] [CrossRef]
- Dohms, J.E.; Metz, A. Stress- mechanisms of immunosuppression. Vet. Immunol. Immunopathol. 1991, 30, 89–109. [Google Scholar] [CrossRef]
- Tong, H.B.; Wang, Q.; Lu, J.; Zou, J.M.; Change, L.L.; Fu, S.Y. Effect of free-range days on a local chicken breed: Growth performance, carcass yield, meat quality, lymphoid organ index. Poult. Sci. 2014, 93, 1883–1889. [Google Scholar] [CrossRef] [PubMed]
- Wolfe, H.R.; Sheridan, S.A.; Bilstad, N.M.; Johnson, M.A. The growth of lymphoidal organs and the testes of chickens. Anat. Rec. 1962, 142, 485–493. [Google Scholar] [CrossRef] [PubMed]
- Siegel, H.S.; Beane, W.L. Time responses to single intramuscular doses of ACTH in chickens. Poult. Sci. 1961, 40, 216–219. [Google Scholar] [CrossRef]
- Glick, B. Normal growth of the Bursa of Fabricius in chickens. Poult. Sci. 1956, 35, 843–851. [Google Scholar] [CrossRef]
- Glick, B. Growth and Function of the Bursa of Fabricius in the Domestic Fowl. Ph.D. Thesis, The Ohio State University, Columbus, OH, USA, 1955. [Google Scholar]
- Broughton, J.M. Size of the bursa of fabricius in relation to gonad size and age in Laysan and Black-footed Albatrosses. Condor 1994, 96, 203–207. [Google Scholar] [CrossRef]
- Tarek, K.; Mohamed, M.; Omar, B.; Hassina, B. Morpho-histological study of the thymus of broiler chickens during post-hashing age. Int. J. Poult. Sci. 2012, 11, 78–80. [Google Scholar] [CrossRef]
- Cazaban, C.; Masferrer, N.M.; Pascual, R.D.; Espadamala, M.N.; Costa, T.; Gardin, Y. Proposed bursa of fabricius weight to body weight ratio standard in commercial broilers. Poult. Sci. 2015, 94, 2088–2093. [Google Scholar] [CrossRef] [PubMed]
- Alloui, M.N.; Sellauoi, S.; Djaaba, S. Morphometrical and Anatomopathological Survey of the Bursa of Fabricius in Broiler Chickens; ISAH: Warsaw, Poland, 2005; Volume 2. [Google Scholar]
- Hu, X.; Wang, Y.; Sheikhadmadi, A.; Li, X.; Buyse, J.; Lin, H.; Song, Z. Effects of glucocorticoids on lipid metabolism and AMPK in broiler chickens’ liver. Comp. Biochem. Physiol. Part B 2019, 232, 23–30. [Google Scholar] [CrossRef] [PubMed]
- Davison, T.F.; Freeman, B.M.; Rea, J. Effects of continuous treatment with synthetic ACTH1–24 or corticosterone on immature gallus domesticus. Gen. Comp. Endocrinol. 1985, 59, 416–423. [Google Scholar] [CrossRef]
- Sarica, M.; Boga, S.; Yamak, U.S. The effects of space allowance on egg yield, egg quality and plumage condition of laying hens in battery cages. Czech J. Anim. Sci. 2008, 53, 346–353. [Google Scholar] [CrossRef]
- Carey, J.B. Effects of pullet-stocking density on performance of laying hens. Poult. Sci. 1987, 66, 1283–1287. [Google Scholar] [CrossRef] [PubMed]
- Kang, H.K.; Park, S.B.; Kim, S.H.; Kim, C.H. Effects of stock density on the laying performance, blood parameter, corticosterone, litter quality, gas emission and bone mineral density of laying hens in floor pens. Poult. Sci. 2016, 95, 2764–2770. [Google Scholar] [CrossRef]
- Bozkurt, Z.; Bayram, I.; Turkmenoulu, I.; Aktepe, O.C. Effects of cage density and cage position on performance of commercial layer pullets from four genotypes. Turk. J. Vet. Anim. Sci. 2003, 30, 17–28. [Google Scholar]
- Keshavarz, K. The effect of light regimen, floor space, and energy and protein levels during the growing period on body weight and early egg size. Poult. Sci. 1998, 77, 1266–1279. [Google Scholar] [CrossRef]
- Johns, D.W.; Marchant, T.A.; Fairhurst, G.D.; Speakman, J.R.; Clark, R.G. Biomarker of burden: Feather corticosterone reflects energetic expenditure and allostatic overload in captive waterfowl. Funct. Ecol. 2018, 32, 345–357. [Google Scholar] [CrossRef]
- Blokhuis, H.J. The Development and Causation of Feather Pecking in the Domestic Fowl. Ph.D. Thesis, Wageningen University and Research, Wageningen, The Netherlands, 1989. [Google Scholar]
- Savory, C.J.; Mann, S.J.; Macleod, M.G. Incidence of pecking damage in growing bantams in relation to food form, group size, stocking density, dietary tryptophan concentration and dietary protein source. Br. Poult. Sci. 1999, 40, 579–584. [Google Scholar] [CrossRef] [PubMed]
- Zimmerman, P.H.; Lindberg, A.C.; Pope, S.J.; Glen, E.; Blokhuis, J.E.; Nicol, C.J. The effect of stocking density, flock size and modified management on laying hen behavior and welfare in a non-cage system. Appl. Anim. Behav. Sci. 2006, 101, 111–124. [Google Scholar] [CrossRef]
- Zepp, M.; Louton, H.; Erhard, M.; Schmidt, P.; Helmer, F.; Schwarzer, A. The influence of stocking density and enrichment on the occurrence of feather pecking and aggressive pecking behavior in laying hen chicks. J. Vet. Behav. 2018, 24, 9–18. [Google Scholar] [CrossRef]
- Khumput, S.; Muangchum, S.; Yodprom, S.; Panyasak, A.; Thiengtham, J. Feather pecking of laying hens in different stocking density and type of cage. Iran. J. Appl. Anim. Sci. 2019, 9, 549–556. [Google Scholar]
- Kjaer, J.B. Diurnal rhythm of feather pecking behaviour and condition of integument in four strains of loose housed laying hens. Appl. Anim. Behav. Sci. 2000, 65, 331–347. [Google Scholar] [CrossRef]
- Gilani, A.; Knowles, T.G.; Nicol, C.J. The effect of rearing environment on feather pecking in young and adult laying hens. Appl. Anim. Behav. Sci. 2013, 148, 54–63. [Google Scholar] [CrossRef]
- Albentosa, M.J.; Kjaer, J.B.; Nicol, C.J. Strain and age differences in behaviour, fear response and pecking tendency in laying hens. Br. Poult. Sci. 2003, 44, 333–344. [Google Scholar] [CrossRef] [PubMed]
- Jensen, P.; Buitenhuis, B.; Kjaer, J.; Zanella, A.; Mormède, P.; Pizzari, T. Genetics and genomics of animal behaviour and welfare—Challenges and possibilities. Appl. Anim. Behav. Sci. 2008, 113, 383–403. [Google Scholar] [CrossRef]


| 2–3 WOA | 3–6 WOA | 6–12 WOA | 12–16 WOA | Target | |
|---|---|---|---|---|---|
| Area (cm2) | |||||
| -HSD | 619.1 | 635.2 | 652.2 | 670.2 | 619.1 |
| -LSD | 1248.9 | 1281.5 | 1315.8 | 1352.0 | 1248.9 |
| Feeder space (cm) | 7.1 | 7.4 | 7.6 | 7.8 | 7.1 |
| Drinker space (cm) | 3.5 | 3.7 | 3.8 | 3.9 | 3.5 |
| Feather Coverage Scoring System 1 | |
| Score | Description |
| 0 | Completely covered |
| 1 | <10% of feathers missing, damaged, or broken |
| 2 | 11–50% of feathers missing, damaged, or broken (no tissue damage) |
| 3 | >50% of feathers missing, damaged, or broken (no tissue damage) |
| 4 | 10–50% of feathers missing, damaged, or broken (tissue damage present) |
| 5 | >51% of feathers missing, damaged, or broken (tissue damage present) |
| Keel Scoring System 2 | |
| Score | Description |
| 0 | No deviations, deformations or thickened sections; keel bone completely straight |
| 1 | Tip fracture and/or deviation (≤2 cm) |
| 2 | Multiple or more severe deviation or deformation of keel bone (including thickened sections; >2 cm) |
| Keel Tip Fracture 2 | |
| Yes | Keel tip fracture present |
| No | Keel tip fracture absent |
| Footpad Scoring System 2 | |
| 0 | Feet intact; no or minimal proliferation of epithelium |
| 1 | Necrosis or proliferation of epithelium or chronic bumble foot with no or moderate swelling |
| 2 | Swollen (dorsally visible) |
| Shank length | |
| Measured from the hock to the footpad as a proxy for skeletal size and growth 3 | |
| Parameter | Model | |
|---|---|---|
| Fixed Linear | % Eosinophils and Heterophils, Thymus Volume and Relative Weight, Corticosterone, Cortisol | Yijk = μ + STi + SDj + Ak + εijk |
| FCR, Mortality | Yijk = μ + STi + SDj + εijk | |
| H:L ratio, % Lymphocytes and Monocytes | Yijk = μ + STi + SDj + Ak + SDj × Ak +εijk | |
| Relative Bursal and Liver Weight | Yijk = μ + STi + SDj + Ak + STi × Ak + εijk | |
| Uniformity | Yijk = μ + STi + SDj + Ak + STi × SDj + STi × Ak + εijk | |
| Linear Mixed | PCV | Yijk = μ + STi + SDj + Ak + STi × Ak + B + εijk |
| Body Weight | Yijk = μ + STi + SDj + Ak + STi × SDj + STi × Ak + SDj × Ak + B + εijk | |
| Shank Length | Yijk = μ + STi + SDj + Ak + SDj × Ak + P(B) + εijk | |
| % Basophils | Yijk = μ + STi + SDj + Ak + SDj × Ak + P + εijk | |
| Cholesterol | Yijk = μ + STi + SDj + Ak + STi × Ak + P + εijk | |
| NDV Titer | Yijk = μ + STi + SDj + Ak + STi × Ak + SDj × Ak + P + εijk | |
| Relative splenic weight | Yijk = μ + STi + SDj + Ak + STi × Ak + P + εijk | |
| Spleen volume | Yijk = μ + STi + SDj + Ak + STi × Ak + R(P) + εijk | |
| Bursal Dimensions | Yijk = μ + STi + SDj + Ak + STi × Ak + SDj × Ak + R + εijk | |
| Multinomial Logistic Regression | Bursometer size, Back feather coverage, Wing feather coverage | Yijk = μ + STi + Ak + εijk |
| Tail feather coverage, Total feather coverage | Yijk = μ + STi × SDj + STi × Ak + εijk |
| (A) Tail Feather Coverage Score | |||||||
| Brown Strain | |||||||
| Density | 0 | 1 | 2 | 3 | 4 | 5 | |
| High | 56.25% | 25.78% | 17.19% | 0.78% | 0.00% | 0.00% | |
| Low | 59.84% | 24.41% | 14.96% | 0.00% | 0.79% | 0.00% | |
| Age (weeks) | 0 | 1 | 2 | 3 | 4 | 5 | |
| 4 | 100.00% | 0.00% | 0.00% | 0.00% | 0.00% | 0.00% | |
| 8 | 18.75% | 39.06% | 42.19% | 0.00% | 0.00% | 0.00% | |
| 12 | 87.50% | 12.50% | 0.00% | 0.00% | 0.00% | 0.00% | |
| 16 | 25.40% | 49.21% | 22.22% | 1.59% | 1.59% | 0.00% | |
| White Strain | |||||||
| Density | 0 | 1 | 2 | 3 | 4 | 5 | |
| High | 69.63% | 11.85% | 16.30% | 0.74% | 0.74% | 0.74% | |
| Low | 68.25% | 5.56% | 19.84% | 4.76% | 0.79% | 0.79% | |
| Age (weeks) | 0 | 1 | 2 | 3 | 4 | 5 | |
| 4 | 100.00% | 0.00% | 0.00% | 0.00% | 0.00% | 0.00% | |
| 8 | 77.94% | 19.12% | 2.94% | 0.00% | 0.00% | 0.00% | |
| 12 | 96.88% | 3.13% | 0.00% | 0.00% | 0.00% | 0.00% | |
| 16 | 0.00% | 12.50% | 70.31% | 10.94% | 3.13% | 3.13% | |
| (B) Total Feather Coverage Score | |||||||
| Brown Strain | |||||||
| Density | 0 | 1 | 2 | 3 | 4 | 5 | 6 * |
| High | 51.56% | 21.88% | 20.31% | 5.47% | 0.78% | 0.00% | 0.00% |
| Low | 57.03% | 18.75% | 15.63% | 7.03% | 0.00% | 1.56% | 0.00% |
| Age (weeks) | 0 | 1 | 2 | 3 | 4 | 5 | 6 |
| 4 | 100.00% | 0.00% | 0.00% | 0.00% | 0.00% | 0.00% | 0.00% |
| 8 | 18.75% | 23.44% | 40.63% | 17.19% | 0.00% | 0.00% | 0.00% |
| 12 | 71.88% | 26.56% | 1.56% | 0.00% | 0.00% | 0.00% | 0.00% |
| 16 | 26.56% | 31.25% | 29.69% | 7.81% | 1.56% | 3.13% | 0.00% |
| White Strain | |||||||
| Density | 0 | 1 | 2 | 3 | 4 | 5 | 6 |
| High | 65.44% | 12.50% | 15.44% | 2.94% | 1.47% | 1.47% | 0.74% |
| Low | 60.32% | 8.73% | 21.43% | 6.35% | 2.38% | 0.79% | 0.00% |
| Age (weeks) | 0 | 1 | 2 | 3 | 4 | 5 | 6 |
| 4 | 100.00% | 0.00% | 0.00% | 0.00% | 0.00% | 0.00% | 0.00% |
| 8 | 58.82% | 26.47% | 8.82% | 4.41% | 1.47% | 0.00% | 0.00% |
| 12 | 92.19% | 3.13% | 0.00% | 1.56% | 1.56% | 1.56% | 0.00% |
| 16 | 0.00% | 12.50% | 65.63% | 12.50% | 4.69% | 3.13% | 1.56% |
| Age Effects | ||||||||
| Age (Weeks) | PCV | Heterophils | Lymphocytes | Basophils | Eosinophils | Monocytes | ||
| 6 | -- | 22.3 ± 1.11 A | 68.3 ± 1.34 A | 2.40 ± 0.20 A,B | 1.81 ± 0.18 A,B | 5.30 ± 0.29 A | ||
| 9 | 29.1 ± 0.25 B | 21.2 ± 1.08 A | 72.7 ± 1.31 A | 2.01 ± 0.20 B | 1.39 ± 0.18 B | 2.94 ± 0.28 B | ||
| 12 | 28.5 ± 0.24 B | 20.9 ± 1.05 A | 69.9 ± 1.27 A | 2.85 ± 0.19 A | 2.27 ± 0.17 A | 4.17 ± 0.28 C | ||
| 16 | 30.5 ± 0.23 A | 22.3 ± 1.02 A | 69.6 ± 1.23 A | 2.56 ± 0.19 A,B | 1.88 ± 0.17 A,B | 3.26 ± 0.27 B,C | ||
| p-value | <0.001 | >0.05 | >0.05 | 0.01 | 0.006 | 0.001 | ||
| Strain Effects | ||||||||
| PCV | Heterophils | Lymphocytes | Basophils | Eosinophils | Monocytes | |||
| Brown | 29.7 ± 0.22 A | 28.6 ± 0.73 A | 63.5 ± 0.88 B | 2.56 ± 0.16 A | 1.57 ± 0.12 B | 3.56 ± 0.19 B | ||
| White | 29.1 ± 0.24 A | 14.8 ± 0.78 B | 76.7 ± 0.94 A | 2.35 ± 0.16 A | 2.11 ± 0.13 A | 4.27 ± 0.20 A | ||
| p-value | >0.05 | <0.001 | <0.001 | >0.05 | 0.003 | 0.01 | ||
| Strain × age Effects | ||||||||
| PCV | ||||||||
| Age (weeks) /Strain | Brown | White | ||||||
| 6 | -- | -- | ||||||
| 9 | 29.3 ± 0.34 B,a | 29.0 ± 0.37 A,a | ||||||
| 12 | 28.4 ± 0.32 B,a | 28.6 ± 0.34 A,a | ||||||
| 16 | 31.4 ± 0.32 A,b | 29.6 ± 0.34 A,a | ||||||
| p-value | 0.004 | |||||||
| Density × age Effects | ||||||||
| Age (weeks) Density | Heterophils | Lymphocytes | Basophils | Eosinophils | Monocytes | |||
| 6 High Low | 22.0 ± 1.23 A 22.6 ± 1.23 A | 70.5 ± 1.90 A,B 66.0 ± 1.90 B | 2.32 ± 0.29 A,B 2.49 ± 0.29 A,B | 1.80 ± 0.20 A,B,C,D 1.82 ± 0.20 A,B,C,D | 4.89 ± 0.41 A,C 5.70 ± 0.41 A | |||
| 9 High Low | 20.9 ± 1.21 A 21.6 ± 1.20 A | 71.0 ± 1.87 A,B 74.3 ± 1.84 A | 2.57 ± 0.28 A,B 1.45 ± 0.28 B | 1.38 ± 0.20 B,D 1.40 ± 0.20 C,D | 3.54 ± 0.41 B,C 2.33 ± 0.40 B,D | |||
| 12 High Low | 20.6 ± 1.19 A 21.2 ± 1.16 A | 72.0 ± 1.84 A,B 67.7 ± 1.74 A,B | 2.64 ± 0.28 A,B 3.06 ± 0.26 A | 2.26 ± 0.20 C,A 2.28 ± 0.19 A,B | 4.17 ± 0.40 A,C,E 4.18 ± 0.38 A,C,E | |||
| 16 High Low | 22.0 ± 1.15 A 22.7 ± 1.14 A | 66.9 ± 1.77 A,B 72.3 ± 1.72 A,B | 2.89 ± 0.27 A 2.22 ± 0.26 A,B | 1.87 ± 0.19 A,B,C,D 1.89 ± 0.19 A,B,C,D | 3.97 ± 0.38 A,C,D,F 2.54 ± 0.37 B,E,F | |||
| p-value | >0.05 | 0.008 | 0.009 | >0.05 | 0.02 | |||
| Age Effects | |||||
| Age (weeks) | Cholesterol (ng/mL) | Age (weeks) | Liver Relative Weight (%) | ||
| 1 | 4.54 ± 0.05 A | ||||
| 6 | 1260 ± 32.3 A,C | 3 | 3.25 ± 0.04 B | ||
| 9 | 1140 ± 32.2 B,D | 6 | 2.80 ± 0.05 C | ||
| 12 | 1170 ± 32.2 C,D | 12 | 2.48 ± 0.04 D | ||
| 16 | 1076 ± 32.2 B,D | 16 | 1.96 ± 0.03 E | ||
| p-value | 0.0001 | <0.0001 | |||
| Strain × age Effects | |||||
| Age (weeks) | Cholesterol (ng/mL) | Age (weeks) | Liver Relative Weight (%) | ||
| Brown | White | Brown | White | ||
| 1 | 4.30 ± 0.07 A,b | 4.79 ± 0.08 A,a | |||
| 6 | 1111 ± 45.0 A,b | 1409 ± 46.4 A,a | 3 | 3.22 ± 0.05 B,a | 3.28 ± 0.05 B,a |
| 9 | 1052 ± 44.6 A,a | 1228 ± 46.4 A,C,a | 6 | 2.76 ± 0.08 C,a | 2.84 ± 0.08 C,a |
| 12 | 1138 ± 44.6 A,a | 1202 ± 46.4 B,C,a | 12 | 2.36 ± 0.05 D,a | 2.59 ± 0.05 C,a |
| 16 | 1024 ± 44.6 A,a | 1128 ± 46.4 B,C,a | 16 | 1.83 ± 0.05 E,b | 2.10 ± 0.04 D,a |
| p-value | 0.02 | <0.02 | |||
Disclaimer/Publisher’s Note: The statements, opinions and data contained in all publications are solely those of the individual author(s) and contributor(s) and not of MDPI and/or the editor(s). MDPI and/or the editor(s) disclaim responsibility for any injury to people or property resulting from any ideas, methods, instructions or products referred to in the content. |
© 2024 by the authors. Licensee MDPI, Basel, Switzerland. This article is an open access article distributed under the terms and conditions of the Creative Commons Attribution (CC BY) license (https://creativecommons.org/licenses/by/4.0/).
Share and Cite
Abraham, M.E.; Robison, C.I.; Serpa, P.B.S.; Strandberg, N.J.; Erasmus, M.A.; Fraley, G.S.; Erf, G.F.; Karcher, D.M. Cage-Free Pullets Minimally Affected by Stocking Density Stressors. Animals 2024, 14, 1513. https://doi.org/10.3390/ani14101513
Abraham ME, Robison CI, Serpa PBS, Strandberg NJ, Erasmus MA, Fraley GS, Erf GF, Karcher DM. Cage-Free Pullets Minimally Affected by Stocking Density Stressors. Animals. 2024; 14(10):1513. https://doi.org/10.3390/ani14101513
Chicago/Turabian StyleAbraham, Meagan E., Cara I. Robison, Priscila B. S. Serpa, Natalia J. Strandberg, Marisa A. Erasmus, Gregory S. Fraley, Gisela F. Erf, and Darrin M. Karcher. 2024. "Cage-Free Pullets Minimally Affected by Stocking Density Stressors" Animals 14, no. 10: 1513. https://doi.org/10.3390/ani14101513