Article

Multi-Omics Analysis Reveals the Regulatory Mechanism of Probiotics on the Growth Performance of Fattening Sheep

1
College of Animal Science and Technology, Anhui Agricultural University, Hefei 230036, China
2
Anhui Province Key Laboratory of Local Livestock and Poultry Genetic Resource Conservation and Bio-Breeding, Anhui Agricultural University, Hefei 230036, China
*
Author to whom correspondence should be addressed.
Animals 2024, 14(9), 1285; https://doi.org/10.3390/ani14091285
Submission received: 23 March 2024 / Revised: 16 April 2024 / Accepted: 22 April 2024 / Published: 24 April 2024
(This article belongs to the Section Small Ruminants)

Abstract

:

Simple Summary

Probiotics are beneficial bacteria that regulate the gut microbiota of animals, and are used to maintain the balance of the gut microbiota. However, there is limited research on probiotics as a feed ingredient for meat sheep. This study mainly explains the mechanism of the effect of adding probiotics to the diet on the growth performance of fattening sheep from six aspects: sequencing of rumen and fecal microorganisms; metabolomics of rumen, serum, and urine; and transcriptome sequencing of rumen epithelial cells. This study shows that adding probiotics to feed can improve the growth performance of fattening sheep. Our research results will provide a theoretical basis for better using probiotics in ruminant feeding.

Abstract

Probiotics have been proven to improve the growth performance of livestock and poultry. The aim of this experiment was to investigate the effects of probiotic supplementation on the growth performance; rumen and intestinal microbiota; rumen fluid, serum, and urine metabolism; and rumen epithelial cell transcriptomics of fattening meat sheep. Twelve Hu sheep were selected and randomly divided into two groups. They were fed a basal diet (CON) or a basal diet supplemented with 1.5 × 10⁸ CFU/g probiotics (PRB). The results show that the average daily weight gain, and volatile fatty acid and serum antioxidant capacity concentrations of the PRB group were significantly higher than those of the CON group (p < 0.05). Compared to the CON group, the thickness of the rumen muscle layer in the PRB group was significantly decreased (p < 0.01); the thickness of the duodenal muscle layer in the fattening sheep was significantly reduced; and the length of the duodenal villi, the thickness of the cecal and rectal mucosal muscle layers, and the thickness of the cecal, colon, and rectal mucosal layers (p < 0.05) were significantly increased. At the genus level, the addition of probiotics altered the composition of the rumen and intestinal microbiota, significantly upregulating the relative abundance of Subdivision5_genera_incertae_sedis and Acinetobacter in the rumen microbiota, and significantly downregulating the relative abundance of Butyrivibrio, Saccharofermentans, and Fibrobacter. The relative abundance of faecalicoccus was significantly upregulated in the intestinal microbiota, while the relative abundance of Coprococcus, Porphyromonas, and Anaerobacterium were significantly downregulated (p < 0.05). There were significant differences in the rumen, serum, and urine metabolites between the PRB group and the CON group, with 188, 138, and 104 metabolites (p < 0.05), mainly affecting pathways such as vitamin B2, vitamin B3, vitamin B6, and a series of amino acid metabolisms. The differential genes in the transcriptome sequencing were mainly enriched in protein modification regulation (especially histone modification), immune function regulation, and energy metabolism. Therefore, adding probiotics improved the growth performance of fattening sheep by altering the rumen and intestinal microbiota; the rumen, serum, and urine metabolome; and the transcriptome.

1. Introduction

The emergence of antibiotics played an important role in animal growth and reproduction, disease prevention and treatment, etc. However, with the excessive abuse of antibiotics, bacteria in animals have developed resistance, disrupting the balance of animal gastrointestinal microbiota and, most importantly, it can also cause serious harm to human health [1,2]. China is a major country of the world’s livestock and poultry farming, as well as a major producer and user of antibiotics. In order to produce safe and high-quality livestock and poultry products and achieve healthy breeding, researchers urgently need to find ideal substitutes for antibiotic feed additives. Probiotics have the advantages of enhancing animal immunity and disease resistance, improving animal production performance and feed utilization, and are an ideal alternative to antibiotics [3,4,5]. The impact mechanism of probiotics on animals is mainly manifested through two aspects: regulating gastrointestinal health and improving the body’s immunity [6]. Probiotic additives can accelerate the growth and development of immune organs in ruminants by regulating the structure, quantity, and fermentation level of the gastrointestinal microbiota [7,8,9].
Animal probiotics, as one of the raw materials for microbial preparations, are currently mainly used in feed additives and silage [10,11]. Although probiotic products currently cannot completely replace antibiotic additives in diets, their application scope has gradually expanded and their reliability has improved since use began [12,13]. Probiotics have been shown to enhance the gut microbiota of livestock and poultry, and enhance immunity and growth performance [14,15,16]. At present, research on probiotics is very limited, mainly focusing on monogastrics, and there is still less research on ruminants, which to some extent limits the effective application of probiotics [17]. The development of multi-omics technology provides the possibility for a deeper understanding of the effects and mechanisms of probiotics.
The main probiotics used in ruminant feed include Lactobacillus, Aspergillus oryzae, Streptococcus, and Bifidobacterium [6,17,18]. Probiotic preparations mainly adjust the microbiota balance in an animal’s gastrointestinal tract, serving as the dominant microbiota in the animal gut to compensate for the number of normal microbiota, promote the formation of intestinal dominant microbiota, inhibit the growth and reproduction of pathogenic microorganisms, and restore the balance of gastrointestinal microbiota [19,20]. According to existing research findings, probiotics are defined as live microbial feed additives that beneficially affect host animals by enhancing intestinal balance, thereby improving feed utilization, nutrient absorption, growth rate, and economic benefits of poultry [21,22,23]. Preliminary experimental studies have found that the Bacillus licheniformis group (Bacillus licheniformis), Bacillus subtilis binary group (Bacillus subtilis and Enterococcus faecalis), Bifidobacterium triple group (Bifidobacterium longum, Lactobacillus bulgaricus, and Streptococcus thermophilus) and Bifidobacterium tetravalent group (Bifidobacterium, Lactobacillus acidophilus, Enterococcus faecalis, and Bacillus cereus) all improved the growth performance of fattening sheep, with the Bifidobacterium tetravalent group having the most significant effect (p < 0.05). We chose Bifidobacterium tetravalent for this experiment (Supplementary Table S1). Our research focuses on demonstrating the mechanism by which adding probiotics to the diet enhances the growth performance of fattening sheep. From multiple perspectives, including rumen microbiota, fecal microbiota, rumen metabolomics, serum metabolomics, urine metabolomics, and transcriptome sequencing of rumen epithelial cells, this will provide scientific guidance for the study of probiotics additives in ruminant feed.

2. Materials and Methods

2.1. Experimental Animals and Design

Twelve healthy Hu sheep (of similar age and weight) from Zhoushi Sheep Industry Co., Ltd. in Chuzhou, China, were selected for this experiment and randomly divided into two groups. The weight range of the fattening sheep in each group was 22.6 ± 1.9 kg. The control group (CON) was fed with a basic diet, and the formula and chemical composition are shown in Table 1. The experimental group (PRB) added probiotics (bifidobacteria quadruplex live bacteria: Bifidobacterium, Lactobacillus acidophilus, Enterococcus faecalis, and Bacillus cereus) to the control group’s diet, with a prefeeding period of 2 weeks and a formal feeding period of 2 months. During the experiment, each group was fed at a fixed time in the morning and evening, and the fattening sheep in each group fed and drank freely. Other treatments were carried out according to the daily feeding and management methods of the farm. The experimental plan was approved by the Animal Protection Committee of Anhui Agricultural University (NO: SYDW-P20190600601), and the experimental design and workflow are shown in Figure 1.

2.2. Test Samples and Data Collection

On the 1st and 60th day of the formal experiment, each group of experimental sheep was weighed, with an empty stomach before feeding, to calculate the average daily gain. The feed consumption of each group of fattening sheep during the 2-month experimental period was calculated to calculate the average daily feed intake. The feed conversion rate was calculated based on the average daily gain/average daily feed intake.
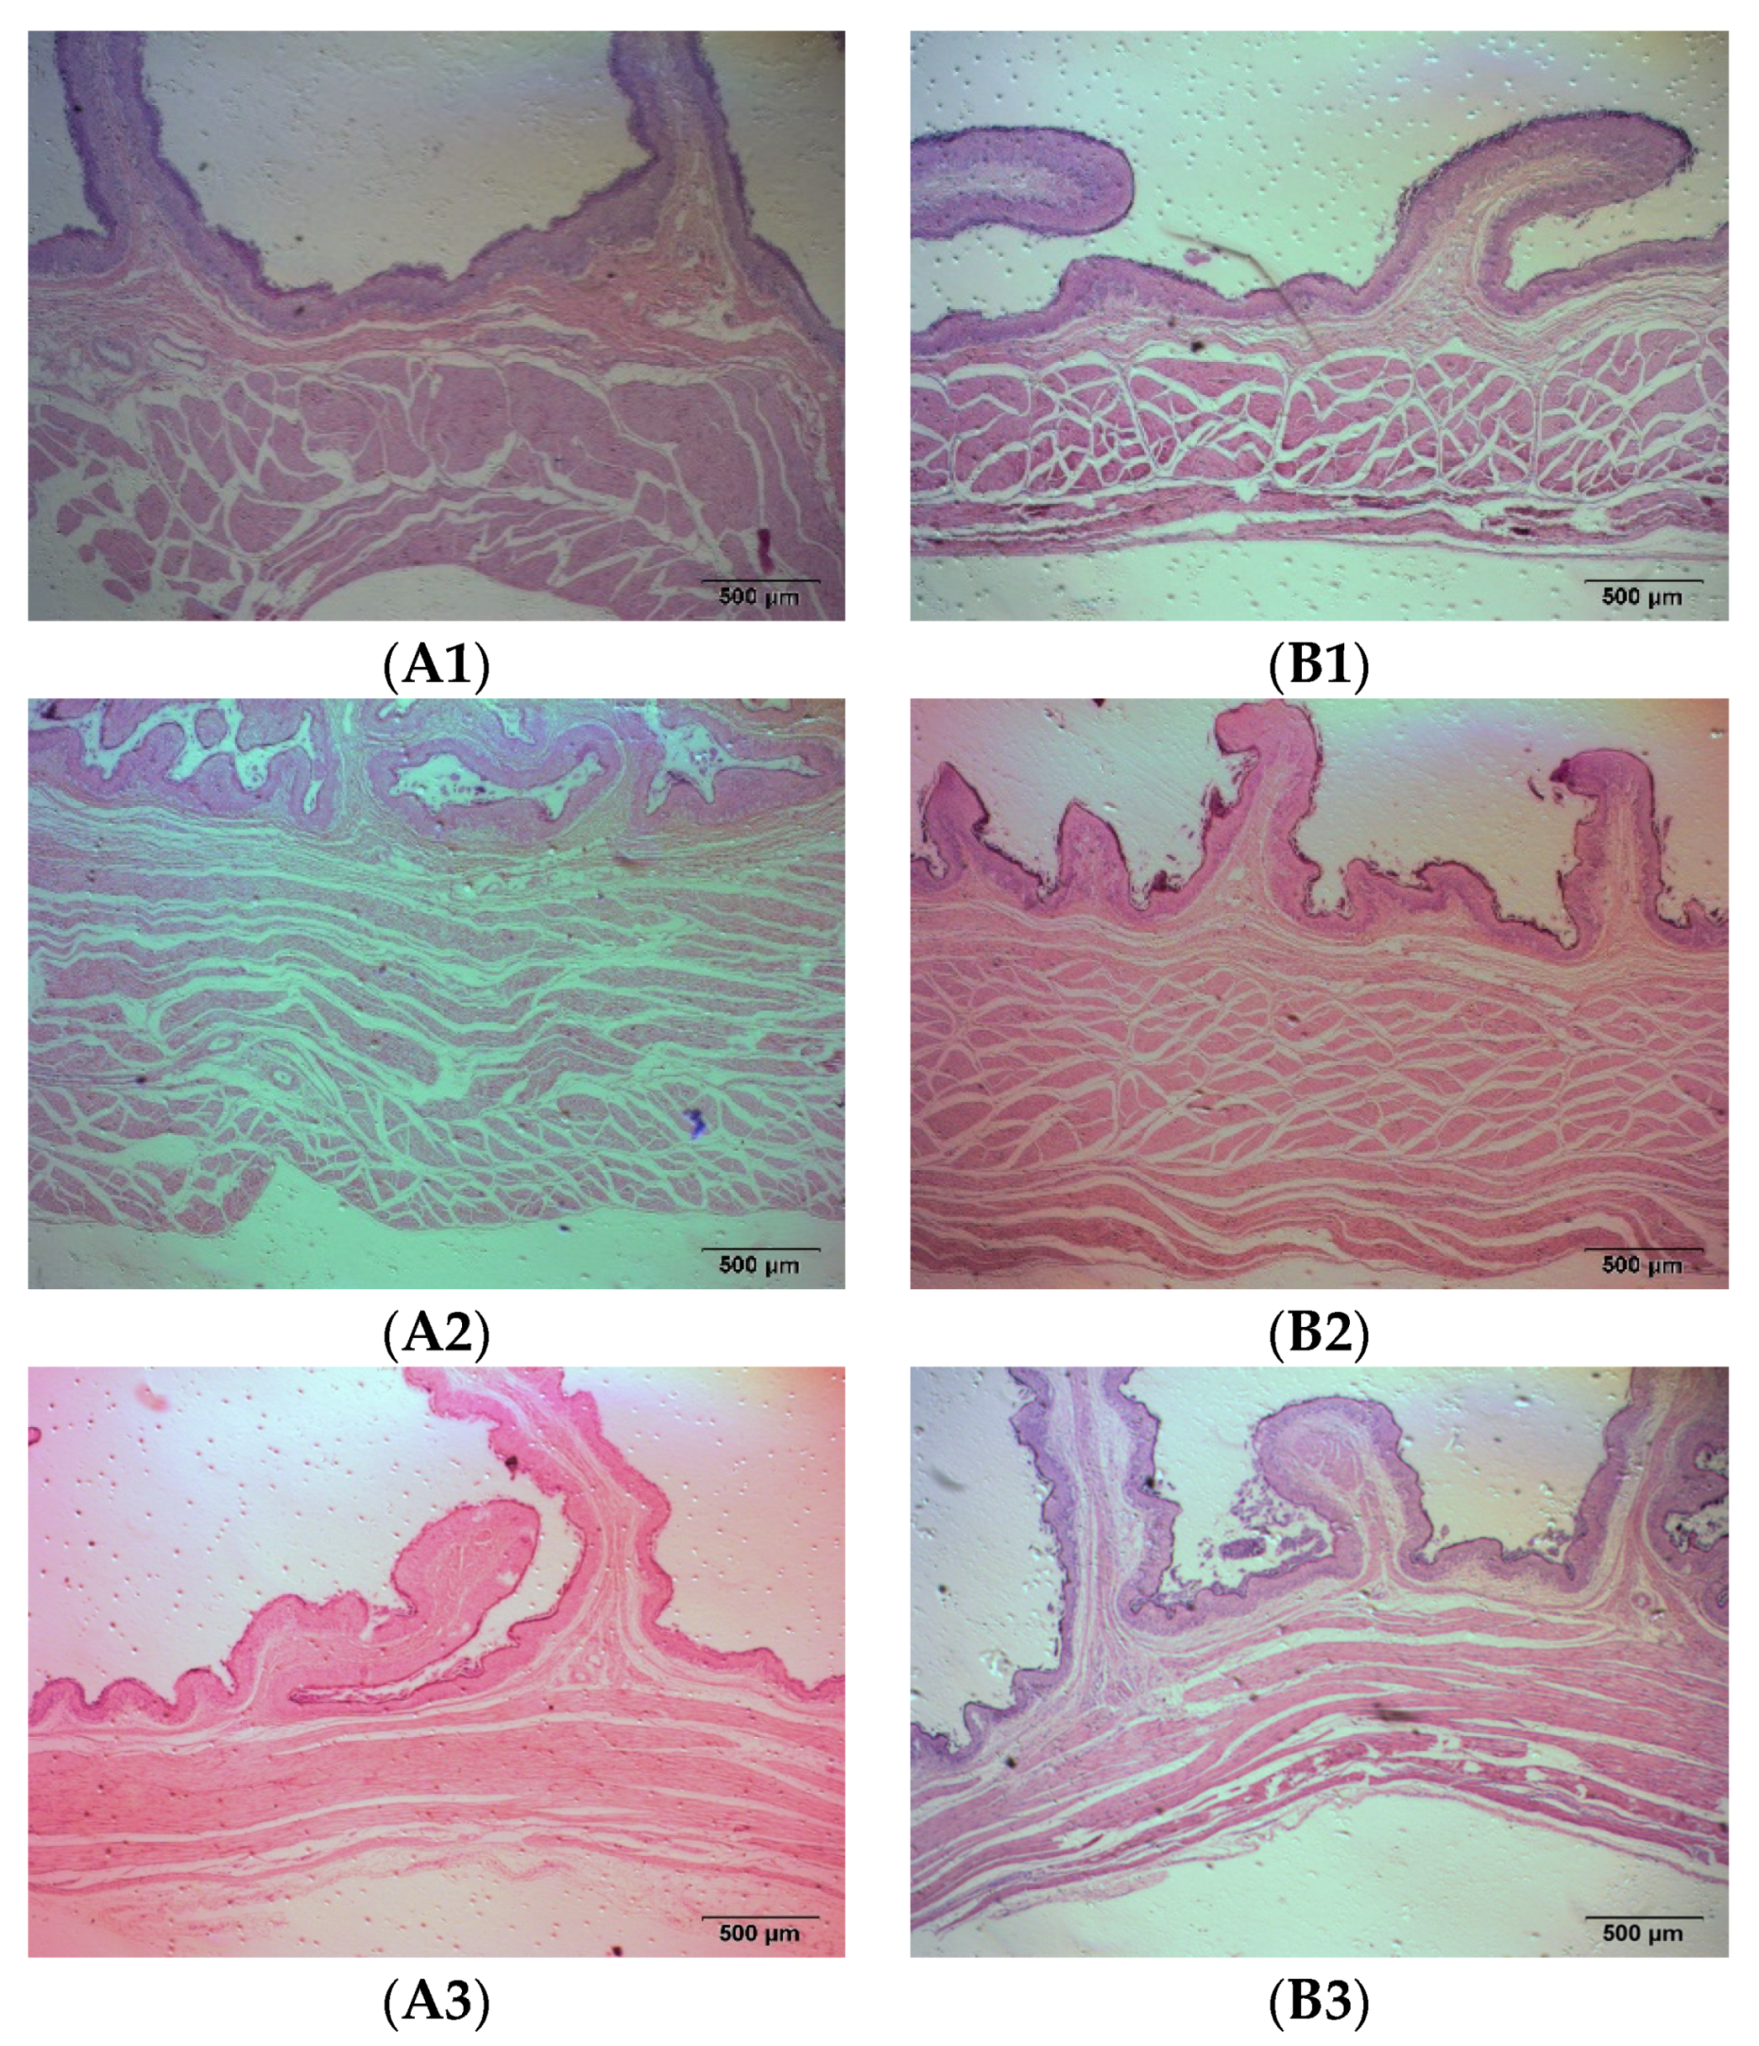
On the 60th day of the formal experiment, before feeding in the morning, the rumen fluid of each group was collected using a sheep stomach catheter. After filtering through 4 layers of gauze, it was quickly loaded into a 50 mL centrifuge tube, and centrifuged at 3000 r/min for 15 min. An amount of 1 mL was taken for analysis of the volatile fatty acids (VFAs), 2 mL was taken for a colorimetric analysis of the ammonia nitrogen content, and the remainder was stored at −80 °C for later use. An amount of 100 g of fresh fecal samples from each group of fattening sheep were collected, and store in liquid nitrogen for later use. Fasting blood was collected using a blood collection vessel without anticoagulants, and 10 mL of blood was collected from each Hu sheep and centrifuged at 3500 r/min for 15 min. The supernatant was used as the serum. The serum antioxidant indicators were analyzed using a reagent kit, including the total antioxidant capacity (T-AOC) (A015-1-2, Nanjing Institute of Biotechnology, Nanjing, China), superoxide dismutase (SOD) (A001-3-2, Nanjing Institute of Biotechnology, Nanjing, China), glutathione peroxidase (GSH-Px) (A005-1-2, Nanjing Jiancheng Institute of Biotechnology, Nanjing, China), and malondialdehyde (MDA) content (A003-1-2, Nanjing Jiancheng Institute of Biotechnology, Nanjing, China). The remaining was stored at −80 °C for future use. Fresh urine from the fattening sheep was collected and stored at −80 °C for future use. After the feeding experiment, all 12 fattening sheep in the CON and PRB groups were slaughtered (fasted for 12 h before slaughter), and the rumen epithelial tissue was collected and stored in liquid nitrogen for transcriptome sequencing. In addition, the intestinal tissue of the fattened sheep was collected, fixed with 4% paraformaldehyde solution, embedded in paraffin, and sliced. After HE staining, the morphological changes in each segment of intestinal tissue were observed.

2.3. Microbial Analysis of Rumen Fluid and Feces

Using a DNA extraction kit to extract microbial DNA from the rumen fluid and feces, 16S rRNA gene V3-V4 region universal primers were used to amplify the target sequence using a two-step PCR method. A Qubit 4.0 was used to measure the concentration of the extracted DNA and amplified sequence. Bioengineering (Shanghai, China) Co., Ltd. We used an Illumina MiSeq system for high-throughput sequencing, and analyzed the differences in microbial diversity and microbial community structure in the rumen and feces of fattening sheep between the CON and PRB groups.

2.4. Metabolomics Analysis of Rumen, Serum, and Urine

An amount of 10 μL of the previously preserved rumen fluid, serum, and urine samples were taken, and ultra-high-performance liquid chromatography–tandem quadrupole–time-of-flight mass spectrometry (UPLC-Q-TOF-MS) was used to perform a metabolomics analysis of the rumen fluid, serum, and urine of the fattening sheep. After processing and quality control of the obtained raw data, a multivariate statistical analysis was conducted; the conditions were that the p-value of Student’s t-test was less than 0.05 and the Variable Importance in the Projection (VIP) of the first principal component of the OPLS-DA model was greater than 1. Differential metabolites in the rumen fluid, serum, and urine were screened, and a metabolic pathway analysis was conducted to identify the key pathways with the highest correlation with the differential metabolites, and we analyzed the differences in the metabolites and metabolic pathways between the CON group and the PRB group of fattening sheep.

2.5. Transcriptomics Analysis

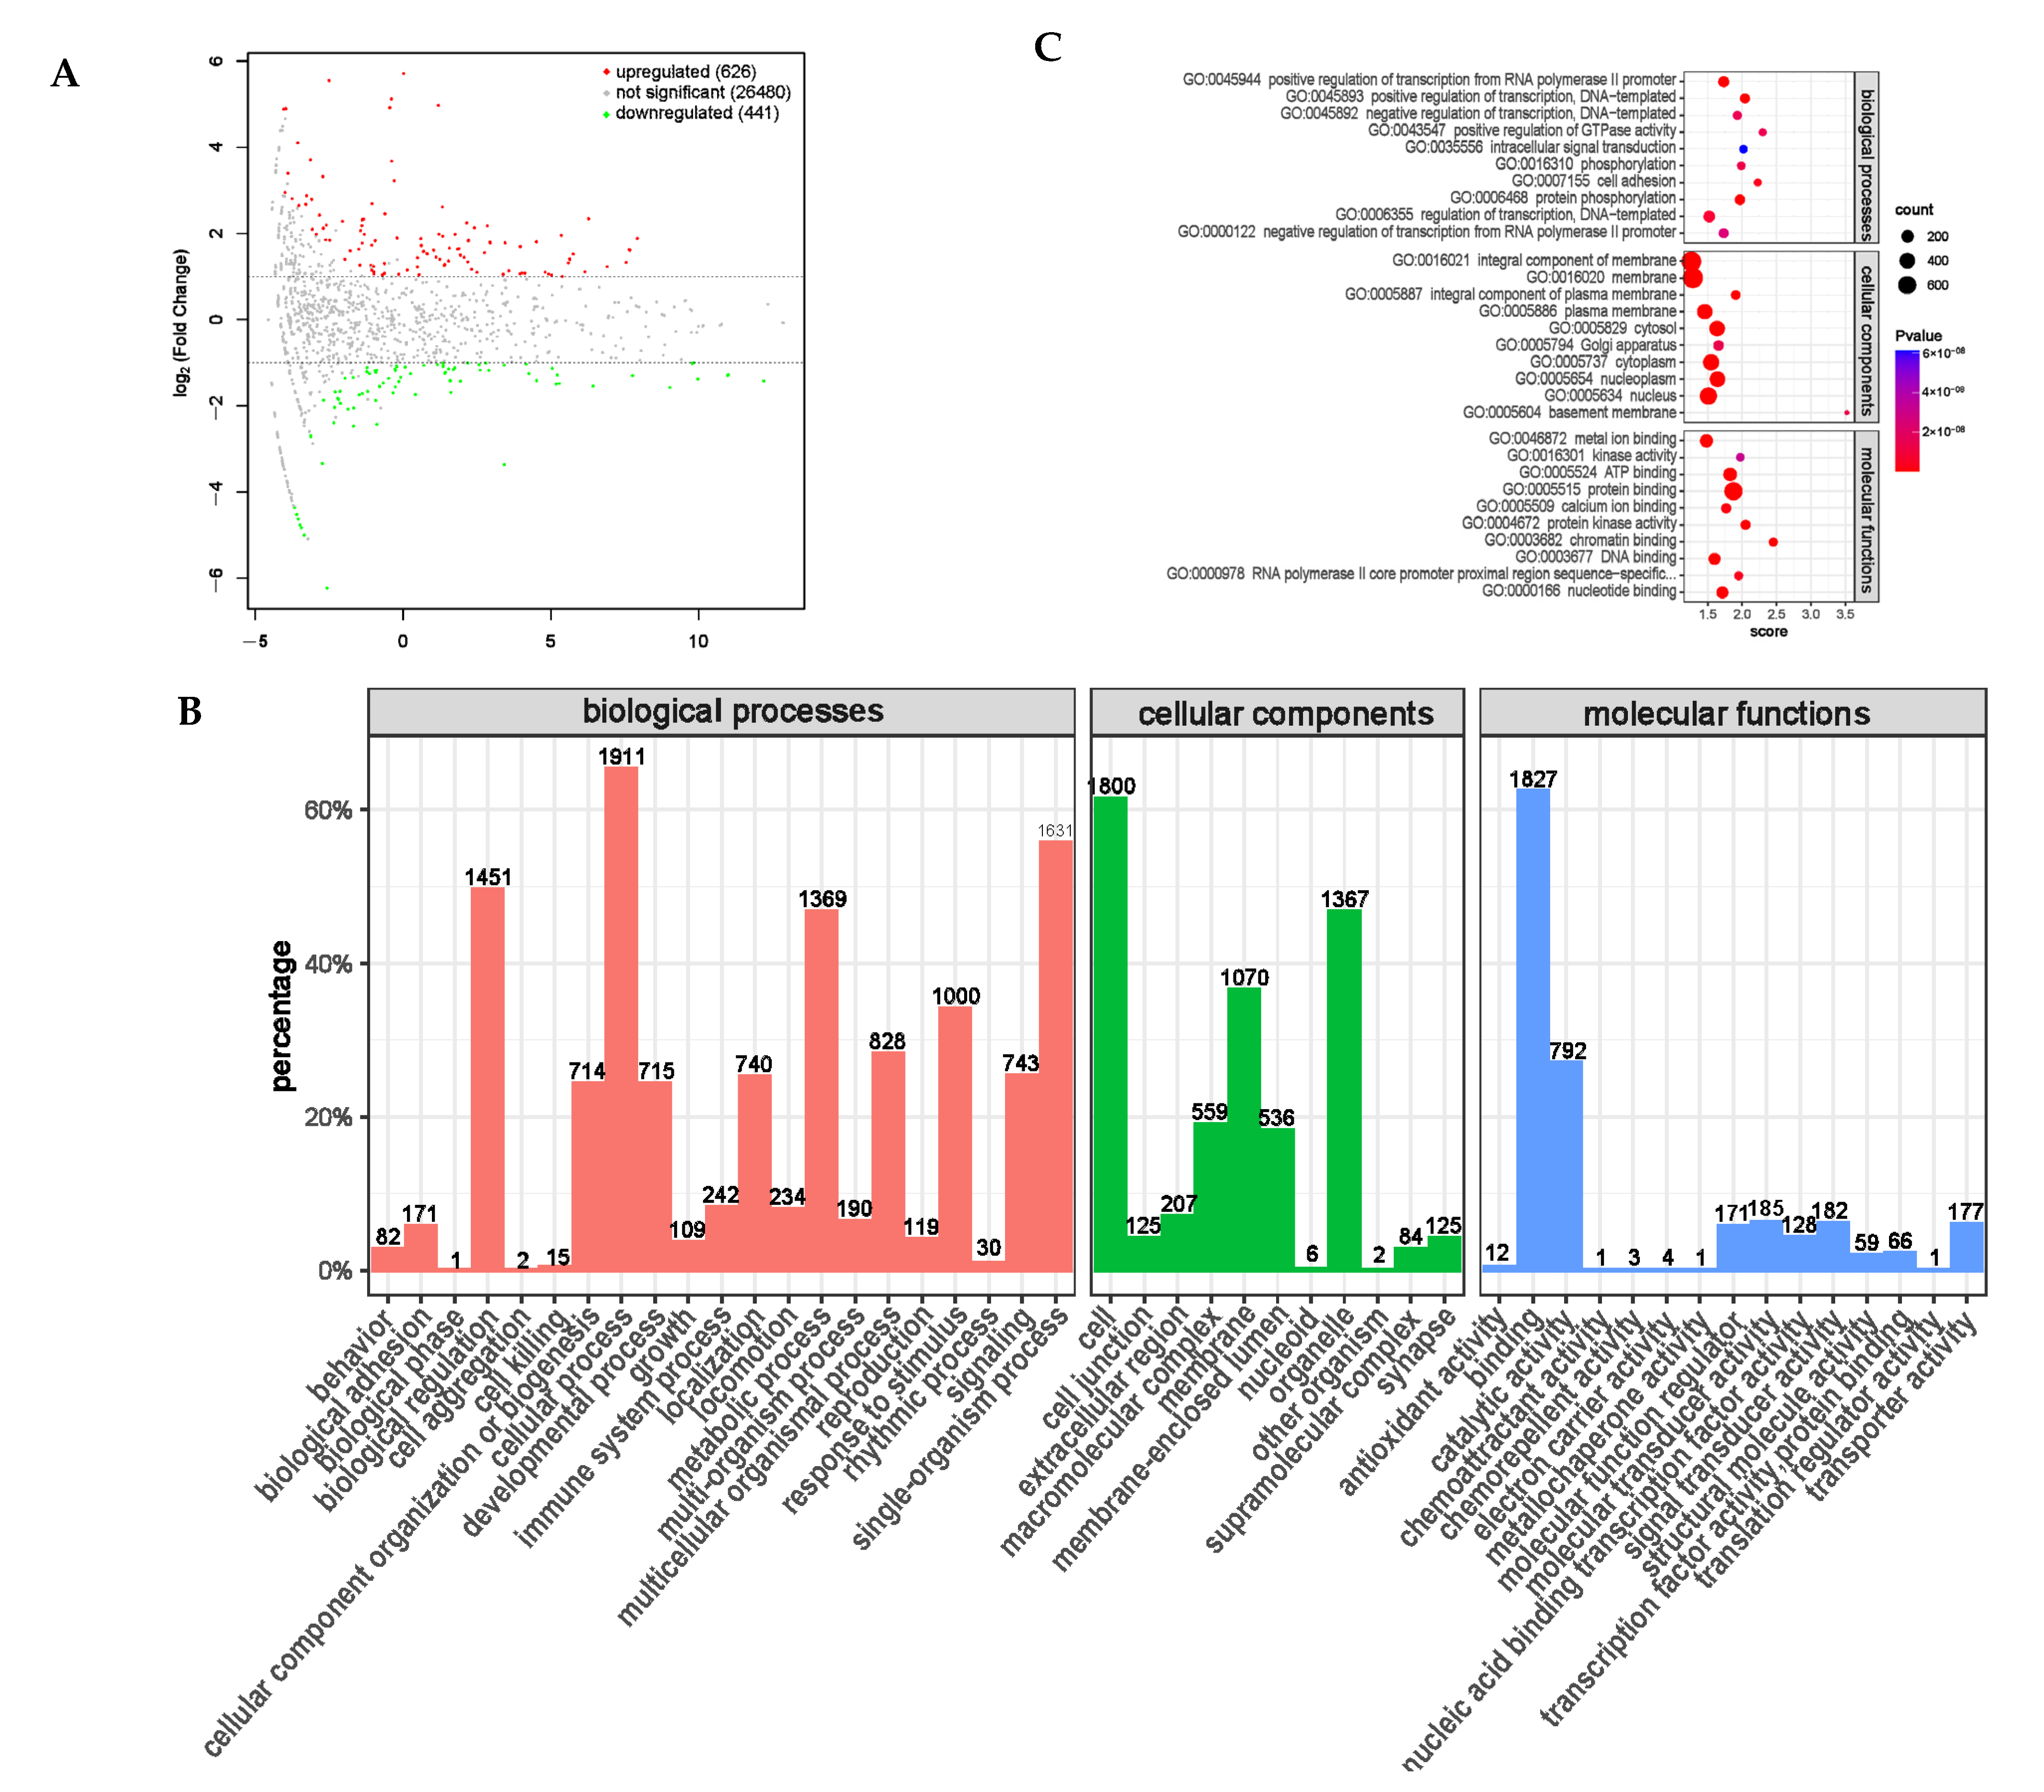
The RNA extraction and transcriptome sequencing of the rumen epithelial tissue samples were entrusted to Bioengineering (Shanghai, China) Co., Ltd. After RNA extraction, the samples were sequenced on the Illumina platform. After sequencing, data processing, and quality control, a differential expression analysis was performed using the expression level difference analysis software DESeq 2. Using a p-value < 0.05 and fold of difference |Fold Change | > 2 as the screening criteria, the differential expression of genes (DEGs) between the groups were screened. A comparative analysis was conducted between the DEGs and GO (Gene Ontology) databases to obtain the functional annotation information corresponding to the genes. Cluster Profiler was used for the functional enrichment analysis. When the p-value < 0.05, it was considered that the function was enriched, and the function of the differentially expressed genes was analyzed.

2.6. Data Analysis

The normal distribution of the data was tested using the SPSSAU Data Science Analysis Platform (https://spssau.com/, accessed on 6 February 2024). The Shapiro–Wilk test was used for normality testing. The experimental sample consisted of 6 replicates. In order to organize the data, Excel 2016 was used, and SPSS software (version 20.0, Chicago, IL, USA) was used to conduct independent sample t-tests on the data. p < 0.05 is the significant difference, and p < 0.01 is the extremely significant difference standard. The difference between the two levels is statistically significant, with p < 0.05 and p < 0.01, respectively.

3. Results

3.1. Growth and Performance

Before the formal experiment, we measured the initial weight of the CON group (6 fattening sheep) and the PRB group (6 fattening sheep). The average initial weight of the two groups was 23.40 ± 1.90 kg for the PRB group and 23.25 ± 1.54 kg for the CON group, respectively, with no significant difference (p > 0.05). After 2 months of formal feeding, the average daily gain of the PRB group of fattening sheep was 0.27 ± 0.02 kg, while that of the CON group was 0.21 ± 0.01 kg. The average daily weight gain of the PRB group of fattening sheep was significantly higher than that of the CON group (p < 0.05). The average daily feed intake was 1.20 ± 0.07 kg, with no significant difference (p > 0.05). The feed conversion rate of the PRB group was 0.225 ± 0.01, while that of the CON group was 0.170 ± 0.01. The feed conversion rate of PRB group of fattening sheep was significantly higher than that of the CON group (p < 0.05).

3.2. Morphological Characteristics of Gastrointestinal Tissue

As a ruminant, sheep have four stomachs, namely the rumen, reticulum, omasum, and abomasum. The rumen mainly has the function of storing and fermenting the feed, while the abomasum is the only digestive gland that secretes digestive enzymes and has true digestion. The rumen, reticulum, omasum, and abomasum of the fattening sheep were observed through tissue sectioning under an optical microscope, and the muscle layer thickness of the stomach was measured (Figure 2 and Table 2). Compared to the CON group, the thickness of the rumen muscle layer in the PRB group was significantly decreased (p < 0.01), while the changes in the thickness of the reticulum, omasum, and abomasum muscle layers were not significant (p > 0.05).
The intestines are the tissue that digests and absorbs nutrients and excretes feed residues in fattening sheep, including the small intestine and large intestine. The results show that adding probiotics to the diet significantly reduced the thickness of the duodenal muscle layer, increased the length of the duodenal villi, and significantly increased the thickness of the cecum and rectal mucosal muscle layer, as well as the thickness of the cecum, colon, and rectal mucosal layer in the fattening sheep (p < 0.05) (Figure 3 and Table 3).

3.3. Analysis of Rumen Fermentation Parameters and Rumen Microbiota

The rumen plays an important role in fermentation, and ammonia nitrogen in the rumen is the main nitrogen source for rumen microbial fermentation. We measured the fermentation parameters of the rumen (Table 4); the level of ammonia nitrogen in the PRB group was not significantly different from that in the CON group (p > 0.05). The total volatile fatty acid concentration in the PRB group was 88.69 mM, significantly higher than that in the CON group, at 66.10 mM (p < 0.01). The concentrations of acetate and propionate in the PRB group were 61.48 mM and 18.07 mM, respectively, significantly higher than those in the CON group, at 45.23 mM and 12.21 mM (p < 0.01). There was no significant difference in the concentrations of butyrate, valerate, and the acetate/propionate acid ratio between the PRB and CON groups (p > 0.05).
Based on the level of genus classification, the rumen microbial population was analyzed (Figure 4A). Prevotella, Methanobrevibacter, Succiniclassicum, Clostridium IV, Selenomonas, Barnesiella, and Butyrivibrio were detected in both the PRB and CON groups. Prevotella, Methanobrevibacter, and Succiniclassicum were the three dominant genera in the rumen of the fattening sheep. There were a total of five bacterial genera with significant differences between the PRB group and the CON group (p < 0.05) (Table 5). Compared to the CON group, the PRB group significantly upregulated two bacterial genera, namely Subdivision5_genera_incertae_sedis and Acinetobacter, and significantly downregulated three bacterial genera, namely Butyrivibrio, Saccharofermentans, and Fibrobacter.

3.4. Analysis of Fecal Microbiota

The community structure of the fecal microorganisms at the genus level was analyzed (Figure 4B), among which Sporobacter, Bacteroides, Ruminococcus, Alistipes, Succinivibrio, Treponema, and Clostridium_XIVa were detected in both the PRB and CON groups. Sporobacter, Bacteroides, and Ruminococcus were the three dominant genera of fecal bacteria detected in the PRB and CON groups. Four main microbial communities with significant differences between the CON and PRB groups were identified, namely Coprococcus, Porphyromonas, Anaerobacterium, and Faecalicoccus (Table 6). Compared to the CON group, the significantly upregulated genera in the PRB group were Faecalicoccus, while the significantly downregulated genera were Coprococcus, Porphyromonas, and Anaerobacteria.

3.5. Metabolomics Analysis of Rumen Fluid

Analyzing the rumen metabolite data of the 12 fattening sheep in the PRB and CON groups, a total of 188 significantly different metabolites were selected, including 60 anionic modes and 128 cationic modes (Supplementary Table S2). The distribution and change characteristics of the differential metabolites in the rumen of the two groups of fattening sheep were analyzed (Figure 5). It was observed that the differential metabolites, which mainly include organic acids and their derivatives, organic compounds, lipids and lipid-like molecules, as well as amino acids and their derivatives, are clearly distinguished from their metabolites in the rumen of the PRB and CON fattening sheep, with red indicating a relative upregulation of metabolites and blue indicating a relative downregulation of metabolites. According to the thermodynamic diagrams for anions and cations, these differential metabolites can be mainly divided into two categories: one has a total of 105 significantly downregulated differential metabolites compared to the CON group, such as L-Cystine, Coumestrol, Flutamide, N-tiglylglycine, and Diethyl sebacate. The other has a total of 73 significantly upregulated differential metabolites compared to the CON group, such as Sebacic acid, 2-hydroxy-3-methylbutyric acid, Jasmonic acid, Nicotinic acid, and Pyridoxine.
The metabolic pathway analysis of differential metabolites revealed a total of 26 metabolic pathways between the PRB and CON groups (Supplementary Table S3 and Figure 6). It was found that vitamin B6 metabolism, Nicotinate and nicotinamide metabolism, taurine and hypotaurine metabolism, Riboflavin metabolism, and alpha-linolenic acid metabolism were the main metabolic pathways.

3.6. Serum Antioxidant Capacity and Metabolomics Analysis

The serum antioxidant level of fattening sheep is of great significance for the body’s ability to resist stress and adapt to the external environment. The antioxidant indicators GSH-Px, MDA, SOD, and T-AOC in the collected serum of the fattening sheep were tested. The test results are shown in Table 7. Compared with the CON group, the SOD (p < 0.01) and T-AOC (p < 0.05) in the serum of the fattening sheep in the PRB group were significantly increased. The GSH-Px in the serum of the fattening sheep in the PRB group was slightly higher than that of the CON group, and the MDA of the PRB group was slightly lower than that of the CON group (p > 0.05).
The analysis of the serum metabolite data revealed a total of 138 significantly different metabolites, including 42 anionic modes and 96 cationic modes (Supplementary Table S4 and Figure 7). The differential metabolites were clearly distinguishable in the serum of the PRB and CON groups of fattening sheep, and were mainly divided into two categories: one had 108 significantly downregulated differential metabolites compared to the CON group, such as Eicosapentaenoic Acid, 5′-O-methylthymidine, Maltitol, L-Alanine, and Creatine; the other had a total of 30 significantly upregulated differential metabolites compared to the CON group, such as Citramalic acid, Pyrocatechol, vitamin E, Phenylethylamine, and 16-Hydroxypalmitic acid.
A total of 38 serum metabolism-related pathways were analyzed between the PRB and CON groups (Supplementary Table S5 and Figure 8) and Glycine, serine, and threonine metabolism; Terpenoid backbone biosynthesis; Arginine and proline metabolism; Phenylalanine metabolism; and beta-Alanine metabolism were the main metabolic pathways.

3.7. Urine Metabolomics Analysis

Urine, as the final excretion of metabolic products in fattening sheep, contains a large amount of metabolites and metabolic enzymes, which can reflect the biochemical metabolic status of fattening sheep; reveal changes in metabolic pathways, key metabolic pathways, and potential biomarkers; and have important research value. A total of 104 significantly different metabolites were screened, including 42 anionic modes and 62 cationic modes (Supplementary Table S6 and Figure 9). The differential metabolites were mainly divided into two types: one type had 101 significantly downregulated differential metabolites compared to the CON group, such as Gentisic acid, L-Gulonic gamma-lactone, Sulfaphenazole, 5′-Deoxyadenosine, and Palmitic acid; the other type had a total of three significantly upregulated differential metabolites compared to the CON group, Cyanuric acid, D-Mannose, and 3.alpha.-Mannobiose.
We analyzed a total of 33 pathways related to urine metabolism between the PRB and CON groups (Supplementary Table S7 and Figure 10), and found taurine and hypotaurine metabolism; Methane metabolism; Riboflavin metabolism; and Tryptophan metabolism; vitamin B6 metabolism; and Valine, leucine, and isoleucine biosynthesis were the main metabolic pathways.

3.8. Bioinformatics Analysis of circRNA Sequencing

Circular RNA (circRNA) is abundant in the cytoplasm of eukaryotic cells, mainly produced by pre-mRNA through variable splicing processing, and has many important regulatory functions [24]. It can block the inhibitory effect of miRNA on its target genes, regulate other types of RNA, and regulate protein activity [25]. circRNA is conserved in different species and has important research value. In order to screen for significantly different circRNAs, the screening conditions were set to p-value < 0.05 and the difference multiple |Fold Change| > 2, and the analysis results of significant expression differences in the circRNAs were obtained (Supplementary Table S8). We screened seven significantly differentially expressed circRNAs between the PRB and CON groups, of which three were significantly upregulated and four were significantly downregulated (Figure 11A).
For the screened differentially expressed circRNAs, GO enrichment analysis was used to study the distribution of the differentially expressed circRNA target genes using the annotation function (Figure 11B). These differentially expressed circRNAs mainly involve biological processes, such as participating in biological regulation, cellular processes, and metabolic processes. They are distributed in cellular locations, such as cells, cell components, and organelles, and participate in both binding and catalytic activity molecular functions. We used enrichment analysis to examine the biological functions of the differentially expressed circRNA target genes and identified the top-30 differentially expressed circRNA target genes with the highest degree of functional enrichment (Table 8 and Figure 11C). These circRNA target genes were mainly involved in protein modification regulation, especially histone modification and immune response expression and regulation.

3.9. Bioinformatics Analysis of lncRNA Sequencing

Long-stranded noncoding RNAs (lncRNAs) are a type of noncoding RNA with a length exceeding 200 nt that regulate gene expression at the epigenetic, transcriptional, and post-transcriptional levels by binding to DNA, RNA, or proteins [26,27,28]. A differential expression analysis was conducted on RNA transcripts, and differential expression transcripts between the PRB and CON groups were obtained (Supplementary Table S9). A total of 20 significantly differential transcripts were screened, including 6 significantly upregulated lncRNAs and 3 mRNAs, and 2 significantly downregulated lncRNAs and 9 mRNAs (Figure 12A).
A differential expression functional annotation analysis was conducted on the screened differentially expressed transcripts. The corresponding gene functions of the differentially expressed transcripts were mainly concentrated in the cellular processes, biological regulatory processes, and metabolic processes involved in biological processes; distributed in positions such as cells, cell components, and organelles; and involved in binding and catalytic active molecular functions. This is consistent with the distribution of the differentially expressed circRNA target genes using the annotation functions through a GO enrichment analysis (Figure 12B). The gene enrichment analysis identified the top-30 functions with the highest enrichment levels (Table 9 and Figure 12C). The genes corresponding to the differential transcripts of the fattening sheep fed with a probiotic diet were mainly enriched in regulating immune cell functions, such as natural killer cells and white blood cell regulation. This is consistent with probiotics increasing the number and activity of immune cells, such as increasing the number of white blood cells and natural killer cells, and improving the activity and survival ability of immune cells.

3.10. miRNA Sequencing Bioinformatics Analysis

MicroRNAs (miRNAs) are a type of RNA that plays an important regulatory role, and mRNA expression is regulated in multiple ways, among which miRNAs are one of the key regulators. miRNA is involved in various regulatory pathways, including development, viral defense, hematopoietic processes, organ formation, cell proliferation and apoptosis, and fat metabolism [29,30]. After a differential expression analysis, a total of 1067 differentially expressed miRNAs were screened, of which 626 were significantly upregulated and 441 were significantly downregulated (Figure 13A).
The functional annotation classification of the target genes for the differential miRNA targeting mRNA (Figure 13B) shows that the target genes for the differential miRNA targeting mRNA are mainly concentrated in biological processes, such as cellular processes and biological regulatory processes; are distributed in positions such as cells, organelles, and membranes; and play a role in binding and catalytic activity molecules. This was similar to the GO enrichment analysis of the distribution of circRNA and lncRNA using the annotation function. We screened the top-10 functional analysis results with the highest enrichments in each of the three ontologies (Table 10 and Figure 13C). In the fattening sheep fed with a probiotic diet, the target genes for the miRNA targeting mRNA were mainly enriched in transcriptional regulation and protein phosphorylation modification, which play an important regulatory role in protein, ATP, and nucleoside binding, and play an important role in animal growth and development.

4. Discussion

Research has shown that probiotics can play an important role as the best alternative to antibiotics, mainly through the interaction of bacteria–bacteria and host–bacteria [10]. They have many beneficial aspects, such as anti-oxidation, anti-inflammatory, anti-allergy, anti-cancer, anti-mutation, anti-diabetes, and anti-virus potential, and they can also be used as a growth promoter for animals [31,32,33,34]. Probiotics are defined as live microbial feed additives that beneficially affect host animals by enhancing intestinal balance, improving feed efficiency, nutrient absorption, and growth rate [35]. Research has found that probiotics can be used as useful bacteria with which to eliminate pathogenic bacteria, and their potential applications can help improve the growth performance of livestock and poultry, improve the digestion and absorption capacity of nutrients, promote production, and ensure the health of livestock [36,37,38]. In this study, compared with the CON group, the PRB group was fed 1.5 × 10⁸ CFU/g probiotics daily, and the average daily weight gain of the PRB group was significantly higher than that of the CON group (p < 0.05), indicating that the addition of probiotics significantly improved the growth performance of the fattening sheep, which is consistent with previous research results showing that probiotics improve livestock and poultry growth performance.
The main characteristic of ruminants is the fermentation of microorganisms in the rumen, and the rumen volume accounts for 80% of the entire stomach volume [39]. There are a large number of ciliates and bacteria in the rumen, which play an important role in the rumen fermentation process. Research has found that probiotics can regulate gastrointestinal microbiota and promote digestion [40,41]. Feeding probiotics improves the composition of the rumen microbiota in fattening sheep, enhances microbial fermentation, and facilitates the absorption and utilization of cellulose and hemicellulose into volatile fatty acids, promoting protein decomposition and synthesis [42]. The rumen muscle layer thickness of the PRB fattening sheep was significantly lower than that of the CON (p < 0.01), due to the enhanced digestion of microorganisms in the rumen, which does not require strong peristalsis of food in the rumen, resulting in a thinning of the rumen muscle layer thickness. At the same time, it reduces the energy consumption of rumen peristalsis, and this experiment confirms that supplementing with probiotics improves the composition of rumen microorganisms and improves the digestion efficiency of fattening sheep feed.
The intestine is an important site for the digestion and absorption of nutrients, and the efficient digestion and absorption of feed nutrients plays an important role in the healthy growth of livestock [43]. The intestinal villi on the surface of the duodenal intima increase the surface area of the intestine, allowing for more nutrients to be absorbed. In addition, the cells on the surface of the intestinal villi secrete more digestive enzymes, enabling efficient digestion and the absorption of feed nutrients [44]. In this experiment, the length of the duodenal villi in the PRB group was significantly higher than that in the CON group (p < 0.05), indicating that adding probiotics helps improve the digestion and absorption of nutrients in fattening sheep. The peristalsis of the intestine mainly relies on the contraction ability of the muscular layer. The developed muscular layer can promote intestinal peristalsis and enhance the absorption and utilization of nutrients. The PRB group had no significant difference except for the mucosal muscular layer of the colon (p > 0.05), while the mucosal layer and muscular layer of the cecum, colon, and rectum significantly increased, confirming that the PRB group were more efficiency at nutrient absorption and utilization (p < 0.05).
In this study, supplementing with probiotics significantly increased the total volatile fatty acid concentration (p < 0.01), indicating that probiotics have an improved effect on rumen microbial fermentation. The increase in total volatile fatty acid level indicates a high energy supply level for fattening sheep, and the average daily weight gain of the PRB group of fattening sheep significantly increased. The gastrointestinal microbiota is a signaling hub that links the host’s metabolism and immune system. Adding probiotics to the diet helps to establish and maintain suitable microbiota in the gastrointestinal tract [45].
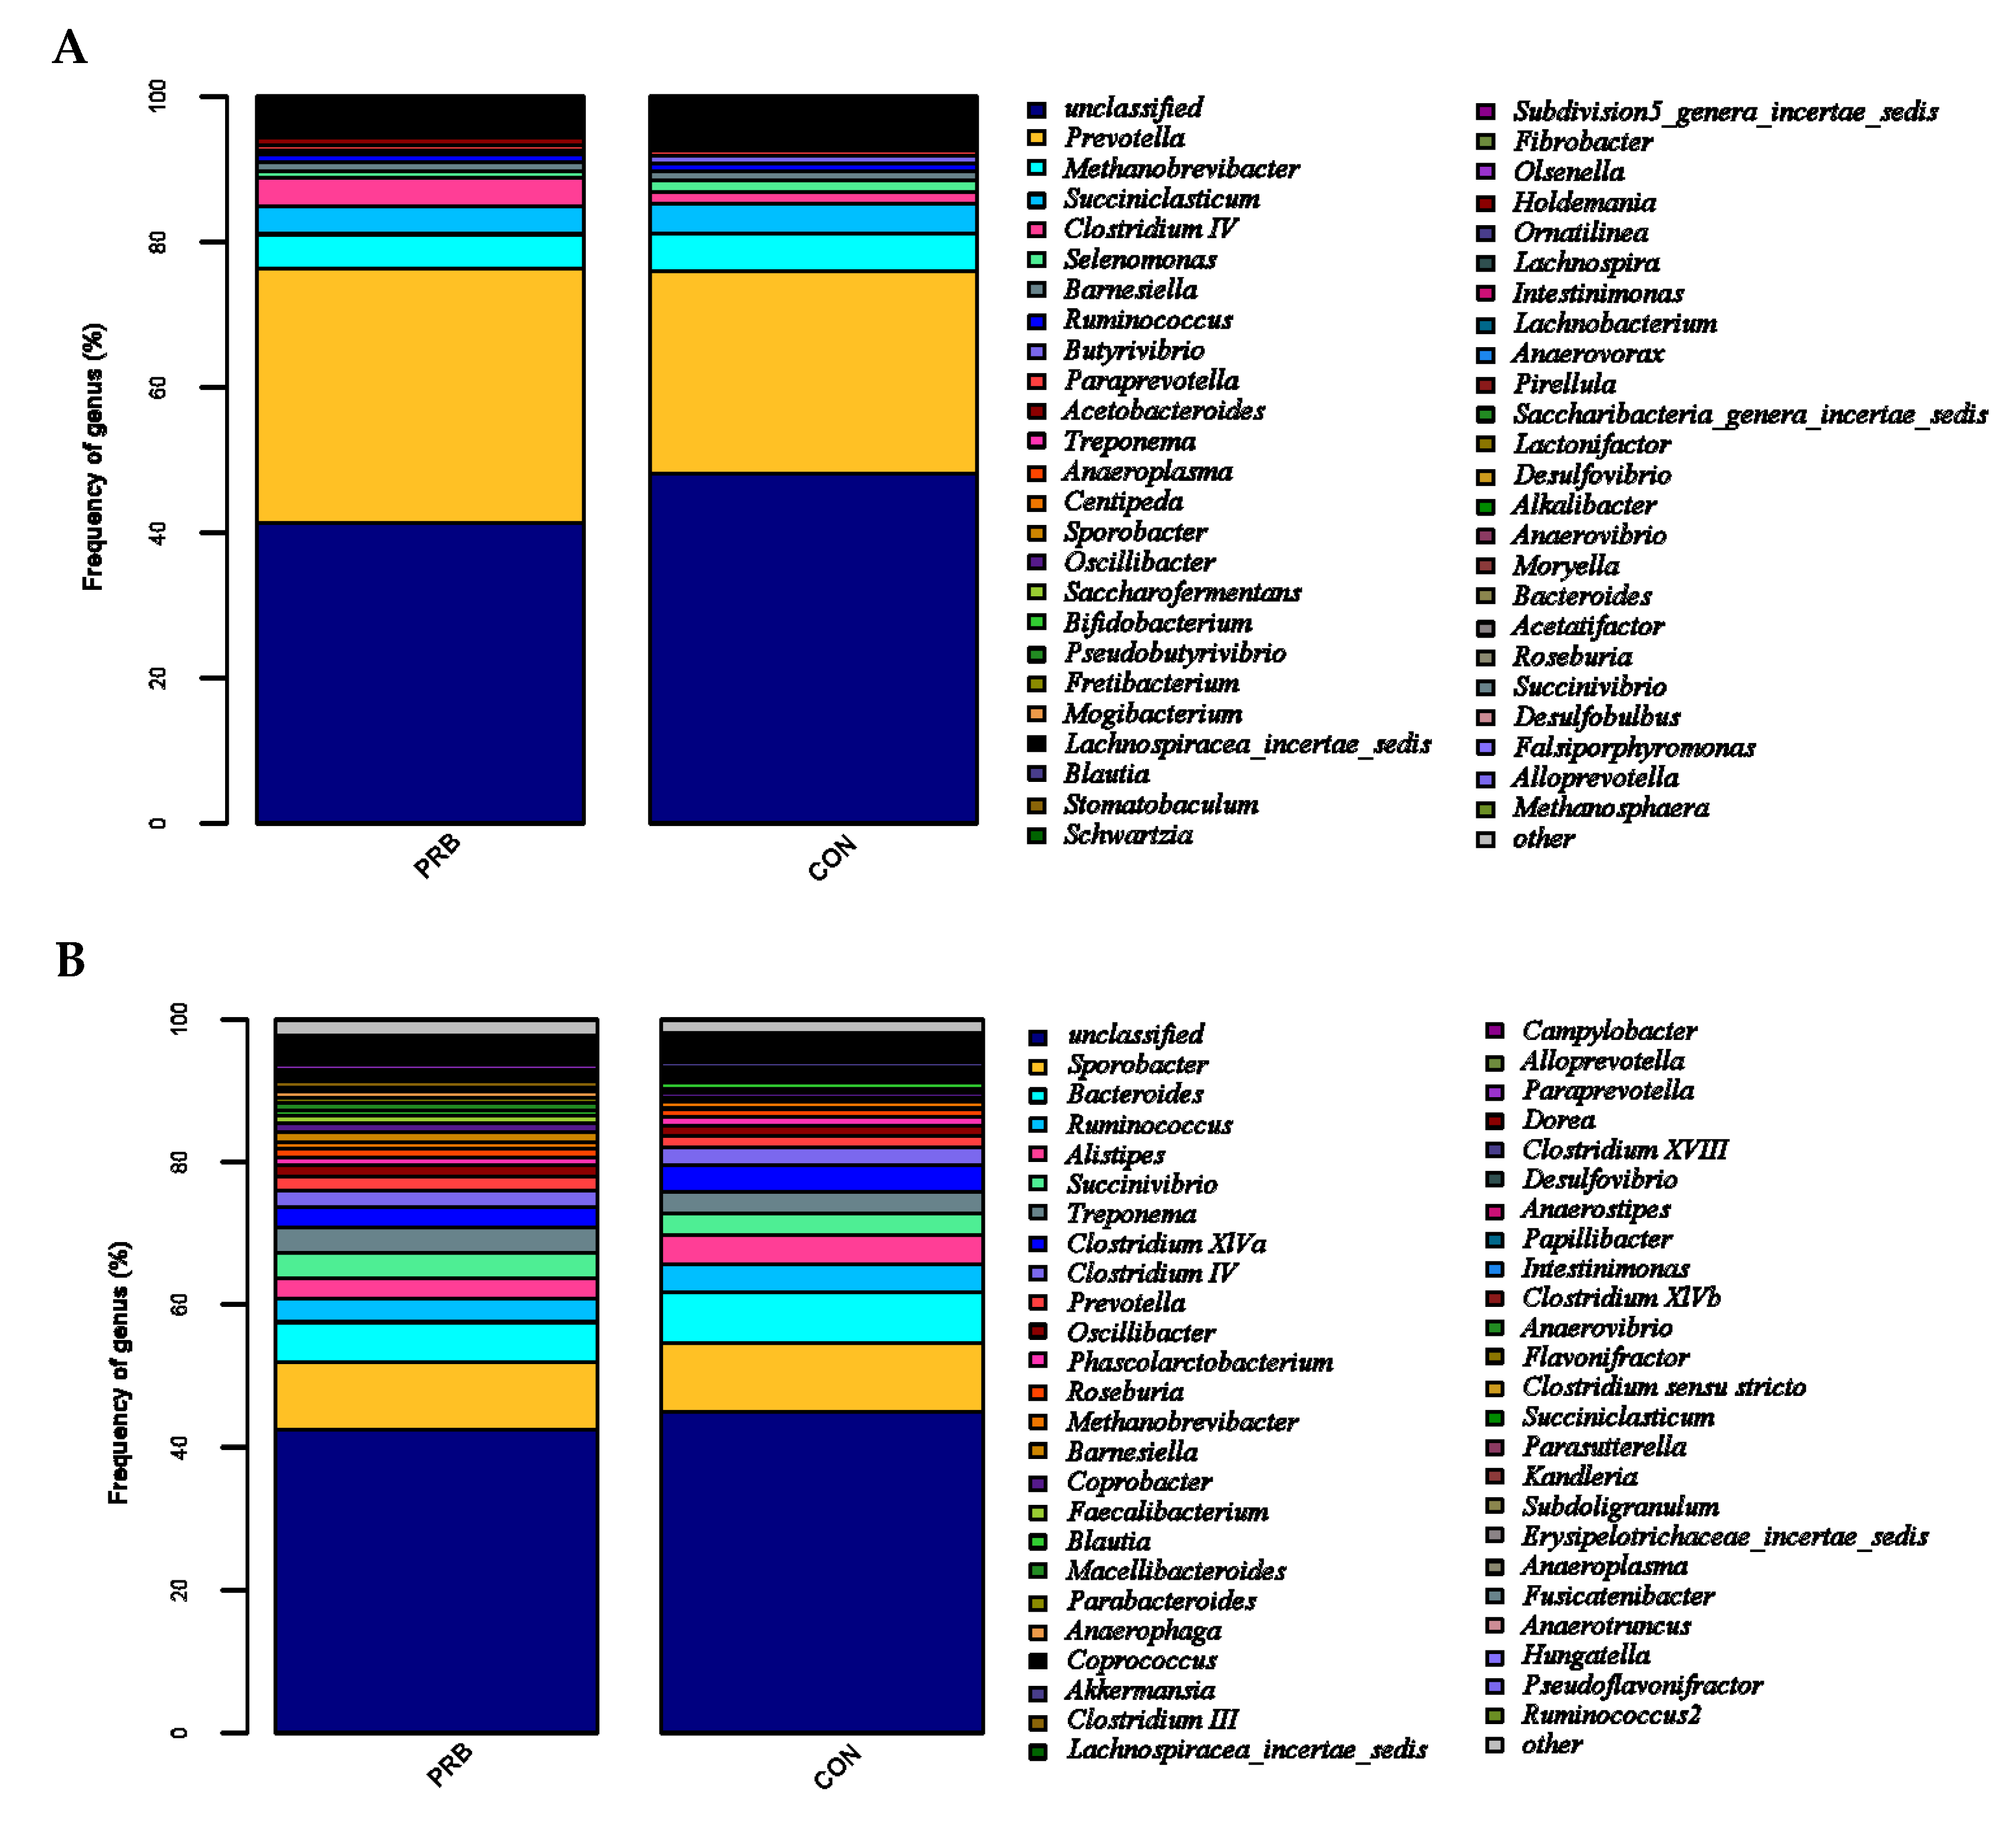
A rumen microbiota analysis revealed a significant difference between the PRB group and the CON group in their total of five bacterial genera (p < 0.05). Compared to the CON group, the PRB group significantly upregulated Subdivision5_genera_incertae_sedis and Acinetobacter, and significantly downregulated Butyrivibrio, Saccharofermentans, and Fibrobacter. The rumen, as a unique digestive organ of ruminants, plays an important role. Improving the composition of rumen microbiota by supplementing with probiotics is of great significance for improving the growth performance of fattening sheep [46]. Probiotics have been shown to have various beneficial physiological effects on animal intestines. An analysis of fecal microorganisms revealed that the significantly upregulated genus in the PRB group was Faecalicoccus, and the significantly downregulated genera included Coprococcus, Porphyromonas, and Anaerobacterium. Supplementing with probiotics in the diet is beneficial for promoting the reproduction of intestinal microbiota, maintaining the balance of intestinal microbiota, increasing intestinal patency, enhancing intestinal protective function, regulating the body’s metabolism, promoting the growth and development of fattening sheep, and enhancing immunity.
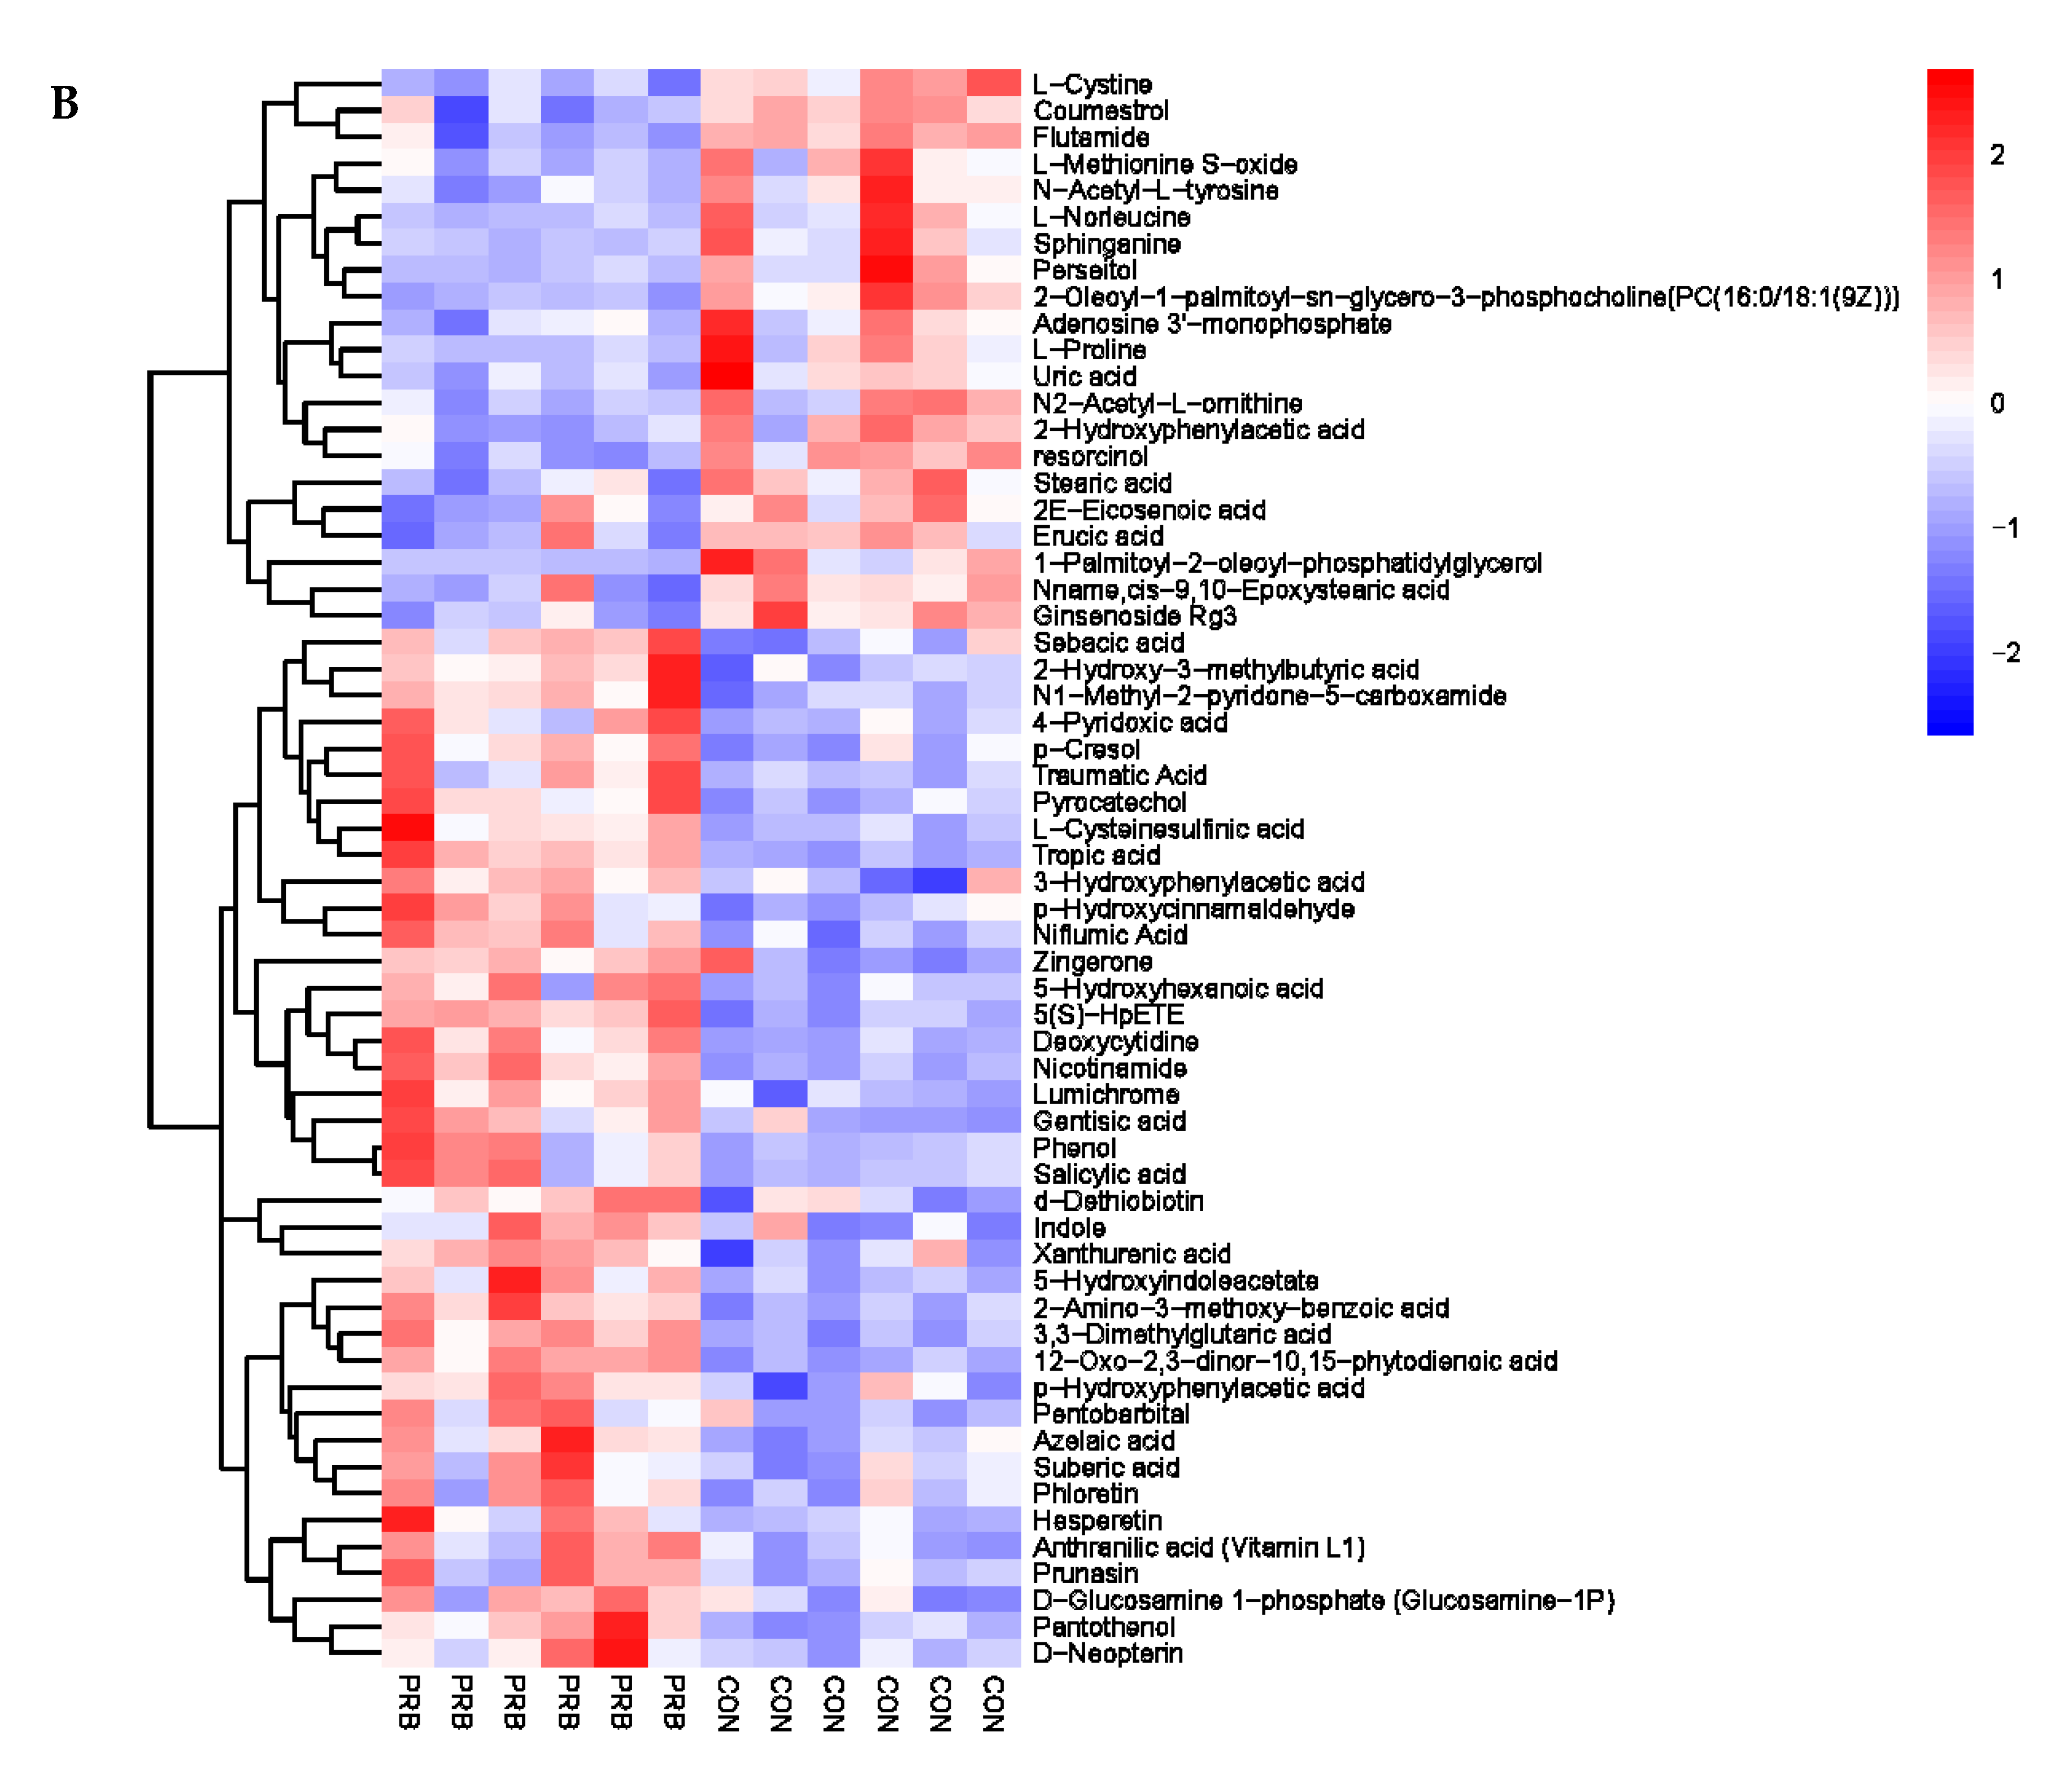
To further explore the mechanism of adding probiotics to the diet to enhance the growth performance of fattening sheep, we conducted a metabolomics analysis on the rumen fluid, serum, and urine. Significant changes in metabolites were observed in the rumen fluid, serum, and urine of fattening sheep supplemented with probiotics. The pyruvate in serum differential metabolites is mainly involved in the entire basic metabolic process through the acetyl-CoA and tricarboxylic acid cycle pathways, including the conversion between sugars, fats, and amino acids [47]. These differential metabolites play an important role in energy metabolism and amino acid metabolism.
An analysis of the key metabolic pathways found that supplementing with probiotics had an impact on taurine and taurine metabolic pathways, vitamin B6 and vitamin B2, and a series of amino acid metabolism pathways. Taurine is a widely present free amino acid that participates in many different physiological processes, such as bile acid binding, osmotic regulation, antioxidant activity, calcium signaling regulation, and liver detoxification. It is the main biosynthetic compound of the liver and can improve gastric injury through its antioxidant properties [48,49]. Vitamin B6 plays a role in the various metabolic functions of proteins, carbohydrates, and lipids. At the same time, it can also participate in the conversion of tryptophan into niacin or 5-hydroxytryptamine, which can enhance immunity [50]. Vitamin B2 is involved in the tricarboxylic acid cycle and the catalytic action of multiple enzymes in the respiratory chain, promoting glucose, fat, and protein metabolism, thereby generating energy. Its metabolites FAD and FMN can serve as coenzymes that participate in electron transfer and ATP synthesis in the mitochondrial respiratory chain, maintaining the normal respiratory function of cells. It can also serve as an antioxidant, protecting cells from free radical damage and slowing down the aging process [51]. The results of the metabolomics analysis suggest that probiotics can play a role in promoting growth and development by regulating energy and amino acid metabolism pathways.
In addition, we screened differential genes using a GO functional enrichment analysis. In the PRB and CON groups, we screened target genes with a significant differential expression of circRNA, lncRNA, mRNA, and miRNA, which are mainly related to cellular processes, biological regulation, and metabolic processes. They are mainly enriched in protein modification regulation (especially histone modification), immune function regulation, and energy metabolism pathways, which play important roles in animal growth and development.
Previous studies have found that adding probiotics to livestock and poultry feed can improve the digestive system’s beneficial microbiota, increase the feed digestion and absorption rate, and regulate the body’s immune system [52,53,54]. These studies are consistent with the mechanism of adding probiotics to improve the growth performance of fattening sheep in this experiment, supporting the finding that supplementing with probiotics can improve the growth performance of fattening sheep. In the future, we will conduct in-depth research on the mechanisms of probiotics in healthy aquaculture, laying a solid theoretical foundation for the widespread application of probiotics in the field of animal husbandry.

5. Conclusions

In summary, probiotics improve the gastrointestinal microbiota and nutritional metabolism of fattening sheep, improve the immunity and digestive and absorption functions of fattening sheep, and have a positive effect on improving the growth performance of fattening sheep. It can play the same role as antibiotics, which provides a theoretical basis for the healthy breeding of fattening sheep.

Supplementary Materials

The following supporting information can be downloaded at: https://www.mdpi.com/article/10.3390/ani14091285/s1. Table S1: Effects of different probiotics on growth performance of fattening sheep; Table S2: Significant differences in metabolites of rumen fluid between PRB and CON groups in fattening sheep; Table S3: Pathway analysis of rumen fluid metabolomics in PRB and CON groups of fattening sheep; Table S4: Significant differences in metabolites between PRB group and CON group in serum of fattening sheep; Table S5: Pathway analysis of serum metabolomics in PRB and CON groups of fattening sheep; Table S6: Significant differences in metabolites between PRB and CON groups in urine of fattening sheep; Table S7: Pathway analysis of urine metabolomics in PRB and CON groups of fattening sheep; Table S8: Analysis of significant differential expression of circRNA between PRB group and CON group; Table S9: Significant differential expression analysis of transcripts (lncRNA, mRNA) between PRB group and CON group.

Author Contributions

M.W.: Conceptualization, Data curation, and Writing—original draft. M.Y.: Investigation, Data curation, Formal analysis, and Visualization. L.W.: Writing—review and editing, Methodology, and Supervision. S.S.: Methodology and Project administration. Y.L.: Project administration, Software, and Validation. Z.Z.: Funding acquisition. H.C.: Funding acquisition and Writing—original draft and review and editing. All authors have read and agreed to the published version of the manuscript.

Funding

This work was supported by the Anhui Key Research and Development Program (2023j11020001), the Anhui Natural Science Foundation (2208085MC75), and the National Natural Science Foundation of China (32272875).

Institutional Review Board Statement

The animal study protocol was approved by the Animal 578 Ethics and Protection Committee of Anhui Agricultural University (NO: SYDW—P20190600601, date of approval: 1 June 2019).

Informed Consent Statement

Not applicable.

Data Availability Statement

The data will be made available on request.

Acknowledgments

We sincerely appreciate the support of the Anhui Province Key Laboratory of Local 582 Livestock and Poultry Genetic Resource Conservation and Bio-breeding, College of Animal Science 583 and Technology, Anhui Agricultural University.

Conflicts of Interest

The authors declare no conflicts of interest.

References

  1. Jian, Z.; Zeng, L.; Xu, T.; Sun, S.; Yan, S.; Yang, L.; Huang, Y.; Jia, J.; Dou, T. Antibiotic resistance genes in bacteria: Occurrence, spread, and control. J. Basic Microbiol. 2021, 61, 1049–1070. [Google Scholar] [CrossRef]
  2. Bacanlı, M.; Başaran, N. Importance of antibiotic residues in animal food. Food Chem. Toxicol. Int. J. Publ. Br. Ind. Biol. Res. Assoc. 2019, 125, 462–466. [Google Scholar] [CrossRef]
  3. Cameron, A.; McAllister, T.A. Could probiotics be the panacea alternative to the use of antimicrobials in livestock diets? Benef. Microbes 2019, 10, 773–799. [Google Scholar] [CrossRef] [PubMed]
  4. Xu, Y.; Yu, Y.; Shen, Y.; Li, Q.; Lan, J.; Wu, Y.; Zhang, R.; Cao, G.; Yang, C. Effects of Bacillus subtilis and Bacillus licheniformis on growth performance, immunity, short chain fatty acid production, antioxidant capacity, and cecal microflora in broilers. Poult. Sci. 2021, 100, 101358. [Google Scholar] [CrossRef]
  5. Grant, A.; Gay, C.G.; Lillehoj, H.S. Bacillus spp. as direct-fed microbial antibiotic alternatives to enhance growth, immunity, and gut health in poultry. Avian Pathol. J. W.V.P.A 2018, 47, 339–351. [Google Scholar] [CrossRef]
  6. Abd El-Hack, M.E.; El-Saadony, M.T.; Shafi, M.E.; Qattan, S.Y.A.; Batiha, G.E.; Khafaga, A.F.; Abdel-Moneim, A.E.; Alagawany, M. Probiotics in poultry feed: A comprehensive review. J. Anim. Physiol. Anim. Nutr. 2020, 104, 1835–1850. [Google Scholar] [CrossRef] [PubMed]
  7. Kulkarni, N.A.; Chethan, H.S.; Srivastava, R.; Gabbur, A.B. Role of probiotics in ruminant nutrition as natural modulators of health and productivity of animals in tropical countries: An overview. Trop. Anim. Health Prod. 2022, 54, 110. [Google Scholar] [CrossRef]
  8. Abd El-Tawab, M.M.; Youssef, I.M.; Bakr, H.A.; Fthenakis, G.C.; Giadinis, N.D. Role of probiotics in nutrition and health of small ruminants. Pol. J. Vet. Sci. 2016, 19, 893–906. [Google Scholar] [CrossRef]
  9. Raabis, S.; Li, W.; Cersosimo, L. Effects and immune responses of probiotic treatment in ruminants. Vet. Immunol. Immunopathol. 2019, 208, 58–66. [Google Scholar] [CrossRef]
  10. Mingmongkolchai, S.; Panbangred, W. Bacillus probiotics: An alternative to antibiotics for livestock production. J. Appl. Microbiol. 2018, 124, 1334–1346. [Google Scholar] [CrossRef]
  11. Agregán-Pérez, R.; Alonso-González, E.; Mejuto, J.C.; Pérez-Guerra, N. Production of a Potentially Probiotic Product for Animal Feed and Evaluation of Some of Its Probiotic Properties. Int. J. Mol. Sci. 2021, 22, 10004. [Google Scholar] [CrossRef] [PubMed]
  12. Yaqoob, M.U.; Wang, G.; Wang, M. An updated review on probiotics as an alternative of antibiotics in poultry—A review. Anim. Biosci. 2022, 35, 1109–1120. [Google Scholar] [CrossRef] [PubMed]
  13. Gao, P.; Ma, C.; Sun, Z.; Wang, L.; Huang, S.; Su, X.; Xu, J.; Zhang, H. Feed-additive probiotics accelerate yet antibiotics delay intestinal microbiota maturation in broiler chicken. Microbiome 2017, 5, 91. [Google Scholar] [CrossRef] [PubMed]
  14. Khan, S.; Moore, R.J.; Stanley, D.; Chousalkar, K.K. The Gut Microbiota of Laying Hens and Its Manipulation with Prebiotics and Probiotics to Enhance Gut Health and Food Safety. Appl. Environ. Microbiol. 2020, 86, e00600-20. [Google Scholar] [CrossRef] [PubMed]
  15. Alagawany, M.; Abd El-Hack, M.E.; Farag, M.R.; Sachan, S.; Karthik, K.; Dhama, K. The use of probiotics as eco-friendly alternatives for antibiotics in poultry nutrition. Environ. Sci. Pollut. Res. Int. 2018, 25, 10611–10618. [Google Scholar] [CrossRef] [PubMed]
  16. Rehman, A.; Arif, M.; Sajjad, N.; Al-Ghadi, M.Q.; Alagawany, M.; Abd El-Hack, M.E.; Alhimaidi, A.R.; Elnesr, S.S.; Almutairi, B.O.; Amran, R.A.; et al. Dietary effect of probiotics and prebiotics on broiler performance, carcass, and immunity. Poult. Sci. 2020, 99, 6946–6953. [Google Scholar] [CrossRef]
  17. Reuben, R.C.; Elghandour, M.; Alqaisi, O.; Cone, J.W.; Márquez, O.; Salem, A.Z.M. Influence of microbial probiotics on ruminant health and nutrition: Sources, mode of action and implications. J. Sci. Food Agric. 2022, 102, 1319–1340. [Google Scholar] [CrossRef]
  18. Ban, Y.; Guan, L.L. Implication and challenges of direct-fed microbial supplementation to improve ruminant production and health. J. Anim. Sci. Biotechnol. 2021, 12, 109. [Google Scholar] [CrossRef]
  19. Wieërs, G.; Belkhir, L.; Enaud, R.; Leclercq, S.; Philippart de Foy, J.M.; Dequenne, I.; de Timary, P.; Cani, P.D. How Probiotics Affect the Microbiota. Front. Cell. Infect. Microbiol. 2019, 9, 454. [Google Scholar] [CrossRef]
  20. Dempsey, E.; Corr, S.C. Lactobacillus spp. for Gastrointestinal Health: Current and Future Perspectives. Front. Immunol. 2022, 13, 840245. [Google Scholar] [CrossRef]
  21. Reuben, R.C.; Sarkar, S.L.; Ibnat, H.; Roy, P.C.; Jahid, I.K. Novel mono- and multi-strain probiotics supplementation modulates growth, intestinal microflora composition and haemato-biochemical parameters in broiler chickens. Vet. Med. Sci. 2022, 8, 668–680. [Google Scholar] [CrossRef]
  22. Khattab, A.A.A.; El Basuini, M.F.M.; El-Ratel, I.T.; Fouda, S.F. Dietary probiotics as a strategy for improving growth performance, intestinal efficacy, immunity, and antioxidant capacity of white Pekin ducks fed with different levels of CP. Poult. Sci. 2021, 100, 100898. [Google Scholar] [CrossRef] [PubMed]
  23. Susanti, D.; Volland, A.; Tawari, N.; Baxter, N.; Gangaiah, D.; Plata, G.; Nagireddy, A.; Hawkins, T.; Mane, S.P.; Kumar, A. Multi-Omics Characterization of Host-Derived Bacillus spp. Probiotics for Improved Growth Performance in Poultry. Front. Microbiol. 2021, 12, 747845. [Google Scholar] [CrossRef] [PubMed]
  24. Yang, L.; Wilusz, J.E.; Chen, L.L. Biogenesis and Regulatory Roles of Circular RNAs. Annu. Rev. Cell Dev. Biol. 2022, 38, 263–289. [Google Scholar] [CrossRef] [PubMed]
  25. Zhou, W.Y.; Cai, Z.R.; Liu, J.; Wang, D.S.; Ju, H.Q.; Xu, R.H. Circular RNA: Metabolism, functions and interactions with proteins. Mol. Cancer 2020, 19, 172. [Google Scholar] [CrossRef] [PubMed]
  26. Bridges, M.C.; Daulagala, A.C.; Kourtidis, A. LNCcation: LncRNA localization and function. J. Cell Biol. 2021, 220, e202009045. [Google Scholar] [CrossRef] [PubMed]
  27. Kosinska-Selbi, B.; Mielczarek, M.; Szyda, J. Review: Long non-coding RNA in livestock. Anim. Int. J. Anim. Biosci. 2020, 14, 2003–2013. [Google Scholar] [CrossRef] [PubMed]
  28. Hu, G.; Do, D.N.; Davoudi, P.; Miar, Y. Emerging Roles of Non-Coding RNAs in the Feed Efficiency of Livestock Species. Genes 2022, 13, 297. [Google Scholar] [CrossRef] [PubMed]
  29. Komatsu, S.; Kitai, H.; Suzuki, H.I. Network Regulation of microRNA Biogenesis and Target Interaction. Cells 2023, 12, 306. [Google Scholar] [CrossRef] [PubMed]
  30. van Wijk, N.; Zohar, K.; Linial, M. Challenging Cellular Homeostasis: Spatial and Temporal Regulation of miRNAs. Int. J. Mol. Sci. 2022, 23, 6152. [Google Scholar] [CrossRef]
  31. Tran, C.; Horyanto, D.; Stanley, D.; Cock, I.E.; Chen, X.; Feng, Y. Antimicrobial Properties of Bacillus Probiotics as Animal Growth Promoters. Antibiotics 2023, 12, 407. [Google Scholar] [CrossRef]
  32. Wu, Y.Y.; Nie, C.X.; Xu, C.; Luo, R.Q.; Chen, H.L.; Niu, J.L.; Bai, X.; Zhang, W. Effects of dietary supplementation with multispecies probiotics on intestinal epithelial development and growth performance of neonatal calves challenged with Escherichia coli K99. J. Sci. Food Agric. 2022, 102, 4373–4383. [Google Scholar] [CrossRef]
  33. Rajput, D.S.; Zeng, D.; Khalique, A.; Rajput, S.S.; Wang, H.; Zhao, Y.; Sun, N.; Ni, X. Pretreatment with probiotics ameliorate gut health and necrotic enteritis in broiler chickens, a substitute to antibiotics. AMB Express 2020, 10, 220. [Google Scholar] [CrossRef]
  34. Wang, H.; Huang, X.; Tan, H.; Chen, X.; Chen, C.; Nie, S. Interaction between dietary fiber and bifidobacteria in promoting intestinal health. Food Chem. 2022, 393, 133407. [Google Scholar] [CrossRef]
  35. Liao, S.F.; Nyachoti, M. Using probiotics to improve swine gut health and nutrient utilization. Anim. Nutr. (Zhongguo Xu Mu Shou Yi Xue Hui) 2017, 3, 331–343. [Google Scholar] [CrossRef]
  36. Neveling, D.P.; Dicks, L.M.T. Probiotics: An Antibiotic Replacement Strategy for Healthy Broilers and Productive Rearing. Probiotics Antimicrob. Proteins 2021, 13, 1–11. [Google Scholar] [CrossRef]
  37. Zoghi, A.; Todorov, S.D.; Khosravi-Darani, K. Potential application of probiotics in mycotoxicosis reduction in mammals and poultry. Crit. Rev. Toxicol. 2022, 52, 731–741. [Google Scholar] [CrossRef]
  38. Jeni, R.E.; Dittoe, D.K.; Olson, E.G.; Lourenco, J.; Corcionivoschi, N.; Ricke, S.C.; Callaway, T.R. Probiotics and potential applications for alternative poultry production systems. Poult. Sci. 2021, 100, 101156. [Google Scholar] [CrossRef]
  39. Zhou, M.; Peng, Y.J.; Chen, Y.; Klinger, C.M.; Oba, M.; Liu, J.X.; Guan, L.L. Assessment of microbiome changes after rumen transfaunation: Implications on improving feed efficiency in beef cattle. Microbiome 2018, 6, 62. [Google Scholar] [CrossRef]
  40. Nalla, K.; Manda, N.K.; Dhillon, H.S.; Kanade, S.R.; Rokana, N.; Hess, M.; Puniya, A.K. Impact of Probiotics on Dairy Production Efficiency. Front. Microbiol. 2022, 13, 805963. [Google Scholar] [CrossRef]
  41. Lu, J.; Chen, Z.; Chen, P.; Li, Z.; Wan, Y.; Song, Y.; Wang, F.; Zhang, Y. Dietary potential probiotics and enzymes complex modulates the performance and rumen microbiota in weaned goats. J. Appl. Microbiol. 2023, 134, lxac079. [Google Scholar] [CrossRef]
  42. Mao, H.; Ji, W.; Yun, Y.; Zhang, Y.; Li, Z.; Wang, C. Influence of probiotic supplementation on the growth performance, plasma variables, and ruminal bacterial community of growth-retarded lamb. Front. Microbiol. 2023, 14, 1216534. [Google Scholar] [CrossRef]
  43. Ducatelle, R.; Goossens, E.; Eeckhaut, V.; Van Immerseel, F. Poultry gut health and beyond. Anim. Nutr. (Zhongguo Xu Mu Shou Yi Xue Hui) 2023, 13, 240–248. [Google Scholar] [CrossRef] [PubMed]
  44. Walker, M.M.; Talley, N.J. The Role of Duodenal Inflammation in Functional Dyspepsia. J. Clin. Gastroenterol. 2017, 51, 12–18. [Google Scholar] [CrossRef] [PubMed]
  45. Sánchez, B.; Delgado, S.; Blanco-Míguez, A.; Lourenço, A.; Gueimonde, M.; Margolles, A. Probiotics, gut microbiota, and their influence on host health and disease. Mol. Nutr. Food Res. 2017, 61, 1600240. [Google Scholar] [CrossRef] [PubMed]
  46. Zhu, W.; Su, Z.; Xu, W.; Sun, H.X.; Gao, J.F.; Tu, D.F.; Ren, C.H.; Zhang, Z.J.; Cao, H.G. Garlic skin induces shifts in the rumen microbiome and metabolome of fattening lambs. Anim. Int. J. Anim. Biosci. 2021, 15, 100216. [Google Scholar] [CrossRef]
  47. Yiew, N.K.H.; Finck, B.N. The mitochondrial pyruvate carrier at the crossroads of intermediary metabolism. Am. J. Physiol. Endocrinol. Metab. 2022, 323, E33–E52. [Google Scholar] [CrossRef] [PubMed]
  48. Guan, L.; Miao, P. The effects of taurine supplementation on obesity, blood pressure and lipid profile: A meta-analysis of randomized controlled trials. Eur. J. Pharmacol. 2020, 885, 173533. [Google Scholar] [CrossRef] [PubMed]
  49. Baliou, S.; Adamaki, M.; Ioannou, P.; Pappa, A.; Panayiotidis, M.I.; Spandidos, D.A.; Christodoulou, I.; Kyriakopoulos, A.M.; Zoumpourlis, V. Protective role of taurine against oxidative stress (Review). Mol. Med. Rep. 2021, 24, 605. [Google Scholar] [CrossRef] [PubMed]
  50. Du, X.; Yang, Y.; Zhan, X.; Huang, Y.; Fu, Y.; Zhang, Z.; Liu, H.; Zhang, L.; Li, Y.; Wen, Q.; et al. Vitamin B6 prevents excessive inflammation by reducing accumulation of sphingosine-1-phosphate in a sphingosine-1-phosphate lyase-dependent manner. J. Cell. Mol. Med. 2020, 24, 13129–13138. [Google Scholar] [CrossRef]
  51. Suwannasom, N.; Kao, I.; Pruß, A.; Georgieva, R.; Bäumler, H. Riboflavin: The Health Benefits of a Forgotten Natural Vitamin. Int. J. Mol. Sci. 2020, 21, 950. [Google Scholar] [CrossRef]
  52. Kober, A.; Riaz Rajoka, M.S.; Mehwish, H.M.; Villena, J.; Kitazawa, H. Immunomodulation Potential of Probiotics: A Novel Strategy for Improving Livestock Health, Immunity, and Productivity. Microorganisms 2022, 10, 388. [Google Scholar] [CrossRef]
  53. Al-Khalaifah, H.S. Benefits of probiotics and/or prebiotics for antibiotic-reduced poultry. Poult. Sci. 2018, 97, 3807–3815. [Google Scholar] [CrossRef]
  54. Shi, S.; Liu, J.; Dong, J.; Hu, J.; Liu, Y.; Feng, J.; Zhou, D. Research progress on the regulation mechanism of probiotics on the microecological flora of infected intestines in livestock and poultry. Lett. Appl. Microbiol. 2022, 74, 647–655. [Google Scholar] [CrossRef] [PubMed]
Figure 1. Experimental design and workflow for feeding fattening sheep with probiotics diet, including rumen and fecal microbiome, rumen fluid, serum and urine metabolome, and transcriptome sequencing of rumen epithelial cells. Twelve Hu sheep were randomly assigned to a basal diet (CON) or a basal diet supplemented with 1.5 × 10⁸ CFU/g probiotics (PRB).
Animals 14 01285 g001
Figure 2. Histomorphology of stomachs of fattening sheep fed with PRB diet. (A) CON, (B) PRB; (1) rumen, (2) reticulum, (3) omasum, (4) abomasum.
Animals 14 01285 g002aAnimals 14 01285 g002b
Figure 3. Histomorphology of intestinal segments of fattening sheep fed with PRB diet. (A) CON, (B) PRB; (1) duodenum, (2) jejunum, (3) ileum, (4) cecum, (5) colon, (6) rectum.
Animals 14 01285 g003aAnimals 14 01285 g003b
Figure 4. Distribution characteristics of horizontal microbiota in the PRB group. (A) Distribution of rumen microbiota and (B) distribution of fecal microbiota.
Animals 14 01285 g004
Figure 5. Hierarchical cluster analysis of rumen metabolites in fattening sheep. (A) Hierarchical clustering analysis of PRB group in cationic mode, (B) hierarchical cluster analysis of PRB group in anionic mode. Note: The horizontal axis represents the different experimental groups, the vertical axis represents the differential metabolites compared in the group, the blue color block represents that the relative expression level of the corresponding position metabolites is downregulated, and the red color block represents upregulation.
Animals 14 01285 g005aAnimals 14 01285 g005b
Figure 6. Pathway analysis of rumen metabolomics in fattening sheep. (A) Pathway analysis of PRB group in cationic mode, (B) pathway analysis of PRB group in anionic mode. Note: The color and size of the squares indicate the impact of mint treatment on sample metabolism, while larger red squares indicate a greater impact on the pathway.
Animals 14 01285 g006
Figure 7. Hierarchical cluster analysis of serum metabolites in fattening sheep. (A) Hierarchical cluster analysis of PRB group serum in cationic mode, (B) hierarchical cluster analysis of PRB group serum in anionic mode.
Animals 14 01285 g007aAnimals 14 01285 g007b
Figure 8. Pathway analysis of serum metabolomics. (A) Pathway analysis of PRB group serum in cationic mode, (B) pathway analysis of PRB group serum in anionic mode.
Animals 14 01285 g008aAnimals 14 01285 g008b
Figure 9. Hierarchical cluster analysis of urine metabolites in fattening sheep. (A) Hierarchical cluster analysis of PRB group urine in cationic mode, (B) hierarchical cluster analysis of PRB group urine in anionic mode.
Animals 14 01285 g009
Figure 10. Pathway analysis of urine metabolomics. (A) Pathway analysis of PRB group urine in cationic mode, (B) pathway analysis of PRB group urine in anionic mode.
Animals 14 01285 g010
Figure 11. Differential expression analysis of circRNA between PRB group and CON group. (A) circRNA expression differential MA map. The horizontal axis represents the mean of log2 (RPKM) between the samples, with log2 (A) + log2 (B))/2, and the vertical axis represents the value of log2 (Fold Change), which is the value of log2 (B,A). Each point on the graph represents a transcript, with red indicating upregulation, green indicating downregulation, and black indicating nondifferential transcripts. (B) Differential expression of circRNA host gene functional annotation classification histogram. The horizontal axis represents the functional classification, while the vertical axis represents the number of genes within the classification (right) and their percentage in the total number of annotated genes (left). Different colors represent different classifications; light colors represent the host genes, and dark colors represent all genes. (C) A scatter plot of the top-30 functions with significant enrichment of differential circRNA. The vertical axis represents functional annotation information, while the horizontal axis represents the Rich factor corresponding to the function. The size of the Qvalue is represented by the color of the dot. The smaller the Qvalue, the closer the color is to red. The number of differentially expressed circRNA host genes included in each function is represented by the size of the dot.
Animals 14 01285 g011
Figure 12. Differential expression analysis of transcriptome (lncRNA, mRNA) between PRB group and CON group. (A) Transcript expression differential MA map. (B) Differential transcript GO annotation classification bar chart. (C) Scatter plot of top-30 functions with significant enrichment of differential transcripts.
Animals 14 01285 g012
Figure 13. Differential expression analysis of miRNA between PRB group and CON group. (A) miRNA expression differential MA map. (B) Differential expression miRNA GO annotation classification histogram. (C) Top 10 × 3 (biological process, cellular component, and molecular function, top 10 for each) functional scatter plot shows significant enrichment of differential miRNAs.
Animals 14 01285 g013
Table 1. Main components of the diet for fattening sheep during the experimental period.
ItemCONPRB
Ingredient (%)
Ground corn grain28.0028.00
Soybean meal, 43.5% CP15.0015.00
Rapeseed meal, 36.3% CP9.009.00
Wheat bran4.004.00
Sodium bicarbonate1.001.00
Salt1.001.00
Dicalcium phosphate0.500.50
Calcium carbonate0.500.50
Premix 11.001.00
Peanut straw15.0015.00
Soybean straw25.0025.00
Probiotics (CFU/g)0.001.5 × 108
Chemical composition (%)
CP15.1015.10
NDF38.7038.70
ADF23.2023.20
Ether extract3.103.10
Calcium0.750.75
Total phosphorus0.430.43
Metabolizable energy 2, MJ/kg9.839.83
Abbreviations: CON = control diet; PRB = Probiotic Bifidobacterium tetraureticum. 1 Formulated to provide (per kilogram of premix) 600,000 IU of vitamin A, 80,000 IU of vitamin D3, 5000 IU of vitamin E, 8000 mg of Zn, 60 mg of Se, 200 mg of I, 9400 mg of Fe, 72 mg of Co, 10,400 mg of Mn, and 1600 mg of Cu. 2 Calculated according to Ministry of Agriculture of P.R. China, 2004.
Table 2. The measurement of gastric tissue thickness.
ItemTreatmentSEMp-Value
CONPRB
Rumen, μm1010.62 A762.14 B20.2770.000
Reticulum, μm1335.281214.4248.6550.072
Omasum, μm706.78751.0433.2850.232
Abomasum, μm451.64411.7114.3400.060
Note: Means in the same row with different superscripts A, B are significantly different, with p < 0.01.
Table 3. The measurement of intestine tissue thickness.
PositionItemTreatmentSEMp-Value
CONPRB
Duodenum, μmMuscularis431.17 a335.07 b15.2350.032
Villus383.11 b497.72 a14.7470.041
Jejunum, μmMuscularis272.98253.2010.1340.321
Villus362.08303.8319.8710.063
Ileum, μmMuscularis161.41191.147.4680.058
Villus276.27292.316.8870.071
Cecum, μmMuscularis mucosae344.66 b507.54 a10.4760.036
Mucosa396.35 b565.47 a13.3940.041
Colon, μmMuscularis mucosae276.68241.486.4770.078
Mucosa535.91 b690.99 a19.2420.021
Rectum, μmMuscularis mucosae363.97 b496.48 a6.0810.036
Mucosa351.72 b490.60 a17.7610.019
Note: Means in the same row with different superscripts a, b are significantly different, with p < 0.05.
Table 4. Rumen fermentation characteristics of probiotics diet treatment.
ItemTreatmentSEMp-Value
CONPRB
Ammonia nitrogen, mg/dL6.218.521.4830.140
Total volatile fatty acid, mM66.10 B88.69 A4.0550.000
Acetate, mM45.23 B61.48 A3.2580.000
Propionate, mM12.21 B18.07 A1.0900.000
Butyrate, mM7.858.330.3450.187
Valerate, mM0.810.800.0650.909
Acetate: Propionate3.713.450.2170.250
Note: Means in the same row with different superscripts A, B are significantly different, with p < 0.01.
Table 5. Significant changes in the main microbial communities in the rumen of the PRB diet group.
PhylumGenusTreatmentSEMp-Value
CONPRB
FirmicutesButyrivibrio1.095 A0.522 B0.1750.005
BacteroidetesSaccharofermentans0.325 a0.183 b0.0660.049
VerrucomicrobiaSubdivision5_genera_incertae_sedis0.065 b0.190 a0.0450.013
FibrobacteresFibrobacter0.222 a0.048 b0.0750.036
ProteobacteriaAcinetobacter0.023 b0.035 a0.0050.031
Note: Means in the same row with different superscripts a, b are significantly different, with p < 0.05, and A, B with p < 0.01.
Table 6. Change characteristics of the main microbial communities in the feces of the PRB diet group.
PhylumGenusTreatmentSEMp-Value
CONPRB
FirmicutesCoprococcus0.700 B0.387 A0.1750.005
Faecalicoccus0.018 b0.085 a0.0050.031
BacteroidetesPorphyromonas0.127 a0.022 b0.0660.049
Anaerobacterium0.085 a0.028 b0.0450.013
Note: Means in the same row with different superscripts a, b are significantly different, with p < 0.05, and A, B with p < 0.01.
Table 7. Effect of PRB diet on serum antioxidant capacity of fattening sheep.
ItemTreatmentSEMp-Value
CONPRB
GSH-Px (U/mL)287.419288.38720.2130.962
MDA (nmol/mL)2.9702.1790.6340.232
SOD (U/mL)15.551 B20.673 A1.4930.004
T-AOC (U/mL)0.288 b0.473 a0.0820.041
Note: Means in the same row with different superscripts a, b are significantly different, with p < 0.05, and A, B with p < 0.01. GSH-Px, glutathione peroxidase; MDA, malondialdehyde; SOD, superoxide dismutase; T-AOC, total antioxidant capacity.
Table 8. Thirty significantly enriched differential circRNAs in the PRB diet group.
GO.ID 1Term 2Ontology 3Significant 4Annotated 5p-Value 6
GO:2000758positive regulation of peptidyl-lysine acetylationbiological process1/723/14,6200.011
GO:2000756regulation of peptidyl-lysine acetylationbiological process1/745/14,6200.021
GO:1990164histone H2A phosphorylationbiological process1/73/14,6200.001
GO:1905269positive regulation of chromatin organizationcellular component1/781/14,6200.038
GO:1901985positive regulation of protein acetylationbiological process1/731/14,6200.015
GO:1901983regulation of protein acetylationbiological process1/754/14,6200.026
GO:0090090negative regulation of canonical Wnt signaling pathwaybiological process1/792/14,6200.043
GO:0071347cellular response to interleukin-1biological process1/746/14,6200.022
GO:0070555response to interleukin-1biological process1/756/14,6200.027
GO:0070498interleukin-1-mediated signaling pathwaybiological process1/717/14,6200.008
GO:0065009regulation of molecular functionbiological process3/71871/14,6200.049
GO:0051336regulation of hydrolase activitybiological process2/7806/14,6200.053
GO:0051092positive regulation of NF-kappaB transcription factor activitybiological process1/793/14,6200.043
GO:0043990histone H2A-S1 phosphorylationbiological process1/71/14,6200.000
GO:0043988histone H3-S28 phosphorylationbiological process1/73/14,6200.001
GO:0043987histone H3-S10 phosphorylationbiological process1/73/14,6200.001
GO:0035404histone–serine phosphorylationbiological process1/77/14,6200.003
GO:0035066positive regulation of histone acetylationbiological process1/721/14,6200.010
GO:0035065regulation of histone acetylationbiological process1/740/14,6200.019
GO:0034063stress granule assemblybiological process1/713/14,6200.006
GO:0033129positive regulation of histone phosphorylationbiological process1/75/14,6200.002
GO:0033127regulation of histone phosphorylationbiological process1/710/14,6200.005
GO:0032606type I interferon productionbiological process1/759/14,6200.028
GO:0031058positive regulation of histone modificationbiological process1/768/14,6200.032
GO:0031056regulation of histone modificationbiological process1/7110/14,6200.052
GO:0018393internal peptidyl-lysine acetylationbiological process1/7113/14,6200.053
GO:0016573histone acetylationbiological process1/7111/14,6200.052
GO:0016572histone phosphorylationbiological process1/732/14,6200.015
GO:0006457protein foldingbiological process1/7113/14,6200.053
GO:0002244hematopoietic progenitor cell differentiationbiological process1/782/14,6200.039
1 GO.ID: number and name of GO. 2 Term: description information about GO function. 3 Ontology: category of GO (cellular component, biological process, or molecular function). 4 Significant: number of differentially expressed circRNA host genes annotated to the GO/number of differentially expressed circRNA host genes annotated to the GO database. 5 Annotated: number of genes annotated to the GO/number of genes annotated to the GO database. 6 p-value: obtained from the t-test of the substance in this group comparison.
Table 9. Gene functions corresponding to 30 significantly enriched differential transcripts in the PRB group.
GO.IDTermOntologySignificantAnnotatedp-Value
GO:1903671negative regulation of sprouting angiogenesisbiological process1/1018/14,6200.012
GO:0090160Golgi-to-lysosome transportbiological process1/107/14,6200.005
GO:0090051negative regulation of cell migration involved in sprouting angiogenesisbiological process1/1012/14,6200.008
GO:0060136embryonic process involved in female pregnancybiological process1/105/14,6200.003
GO:0048757pigment granule maturationbiological process1/107/14,6200.005
GO:0045954positive regulation of natural killer cell-mediated cytotoxicitybiological process1/1019/14,6200.013
GO:0043485endosome-to-pigment granule transportbiological process1/107/14,6200.005
GO:0043482cellular pigment accumulationbiological process1/107/14,6200.005
GO:0043476pigment accumulationbiological process1/107/14,6200.005
GO:0043323positive regulation of natural killer cell degranulationbiological process1/102/14,6200.001
GO:0043321regulation of natural killer cell degranulationbiological process1/102/14,6200.001
GO:0043320natural killer cell degranulationbiological process1/106/14,6200.004
GO:0043302positive regulation of leukocyte degranulationbiological process1/1013/14,6200.009
GO:0043300regulation of leukocyte degranulationbiological process1/1023/14,6200.016
GO:0042269regulation of natural killer cell-mediated cytotoxicitybiological process1/1024/14,6200.016
GO:0035646endosome-to-melanosome transportbiological process1/107/14,6200.005
GO:0034058endosomal vesicle fusionbiological process1/107/14,6200.005
GO:0032816positive regulation of natural killer cell activationbiological process1/1017/14,6200.012
GO:0030948negative regulation of vascular endothelial growth factor receptor signaling pathwaybiological process1/108/14,6200.006
GO:0030947regulation of vascular endothelial growth factor receptor signaling pathwaybiological process1/1019/14,6200.013
GO:0019184nonribosomal peptide biosynthetic processbiological process1/109/14,6200.006
GO:0015986ATP synthesis-coupled proton transportbiological process1/1020/14,6200.014
GO:0015985energy-coupled proton transport, down electrochemical gradientbiological process1/1020/14,6200.014
GO:0009069serine family amino acid metabolic processbiological process1/1023/14,6200.016
GO:0006896Golgi-to-vacuole transportbiological process1/107/14,6200.005
GO:0006750glutathione biosynthetic processbiological process1/108/14,6200.006
GO:0006536glutamate metabolic processbiological process1/1016/14,6200.011
GO:0006534cysteine metabolic processbiological process1/1010/14,6200.007
GO:0002717positive regulation of natural killer cell-mediated immunitybiological process1/1019/14,6200.013
GO:0002323natural killer cell activation involved in immune responsebiological process1/1010/14,6200.007
Table 10. Gene functions of 30 significantly enriched differential miRNAs targeting mRNA in the PRB group.
GO.IDTermOntologyGene Ratio 1Bg Ratio 2p-Value
GO:0006468protein phosphorylationbiological process123/2925579/27,0540.000
GO:0045893positive regulation of transcription, DNA templatedbiological process99/2925448/27,0540.000
GO:0045944positive regulation of transcription from RNA polymerase II promoterbiological process145/2925775/27,0540.000
GO:0007155cell adhesionbiological process57/2925237/27,0540.000
GO:0006355regulation of transcription, DNA templatedbiological process173/29251051/27,0540.000
GO:0016310phosphorylationbiological process70/2925326/27,0540.000
GO:0043547positive regulation of GTPase activitybiological process49/2925197/27,0540.000
GO:0045892negative regulation of transcription, DNA templatedbiological process75/2925360/27,0540.000
GO:0000122negative regulation of transcription from RNA polymerase II promoterbiological process100/2925533/27,0540.000
GO:0035556intracellular signal transductionbiological process61/2925279/27,0540.000
GO:0005654nucleoplasmcellular component399/29252246/27,0540.000
GO:0005634nucleuscellular component521/29253186/27,0540.000
GO:0005829cytosolcellular component385/29252176/27,0540.000
GO:0005737cytoplasmcellular component438/29252612/27,0540.000
GO:0016020membranecellular component788/29255691/27,0540.000
GO:0005886plasma membranecellular component381/29252418/27,0540.000
GO:0016021integral component of membranecellular component709/29255188/27,0540.000
GO:0005887integral component of plasma membranecellular component91/2925442/27,0540.000
GO:0005604basement membranecellular component24/292563/27,0540.000
GO:0005794Golgi apparatuscellular component122/2925682/27,0540.000
GO:0005515protein bindingmolecular function584/29252880/27,0540.000
GO:0005524ATP bindingmolecular function262/29251328/27,0540.000
GO:0000166nucleotide bindingmolecular function193/29251042/27,0540.000
GO:0004672protein kinase activitymolecular function115/2925519/27,0540.000
GO:0003682chromatin bindingmolecular function76/2925287/27,0540.000
GO:0003677DNA bindingmolecular function194/29251122/27,0540.000
GO:0046872metal ion bindingmolecular function234/29251462/27,0540.000
GO:0005509calcium ion bindingmolecular function110/2925576/27,0540.000
GO:0000978RNA polymerase II core promoter proximal region sequence-specific DNA bindingmolecular function80/2925380/27,0540.000
GO:0016301kinase activitymolecular function68/2925319/27,0540.000
1 Gene Ratio: The number of target genes in this GO entry/the number of genes with GO annotations in the target gene. 2 Bg Ratio: The number of genes in the GO entry of this entry/the number of genes with GO annotations in all genes.
Disclaimer/Publisher’s Note: The statements, opinions and data contained in all publications are solely those of the individual author(s) and contributor(s) and not of MDPI and/or the editor(s). MDPI and/or the editor(s) disclaim responsibility for any injury to people or property resulting from any ideas, methods, instructions or products referred to in the content.

