
Alterations of Innate Immunity Reactants in Transition Dairy Cows before Clinical Signs of Lameness

 ,
, 

Abstract
:Simple Summary
Abstract
1. Introduction
2. Materials and Methods
2.1. Animals and Diets

| Close-Up | |
|---|---|
| Item | diet (CUD) |
| Ingredient | %, DM |
| Alfalfa hay | 10.0 |
| Barley silage | 60.0 |
| CUD grain | 30.0 |
| Nutrient composition of CUD grain mix | % amount per kg |
| Ruminant TM Pak 1 | 0.2775 |
| Selenium 1000 mg/kg (UNscr FineCr) | 0.2 |
| Custom TM Complex Premix 2 | 0.33 |
| Vitamin A/D3-1000-200 3 | 0.006 |
| Barley grain, rolled | 39.5815 |
| Flo-bond mycotoxin binder | 0.5 |
| Limestone | 3.7 |
| Magnesium chloride | 1.645 |
| Mag Ox-56% 4 | 0.54 |
| Scale Molasses (60:40) | 2.5 |
| Canola meal | 17.0 |
| Vitamin E 50% Ads 5 | 0.18 |
| Soybean hulls, ground | 33.0 |
| Salt | 0.54 |
| Early | |
|---|---|
| Item | Lactation Diet |
| Ingredient % of DM | %, DM |
| Alfalfa Hay | 9.59 |
| Barley Silage | 30.24 |
| Alfalfa Silage | 9.64 |
| High 16% dairy ration | 50.5 |
| Nutrient composition of dairy ration | % amount per kg |
| ADE Vit Pak-30 Natural E 1 | 0.05 |
| Ruminant TM Pak 2 | 0.11 |
| Selenium, 1,000 mg/kg (UNscr FineCr) | 0.07 |
| Custom TM Complex premix 3 | 0.07 |
| AminoShure-L 4 | 0.33 |
| Blood meal | 3.50 |
| Barley grain, rolled | 39.91 |
| Barley grain, ground | 27.50 |
| Di-calcium phosphate 21% | 1.00 |
| Vit D-10,000 KIU/kg | 0.02 |
| Diamond V XPC 5 | 0.13 |
| Dairy Xtract | 0.02 |
| Energizer RP10 | 2.75 |
| Limestone | 1.70 |
| Mag Ox-56% 6 | 0.43 |
| Scale Molasses (60:40) | 1.25 |
| Nutri A-Z C Dry | 0.10 |
| Amino Plus (High bypass soy) 7 | 8.00 |
| Vitamin E 50% Ads 8 | 0.01 |
| Soy bean meal-47.5% | 1.25 |
| Sodium bicarbonate | 0.80 |
| Salt | 0.51 |
| Poultry-Tallow | 0.50 |
| Biotin 2%-Rovimix H-2 9 | 0.01 |
| Wheat distillers grain (50:50) | 10.00 |
2.2. Monitoring the Clinical Health Status of the Cows
2.3. Sample Collection
2.4. Sample Analyses
2.4.1. Serum Metabolites
2.4.2. Serum Cytokines
2.4.3. Serum Acute Phase Proteins (APPs)
2.5. Statistical Analyses
3. Results
3.1. Serum Metabolites
| Group 1 | Effect,2 P-Value | |||||
|---|---|---|---|---|---|---|
| Item | LAM | CON | SEM | Hs | Wk | Hs × Wk |
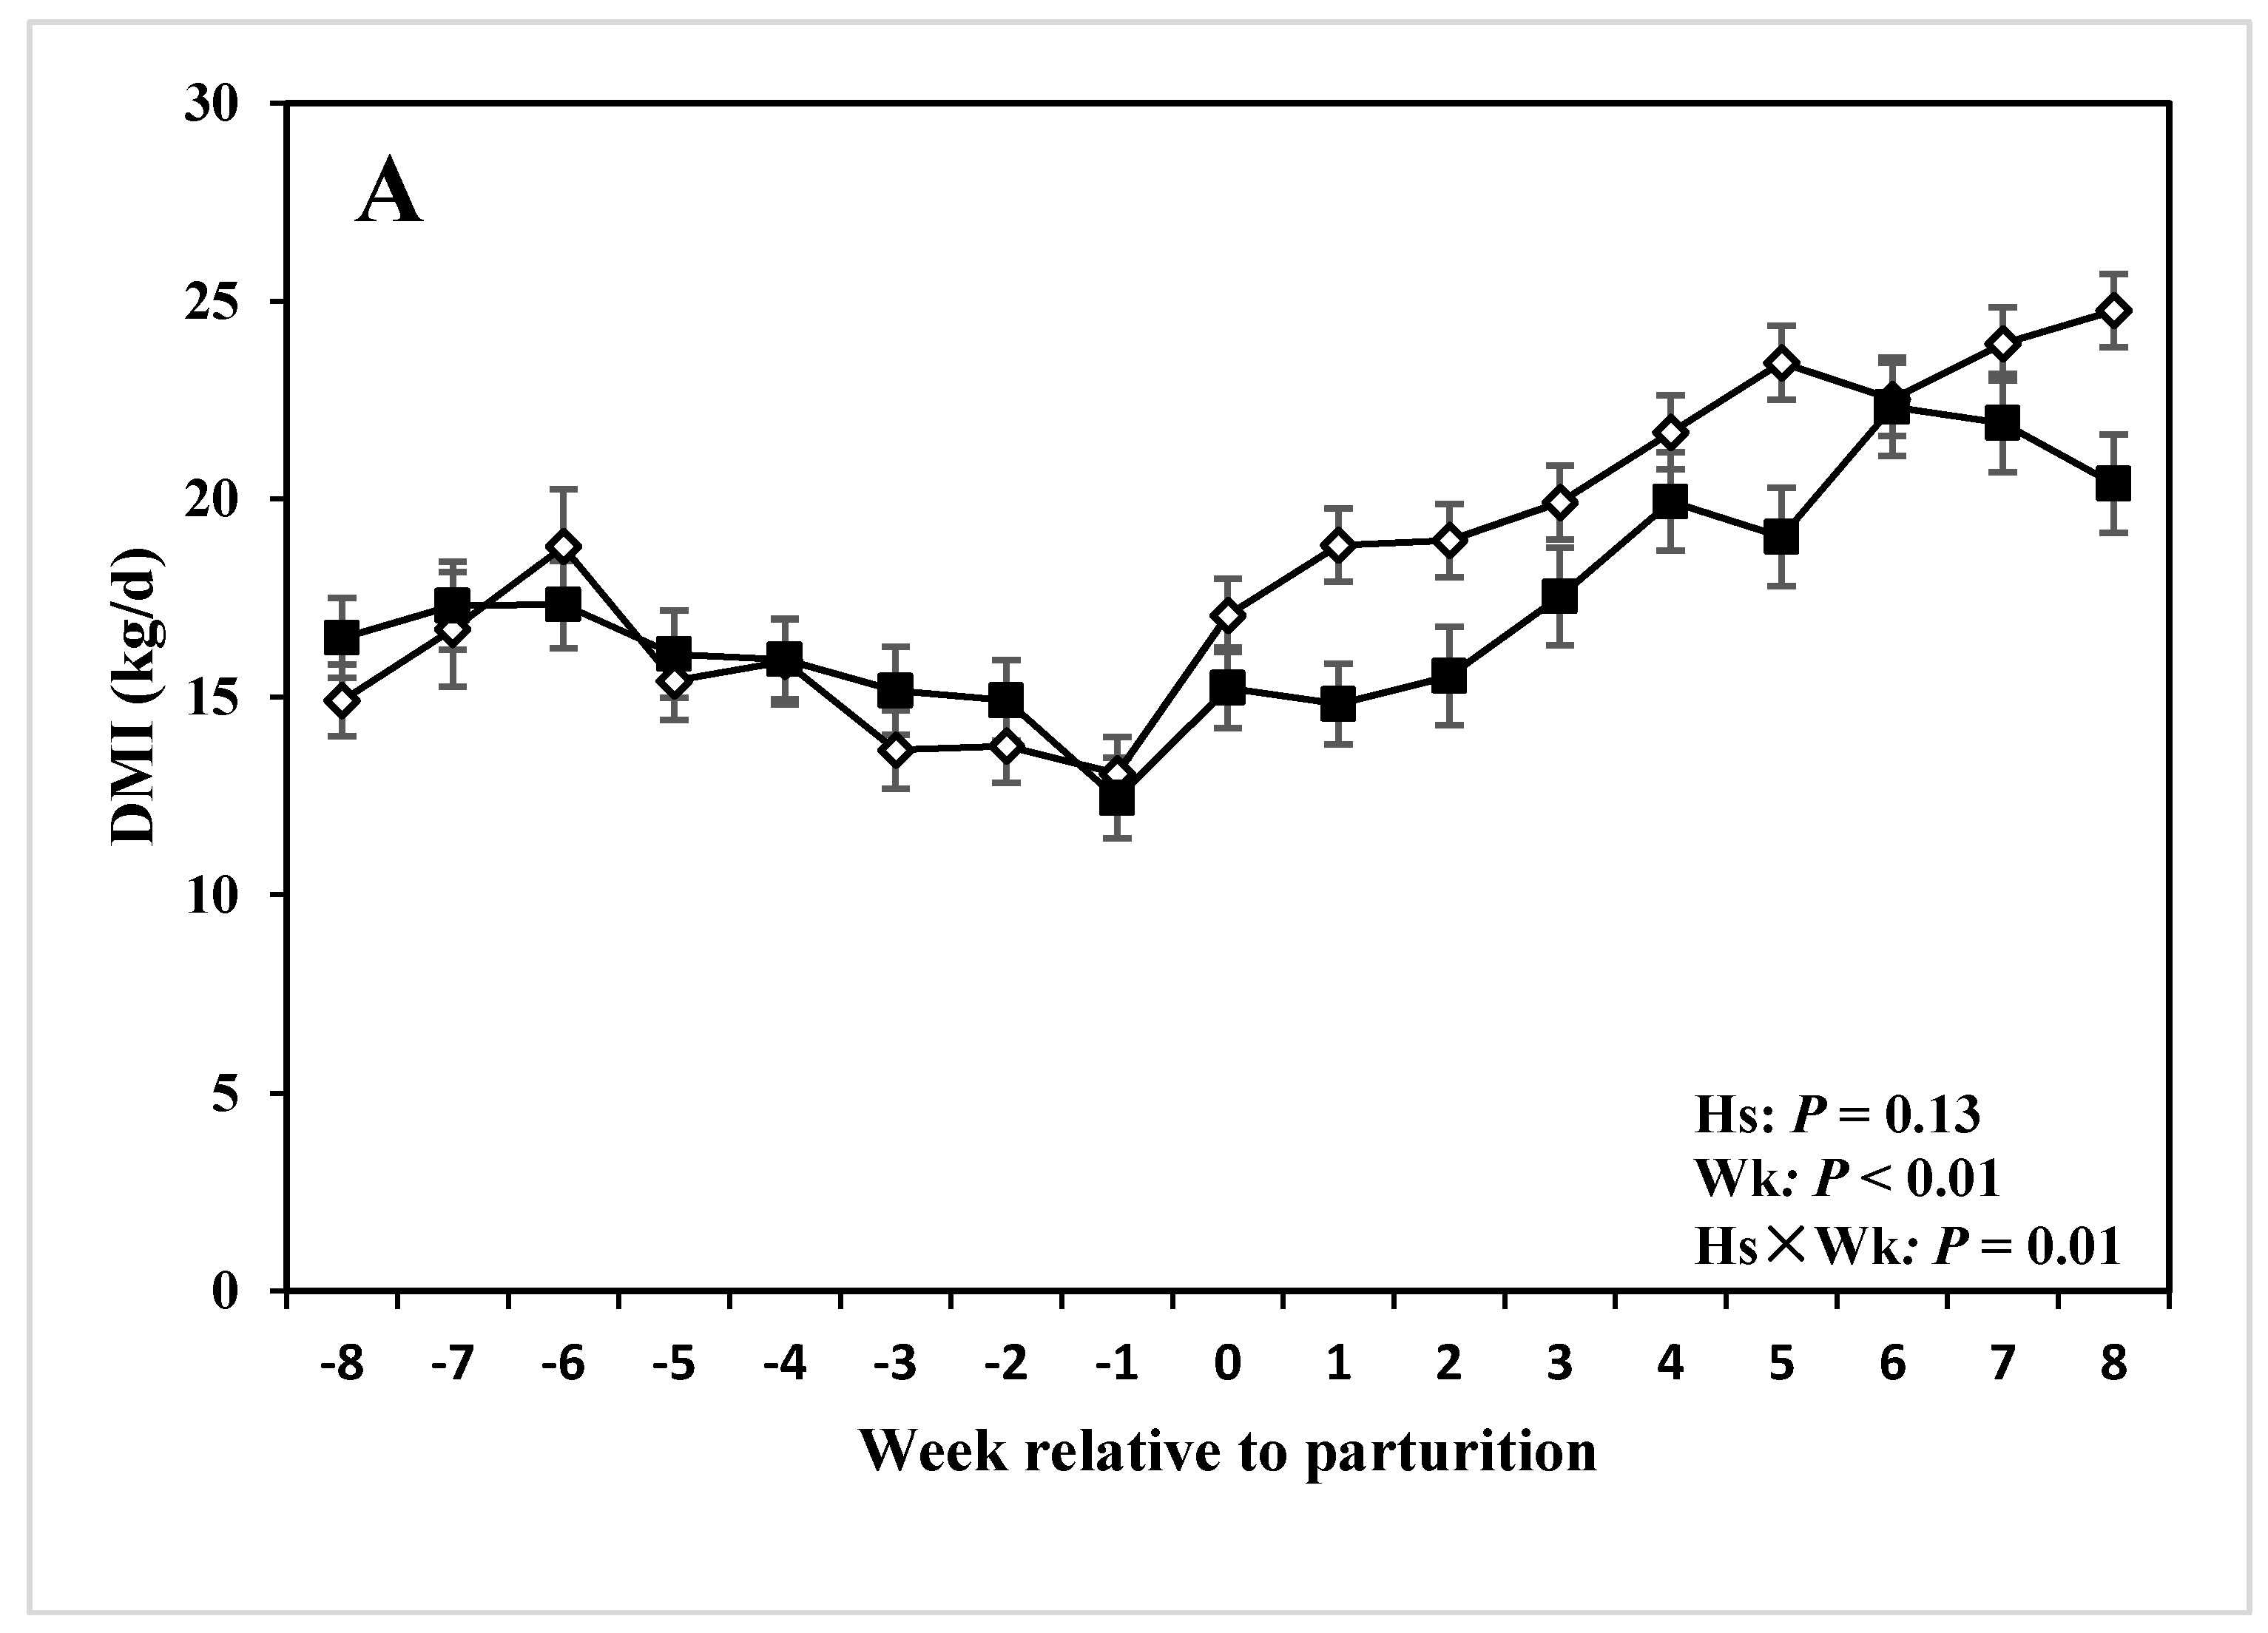
| DMI 3 (kg/d) | 17.19 | 18.64 | 0.58 | 0.13 | <0.01 | <0.01 |
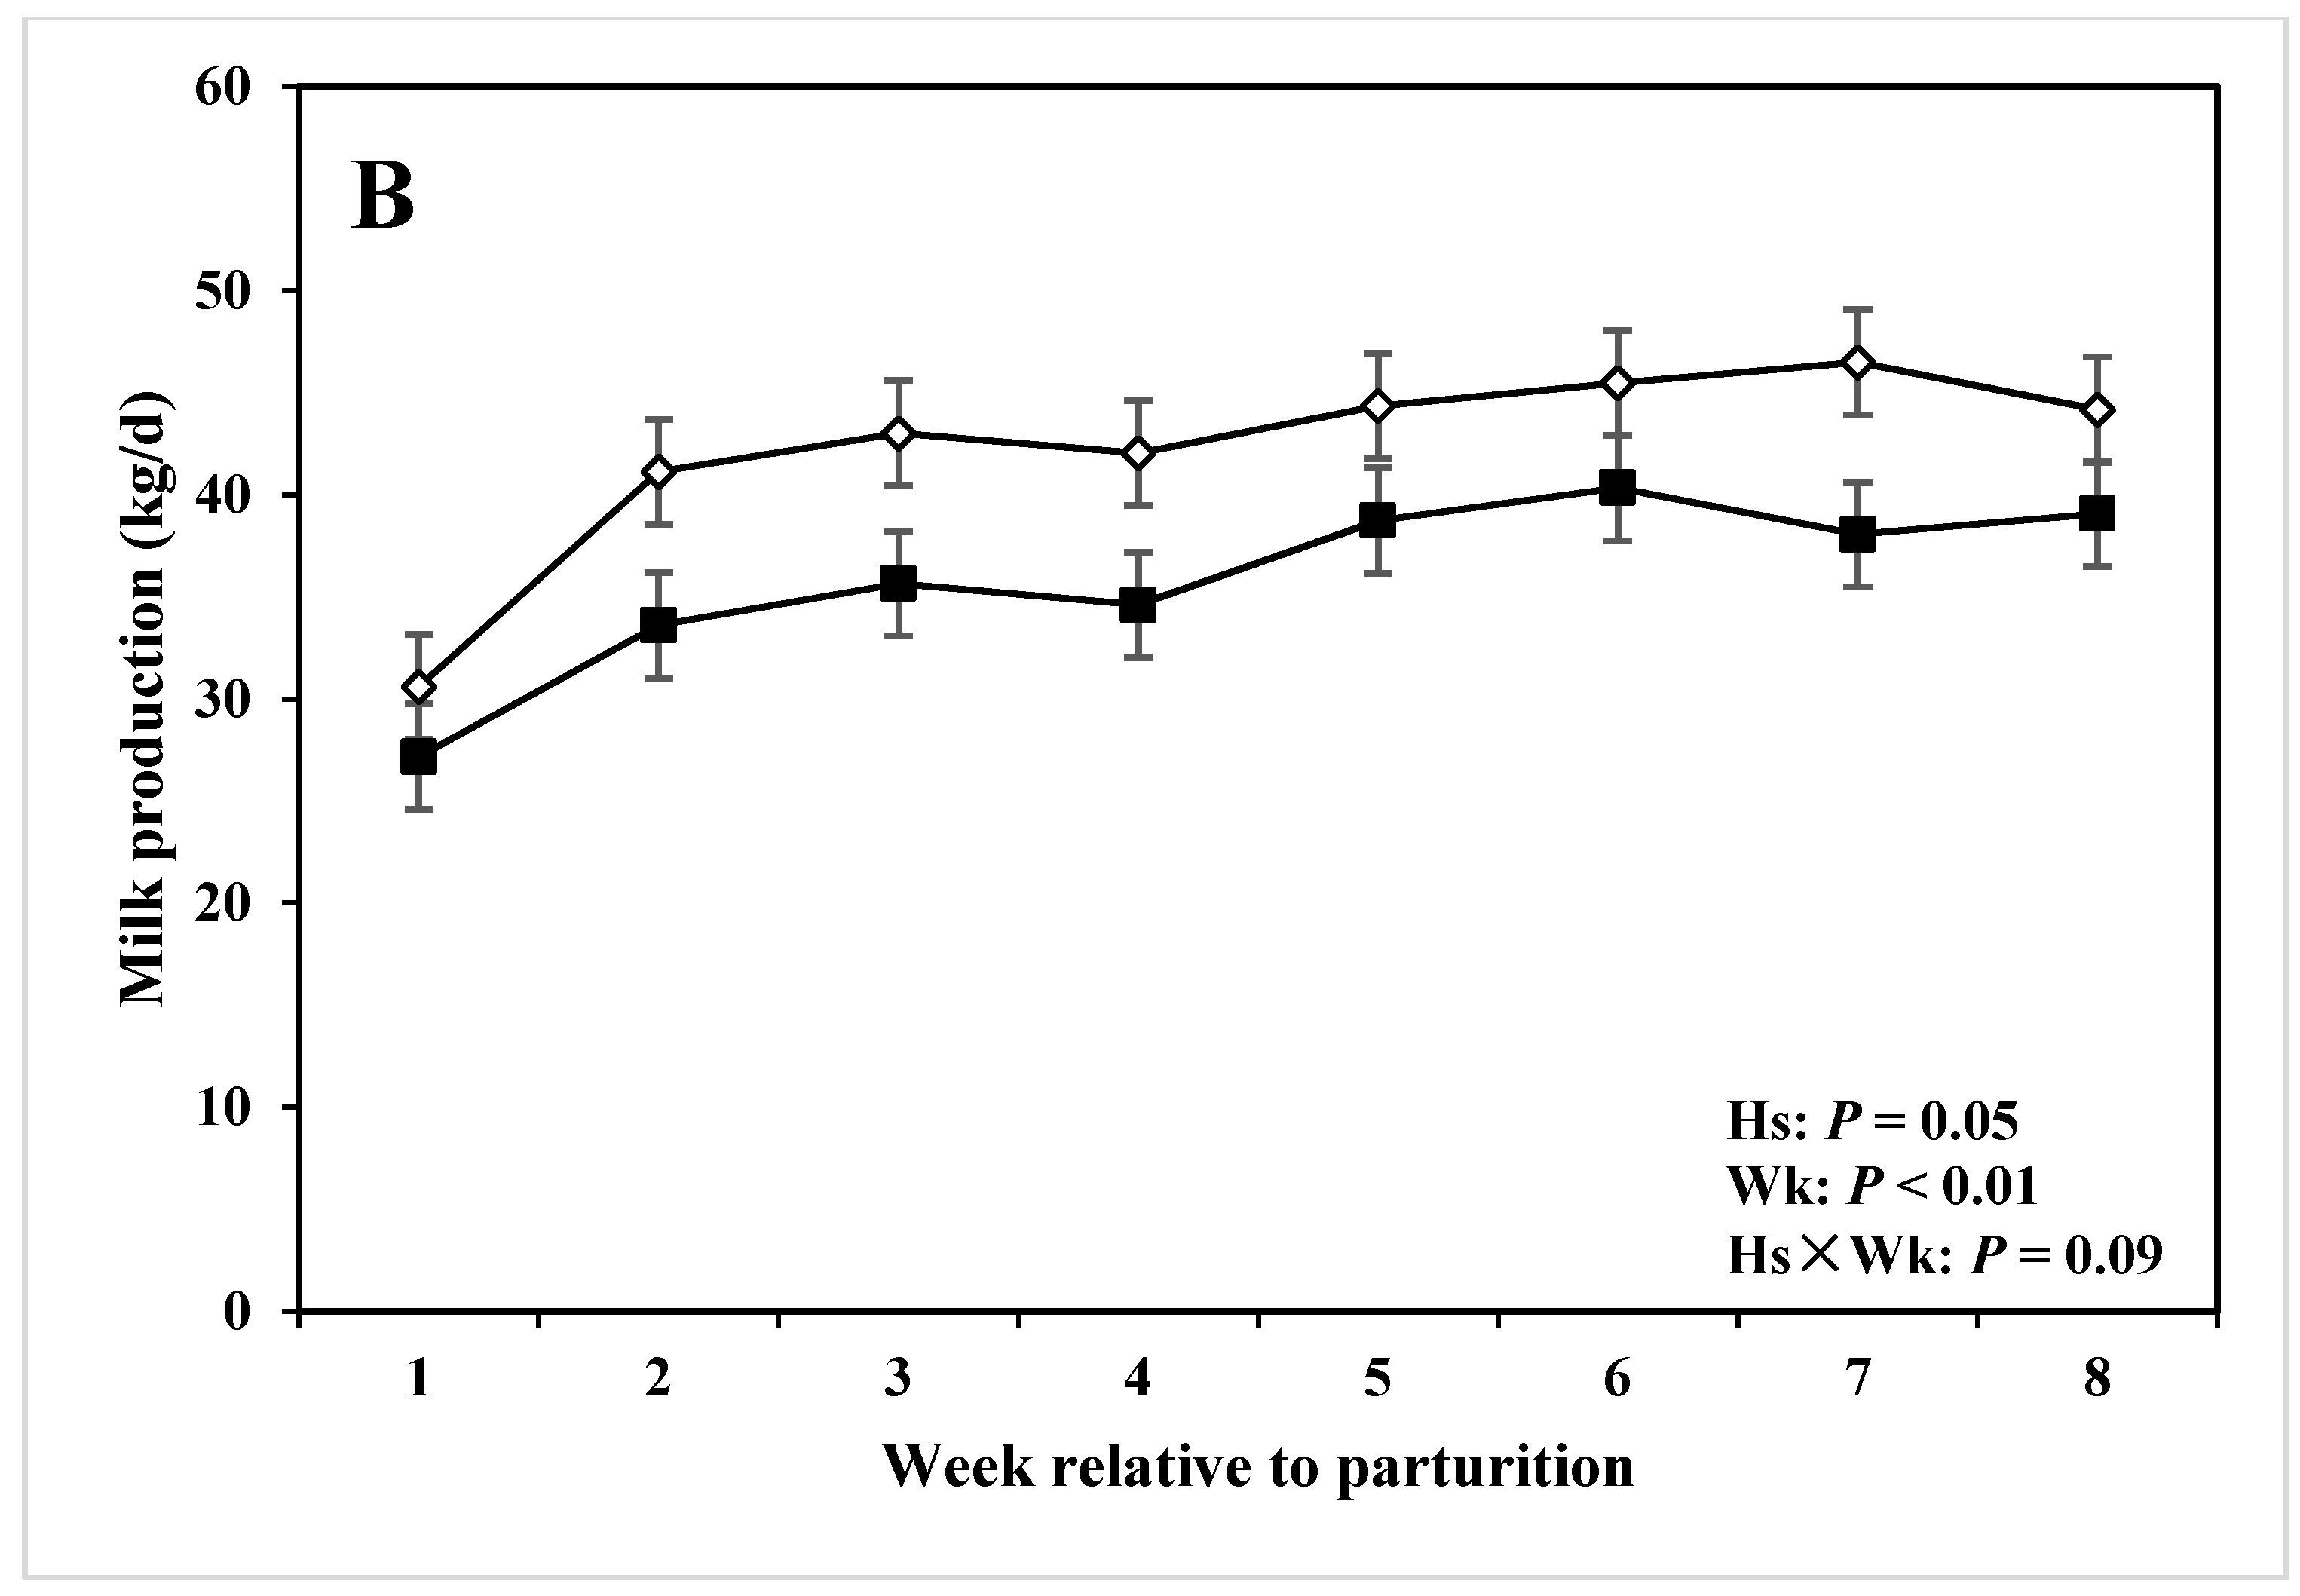
| Milk production 4 (kg/d) | 36.79 | 42.16 | 2.58 | 0.05 | <0.01 | 0.09 |
| Milk composition 5 (g/kg, unless otherwise stated) | ||||||
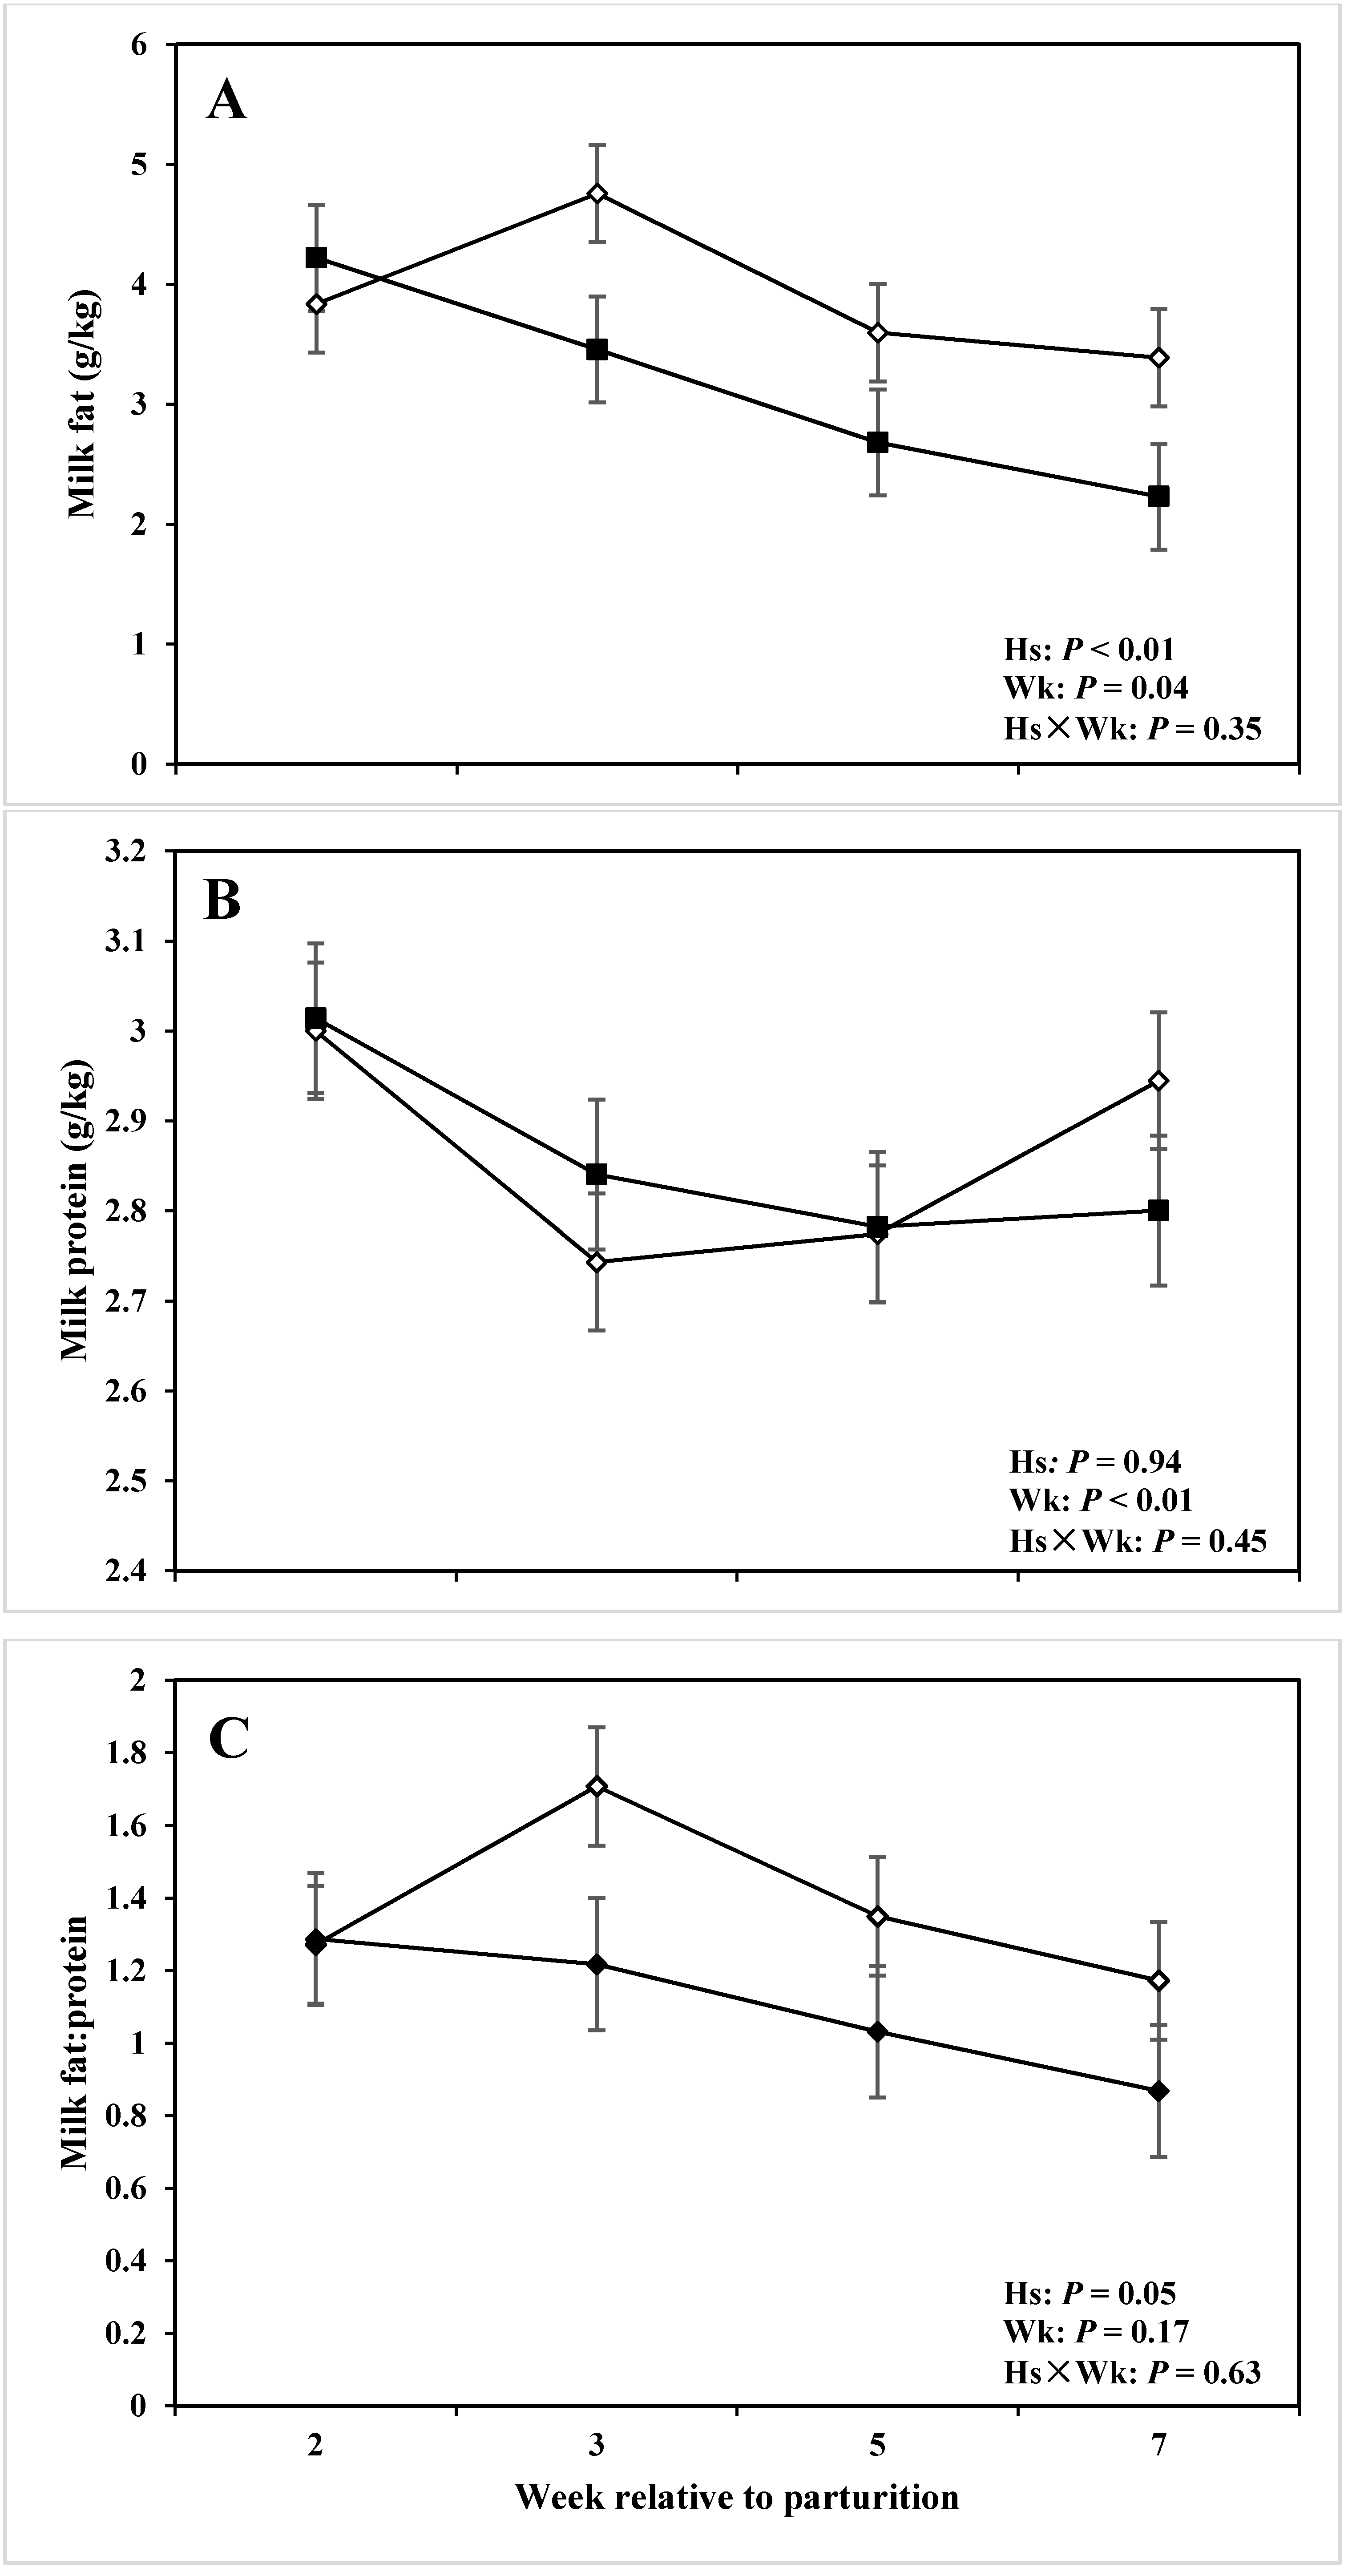
| Fat | 3.15 | 3.90 | 0.14 | <0.01 | 0.04 | 0.35 |
| Protein | 2.86 | 2.87 | 0.06 | 0.94 | <0.01 | 0.45 |
| Fat-to-protein ratio | 1.10 | 1.38 | 0.09 | 0.05 | 0.17 | 0.63 |
| Lactose | 4.55 | 4.56 | 0.04 | 0.84 | 0.02 | 0.47 |
| SCC (103 cells/mL) | 57.90 | 30.0 | 5.37 | <0.01 | 0.10 | 0.28 |
| Milk urea N (mg/dL) | 15.47 | 15.56 | 0.96 | 0.95 | 0.01 | <0.01 |
| TS | 12.00 | 12.19 | 0.25 | 0.30 | 0.03 | 0.50 |
| Serum parameters 6 | ||||||
| Lactate (μmol/L) | 4550.67 | 2254.08 | 399.21 | <0.01 | 0.20 | 0.62 |
| NEFA (mmol/L) | 261.85 | 397.16 | 78.05 | 0.26 | <0.01 | 0.92 |
| BHBA (μmol/L) | 509.38 | 595.84 | 66.49 | 0.39 | <0.01 | 0.35 |
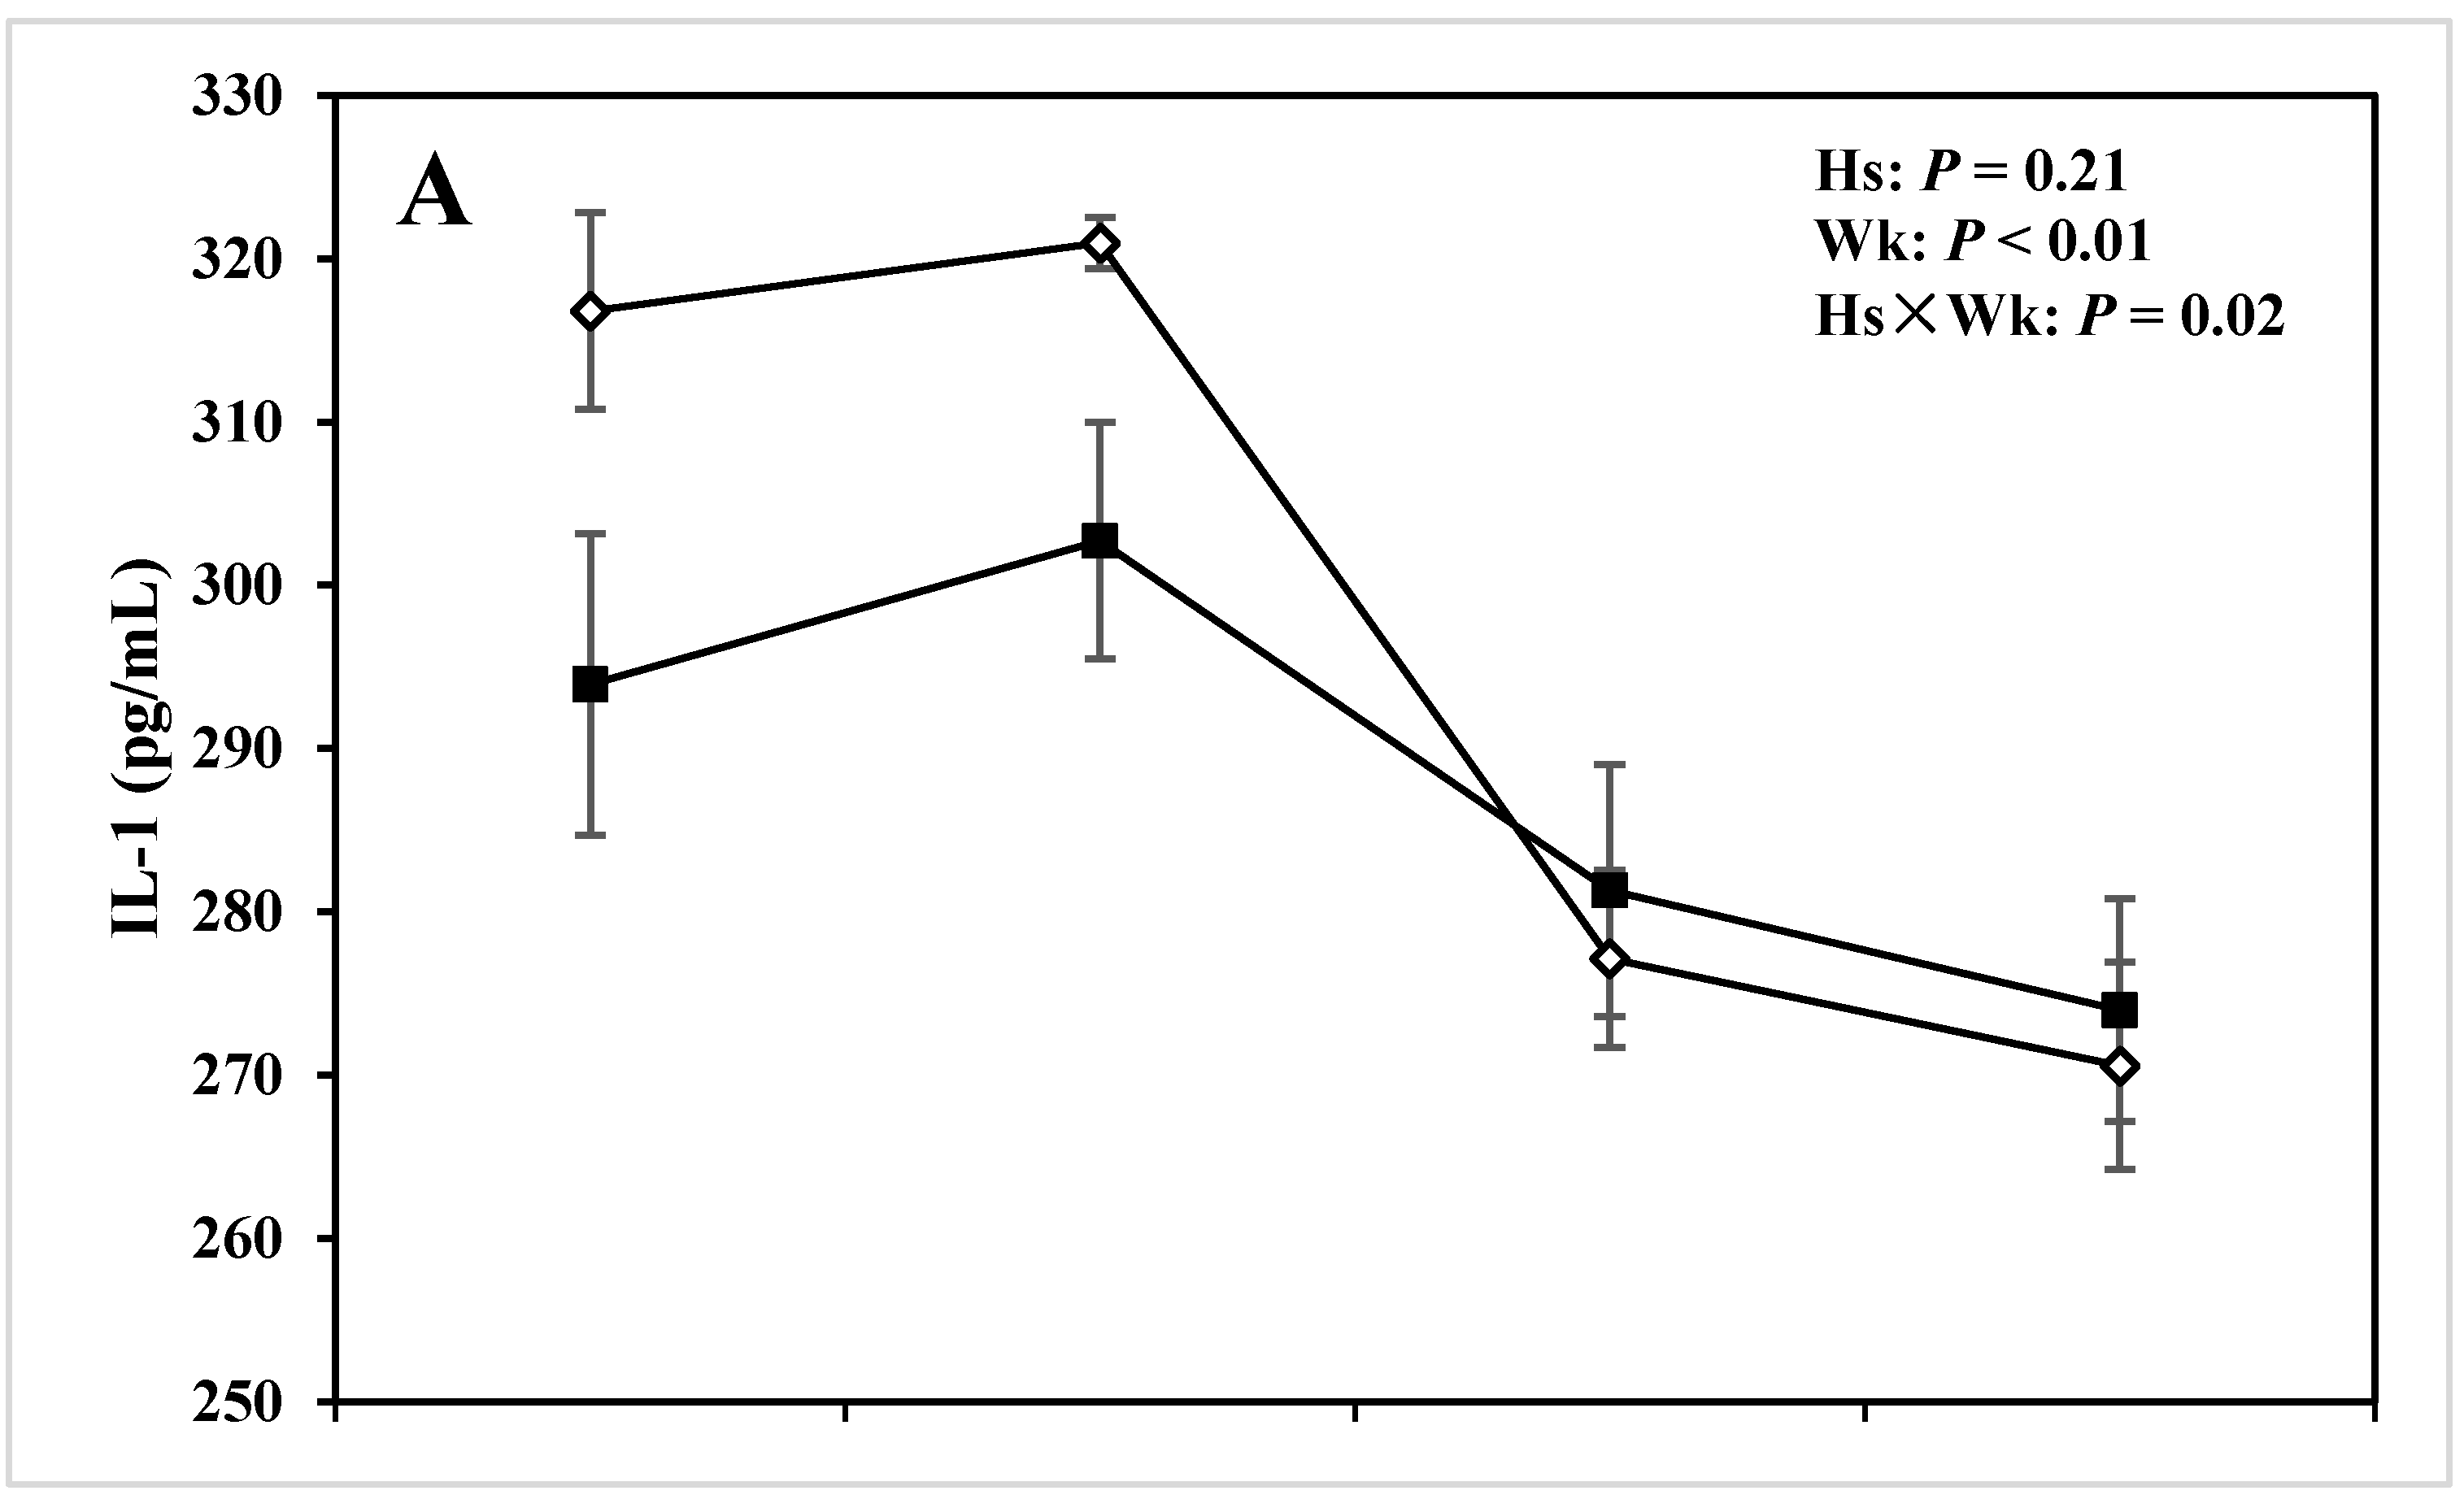
| IL-1 (pg/mL) | 287.98 | 296.66 | 4.58 | 0.21 | <0.01 | 0.02 |
| IL-6 (pg/mL) | 175.78 | 26.67 | 35.51 | 0.02 | 0.21 | 0.34 |
| TNF (ng/mL) | 0.40 | 0.19 | 0.08 | 0.09 | <0.01 | 0.03 |
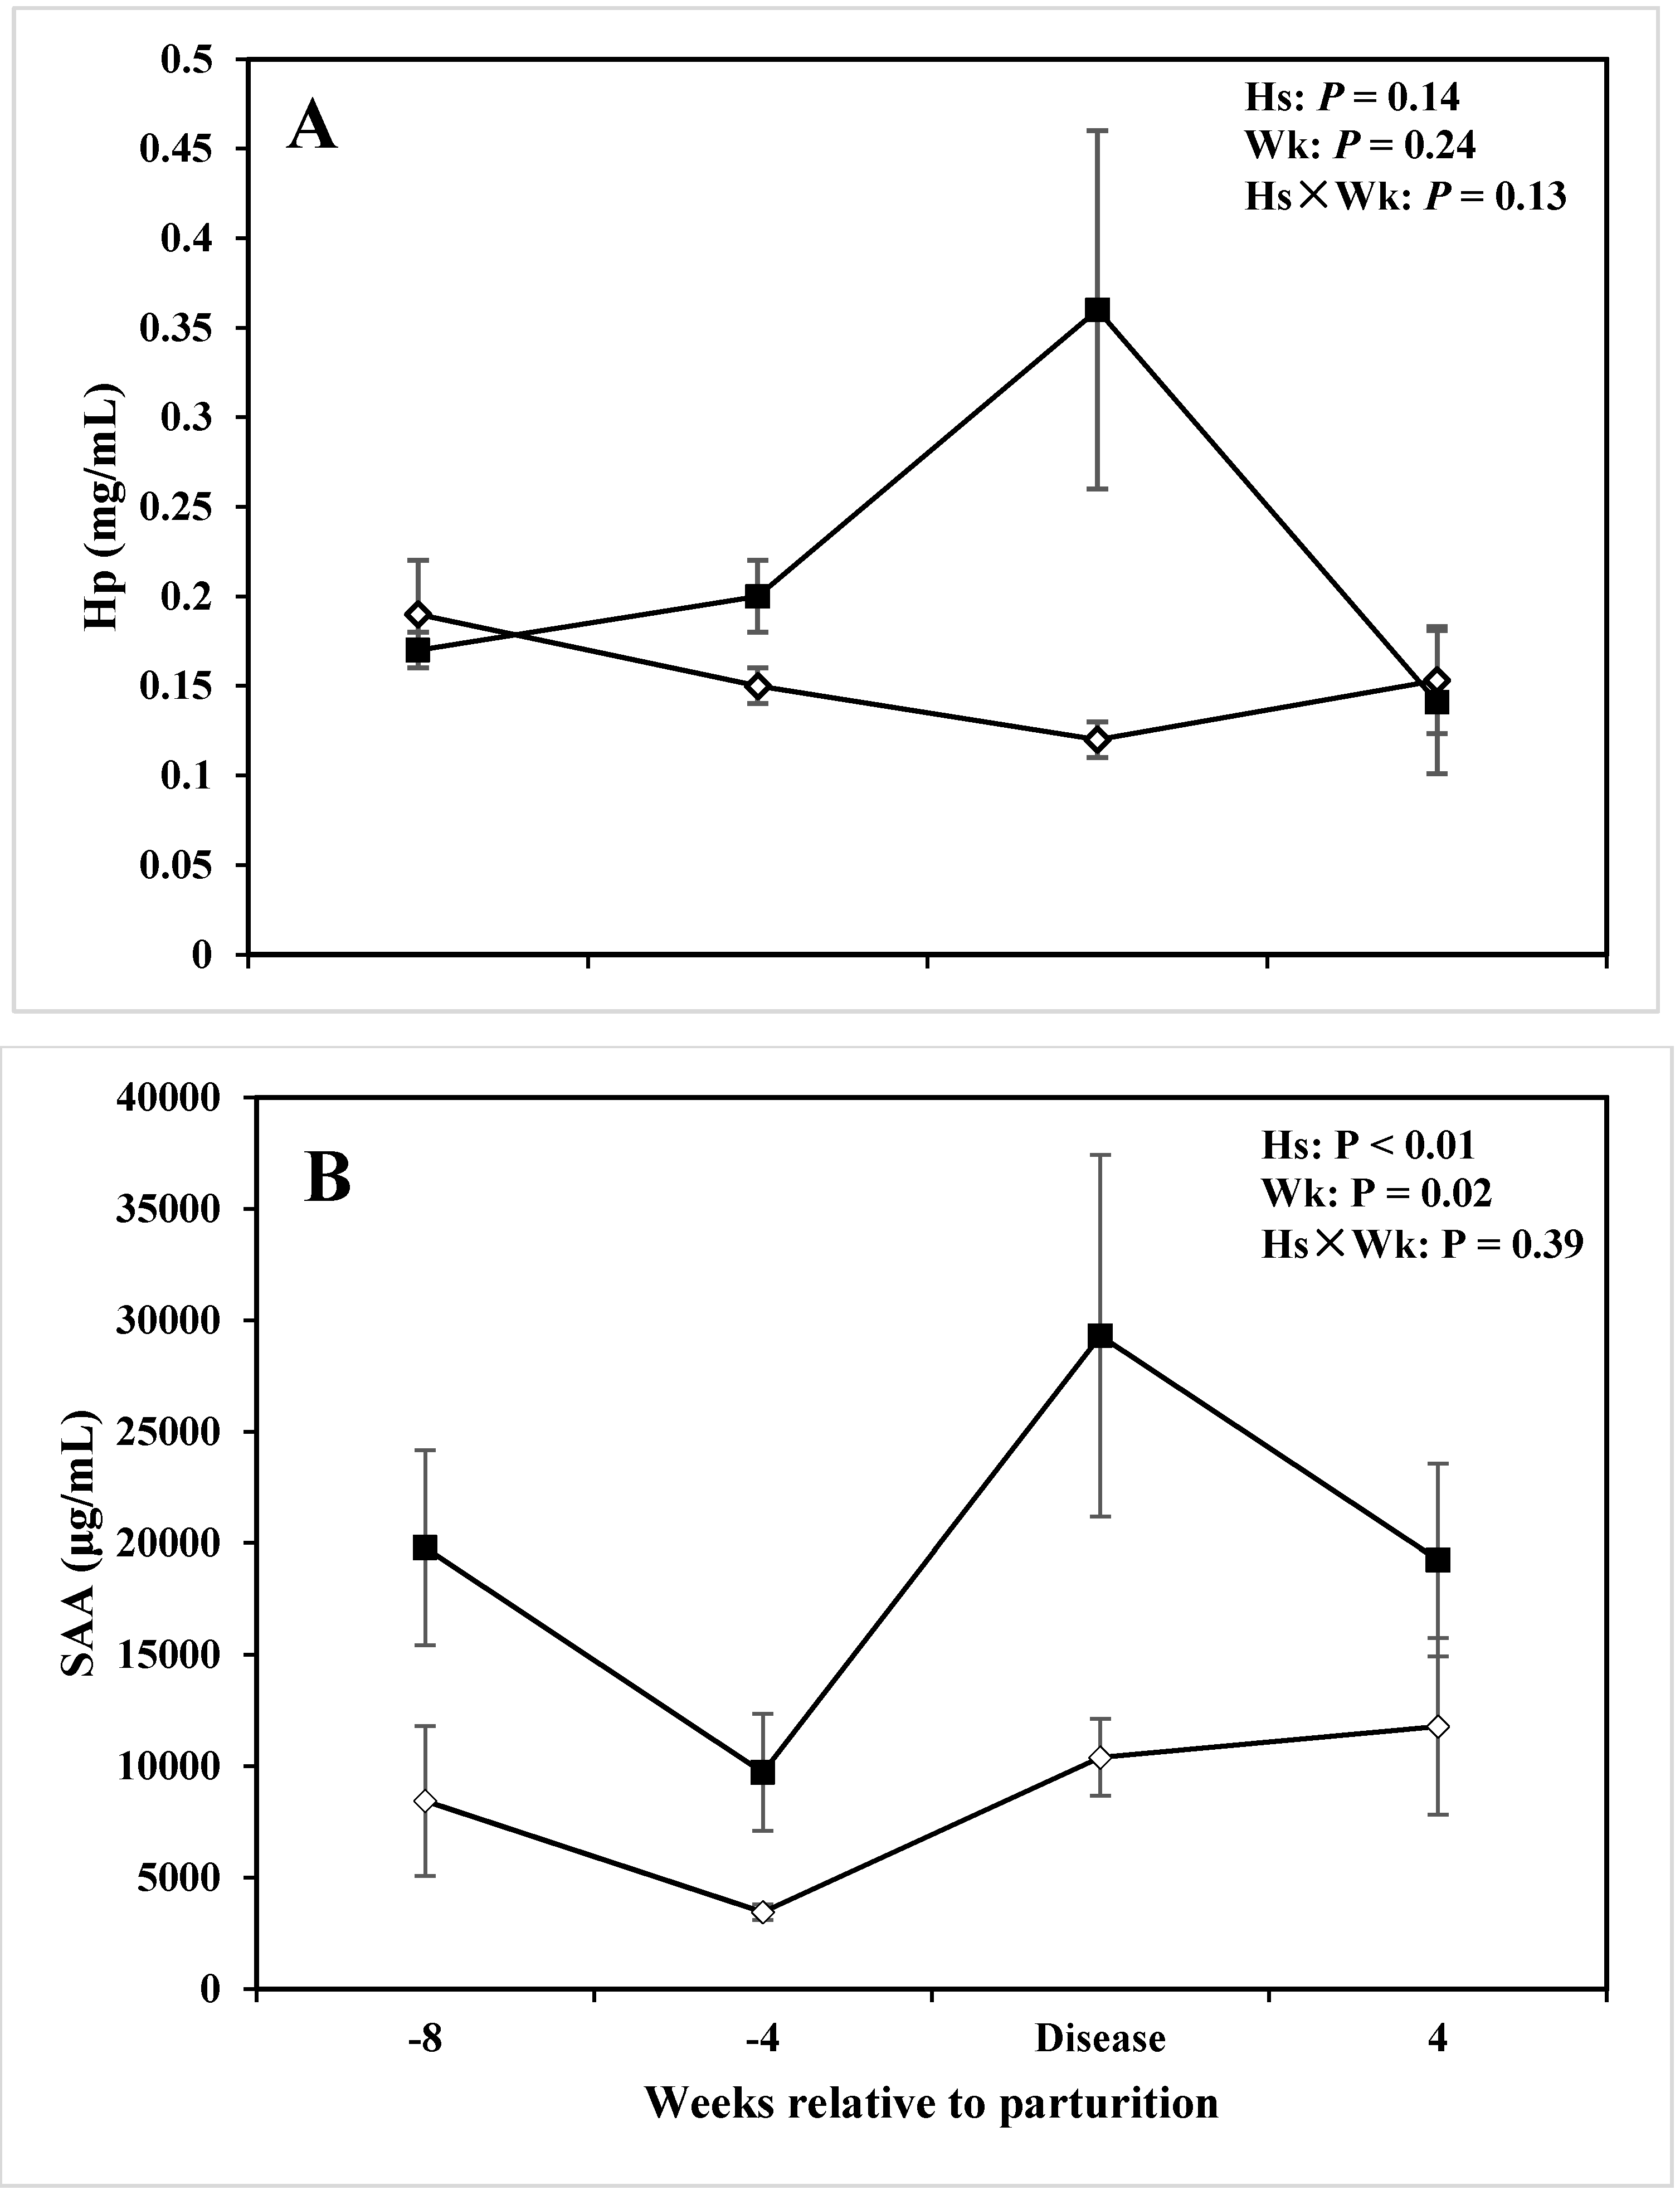
| Haptoglobin (mg/mL) | 0.21 | 0.15 | 0.03 | 0.14 | 0.24 | 0.03 |
| SAA (ug/mL) | 19628 | 8548.38 | 2440.73 | <0.01 | 0.02 | 0.39 |
| 8 Week before Parturition | 4 Week before Parturition | LAM Diagnosis Week 1 | |||||||
|---|---|---|---|---|---|---|---|---|---|
| Item | CON | LAM | P-value | CON | LAM | P-value | CON | LAM | P-value |
| DMI (kg/d) | 14.91 ± 0.90 | 16.49 ± 1.01 | 0.28 | 15.90 ± 0.14 | 15.95 ± 0.67 | 0.96 | 20.26 ± 0.89 | 13.25 ± 1.11 | <0.01 |
| Milk production (kg/d) | 43.01 ± 1.62 | 29.78 ± 4.01 | 0.01 | ||||||
| Milk composition (g/kg, unless otherwise stated) | |||||||||
| Fat | 5.08 ± 0.45 | 3.39 ± 0.41 | 0.02 | ||||||
| Protein | 3.00 ± 0.10 | 2.85 ± 0.07 | 0.25 | ||||||
| Fat-to-Protein ratio | 1.69 ± 0.12 | 1.20 ± 0.15 | 0.03 | ||||||
| Lactose | 4.54 ± 0.05 | 4.43 ± 0.13 | 0.42 | ||||||
| SCC (103 cells/mL) | 28.33 ± 5.63 | 66.50 ± 15.31 | 0.03 | ||||||
| Milk urea N (mg/dL) | 15.39 ± 0.76 | 14.08 ± 1.22 | 0.37 | ||||||
| TS | 12.21 ± 0.31 | 13.47 ± 1.21 | 0.37 | ||||||
| Serum parameters | |||||||||
| Lactate (μmol/L) | 2455.49 ± 348.63 | 5427.91 ± 1095.28 | 0.04 | 2162.31 ± 184.52 | 4232.93 ± 748.08 | 0.04 | 2,227.61 ± 320.68 | 4,760.82 ± 519.38 | <0.01 |
| NEFA (mmol/L) | 140.79 ± 32.77 | 107.34 ± 20.88 | 0.41 | 193.97 ± 47.17 | 82.89 ± 6.96 | 0.07 | 756.51 ± 232.01 | 594.63 ± 206.20 | 0.61 |
| BHBA (μmol/L) | 351.93 ± 37.71 | 374.48 ± 31.14 | 0.65 | 311.98 ± 18.50 | 366.32 ± 17.12 | 0.06 | 826.91 ± 151.50 | 586.69 ± 93.88 | 0.23 |
| IL-1 (pg/mL) | 316.79 ± 6.04 | 293.92 ± 9.23 | 0.07 | 320.96 ± 1.59 | 302.73 ± 7.26 | 0.05 | 277.13 ± 5.42 | 281.30 ± 7.70 | 0.67 |
| IL-6 (pg/mL) | 19.23 ± 5.67 | 85.37 ± 52.96 | 0.30 | 48.24 ± 17.51 | 250.81 ± 87.08 | 0.03 | 23.17 ± 5.18 | 113.41 ± 21.96 | 0.02 |
| TNF (ng/mL) | 0.34 ± 0.03 | 0.39 ± 0.12 | 0.80 | 0.27 ± 0.05 | 0.51 ± 0.11 | 0.10 | 0.06 ± 0.03 | 0.48 ± 0.13 | 0.02 |
| Haptoglobin (mg/mL) | 0.19 ± 0.03 | 0.17 ± 0.01 | 0.54 | 0.15 ± 0.01 | 0.20 ± 0.02 | 0.05 | 0.12 ± 0.01 | 0.36 ± 0.10 | 0.05 |
| SAA (ug/mL) | 8447.67 ± 3373.28 | 19799.92 ± 4373.22 | 0.07 | 3461.25 ± 341.92 | 9732.1 ± 2625.98 | 0.03 | 10401 ± 1722.57 | 29300.17 ± 8108.13 | 0.05 |

3.2. Cytokines


3.3. Acute Phase Proteins

3.4. DMI, Milk Production and Composition


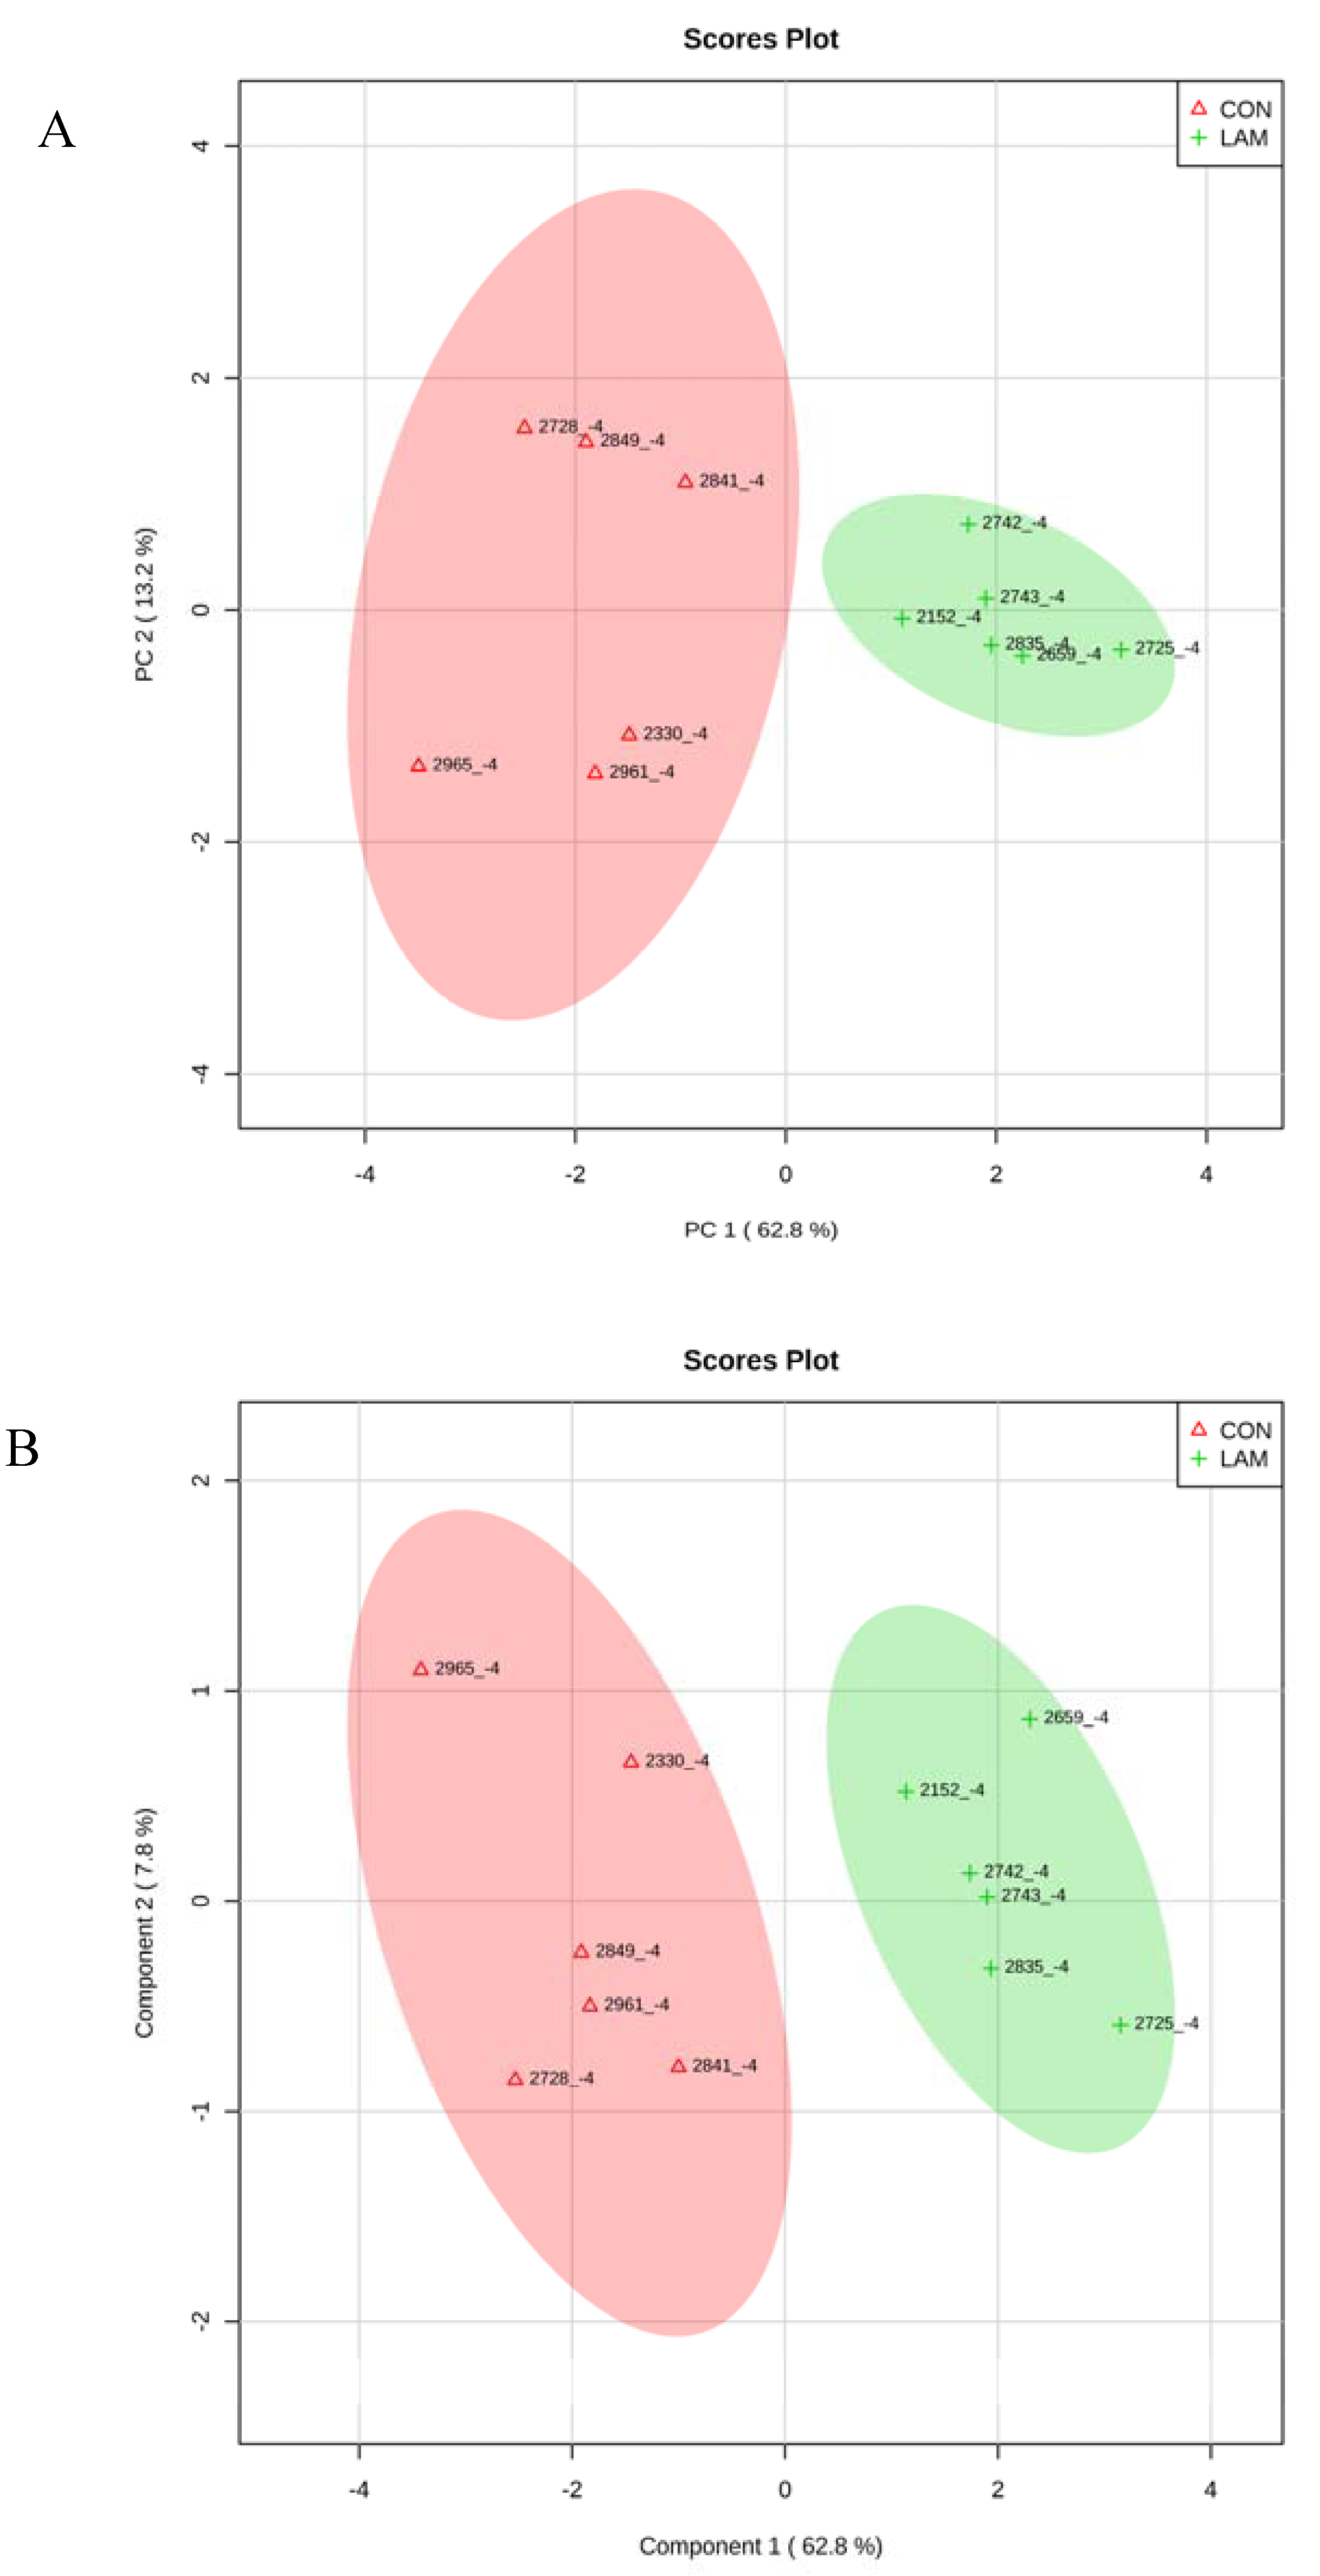
3.5. Multivariate Analysis on Serum Variables


3.6. Correlation Analysis between Milk SCC and Serum Parameters
| Item | −8 week before parturition 1 | −4 week before parturition 2 | LAM diagnosis week 3 | +4 week after parturition 4 | |||||
|---|---|---|---|---|---|---|---|---|---|
| Milk | Serum | r | P-value | r | P-value | r | P-value | r | P-value |
| SCC 5 | Lactate | 0.82 | <0.01 | 0.85 | <0.01 | 0.91 | <0.01 | 0.92 | <0.01 |
| NEFA | −0.04 | 0.93 | −0.33 | 0.36 | −0.11 | 0.75 | −0.36 | 0.30 | |
| BHBA | −0.11 | 0.75 | 0.59 | 0.10 | −0.18 | 0.62 | 0.24 | 0.50 | |
| IL-1 | −0.53 | 0.09 | −0.76 | 0.01 | −0.11 | 0.76 | 0.11 | 0.76 | |
| IL-6 | 0.73 | <0.01 | 0.77 | <0.01 | 0.78 | <0.01 | 0.79 | 0.01 | |
| TNF | 0.47 | 0.14 | 0.80 | <0.01 | 0.84 | <0.01 | 0.55 | 0.12 | |
| Hp | −0.13 | 0.71 | 0.55 | 0.08 | 0.56 | 0.09 | 0.34 | 0.40 | |
| SAA | 0.86 | <0.01 | 0.81 | <0.01 | 0.83 | <0.01 | 0.70 | 0.02 | |
4. Discussion
4.1. Alterations of Blood Metabolites
4.2. Alterations in Innate Immunity
4.3. Milk Production, Composition, and DMI
5. Conclusions
Acknowledgments
Author Contributions
Conflicts of Interest
References
- Weaver, M.D.; Jean, G.S.; Steiner, A. Bovine Surgery and Lameness, 2nd ed.; Blackwell: Oxford, UK, 2005; pp. 198–258. [Google Scholar]
- Warnick, L.D.; Janssen, D.; Guard, C.L.; Grohn, Y.T. The effect of lameness on milk production in dairy cows. J. Dairy Sci. 2001, 84, 1988–1997. [Google Scholar] [CrossRef]
- Hernandez, J.; Shearer, J.K.; Webb, D.W. Effect of lameness on the calving-to-conception interval in dairy cows. J. Am. Vet. Med. Assoc. 2001, 218, 1611–1614. [Google Scholar] [CrossRef] [PubMed]
- Booth, C.J.; Warnick, L.D.; Grohn, Y.T.; Maizon, D.O.; Guard, C.L.; Janssen, D. Effect of lameness on culling in dairy cows. J. Dairy Sci. 2004, 87, 4115–4122. [Google Scholar] [CrossRef]
- Cha, E.; Hertl, J.A.; Bar, D.; Gröhn, Y.T. The cost of different types of lameness in dairy cows calculated by dynamic programming. Prev. Vet. Med. 2010, 97, 1–8. [Google Scholar] [CrossRef] [PubMed]
- Bergsten, C. Causes, risk factors, and prevention of laminitis and related claw lesions. Acta. Vet. Scand. 2003, 44, S157–S166. [Google Scholar] [CrossRef]
- Ametaj, B.N.; Zebeli, Q.; Iqbal, S. Nutrition, microbiota, and endotoxin-related diseases in dairy cows. R. Bras. Zootec. 2010, 39, 433–444. [Google Scholar] [CrossRef]
- Tadros, E.M.; Frank, N.; Horohov, D.W. Inflammatory cytokine gene expression in blood during the development of oligofructose-induced laminitis in horses. Equine Vet. J. 2007, 39, 42–47. [Google Scholar] [CrossRef]
- Tothova, C.; Nagy, O.; Kovac, G. Acute phase proteins and their use in the diagnosis of diseases in ruminants: a review. Vet. Med-Czech. 2014, 59, 163–180. [Google Scholar]
- Katoh, N.; Ito, T. Inhibition by dexamethasone of interleukin-1β and interleukin-6 expression in alveolar macrophages from cows. Res. Vet. Sci. 1995, 59, 41–44. [Google Scholar] [CrossRef]
- Gabay, C.; Kushiner, I. Acute-phase proteins and other systemic response to inflammation. N. Engl. J. Med. 1999, 340, 448–454. [Google Scholar] [PubMed]
- Kushibiki, S. Tumor necrosis factor-α-induced inflammatory responses in cattle. Anim. Sci. J. 2011, 82, 504–511. [Google Scholar] [CrossRef] [PubMed]
- Gauldie, J.; Richards, C.; Harnish, D.; Lansdorp, P.; Baumann, H. Interferon β2/B-cell stimulatory factor type 2 shares identity with monocyte-derived hepatocyte-stimulating factor and regulates the major acute phase protein response in liver cells. Proc. Natl. Acad. Sci. USA 1987, 84, 7251–7255. [Google Scholar] [CrossRef] [PubMed]
- Baigrie, R.J.; Lamont, P.M.; Dallman, M.; Morris, P.J. The release of interleukin-1 beta (IL-1) precedes that of interleukin 6 (IL-6) in patients undergoing major surgery. Lymphokine Cytokine Res. 1991, 10, 253–256. [Google Scholar] [PubMed]
- Nijsten, M.W.N.; Hack, C.E.; Helle, M.; Tenduis, H.J.; Klasen, H.J.; Aarden, L.A. Interleukin-6 and its relation to the humoral immune-response and clinical-parameters in burned patients. Surgery 1991, 109, 761–767. [Google Scholar] [PubMed]
- Koj, A. Termination of acute-phase response: role of some cytokines and anti-inflammatory drugs. Gen. Pharmacol. 1998, 31, 9–18. [Google Scholar] [CrossRef]
- Gruys, E.; Obwolo, M.J.; Toussaint, M.J.M. Diagnostic significance of the major acute phase proteins in veterinary clinical chemistry: A review. Vet. Bull. 1994, 64, 1009–1018. [Google Scholar]
- Petersen, H.H.; Nielsen, J.P.; Heegaard, P.M. Application of acute phase protein measurements in veterinary clinical chemistry. Vet. Res. 2004, 35, 163–187. [Google Scholar] [CrossRef] [PubMed]
- Canadian Council on Animal Care. Guide to the Care and Use of Experimental Animals, 2nd ed.; Olfert, E.D., Cross, B.M., McWilliam, A.A., Eds.; CCAC: Ottawa, ON, Canada, 1993; Volume 1, pp. 1–298. [Google Scholar]
- National Research Council. Nutrient Requirements of Dairy Cattle, 7th ed.; NRC National Academy Press: Washington, DC, USA, 2001. [Google Scholar]
- Sprecher, D.J.; Hostetler, D.E.; Kaneene, J.B. A lameness scoring system that uses posture and gait to predict dairy cattle reproductive performance. Theriogenology 1997, 47, 1179–1187. [Google Scholar] [CrossRef]
- Kloosterman, P. Laminitis—Prevention, diagnosis and treatment. Adv. Dairy Technol. 2007, 19, 157–166. [Google Scholar]
- Ametaj, B.N.; Emmanuel, D.G.V.; Zebeli, Q.; Dunn, S.M. Feeding high proportions of barley grain in a total mixed ration perturbs diurnal patterns of plasma metabolites in lactating dairy cows. J. Dairy Sci. 2009, 92, 1084–1091. [Google Scholar] [CrossRef] [PubMed]
- Iqbal, S.; Terrill, S.J.; Zebeli, Q.; Mazzolari, A.; Dunn, S.M.; Yang, W.Z.; Ametaj, B.N. Treating barley grain with lactic acid and heat prevented sub-acute ruminal acidosis and increased milk fat content in dairy cows. Anim. Feed Sci. Tech. 2012, 172, 141–149. [Google Scholar] [CrossRef]
- Iqbal, S.; Zebeli, Q.; Mazzolari, A.; Dunn, S.M.; Ametaj, B.N. Feeding rolled barley grain steeped in lactic acid modulated energy status and innate immunity in dairy cows. J. Dairy Sci. 2010, 93, 5147–5156. [Google Scholar] [CrossRef] [PubMed]
- Xia, J.G.; Psychogios, N.; Young, N.; Wishart, D.S. MetaboAnalyst: A web server for metabolomic data analysis and interpretation. Nucleic. Acids Res. 2009, 37, W652–W660. [Google Scholar] [CrossRef] [PubMed]
- Nel, M.; Lobetti, R.G.; Keller, N.; Thompson, P.N. Prognostic value of blood lactate, blood glucose, and hematocrit in canine babesiosis. J. Vet. Intern. Med. 2004, 18, 471–476. [Google Scholar] [CrossRef] [PubMed]
- Demir, I.E.; Ceyhan, G.O.; Friess, H. Beyond lactate: Is there a role for serum lactate measurement in diagnosing acute mesenteric ischemia? Dig. Surg. 2012, 29, 226–235. [Google Scholar] [CrossRef] [PubMed]
- Nocek, J.E. Bovine acidosis: Implications on laminitis. J. Dairy Sci. 1997, 80, 1005–1028. [Google Scholar] [CrossRef]
- Emmanuel, D.G.; Dunn, S.M.; Ametaj, B.N. Feeding high proportions of barley grain stimulates an inflammatory response in dairy cows. J. Dairy Sci. 2008, 91, 606–614. [Google Scholar] [CrossRef] [PubMed]
- Ametaj, B.N.; Zebeli, Q.; Saleem, F.; Psychogios, N.; Lewis, M.J.; Dunn, S.M.; Xia, J.G.; Wishart, D.S. Metabolomics reveals unhealthy alterations in rumen metabolism with increased proportion of cereal grain in the diet of dairy cows. Metabolomics 2010, 6, 583–594. [Google Scholar] [CrossRef]
- Zebeli, Q.; Dunn, S.M.; Ametaj, B.N. Perturbations of plasma metabolites correlated with the rise of rumen endotoxin in dairy cows fed diets rich in easily degradable carbohydrates. J. Dairy Sci. 2011, 94, 2374–2382. [Google Scholar] [CrossRef] [PubMed]
- Block, E.R.; Patel, J.M.; Sheridan, N.P. Effect of oxygen and endotoxin on lactate-dehydrogenase release, 5-hydroxytryptamine uptake, and antioxidant enzyme-activities in endothelial-cells. J. Cell Physiol. 1985, 122, 240–248. [Google Scholar] [CrossRef] [PubMed]
- Steiger, M.; Senn, M.; Altreuther, G.; Werling, D.; Sutter, F.; Kreuzer, M.; Langhans, W. Effect of a prolonged low-dose lipopolysaccharide infusion on feed intake and metabolism in heifers. J. Anim Sci. 1999, 77, 2523–2532. [Google Scholar] [PubMed]
- Todhunter, D.; Smith, K.L.; Hogan, J.S. Growth of gram-negative bacteria in dry cow secretion. J. Dairy Sci. 1990, 73, 363–372. [Google Scholar] [CrossRef]
- Ospina, P.A.; Nydam, D.V.; Stokol, T.; Overton, T.R. Evaluation of nonesterified fatty acids and beta-hydroxybutyrate in transition dairy cattle in the northeastern United States: Critical thresholds for prediction of clinical diseases. J. Dairy Sci. 2010, 93, 546–554. [Google Scholar] [CrossRef] [PubMed]
- Garcia, A.M.B.; Cardoso, F.C.; Campos, R.; Thedy, D.X.; Gonzalez, F.H.D. Metabolic evaluation of dairy cows submitted to three different strategies to decrease the effects of negative energy balance in early postpartum. Pesquisa Vet. Brasil. 2011, 31, 11–17. [Google Scholar] [CrossRef]
- Fontaine, G.L.; Belknap, J.K.; Allen, D.; Moore, J.N.; Kroll, D.L. Expression of interleukin-1 beta in the digital laminae of horses in the prodromal stage of experimentally induced laminitis. Am. J. Vet. Res. 2001, 62, 714–720. [Google Scholar] [CrossRef] [PubMed]
- Ishikawa, Y.; Nakada, K.; Hagiwara, K.; Kirisawa, R.; Iwai, H.; Moriyoshi, M.; Sawamukai, Y. Changes in interleukin-6 concentration in peripheral blood of pre- and post-partum dairy cattle and its relationship to postpartum reproductive diseases. J. Vet. Med. Sci. 2004, 66, 1403–1408. [Google Scholar] [CrossRef] [PubMed]
- Hagiwara, K.; Yamanaka, H.; Hisaeda, K.; Taharaguchi, S.; Kirisawa, R.; Iwai, H. Concentrations of IL-6 in serum and whey from healthy and mastitic cows. Vet. Res. Commun. 2001, 25, 99–108. [Google Scholar] [CrossRef] [PubMed]
- Mackiewicz, A.; Speroff, T.; Ganapathi, M.K.; Kushner, I. Effects of cytokine combinations on acute phase protein production in two human hepatoma cell lines. J. Immunol. 1991, 146, 3032–3037. [Google Scholar] [PubMed]
- Arredouani, M.S.; Kasran, A.; Vanoirbeek, J.A.; Berger, F.G.; Baumann, H.; Ceuppens, J.L. Haptoglobin dampens endotoxin-induced inflammatory effects both in vitro and in vivo. Immunology 2005, 114, 263–271. [Google Scholar] [CrossRef] [PubMed]
- Ametaj, B.N.; Zebeli, Q.; Iqbal, S.; Dunn, S.M. Meeting the challenges of improving Health in Periparturient Dairy Cows. Adv. Dairy Technol. 2012, 24, 287–317. [Google Scholar]
- Hiss, S.; Mielenz, M.; Bruckmaier, R.M.; Sauerwein, H. Haptoglobin concentrations in blood and milk after endotoxin challenge and quantification of mammary Hp mRNA expression. J. Dairy Sci. 2004, 87, 3778–3784. [Google Scholar] [CrossRef]
- Huzzey, J.M.; Duffield, T.F.; LeBlanc, S.J.; Veira, D.M.; Weary, D.M.; von Keyserlingk, M.A.G. Short communication: Haptoglobin as an early indicator of metritis. J. Dairy Sci. 2009, 92, 621–625. [Google Scholar] [CrossRef] [PubMed]
- Skinner, J.G.; Brown, R.A.L.; Roberts, L. Bovine haptoglobin response in clinically defined field conditions. Vet. Rec. 1991, 128, 147–149. [Google Scholar] [CrossRef] [PubMed]
- Horadagoda, N.U.; Knox, K.M.G.; Gibbs, H.A.; Reid, S.W.J.; Horadagoda, A.; Edwards, S.E.R.; Eckersall, P.D. Acute phase proteins in cattle: Discrimination between acute and chronic inflammation. Vet. Rec. 1999, 144, 437–441. [Google Scholar] [CrossRef] [PubMed]
- Zeng, R. Milk and Blood Concentrations of Lipopolysaccharide-Bonding Protein in Cows with Naturally-Occurring Subclinical and Clinical Mastitis. Master’s Thesis, University of Maryland, College Park, MD, USA, 2008. [Google Scholar]
- Zebeli, Q.; Terrill, S.J.; Mazzolari, A.; Dunn, S.M.; Yang, W.Z.; Ametaj, B.N. Intraruminal administration of Megasphaera elsdenii modulated rumen fermentation profile in mid-lactation dairy cows. J. Dairy Res. 2012, 79, 16–25. [Google Scholar] [CrossRef] [PubMed]
- Olechnowicz, J.; Jaskowski, J.M. Behaviour of lame cows: A review. Vet. Med-Czech. 2011, 56, 581–588. [Google Scholar]
- Roche, J.R.; Friggens, N.C.; Kay, J.K.; Fisher, M.W.; Stafford, K.J.; Berry, D.P. Invited review: Body condition score and its association with dairy cow productivity, health, and welfare. J. Dairy Sci. 2009, 92, 5769–5801. [Google Scholar] [CrossRef] [PubMed]
- Greenough, P.R. Bovine Laminitis and Lameness—A Hands On Approach, 1st ed.; Saunders Elsevier: Philadelphia, PA, USA, 2007. [Google Scholar]
- Zebeli, Q.; Ametaj, B.N. Relationships between rumen lipopolysaccharide and mediators of inflammatory response with milk fat production and efficiency in dairy cows. J. Dairy Sci. 2009, 92, 3800–3809. [Google Scholar] [CrossRef] [PubMed]
- Toni, F.; Vincenti, L.; Grigoletto, L.; Ricci, A.; Schukken, Y.H. Early lactation ratio of fat and protein percentage in milk is associated with health, milk production, and survival. J. Dairy Sci. 2011, 94, 1772–1783. [Google Scholar] [CrossRef] [PubMed]
- Bergk, N.; Swalve, H.H. Fat-to-protein-ratio in early lactation as an indicator of herdlife for first lactation dairy cows. Zuchtungskunde 2011, 83, 89–103. [Google Scholar]
- Zebeli, Q.; Dijkstra, J.; Tafaj, M.; Steingass, H.; Ametaj, B.N.; Drochner, W. Modeling the adequacy of dietary fiber in dairy cows based on the responses of ruminal pH and milk fat production to composition of the diet. J. Dairy Sci. 2008, 91, 2046–2066. [Google Scholar] [CrossRef] [PubMed]
- Wellnitz, O.; Baumert, A.; Saudenowa, M.; Bruckmaier, R.M. Immune response of bovine milk somatic cells to endotoxin in healthy quarters with normal and very low cell counts. J. Dairy Res. 2010, 77, 452–459. [Google Scholar] [CrossRef] [PubMed]
© 2015 by the authors; licensee MDPI, Basel, Switzerland. This article is an open access article distributed under the terms and conditions of the Creative Commons Attribution license (http://creativecommons.org/licenses/by/4.0/).
Share and Cite
Zhang, G.; Hailemariam, D.; Dervishi, E.; Deng, Q.; Goldansaz, S.A.; Dunn, S.M.; Ametaj, B.N. Alterations of Innate Immunity Reactants in Transition Dairy Cows before Clinical Signs of Lameness. Animals 2015, 5, 717-747. https://doi.org/10.3390/ani5030381
Zhang G, Hailemariam D, Dervishi E, Deng Q, Goldansaz SA, Dunn SM, Ametaj BN. Alterations of Innate Immunity Reactants in Transition Dairy Cows before Clinical Signs of Lameness. Animals. 2015; 5(3):717-747. https://doi.org/10.3390/ani5030381
Chicago/Turabian StyleZhang, Guanshi, Dagnachew Hailemariam, Elda Dervishi, Qilan Deng, Seyed A. Goldansaz, Suzanna M. Dunn, and Burim N. Ametaj. 2015. "Alterations of Innate Immunity Reactants in Transition Dairy Cows before Clinical Signs of Lameness" Animals 5, no. 3: 717-747. https://doi.org/10.3390/ani5030381