Genetic Mutation Analysis of High and Low IgY Chickens by Capture Sequencing
by
 ,
,
Qiao Wang
1,2,† ,
,
Fei Wang
1,2,†,
Lu Liu
1,3,
Qinghe Li
1,2,
Ranran Liu
1,2,
Maiqing Zheng
1,2,
Huanxian Cui
1,2,
Jie Wen
1,2 and
Guiping Zhao
1,2,4,* 1
Institute of Animal Sciences, Chinese Academy of Agricultural Sciences, Beijing 100193, China
2
State Key Laboratory of Animal Nutrition, Beijing 100193, China
3
College of Animal Science and Technology, Yangzhou University, Yangzhou 225009, China
4
School of Life Science and Engineering, Foshan University, Foshan 528225, China
*
Author to whom correspondence should be addressed.
†
These authors contributed equally to this work.
Animals 2019, 9(5), 272; https://doi.org/10.3390/ani9050272
Submission received: 6 March 2019
/
Revised: 19 May 2019
/
Accepted: 20 May 2019
/
Published: 23 May 2019
(This article belongs to the Collection Applications of Quantitative Genetics in Livestock Production)
Abstract
:Simple Summary
Immunoglobulin Y (IgY) is the major antibody produced by hens and it endows their offspring with effective humoral immunity against the pathogens. In previous research, we identified 13 genomic regions that were significantly associated with the serum IgY level or antibody responses to sheep red-blood-cells, but the specific mutations in these regions have not been reported. Therefore, we screened for variations in these regions in White Leghorn and Beijing-You chickens with high and low IgY. Our study identified 35,154 mutations and 829 Indels which were associated with IgY levels in both lines. Many non-synonymous mutations were located in crucial genes related to the host immune function, indicating the possible involvement of these genes in controlling IgY levels.
Abstract
Based on the results of our previous genome-wide association study (GWAS), a comprehensive analysis on single nucleotide polymorphisms (SNPs) was performed on White Leghorn and Beijing-You chickens with high and low IgY levels in defined genomic regions using the capture-sequencing approach. High and low IgY chickens showed substantial genetic variations. In total, more than 30,000 SNPs were found in all four chicken groups, among which 1045 were non-synonymous mutations resulting in amino acids alterations. In total, 23,309 Indels were identified. Among the 1169 Indels that were found only in Beijing-You chickens, 702 were shared between high and low IgY chickens compared with the reference genome. There were 1016 Indels specific to the White Leghorn chickens, among which 188 were high IgY-specific, 134 were low IgY-specific and 694 were shared between the high and low IgY chicken lines. Many genetic mutations were located in the regulatory regions of important immunomodulatory genes, including TAP1, TAP2 and BF1. Our findings provide an in-depth understanding of genetic mutations in chicken microchromosomes.
1. Introduction
The chicken karyotype consists of 39 chromosome pairs, including one sex chromosome pair. With the development of sequencing technology, the chicken W chromosome was sequenced recently [1], but some genomic regions remain poorly annotated due to their complex sequence composition. These include microchromosome 16 (GGA16) and 19 (GGA19). Microchromosomes are denser in genetic material compared with macrochromosomes. The size of GGA16 is estimated at 9–11 Mb, but only 0.5 Mb have been assembled with known sequences [2,3]. GGA16 is of great interest because many genes on this chromosome are closely related to infectious diseases responses. The nucleolus organizing region (NOR), which is a cluster of genes that encode ribosomal RNAs 28S, 18S and 5.8S, is located on GGA16. The NOR copy number and expression level affect cell growth, cell differentiation and protein synthesis capacity [4,5]. The chicken major histocompatibility complex (MHC) has also been mapped to GGA16 [6]. Proteins encoded by the MHC are widely involved in viral and bacterial disease resistance and immune response traits of chickens [7]. Class I and II MHCs include the BF and BL genes which determine resistance and susceptibility to various diseases [8].The class IV MHC encodes erythrocyte antigens, which are used for MHC haplotype classification. CD1 genes constitute a family of conserved cell-surface proteins with crucial roles in the immune system related to antigen presentation to T cells encoded by MHC [5,9].
There are three types of immunoglobulins, including IgM, IgA and IgY, which have been identified in chickens. IgY is the major antibody in chickens [10]. IgY accumulates in egg yolk and provides the offspring with powerful immunity against avian pathogens [10]. A genome-wide association study (GWAS) was performed for IgY levels and antibody responses to sheep red-blood-cells (SRBC) using the chicken 60k high-density single nucleotide polymorphism (SNP) array [11]. There were five SNPs found to be significantly associated with the serum IgY levels. These SNPs were found on chicken chromosome 16: 5,661,311 to 4,412,041 and chromosome 11: 4,412,041 to 5,661,311 [11]. There were five SNPs in chromosome 19 (spanning 8,974,480 to 9,730,805) and three SNPs in chromosome 11 (spanning 13,531,246 to 14,463,528) which were shown to be associated with antibody responses to sheep red-blood-cells (SRBC).
In the present study, SNPs were screened in the above-mentioned genomic regions between high and low IgY chickens in the White Leghorn and Beijing-You lines. The capture chip was designed based on all known sequences of chromosome 16 and the genomic regions covering SNPs that have been associated with IgY levels and antibody responses to SRBC in other chromosomes. The captured DNA was then sequenced using high-throughput sequencing technology. Thousands of genetic variations were identified between the high and low IgY chickens, indicating substantial genetic differences between the lines.
2. Materials and Methods
2.1. Animals and Sample Collection
The animal experiments were carried out in accordance with the Guidelines for Experimental Animals established by the Ministry of Science and Technology (Beijing, China) and the study was approved by the Animal Management Committee of the Institute of Animal Sciences, Chinese Academy of Agricultural Sciences (IAS-CAAS, Beijing, China). Ethical approval regarding animal survival was given by the animal ethics committee of IAS-CAAS (approval number: IASCAAS-AE20140615).
Chickens used in the present study were of the White Leghorn and Beijing-You lines. Beijing-You chickens, who were not subjected to artificial selection, were chosen for this study according to their IgY content. White Leghorn chickens were the result of 7 generations of artificial selection based on anti-SRBC titers. The IgY levels of 527 White Leghorn and 726 Beijing-You chickens were measured by enzyme-linked immune sorbent assay (ELISA). Chickens were divided into high and low IgY groups based on the IgY levels. There was a 5.1-fold difference in the IgY levels between high and low IgY White Leghorn chickens, and a 6.2-fold difference between high-and low-IgY Beijing-You chickens (Table 1).
Forty animals of both varieties with the highest and lowest IgY levels divided into four groups. Each group was randomly and equally divided into four repeats, each containing 10 individuals. Blood was collected from each animal and genomic DNA was isolated using phenol–chloroform extraction. DNA from the 10 individuals of each repeat was pooled together and sent for high-throughput sequencing by HiSeq2500 for SNPs and Indels.
Genomic DNA was obtained from 34 and 37 animals from lines that were selected for susceptibility and resistance to Marek’s disease respectively, from researchers at Aarhus University (Aarhus, Denmark). This DNA was utilized for sequence analysis of BF1.
2.2. ELISA
Serum IgY levels of chickens from both lines were determined using an IgY Chicken ELISA Kit (Abcam) according to the manufacturer’s instructions.
2.3. Capture Sequencing, Sequence Alignment and Data Analysis
The sequence capture chip was designed by Roche Nimblegen to cover a 3.268 Mb region accounting for 97.73% of the 3.371 Mb region associated with the specific phenotypes of interest. Sequences generated by high-throughput sequencing were aligned to the chicken reference genome (galGal4) by SOAP aligner. High confidence SNPs and Indels were identified by SAM tools with the criteria of coverage >4 and FDR < 0.01. Sequences generated by high-throughput sequencing were aligned to the chicken reference genome (galGal4) to identify SNPs and Indels.
2.4. Validation of SNPs and Indels
A total of 24 SNPs covering the second-generation sequencing region were randomly selected for validation. A mutation common to both Beijing-You and White Leghorns, plus a unique Indel, with high-IgY were validated. Validation populations were selected from the high-throughput sequence samples. In particular, DNA was pooled from 10 individuals in each group to verify SNPs. Regarding the Indel validation, all sequencing samples were used. Primers were designed around the SNPs and Indels, and PCR amplifications of multiple samples were carried out using High Fidelity PCR Super Mix (Transgen, Biotech). PCR products were sequenced using an ABI PRISM® 3100 Genetic Analyzer.
3. Results
3.1. Overall Characteristics of SNPs in High and Low IgY Beijing-You and White Leghorn Chickens
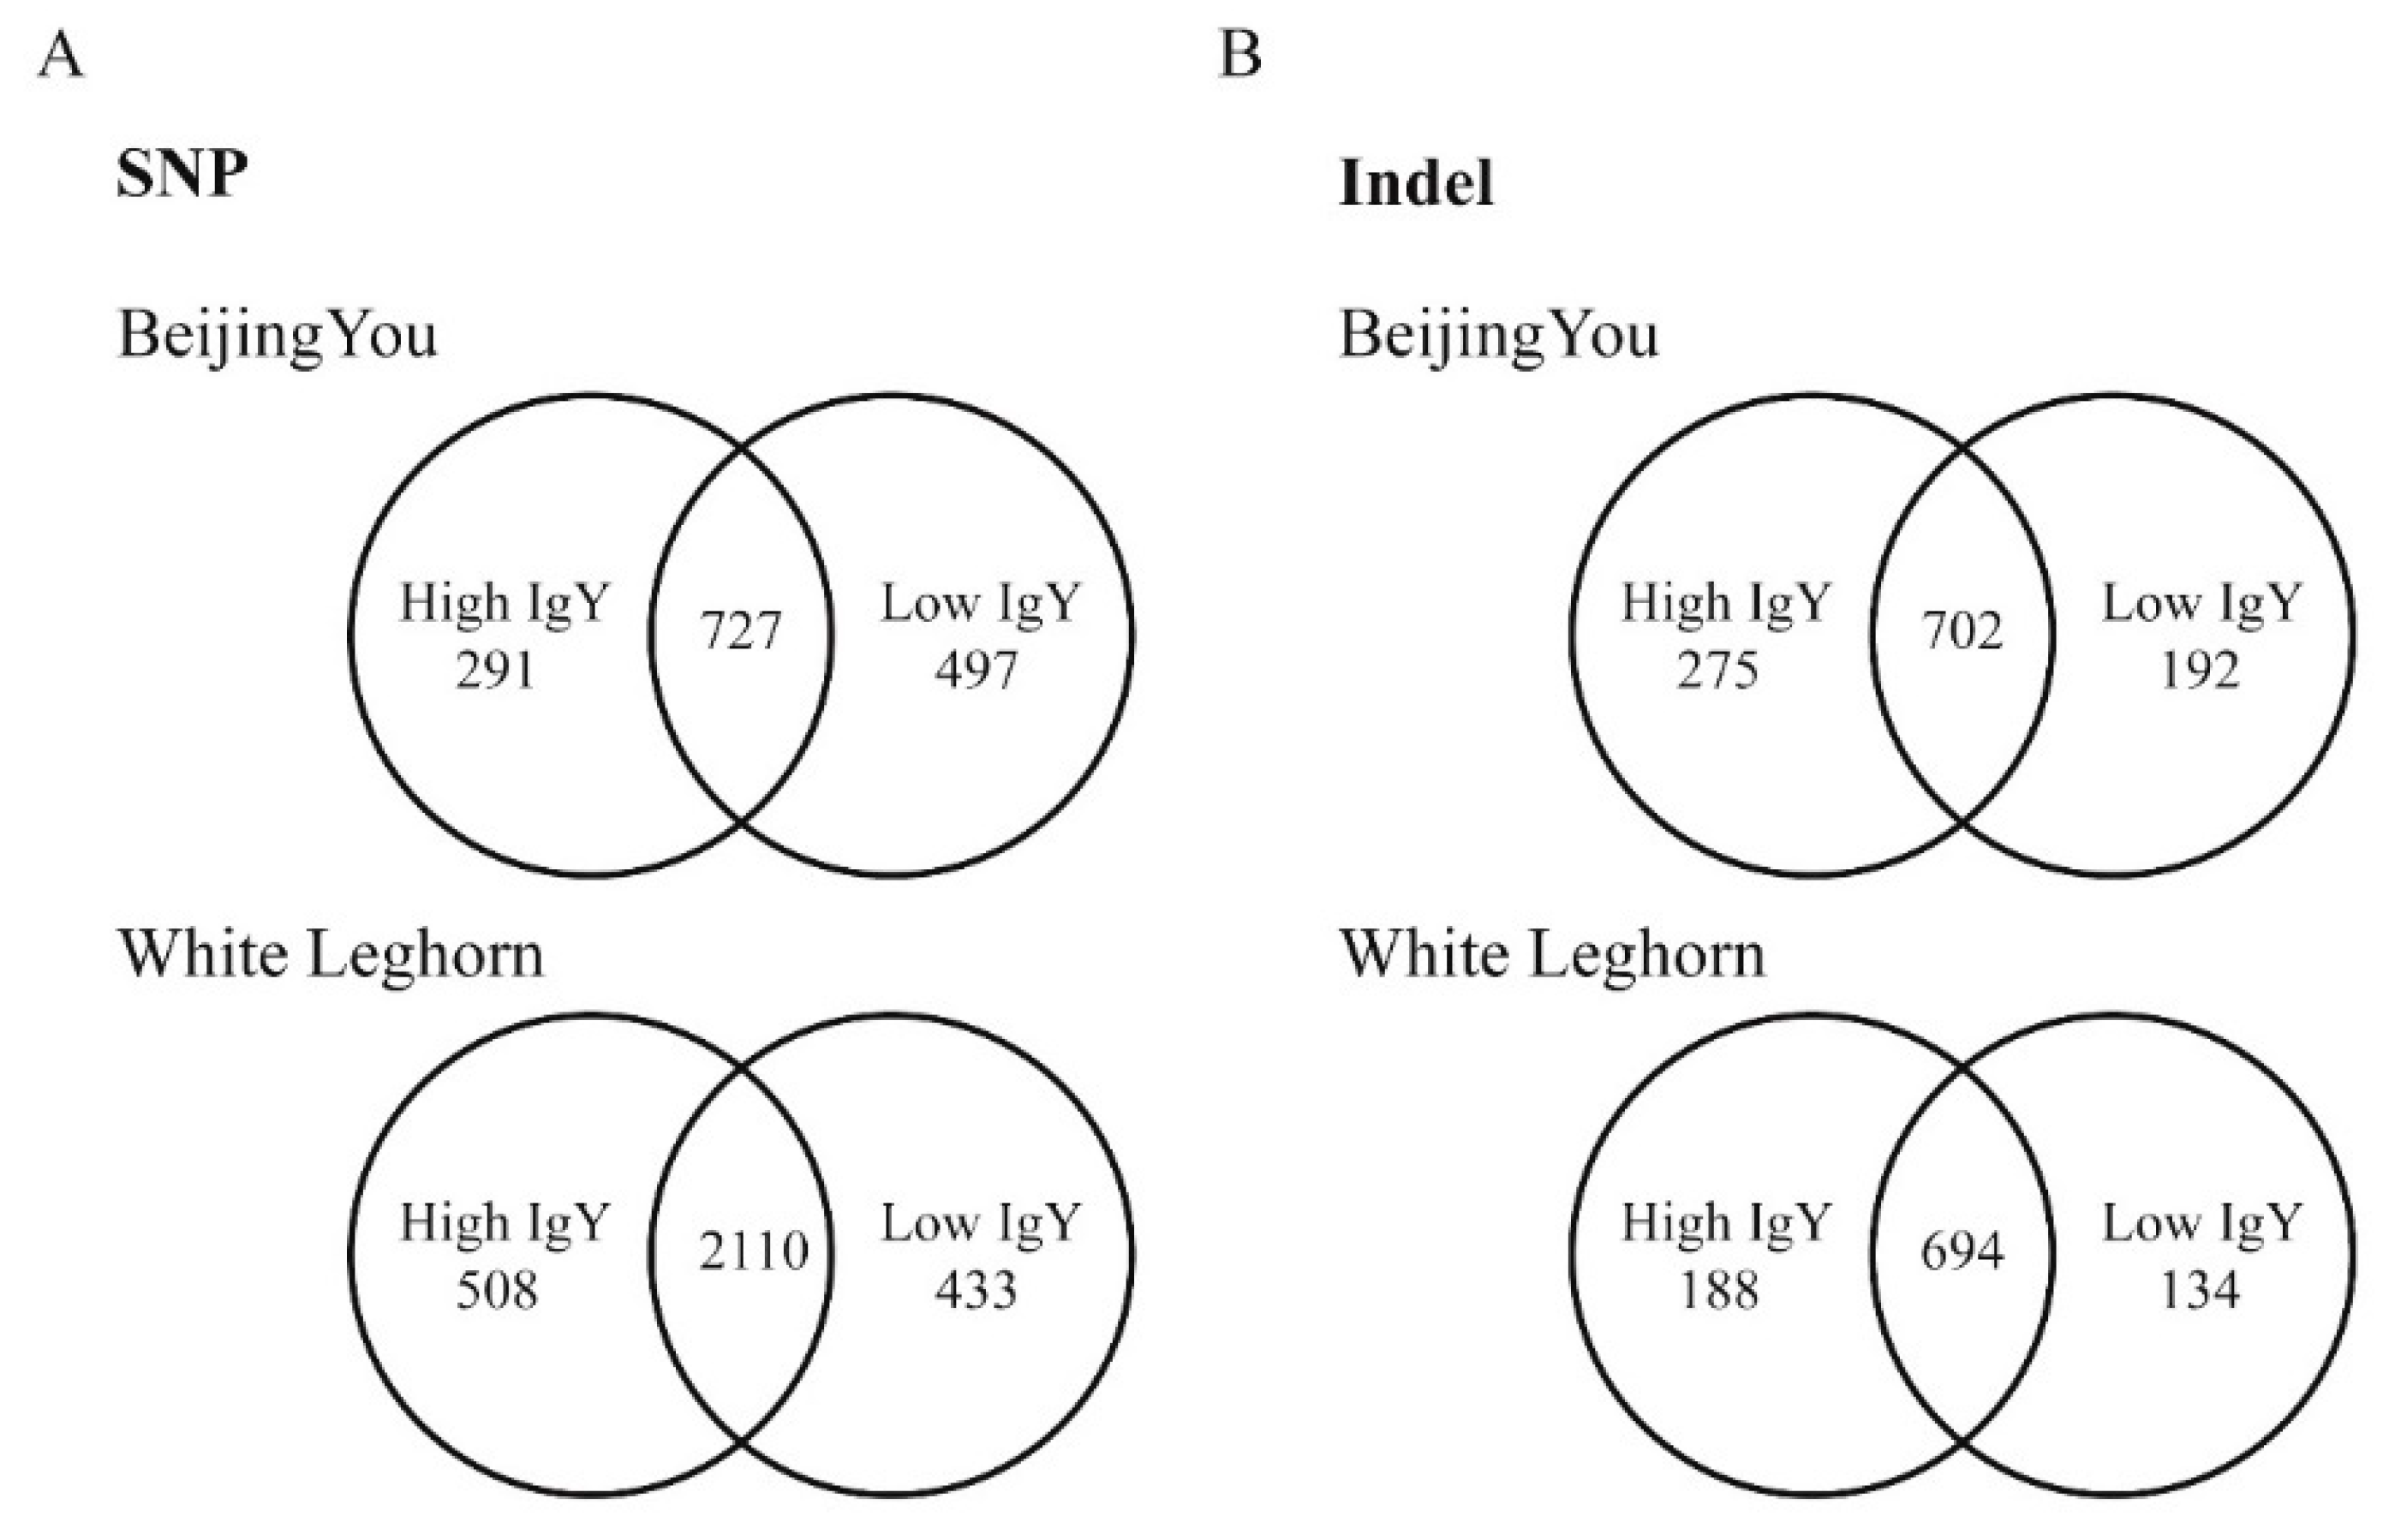
A capture DNA array was designed to cover genomic regions in chromosome 16 and those surrounding significant SNPs associated with IgY levels and antibody responses to SRBC (Table 2). In total, 2.55 Mb of genomic regions were included in our capture chip. There were four duplicates of each chicken line sequenced by Hiseq-2500, and 3.75–7.29 Gb of data was generated for each sample pool. Among all four chicken lines, 35,154 SNPs were identified within the evaluated genomic regions (Table 3). Among these SNPs, 1045 were non-synonymous mutations, resulting in amino acids mutations (Table 3). Regarding the 35,154 SNPs, 1515 were found only in Beijing-You chickens and 727 were shared between high and low IgY chickens compared with the reference genome (Figure 1A and Table S1 in the Supplementary Materials). Further, 3051 SNPs were identified only in White Leghorn chickens, and 2110 of these were shared between high- and low-IgY chickens (Figure 1A and Table S2).
3.2. Characteristics of the Indels in High and Low IgY Beijing-You and White Leghorn Chickens
In total, 23,309 Indels were identified (Table 4), and 1169 Indels were found only in Beijing-You chickens. Among these, 702 were shared between high- and low-IgY chickens compared with the reference genome (Figure 1B and Table S3). In Beijing-You chickens, high-IgY specific Indels accounted for 23.5% of the total Indels, and low -IgY specific Indels accounted for 16.4%. There were 1016 Indels identified only in White Leghorn chickens, among which 188 were high-IgY-specific, 134 were low-IgY-specific and 694 were shared between the high -and low-IgY chicken lines (Figure 1B and Table S4).
3.3. Validations of SNPs and Indels
Of the SNPs identified by high-throughput sequencing, 87.5% were confirmed (Table 5), indicating the high accuracy of the SNP identifications. A 9 bp deletion with the sequence of CCACTGCCA was found in the intron of BF1. The Indels in the BF1 gene were confirmed in an expanded group of 160 chickens (Table 5).
Further validation of a BF1 gene deletion was carried out in a chicken population from the Aarhus University selected for Marek’s disease resistance [12]. Genomic DNA of 34 and 37 individuals from the susceptible and the resistant chicken lines respectively, were utilized for sequence analysis of BF1, respectively. No deletions were found in either the susceptible or resistant chickens, but a 3 bp mutation was found in both lines. The genotypes of all the chickens from the susceptible chicken line were wild type, but the sequence composition of the 9 bp deletion in the resistant chicken line changed to CTACAGCCC (Table 6).
3.4. Comparative Analysis of the Specific SNPs and Indels in the High-IgY White Leghorn and Beijing-You Chicken Lines or Low IgY Counterparts
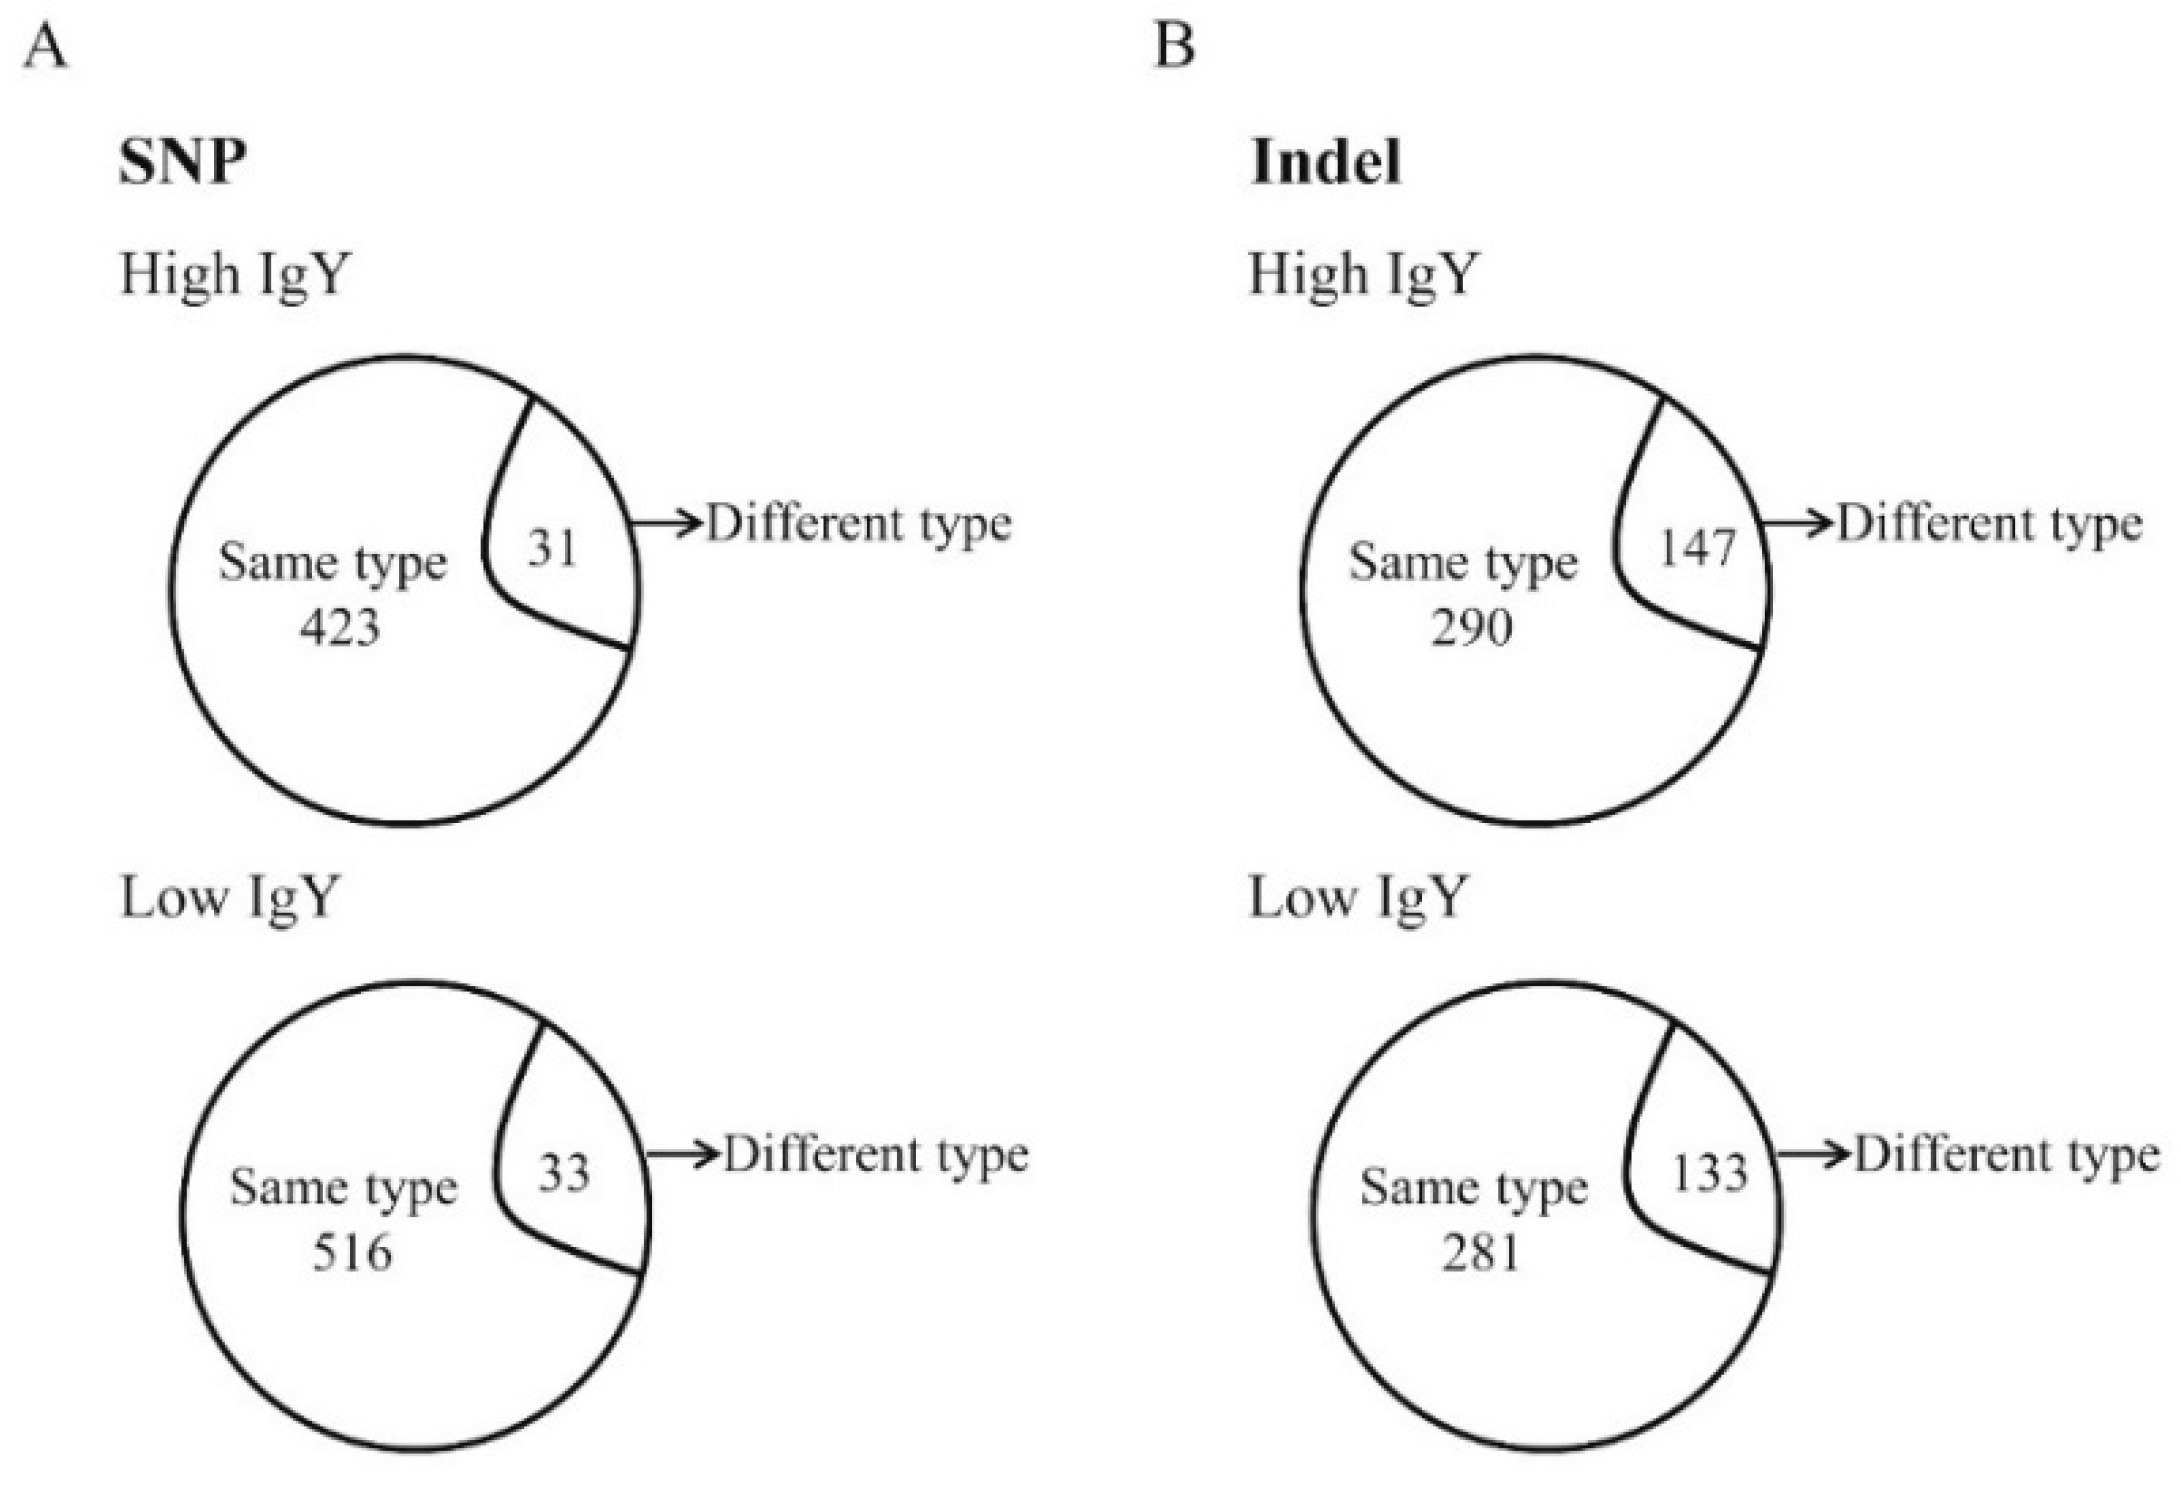
Analyses of high-and low-IgY specific SNPs and Indels were performed by comparing sequence differences of high-IgY White Leghorn and Beijing-You chickens with their low-IgY counterparts. It was identified that 423 SNPs related to high-IgY level in both White Leghorn and Beijing-You chickens (Figure 2A and Table S5), among which 31 SNPs shared the same positions but had different mutations in the two high-IgY lines. Regarding low-IgY levels, 516 SNPs were found to be low-IgY-specific (Figure 2A and Table S6) and 33 of these were in the same positions but showed different mutations between the White Leghorn and Beijing-You chicken lines.
A total of 290 Indels were found in both the high-IgY White Leghorn and Beijing-You chicken lines (Figure 2B and Table S7). Two hundred and eighty-one low-IgY specific Indels in the same genomic regions, while 133 Indels were in different positions compared with the high IgY group (Figure 2B and Table S8).
3.5. IgY-Related Non-Synonymous SNPs in Coding DNA Sequences and Proximal Promoter Regions
In this study, particular focus was placed on the genetic mutations in coding DNA sequences (CDS) and proximal promoter regions of genes. Therefore, mutations can generate either missense or frame shift mutations in proteins or alter the transcriptional activity of genes. Most chicken gene promoters have not been mapped in detail, and therefore we defined the proximal promoter from the transcription start site (TSS) to 2000bp upstream of the TSS. There were 20 and 19 non-synonymous SNPs identified in CDS regions and 20 and 19 SNPs in proximal promoter regions found in high IgY White Leghorn and Beijing-You chickens (Table 7) respectively. Regarding the above SNPs, 18 in CDS regions and eight in proximal promoters were shared in White Leghorn and Beijing-You chickens (Table 7). There were 21 and 15 non-synonymous SNPs found in CDS regions of low IgY White Leghorn and Beijing-You chickens (Table 6), while nine and 11 SNPs in proximal promoters were identified in low-IgY White Leghorn and Beijing-You chickens respectively (Table 7). Among low-IgY White Leghorn and Beijing-You chickens, 14 and 11 shared SNPs were identified in CDS regions and proximal promoters respectively.
An analysis of genes that harbored the important common SNPs was undertaken in the promoter regions and CDS regions that were shared by both chicken breeds. In high IgY chicken lines, common SNPs in promoters mapped to three genes, including transporter 2 (TAP2), AKT interacting protein (AKTIP) and TAP binding protein (TAPBP) (Table 8). Both TAP2 and TAPBP are closely related to MHC class I molecules and are known to be involved in immune responses in vivo. Common non-synonymous SNPs of high IgY chicken lines in CDS regions are mapped to BLEC2(NK receptor-like), MHC BF1 class I(BF1), TAP2, tripartite motif containing 41(TRIM41), major histocompatibility complex class I antigen BF2 (BF2) and transporter 1 (TAP1) (Table 8). TAP2 contained SNPs in both the promoter and CNS regions, indicating a strong selection pressure on this immune-related gene when selecting for high IgY levels.
There were five genes that had common SNPs in their proximal promoter regions in the low-IgY chicken lines, including TAP1, BF2, tumor necrosis factor alpha-induced protein 1 (TNFAIP1), major histocompatibility complex class II beta chain (BMA2) and AKTIP. In the CDS regions, common SNPs were found in TAP1, BF2, BF1 and tripartite motif containing 7 (TRIM7.1). TAP1 and BF2 showed SNPs in both proximal promoter and CDS regions in the low-IgY chicken lines.
3.6. Genomic Distribution of High and Low IgY-Specific Indels
Compared with SNPs, fewer common Indels were found in the White Leghorn and Beijing-You chicken lines. Only a 9 bp deletion was shared between the high-IgY chicken lines and no shared Indels were found between low-IgY chicken lines (Table 9). This deletion was located in an overlapping TAP1 3′UTR and BF1 genomic sequence and was further validated by Sanger sequencing.
4. Discussion
Based on the results of a previous genome-wide association study (GWAS),a capture-sequencing approach was performed to identify variants in defined genomic regions among chickens with high- and low-IgY levels in the White Leghorn and Beijing-You line. In total, 35,154 SNPs and 23,309 Indels were identified. Among these mutations, of particular interest were the genetic mutations in proximal promoters and CDS regions, as such mutations lead to changes in promoter activity or amino acid sequences. Transcription factors can bind to promoter regions and initiate gene transcription [13]. Genetic mutations in these regions can block the binding of transcription factors and thus suppress gene transcriptional activity. Amino acid changes in critical positions may even cause changes in protein structure. There were three and five genes shown to contain SNPs in proximal promoter regions in the high- and low-IgY chickens, among which the TAP2 gene was identified in both groups. There were five genes, including TAP2, BLEC2, BF1, BF2, TAP1 and TRIM41, that have common non-synonymous SNPs in CDS regions in the high IgY group in both White Leghorn and Beijing-You chickens. TAP1, BF1, BF2 and TRIM7.1 contained non-synonymous SNPs in their CDS regions in the low-IgY groups of both lines. Both the high- and low-IgG groups contained SNPs in the CDS regions of TAP1, BF1 and BF2.
Many of the genes with mutations in the proximal promoter and CDS regions play crucial roles in host immune function. TAP1 forms a heterodimeric complex with TAP2 that has transporter activity. The TAP complex is involved in transporting antigens to the endoplasmic reticulum to associate with MHC class I and promote immune responses against infection [14]. ICP47 encoded by the herpes simplex virus (HSV) is known to inhibit peptide binding to TAP and impairs peptide loading into MHC class I molecules [14,15]. In the present study, SNPs were found in TAP1 in the CDS regions of high-IgY chickens and in both the CDS regions and proximal promoter regions of low-IgY chickens. SNPs were also found in TAP2 in CDS regions and proximal promoter, but only in the high IgY chickens. In addition to the SNPs, a 9 bp deletion was identified in the region overlapping the TAP 3′UTR, and the genomic DNA region of BF1, indicating the potential impact of TAP1 and TAP2 mutations on chicken immune molecules.
The chicken MHC B region encodes class I and II molecules. Different haplotypes determine the resistance or susceptibility to infectious diseases [8]. BF1 and BF2 are encoded by the chicken MHC class I genes. As the dominant MHC class I gene, BF2 is transcribed more abundantly than BF1 [16]. Both BF1 and BF2 are deeply involved in antigen processing and immune response. In the present study, SNPs located in both the proximal promoter regions and CDS regions of BF2 were identified in low-IgY chickens as well as in the CDS regions of BF2 in high-IgY chickens. In addition to the SNPs, a nine base pairs deletion was identified in the intron of BF1. As BF1 is located in the chicken MHC which has strong effects on host resistance to infectious pathogens, this deletion was examined in well-known chicken selection lines for Marek’s disease resistance from Aarhus University [12]. No deletions were found in either the susceptible or the resistant lines, but SNPs in three bases were identified in the resistant chicken line at the same locus as the 9 bp deletion. These results strongly implicated BF1′s role in resistance to Marek’s disease.
The two tripartite (TRIM) motif containing proteins, TRIM41 and TRIM7.1, have been shown to contain SNPs in the CDS. The TRIM protein family includes more than 100 members with a conserved TRIM motif and E3 ubiquitin ligase activity [17,18]. Most TRIM proteins are closely associated with the degradation of exogenous and endogenous proteins through the ubiquitin-proteasome pathway. TRIM41 blocks the transcription and replication of hepatitis B virus (HBV) by inhibiting the enhancer II activity of HBV in human hepatoma cells [19]. Previous studies have shown that TRIM7 can promote lung cancer development and a knockdown of TRIM7 reduced tumor growth [20]. TRIM7 and TRIM41 both belong to the TRIM-B30.2 protein family and are located in a region surrounding the chicken BF/BL region of the B complex on chromosome 16 [21]. Non-synonymous SNPs were found in the CDS regions of TRIM7 and TRIM41 in low IgY chickens and high IgY chickens respectively, indicating the potential involvement of these genes in the selection for IgY level.
5. Conclusions
In the present study, SNPs and Indels were identified in genomic regions associated with IgY level in chickens. A large number of genetic mutations were identified in the studied genomic regions, revealing abundant genetic diversity between high and low IgY chickens. The chickens used in this study showed substantial differences in IgY levels. In total, it was found that 35,154 and 829 Indels respectively, in the high and low lines. Among them, 18 in CDS regions and 8 in proximal promoters were shared between White Leghorn and Beijing-You chickens with high IgY level. Among low-IgY White Leghorn and Beijing-You chickens, 14 and 11 shared common SNPs in CDS regions and proximal promoters respectively. In addition to the above SNPs common between the two chicken breeds, other identified SNPs and Indels were specific to White Leghorn or Beijing-You chickens, indicating the fundamental role of genetic mutations in modulating antibody levels. This study contributes valuable insights into the understanding of immune gene enriched microchromosome of chickens.
Supplementary Materials
The following are available online at https://www.mdpi.com/2076-2615/9/5/272/s1. Table S1: the unique SNPs in Beijing-You chickens, Table S2: the unique SNPs in White Leghorn chickens, Table S3: the unique Indels in Beijing-You chickens, Table S4: the unique Indels in White Leghorn chickens, Table S5: SNPs related to high-IgY level in both varieties, Table S6: SNPs related to low-IgY level in both varieties, Table S7: Indels related to high-IgY level in both varieties, Table S8: Indels related to low-IgY level in both varieties.
Author Contributions
Conceptualization and methodology, Q.W., F.W., Q.L., and G.Z.; validation, Q.L. and G.Z.; formal analysis, Q.W., F.W. and L.L.; investigation, Q.L., M.Z., H.C. and G.Z.; resources, J.W. and G.Z.; data curation, Q.W., F.W.; writing—original draft preparation, Q.W., F.W.; writing—review and editing, Q.L. and G.Z.; visualization, Q.W., F.W.; supervision, Q.L. and G.Z.; project administration, J.W. and G.Z.; funding acquisition, R.L. and G.Z.
Funding
This research was funded by the Natural Science Foundation of Beijing (6182032), National High-Tech R and D Program (2015BAD03B03) and the Agricultural Science and Technology Innovation Program (ASTIPIAS04) of Chinese Academy of Agricultural Sciences.
Acknowledgments
We would like to express our sincere gratitude to Helle Risdahl Juul-Madsen from Aarhus University for providing the genomic DNA of the chicken lines with different resistance to Marek’s Disease.
Conflicts of Interest
The authors declare that they have no conflicts of interest.
References
- Bellott, D.W.; Skaletsky, H.; Cho, T.J.; Brown, L.; Locke, D.; Chen, N.; Galkina, S.; Pyntikova, T.; Koutseva, N.; Graves, T.; et al. Avian W and mammalian Y chromosomes convergently retained dosage-sensitive regulators. Nat. Genet. 2017, 49, 387–394. [Google Scholar] [CrossRef] [Green Version]
- Solinhac, R.; Leroux, S.; Galkina, S.; Chazara, O.; Feve, K.; Vignoles, F.; Morisson, M.; Derjusheva, S.; Bed’Hom, B.; Vignal, A.; et al. Integrative mapping analysis of chicken microchromosome 16 organization. BMC Genom. 2010, 11, 616. [Google Scholar] [CrossRef] [PubMed]
- Chaves, L.D.; Krueth, S.B.; Reed, K.M. Characterization of the turkey MHC chromosome through genetic and physical mapping. Cytogenet. Genome Res. 2007, 117, 213–220. [Google Scholar] [CrossRef]
- Delany, M.E.; Robinson, C.M.; Goto, R.M.; Miller, M.M. Architecture and organization of chicken microchromosome 16: Order of the NOR, MHC-Y, and MHC-B subregions. J. Hered. 2009, 100, 507–514. [Google Scholar] [CrossRef]
- Miller, M.M.; Wang, C.; Parisini, E.; Coletta, R.D.; Goto, R.M.; Lee, S.Y.; Barral, D.C.; Townes, M.; Roura-Mir, C.; Ford, H.L.; et al. Characterization of two avian MHC-like genes reveals an ancient origin of the CD1 family. Proc. Natl. Acad. Sci. USA 2005, 102, 8674–8679. [Google Scholar] [CrossRef] [Green Version]
- Nikbakht, G.; Esmailnejad, A. Chicken major histocompatibility complex polymorphism and its association with production traits. Immunogenetics 2015, 67, 247–252. [Google Scholar] [CrossRef]
- Wang, Y.; Qiu, M.; Yang, J.; Zhao, X.; Wang, Y.; Zhu, Q.; Liu, Y. Sequence variations of the MHC class I gene exon 2 and exon 3 between infected and uninfected chickens challenged with Marek’s disease virus. Infect. Genet. Evol. 2014, 21, 103–109. [Google Scholar] [CrossRef] [PubMed]
- Shaw, I.; Powell, T.J.; Marston, D.A.; Baker, K.; van Hateren, A.; Riegert, P.; Wiles, M.V.; Milne, S.; Beck, S.; Kaufman, J. Different evolutionary histories of the two classical class I genes BF1 and BF2 illustrate drift and selection within the stable MHC haplotypes of chickens. J. Immunol. 2007, 178, 5744–5752. [Google Scholar] [CrossRef]
- Salomonsen, J.; Sorensen, M.R.; Marston, D.A.; Rogers, S.L.; Collen, T.; van Hateren, A.; Smith, A.L.; Beal, R.K.; Skjodt, K.; Kaufman, J. Two CD1 genes map to the chicken MHC, indicating that CD1 genes are ancient and likely to have been present in the primordial MHC. Proc. Natl. Acad. Sci. USA 2005, 102, 8668–8673. [Google Scholar] [CrossRef] [PubMed] [Green Version]
- Dias, D.S.W.; Tambourgi, D.V. IgY: A promising antibody for use in immunodiagnostic and in immunotherapy. Vet. Immunol. Immunopathol. 2010, 135, 173–180. [Google Scholar] [CrossRef] [PubMed]
- Zhang, L.; Li, P.; Liu, R.; Zheng, M.; Sun, Y.; Wu, D.; Hu, Y.; Wen, J.; Zhao, G. The identification of loci for immune traits in chickens using a genome-wide association study. PLoS ONE 2015, 10, e0117269. [Google Scholar] [CrossRef] [PubMed]
- Dalgaard, T.S.; Vitved, L.; Skjodt, K.; Thomsen, B.; Labouriau, R.; Jensen, K.H.; Juul-Madsen, H.R. Molecular characterization of major histocompatibility complex class I (B-F) mRNA variants from chickens differing in resistance to Marek’s disease. Scand. J. Immunol. 2005, 62, 259–270. [Google Scholar] [CrossRef]
- Merkenschlager, M.; Odom, D.T. CTCF and cohesin: Linking gene regulatory elements with their targets. Cell 2013, 152, 1285–1297. [Google Scholar] [CrossRef]
- Herget, M.; Tampe, R. Intracellular peptide transporters in human--compartmentalization of the “peptidome”. Pflug. Arch. 2007, 453, 591–600. [Google Scholar] [CrossRef] [PubMed]
- Ahn, K.; Meyer, T.H.; Uebel, S.; Sempe, P.; Djaballah, H.; Yang, Y.; Peterson, P.A.; Fruh, K.; Tampe, R. Molecular mechanism and species specificity of TAP inhibition by herpes simplex virus ICP47. EMBO J. 1996, 15, 3247–3255. [Google Scholar] [CrossRef] [PubMed]
- O’Neill, A.M.; Livant, E.J.; Ewald, S.J. The chicken BF1 (classical MHC class I) gene shows evidence of selection for diversity in expression and in promoter and signal peptide regions. Immunogenetics 2009, 61, 289–302. [Google Scholar] [CrossRef] [PubMed]
- Fletcher, A.J.; Towers, G.J. Inhibition of retroviral replication by members of the TRIM protein family. Curr. Top. Microbiol. Immunol. 2013, 371, 29–66. [Google Scholar] [PubMed]
- Micale, L.; Chaignat, E.; Fusco, C.; Reymond, A.; Merla, G. The tripartite motif: Structure and function. Adv. Exp. Med. Biol. 2012, 770, 11–25. [Google Scholar] [PubMed]
- Zhang, S.; Guo, J.T.; Wu, J.Z.; Yang, G. Identification and characterization of multiple TRIM proteins that inhibit hepatitis B virus transcription. PLoS ONE 2013, 8, e70001. [Google Scholar] [CrossRef]
- Chakraborty, A.; Diefenbacher, M.E.; Mylona, A.; Kassel, O.; Behrens, A. The E3 ubiquitin ligase Trim7 mediates c-Jun/AP-1 activation by Ras signalling. Nat. Commun. 2015, 6, 6782. [Google Scholar] [CrossRef]
- Ruby, T.; Bed’Hom, B.; Wittzell, H.; Morin, V.; Oudin, A.; Zoorob, R. Characterisation of a cluster of TRIM-B30.2 genes in the chicken MHC B locus. Immunogenetics 2005, 57, 116–128. [Google Scholar] [CrossRef]
Figure 1.
Summary of genetic mutations between high and low IgY White Leghorn and Beijing-You chickens. (A) Summary of single nucleotide polymorphisms (SNPs). (B) Summary of Indels.
Figure 1.
Summary of genetic mutations between high and low IgY White Leghorn and Beijing-You chickens. (A) Summary of single nucleotide polymorphisms (SNPs). (B) Summary of Indels.

Figure 2.
Comparison of genetic mutations between White Leghorn and Beijing-You chickens. Same type: The mutation between these two breeds is the same; different type: The mutation is different. (A) SNPs. (B) Indels.
Figure 2.
Comparison of genetic mutations between White Leghorn and Beijing-You chickens. Same type: The mutation between these two breeds is the same; different type: The mutation is different. (A) SNPs. (B) Indels.


Table 1.
Averaged immunoglobulin Y (IgY) levels of selected chicken lines.
| Chicken Line | Averaged IgY Level (ng/uL) | High IgY Group (ng/uL) | Low IgY Group (ng/uL) | Fold Changes |
|---|---|---|---|---|
| White leghorn | (n = 527) | (n = 40) | (n = 40) | 5.1 |
| 679.9 ± 768.17 | 1501.70 ± 1678.05 | 293.91 ± 58.29 | ||
| Beijing-You | (n = 726) | (n = 40) | (n = 40) | 6.2 |
| 628.2 ± 923.987 | 1888.84 ± 1189.55 | 302.55 ± 24.91 |
Table 2.
Genomic regions covered by sequence capture chip.
| Chromosome | Genomic Regions | Related Phenotype | Length (Mb) |
|---|---|---|---|
| 11 | 4,412,041–5,661,311 | IgY level | 1.25 |
| 13,531,246–14,463,528 | antibody responses to SRBC | 0.93 | |
| 16 | 1–535,270 | IgY level | 0.54 |
| 19 | 8,974,480–9,730,805 | antibody responses to SRBC | 0.76 |
Table 3.
SNP distribution in different genomic components.
| Homozyg-Ous | Heterozy-Gous | Non-Synonymous | Synonymous | Gene | mRNA | |
|---|---|---|---|---|---|---|
| Number | 28,862 | 6292 | 1045 | 2190 | 18,332 | 22,327 |
| Percent | 82.1% | 17.9% | 2.9% | 6.2% | 52.1% | 6.5% |
Table 4.
Indels distribution in different genomic components.
| Insertion | Deletion | CDS | UTR | mRNA | |
|---|---|---|---|---|---|
| Number | 11,211 | 12,098 | 1051 | 796 | 11,949 |
| Percent | 48.1% | 51.9% | 4.5% | 3.4% | 51.3% |
Table 5.
Validations of SNPs and Indels by Sanger sequencing.
| Position | Mutation Type | Consistence with High-Throughput Sequencing |
|---|---|---|
| Chr16: 213,135 | C/G | Yes |
| Chr16: 213,142 | A/G | Yes |
| Chr16: 213,221 | T/G | Yes |
| Chr16: 213,160 | T/G | No |
| Chr16: 61,196 | C/G | Yes |
| Chr16: 61,211 | A/C | Yes |
| Chr11: 4,464,202 | G/A | Yes |
| Chr11: 4,478,491 | C/A | Yes |
| Chr11: 4,478,592 | T/C | Yes |
| Chr11: 4,478,634 | T/C | Yes |
| Chr11: 4,480,688 | G/T | Yes |
| Chr11: 4,480,721 | C/A | Yes |
| Chr11: 4,479,104 | C/T | Yes |
| Chr11: 4,479,176 | G/A | Yes |
| Chr11: 4,479,218 | A/G | Yes |
| Chr11: 4,479,254 | C/T | Yes |
| Chr11: 4,480,840 | C/T | Yes |
| Chr11: 4,480,934 | T/A | Yes |
| Chr11: 4,480,961 | G/A | Yes |
| Chr11: 4,480,971 | G/A | Yes |
| Chr11: 4,481,057 | G/A | Yes |
| Chr11: 4,481,115 | A/G | Yes |
| Chr11: 4,478,592 | T/C | No |
| Chr11: 4,478,634 | T/C | No |
| Chr16:74,016–74,024 | CCACTGCCA, deletion | Yes |
Table 6.
Frequencies of 9 bp deletions in BF1 gene in lines of chickens selected for resistance to Marek’s disease.
Table 6.
Frequencies of 9 bp deletions in BF1 gene in lines of chickens selected for resistance to Marek’s disease.
| Chicken Line | CCACTGCCA | CTACAGCCC |
|---|---|---|
| The susceptible lines | 100% | 0 |
| The resistant lines | 0 | 100% |
Table 7.
Number of non-synonymous SNPs in the coding DNA sequences and proximal promoter regions.
| Position | Coding DNA Sequence | Proximal Promoter |
|---|---|---|
| White Leghorn high IgYgroup | 20 | 11 |
| Beijing-You high IgY line | 19 | 10 |
| Common SNPs in high IgY White Leghorn and Beijing-You chickens | 18 | 8 |
| White Leghorn low IgYgroup | 21 | 9 |
| Beijing-You low IgY line | 15 | 11 |
| Common SNPs in low IgY White Leghorn and Beijing-You chickens | 14 | 11 |
Table 8.
Genes with common SNPs to the high IgY groups or low IgY groups in proximal promoter or CDS.
Table 8.
Genes with common SNPs to the high IgY groups or low IgY groups in proximal promoter or CDS.
| Genes with Common SNPs of High IgY Groups | Genes with Common SNPs of Low IgY Groups | ||
|---|---|---|---|
| Proximal Promoter | CDS | Proximal Promoter | CDS |
| TAP2 | TAP2 | TAP1 | TAP1 |
| AKTIP | BLEC2 | BF2 | BF2 |
| TAPBP | BF1 | TNFAIP1 | BF1 |
| BF2 | DMB2 | TRIM7 | |
| TAP1 | AKTIP | ||
| TRIM41 | |||
Table 9.
Indel common to the high IgY groups or low IgY groups.
| Indel Type | Sequence | Gene | Position |
|---|---|---|---|
| Deletion | CCACTGCCA | BF1 | Intron |
| TAP1 | 3′UTR |
© 2019 by the authors. Licensee MDPI, Basel, Switzerland. This article is an open access article distributed under the terms and conditions of the Creative Commons Attribution (CC BY) license (http://creativecommons.org/licenses/by/4.0/).
Share and Cite
MDPI and ACS Style
Wang, Q.; Wang, F.; Liu, L.; Li, Q.; Liu, R.; Zheng, M.; Cui, H.; Wen, J.; Zhao, G. Genetic Mutation Analysis of High and Low IgY Chickens by Capture Sequencing. Animals 2019, 9, 272. https://doi.org/10.3390/ani9050272
AMA Style
Wang Q, Wang F, Liu L, Li Q, Liu R, Zheng M, Cui H, Wen J, Zhao G. Genetic Mutation Analysis of High and Low IgY Chickens by Capture Sequencing. Animals. 2019; 9(5):272. https://doi.org/10.3390/ani9050272
Chicago/Turabian StyleWang, Qiao, Fei Wang, Lu Liu, Qinghe Li, Ranran Liu, Maiqing Zheng, Huanxian Cui, Jie Wen, and Guiping Zhao. 2019. "Genetic Mutation Analysis of High and Low IgY Chickens by Capture Sequencing" Animals 9, no. 5: 272. https://doi.org/10.3390/ani9050272
Note that from the first issue of 2016, this journal uses article numbers instead of page numbers. See further details here.