Article

Paleostress Analysis from Calcite Twins at the Longshan Dome (Central Hunan, South China): Mesozoic Mega-Fold Superimposition in the Reworked Continent

1
State Key Laboratory of Isotope Geochemistry, Guangzhou Institute of Geochemistry, Chinese Academy of Sciences, Guangzhou 510640, China
2
CAS Center for Excellence in Deep Earth Science, Guangzhou 510640, China
3
University of Chinese Academy of Sciences, Beijing 100049, China
4
Southern Marine Science and Engineering Guangdong Laboratory, Guangzhou 510301, China
*
Author to whom correspondence should be addressed.
Geosciences 2021, 11(11), 456; https://doi.org/10.3390/geosciences11110456
Submission received: 25 August 2021 / Revised: 19 October 2021 / Accepted: 20 October 2021 / Published: 5 November 2021

Abstract

:
It is generally accepted that during the Mesozoic NE−NNE-trending folds overprinted E−W-trending folds to form the Longshan dome in the central South China continent, although the interference map does not tell the relative ages of the fold sets. In an effort to deepen our understanding of the process of reworking the continent, paleostress analysis using calcite twins was carried out in this study to verify or falsify this model. Ten limestone samples were collected from Upper-Paleozoic limestones on the flanks of the dome and were measured using the universal stage for calcite e-twins. E-twins in the samples are divisible into two kinds, thick (≥1 μm) and thin (<1 μm), indicative of relatively higher and lower deformation temperatures, respectively. Stress estimates obtained using the improved version of Shan et al.’s (2019) method were grouped into two layer-parallel shortening (LPS) subsets and three non-LPS subsets. These subsets comprise four tectonic regimes: NWW−SEE compression (LPS1 and non-LPS1), NNE−SSW compression (LPS2 and non-LPS2), NW−SE extension (non-LPS3a) and NNE−SSW extension (non-LPS3b). They were further arranged in a temperature-decreasing order to establish a complex deformation sequence of the study area. In the sequence NE−NNE-trending folds have an older age than E−W-trending folds, something different from the model. The approximately N−S regional compression responsible for the former folds should have a profound effect on the intensely deformed continent, something ignored in earlier work.

1. Introduction

Kilometer-scale superimposed folds are common in ancient accretionary [1,2,3,4] and collisional [5,6] orogens. They are generally diagnostic of a complex plate convergence and, hence, of practical significance in understanding the deformation history of the orogens. They are however not peculiar to the orogens, for example, the classic dome-basin structure or Ramsay’s [7] type 1 cross fold formed in the central portion of the South China continent (Figure 1a), when the continent had undergone intense deformation and intense magmatism during the Mesozoic [8,9,10,11,12,13]. This interference was caused by two fold sets: NE−NNE-trending tight folds and nearly E−W-trending open folds (Figure 1b).
Within the dome-basin structure the oval-shaped Longshan tectonic dome (Figure 2a) has received the attention of many Chinese geologists ever since [14,15,16,17,18,19,20]. Although the map of fold interference does not tell the relative age of two fold sets, previous workers [14,15,16,17,18,19,20] have tried to correlate the two fold sets with the parallel fold sets on the continental margin. They reached a unanimous agreement that the NE−NNE fold set should have a younger age than the E fold set. What they argued about is when and how the fold sets formed. The mainstream viewpoint relates the E and NE−NNE fold sets to the collision between the North China and South China continents in the Middle−Late Triassic and the westward subduction of the Izanagi oceanic plate in the time of Middle−Late Jurassic to Early Cretaceous [15,18,19], respectively. However, in the belief that this collision-related deformation is confined to the northern continental margin [21], Li et al. [17] ascribed the fold sets to the northeastward subduction of the Paleo-Tethys oceanic plate and subsequently the collision of the Indosinian block to the clockwise rotating South China continent, respectively, during the Late Permian to Triassic. The principal reason for this inconsistency is, as described below, the inhomogeneous, polyphase and even repetitious nature of regional deformation in the South China during the Mesozoic.
Figure 1. (a) Tectonic setting of the South China Platform and (b) the geological map of the central Hunan Province Modified from [22]). TP, Tarim platform; NCC, North China Continent; SCC, South China Continent. Numbers 1 to 5 in figure (a) represent Central–Asia (Paleozoic−Mesozoic), Qinling (Late Paleozoic−Early Mesozoic), Songpan–Ganzi (Mesozoic), Three–River (Late Paleozoic−Mesozoic) and Himalayan (Cenozoic) orogenic belts, respectively.
Geosciences 11 00456 g001
In South China, severe vegetation coverage makes it difficult to use secondary deformation structures to determine the relative ages of the fold sets that made the Longshan dome. In these circumstances, it is necessary to look for an appropriate kind of secondary deformation structure that we can correlate from site to site within the cross fold. Calcite e-twinning is perhaps the best kind of deformation mechanism, as it is sensitive to stress [23,24], and because limestone is abundant in the platformal cover that was involved in the cross fold. Paleostress analysis using calcite e-twin data has been widely used to reveal the structural evolution of the fold belts [25,26,27,28,29].
This communication applied paleostress analysis to the Longshan tectonic dome to better understand the mega-fold superimposition in the interior of the South China continent during the Mesozoic. For this purpose we conducted field observations of secondary deformation structures on the flanks of the dome, collected oriented samples of sparitic limestone of the platformal cover, and measured calcite e-twins under the universal stage. Meanwhile, Shan et al.’s [30] inversion method for polyphase twin data was improved and applied to the measured datasets.

2. Regional Geology

2.1. History

In the Late Neoproterozoic the primary South China continent disintegrated into two principal portions: the Yangtze platform in the west and the less stable Cathaysian block in the east (Figure 1a). These portions merged as a result of something like intra-continental orogeny [31,32,33]. This orogeny affected the Yangtze platform by means of uplift and erosion but produced intense deformation, low-grade regional metamorphism and the emplacement of post-orogenic granites in the Cathaysian block [33,34]. A ca. 8 km thick succession of Late Neoproterozoic–Silurian sedimentary rocks deposited on the continental shelf and slope was thrusted and folded throughout the block. Regional folds have a generally E−W trend in the central Hunan [35]. Consequently the platform regime prevailed in the remerged continent and did not terminate until the Early Triassic [31].
The early Mesozoic marks the onset of regional shortening in a far- or near-field response to the multiple plate convergence around the South China continent. In the Triassic the continent collided with the Indosinian block to the southwest [28,31,36] and with the North China continent to the north [37,38] and had been subducted by the Izanagi or older oceanic plate to the east [10]. This caused the contraction of the continent, as a whole, which differed in pattern between the portions. The fault-and-thrust belts formed as narrow forelands on the platform margin and were hardly associated with magmatism [37,38]. In contrast, one or more phases of deformation happened in most, if not all, of the Cathaysian block, in a close relation with the emplacement of numerous granites or granodiorites [10] and hydrothermal mineralization, for example, many Au or Au-Sb deposits in the Hunan province [39].
A more intense and more extensive contraction occurred in the Middle or Late Jurassic−Early Cretaceous. The pre-existing foreland fold-and-thrust belts on the margins were reactivated to propagate towards the inland. This resulted from a combination of the continuous westward subduction of the Izanagi plate to the east [40,41], the southward collision of the Siberian plate with the Sino-Korea plate far to the north [11,42], and the collision between the Lhasa and the Qiangtang blocks to the west [43,44]. The first tectonic process played the most important role in reworking the South China continent by producing a 1300 km wide tectono-magmatic belt in the central and eastern portions. Apart from the intact Shichuan basin in the west, all the portions of the South China continent were involved in structural deformation to varying degrees.
In the Cretaceous, margin-perpendicular regional extension took place throughout the South China continent, due to possible tectonic processes such as the collapse of the Early-Mesozoic orogen [45], the high-angle subduction of the Pacific oceanic plate [9,40] and the roll-back of the subduction zone [46,47]. Numerous NE− or NNE−trending extensional basins were produced and infilled with a several-kilometers thick sequence of fluvial and lacustrine sediments and, to variable degrees, volcanic rocks in the central and eastern portions.

2.2. Macroscopic Deformation Structures

Two sets of regional folds are present in the central Hunan province: longitudinal and transverse with respect to the fold belt (Figure 1b). The longitudinal folds trend toward the northeast or north-northeast and are upright, inclined or locally overturned. They have a straight or curved fold axial trace, with a wavelength of ca. 20−30 km. The anticlines are closer than the synclines at most places. They become more open at a few places, for example, where the basement-involved tectonic domes formed. These cases seem to represent thin-skinned and thick-skinned tectonics, respectively. In contrast, the transverse folds are less developed. They trend toward the east-southeast, and occasionally the northeast. They are gentle and nearly upright and have a wavelength of ac. 90 km, about three times larger than the longitudinal folds. There are two kinds of fold interference pattern in the region: dome-and-basin structure or Ramsay’s [7] type 1 and bending of longitudinal folds as a transverse fold or Ramsay’s [7] type 2. Theoretically speaking, in the case of such fold sets, the pattern kind is controlled by the pitch of the transverse fold axis [48,49]. The former pattern is gradually replaced by the latter pattern when the transverse fold has an increasing pitch from 0°–90°.
1.
Dome-and-basin structure. Tectonic domes occur in an E–W or NE–SW-trending chain. They are in a circular or elliptical shape, with a size of 20–30 km. They involve both the Devonian–Lower Triassic platformal cover and the Upper Proterozoic–Silurian folded basement. Between the neighboring domes is a NNE- or NE-trending syncline, close and long-axis. Tectonic basins are much less developed and are characterized by NNE- or NE-trending short-axis synclines, 7–15 km in width and 20–60 km in length.
The oval-shaped Longshan dome to the southeast of Lianyuan County is the most typical tectonic dome. It is represented by a gentle anticline with a half wavelength of 35 km in the NE–SW direction (Figure 2b) and a box anticline with a half wavelength of 20 km in the NW–SE direction (Figure 2c). It is generally accepted that the dome is a good example of Ramsay’s [7] type 1 cross folds and formed during the Mesozoic [15,17,18,19,20]. Theoretically speaking, the map of such a cross fold does not tell the relative chronology of the aforementioned fold sets. Even now this issue is not well resolved because, as described below, there is a lack of reliable field observations about the relationship between the sets.
2.
Bending of longitudinal folds as a transverse fold. In plan–view the longitudinal fold set is bent into a few open arcuate folds with a roughly E−W axial trace (Figure 1b). Such an interference map is representative of Ramsay’s [7] type 2 cross fold and, hence, indicative of a younger age of the transverse folds than the longitudinal folds. This is however ignored by existing models that tentatively ascribe in various ways the transverse folds to WNW−ESE or NW−SE regional compression responsible for the longitudinal folds. They include the local disturbance around some pre-existing granite intrusive bodies of the regional deformation field [50,51], the propagation of arcuate thrust faults [16] and the fault-bend folds of NE-striking sinistral strike-slip faults [52]. The fact that all of the intrusive bodies, thrusts or strike-slip faults have a much smaller size than the longitudinal folds (Figure 1b) is strongly suggestive of no genetic relationship between them. These models have not been verified ever since, and they will not be discussed below to save the room in this paper.
In addition, NE−NNE-trending regional faults have a complex history of formation and reactivation [22]. They may be reverse, strike-slip, normal or in combination. The reverse faults are generally parallel to the longitudinal fold set (Figure 1b). Some of them had been subsequently reactivated as normal faults controlling Cretaceous half grabens. At places the mylonitization of felsic rocks was induced on the contacts of the footwalls of the boundary faults. 40Ar/39Ar dating of newly-formed muscovite, sericite, and biotite in these ductile shear zones yields a deformation age of 195−217 Ma for reverse faults [53] and 211.7 ± 1.5 Ma [18] for a dextrally strike-slip fault in the Xuefengshan structural belt in the west, and 120−140 Ma and 85−100 Ma for normal faults in the southeast of Xinning town [54].

3. Mesoscopic Deformation Structures

Present on the flank of the Longshan dome are a variety of secondary deformation structures including slaty cleavages (Figure 3a–b), interlayer folds (Figure 3c), faults (Figure 3d), calcite veins (Figure 3d–g) and stylolites (Figure 3g). A practical but hard issue thus arises about how to identify syn-folding structures from them and, if possible, to use them to establish the relative chronology of the fold sets. For this purpose a special attention was paid to cleavages and slickenlines on bedding-parallel faults. The dome flank is divisible into four parts: western, northern, eastern and southern (Figure 2).

3.1. Western Flank

Secondary folds, centimeters (Figure 3c) to meters or a little more in wavelength, are common in Carboniferous and Permian mudstones or shales on this flank. They possess a horizontal NNE-trending fold axis, as is defined on the stereonet by bedding measurements (Figure 2d), in accordance with a close regional syncline on the west. Associated with the syncline is a major set of NNE-striking vertical or sub-vertical slaty cleavages in mudstones (Figure 2e). Pre-existing bedding-parallel or -oblique calcite veins were strongly folded to accommodate the amount of shortening absorbed by slaty cleavages (Figure 3c).
However, a few slaty cleavages gently dipping towards the northeast (Figure 2e) are present at the place where the syncline axis was bent. They are probably attributed to the transverse folding. Unfortunately no superposition of cleavages is found in the field.
As a flexural slip, slickenlines on bedding-parallel faults are reliable recorders of multiple folding. They have two major sets, NWW−SEE and NNE−SSW (Figure 2f), which seem to correspond to the longitudinal and transverse folds, respectively. It is therefore crucial but difficult to determine the relative ages of two or more sets of slickenlines on a certain bedding-parallel fault at outcrops. Only at the location of sample H34 is there an evident relationship between the sets of slickenlines, dip-parallel and strike-parallel, on a certain bedding-parallel fault. The former set turns gradually into the latter set (Figure 3d). Given the close relationship between the former set and the longitudinal folds, this strongly suggests that the longitudinal folds have an earlier age than the transverse folds.

3.2. Northern Flank

This flank was involved in complex deformation that accommodated the deformation incompatibility between the tectonic domes and basins. For this reason, two vertical great circles, north-northeast-striking and northwest-striking, are poorly defined by bedding measurements (Figure 2g). They represent west-northwest- and northeast-trending folds, respectively. Considering a vertical, northwest-striking great circle of slaty cleavages (Figure 2h), the absence of cleavages of west-northwest-trending folds implies that the folds have a younger age.
Locally exposed near Baima village are spaced cleavages, a set of nearly bedding-perpendicular, relatively densely-spaced stylolites, in a gently dipping thick bed of Upper Devonian limestone (Figure 3e). They are associated with and perpendicular or sub-perpendicular to lenticular, V-shaped or tabular calcite veins or veinlets. All of them reflect a local ESE−WNW shortening, generally in correspondence with the longitudinally folding. These structures are offset by a nearly bedding-parallel fault bearing a set of east-pitching slickenlines. Calcite fibers and steps on the fault indicate an oblique reverse slip sense. As such the fault is most likely to form in a different stress state from the spaced cleavages. It is however unknown whether the fault is related to the longitudinally folding as a result of progressive deformation, the transversely folding or other possible tectonic processes.

3.3. Eastern Flank

On this flank there is a north-northeast-striking vertical great circle of bedding measurements (Figure 2j), as similar to that on the western flank. Slaty cleavages, although in a small number, do not cluster around a certain great circle (Figure 2k). Half of them strike towards the east or southeast and are probably associated with the transverse folds.

3.4. Southern Flank

There is a southwest-dipping great circle of bedding measurements (Figure 2m). Slaty cleavages have high dips and strikes generally toward the northeast, as similar to the ones on the northern flank (Figure 2n).
On the ridge near Hetianpu village there are two principal sets of calcite veins in a subhorizontal thick bed of Lower Carboniferous limestone (Figure 3f). A north-striking set comprises tabular or, in an en echelon pattern, lenticular veins. Short stylolites are present in the overlaps between the veins and are generally perpendicular to the veins. This set is cut through by an east-striking set of tabular calcite veins. Veins of each set have a serrated contact in some portions, owing to pressure dissolution under the subsequent perpendicular or subperpendicular shortening. Both sets are cut through or abut by two minor sets of tabular veins or veinlets, northeast- and northwest-striking, respectively. These scenarios give a variation in direction of local compression from S−N to E−W to SE−NW and SW−NE with time.
However, at another location on the flank (Figure 3g) a different deformation history is established: the local compression direction varies from E−W to SE−NW to N−S with the time. The difference in deformation history between the neighboring sites means that the occurrence of parallel veining makes it difficult to unravel the complexity in time and space of deformation. The east- and north-trending sets involve two low-temperature deformation mechanisms: tensile fracturing and, insignificantly, dissolution (stylolites) − precipitation (veins). Considering that this combination works at a relatively high temperature [55], some if not all of the veins of each set formed at a relatively deep depth and therefore must have the oldest age.

4. Methodology

In a certain calcite crystal e-twining or mechanical twinning occurs by gliding along a certain e-plane toward the C-axis when the resolved shear stress (RSS) on the crystallographic plane equals or exceeds a certain critical value of about 10 MPa [56,57,58,59]. This inequality is the basis of inversion of calcite monophase e-twins for stress [60,61,62,63,64,65,66]. According to the inequality, a relative or absolute deviatoric stress tensor can be defined by a population of monophase twin data, if they have a relatively large number and are widespread in orientation space. The relative deviatoric stress tensor is also called the reduced stress, from which one knows only the principal stress axes and the stress ratio.
Polyphase e-twins are more common in nature due to the variation in time of the tectonic stress field during the geological history. How to invert them for polyphase stresses has received rigorous research during the decades. There are two categories of existing inversion methods that are strictly based on the inequality. The first category includes Etchecopar’s [64] method and its modifications [67,68]. Etchecopar’s [64] method sequentially applies his proposed method for monophase twin data to a certain population of polyphase twin data until the remaining twinned e-planes are insufficient to define a new stress. As such the driving stresses responsible for the data are required to have as much large differences as possible, which limits the wide application of the method. This inherent drawback has been tried to be overcome in several ways, for example, the re-separation of twinned e-planes with respect to the previously obtained stresses for a newly obtained stress [67], and the separation of all twinned e-planes before inversion [68].
The second category is the solution of an optimization problem that depends on the compatibility or incompatibility of twinned or untwinned e-planes and the shear stresses along the gliding directions on compatible twinned e-planes under the unknown stresses [30]. For example, Shan et al. [30] take into account two criteria: minimizing the number of incompatible e-planes (twinned and untwinned) shared by the unknown stresses, NSI, and maximizing the sum of shear stresses of compatible twinned e-planes. Their minimization problem has the following object function:
  F = ( 1 + N S I ) N T i = 1 K j = 1 M i t ¯ I ( j ) σ ¯ ( i )
where N T is the number of twinned e-planes, K is the number of tectonic phases, M i is the number of twinned e-planes for the i-th stress, σ ¯ ( i ) is the i-th modified reduced stress vector, t ¯ I ( j ) is the I ( j ) -th modified datum vector, and I ( j ) is the position in the e-plane sequence of the j-th compatible twinned e-plane for the i-th stress. In order to facilitate the search of a reduced stress tensor in five-dimensional stress space, a constant critical resolved shear stress value, 10 MPa, is used to rescale the tensor. The real deviatoric stress tensor can be restored with the knowledge of the real critical value. The evolutionary algorithm was adopted to solve the above optimization problem. Application of this method to a series of two-phase artificial twin datasets indicates the relatively high accuracy of the stress estimate, even in the case of datasets generated under the reasonably similar imposed stresses, but the relatively low accuracy for stress difference [30].
In this study, maximizing the number of compatible untwinned e-planes shared by the unknown stresses, NSC, is chosen as a third criterion about the unknown stresses. The above object function is improved in the following way:
F = ( 1 + N S I ) N T ( 1 + N S C ) i = 1 K j = 1 M i t ¯ I ( j ) σ ¯ ( i )
Some of the artificial two-phase e-twin datasets made by Shan et al. [30] were used to check the validity of this object function. The first-phase subsets, each comprising 20, 40 or 60 twinned calcite crystals, are generated under the Andersonian stress that has a stress ratio of 0.5 and a maximum differential stress of 60 MPa. They are rotated around the maximum, intermediate and minimum principal stress axes, respectively, with an increment of 5° to have the second-phase subsets. Before combining two of the subsets into a two-phase equally-sized dataset we need to calculate whether each untwinned e-plane of one subset is activated or not under the imposed stress with respect to another subset (see [30] for more information). For each dataset, the estimated stresses obtained using this improved method are correlated with the imposed stresses. Two parameters are adopted here to characterize the difference between the estimated stresses and their corresponding imposed stresses [30]:
1.
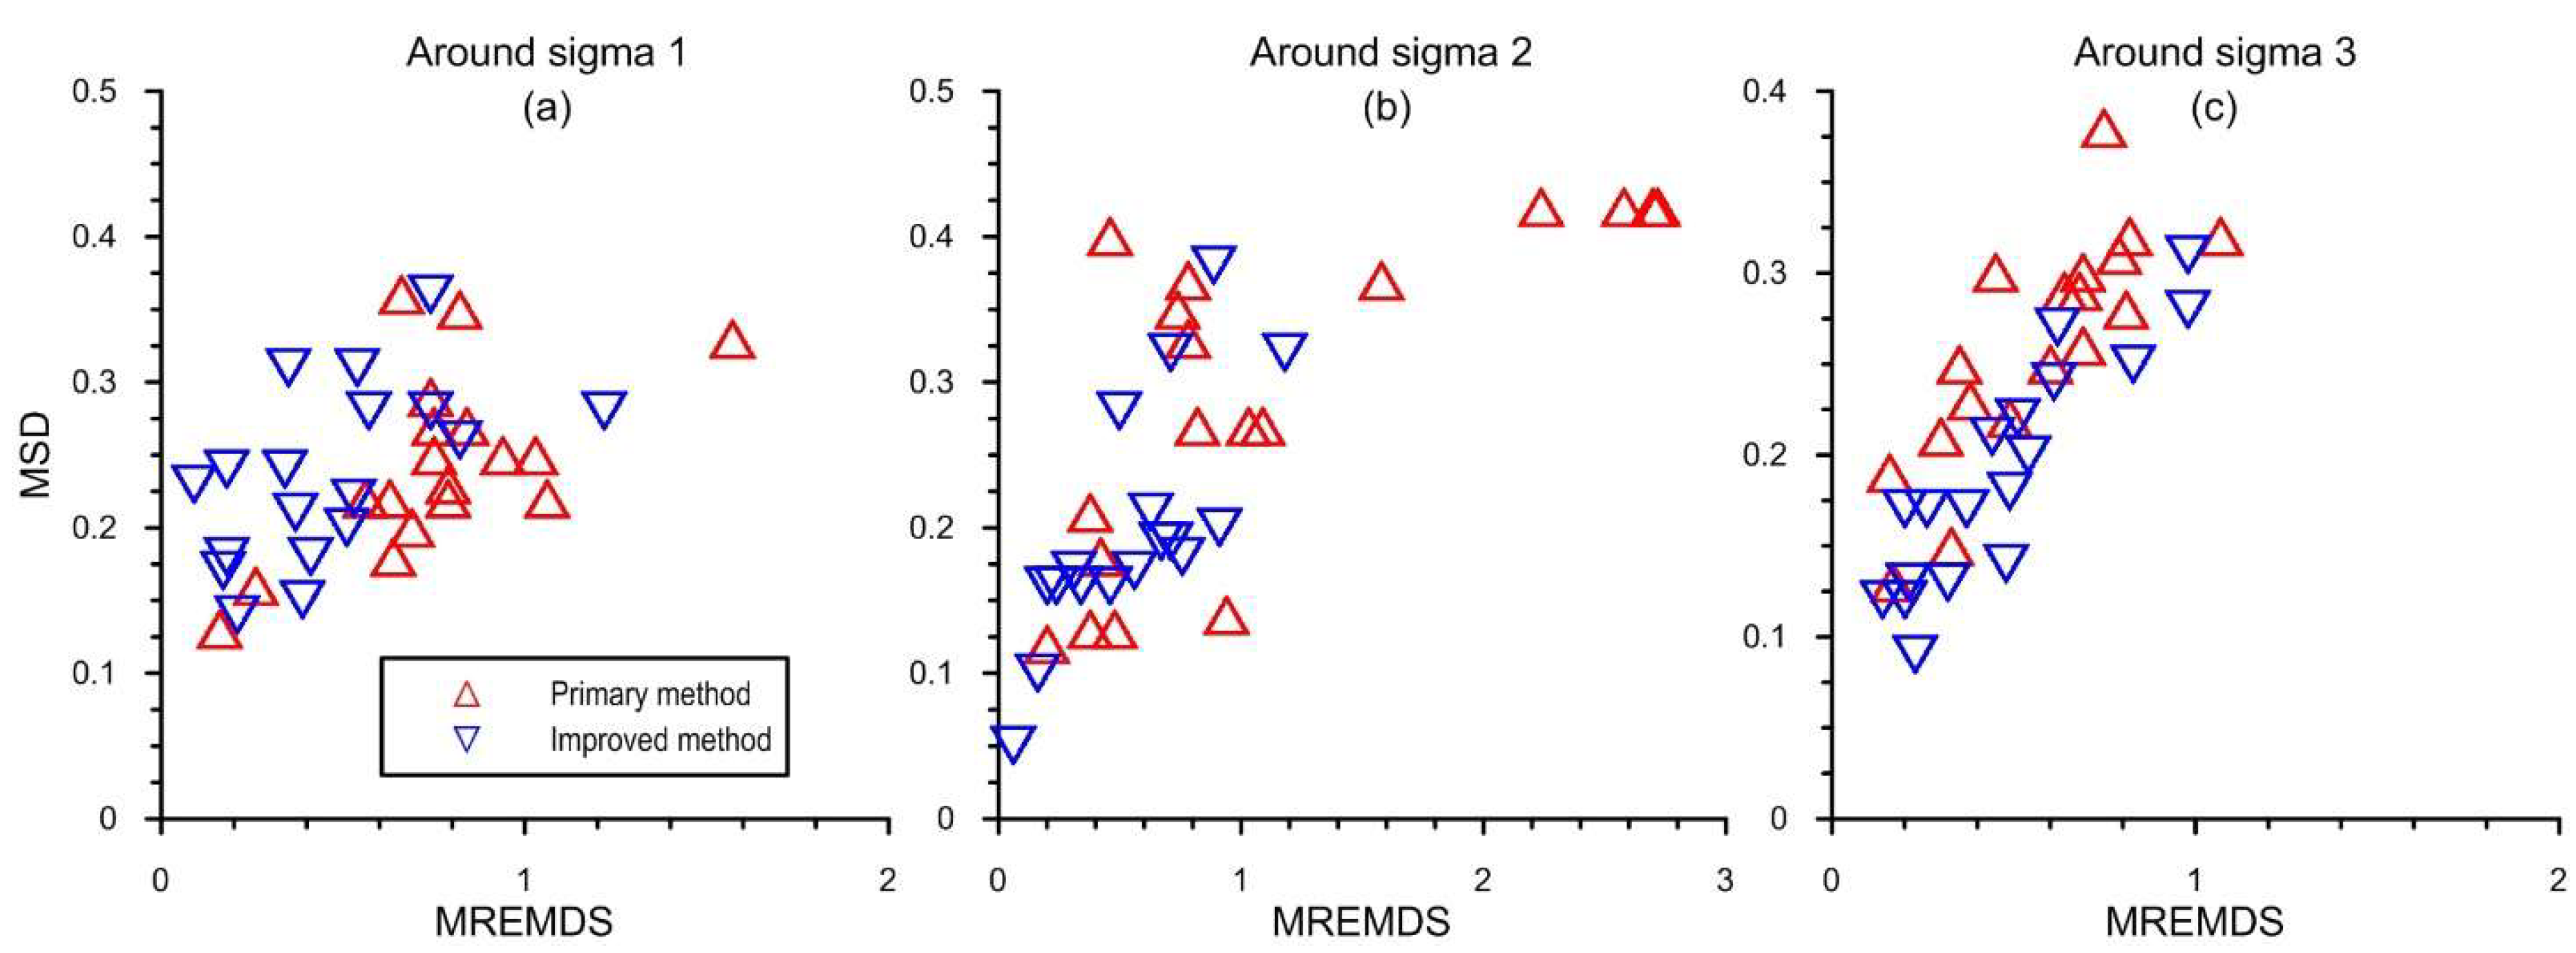
The maximum stress difference (MSD). This is the maximum of differences between the estimated stresses and their corresponding imposed stresses. The stress difference (SD; [69]) describes the difference between the reduced stresses. It is equal to the Euclidean distance between the stress vectors in reduced and partially distorted stress space [70]. It ranges from 0–2, for the strictly similar to strictly different reduced stresses.
2.
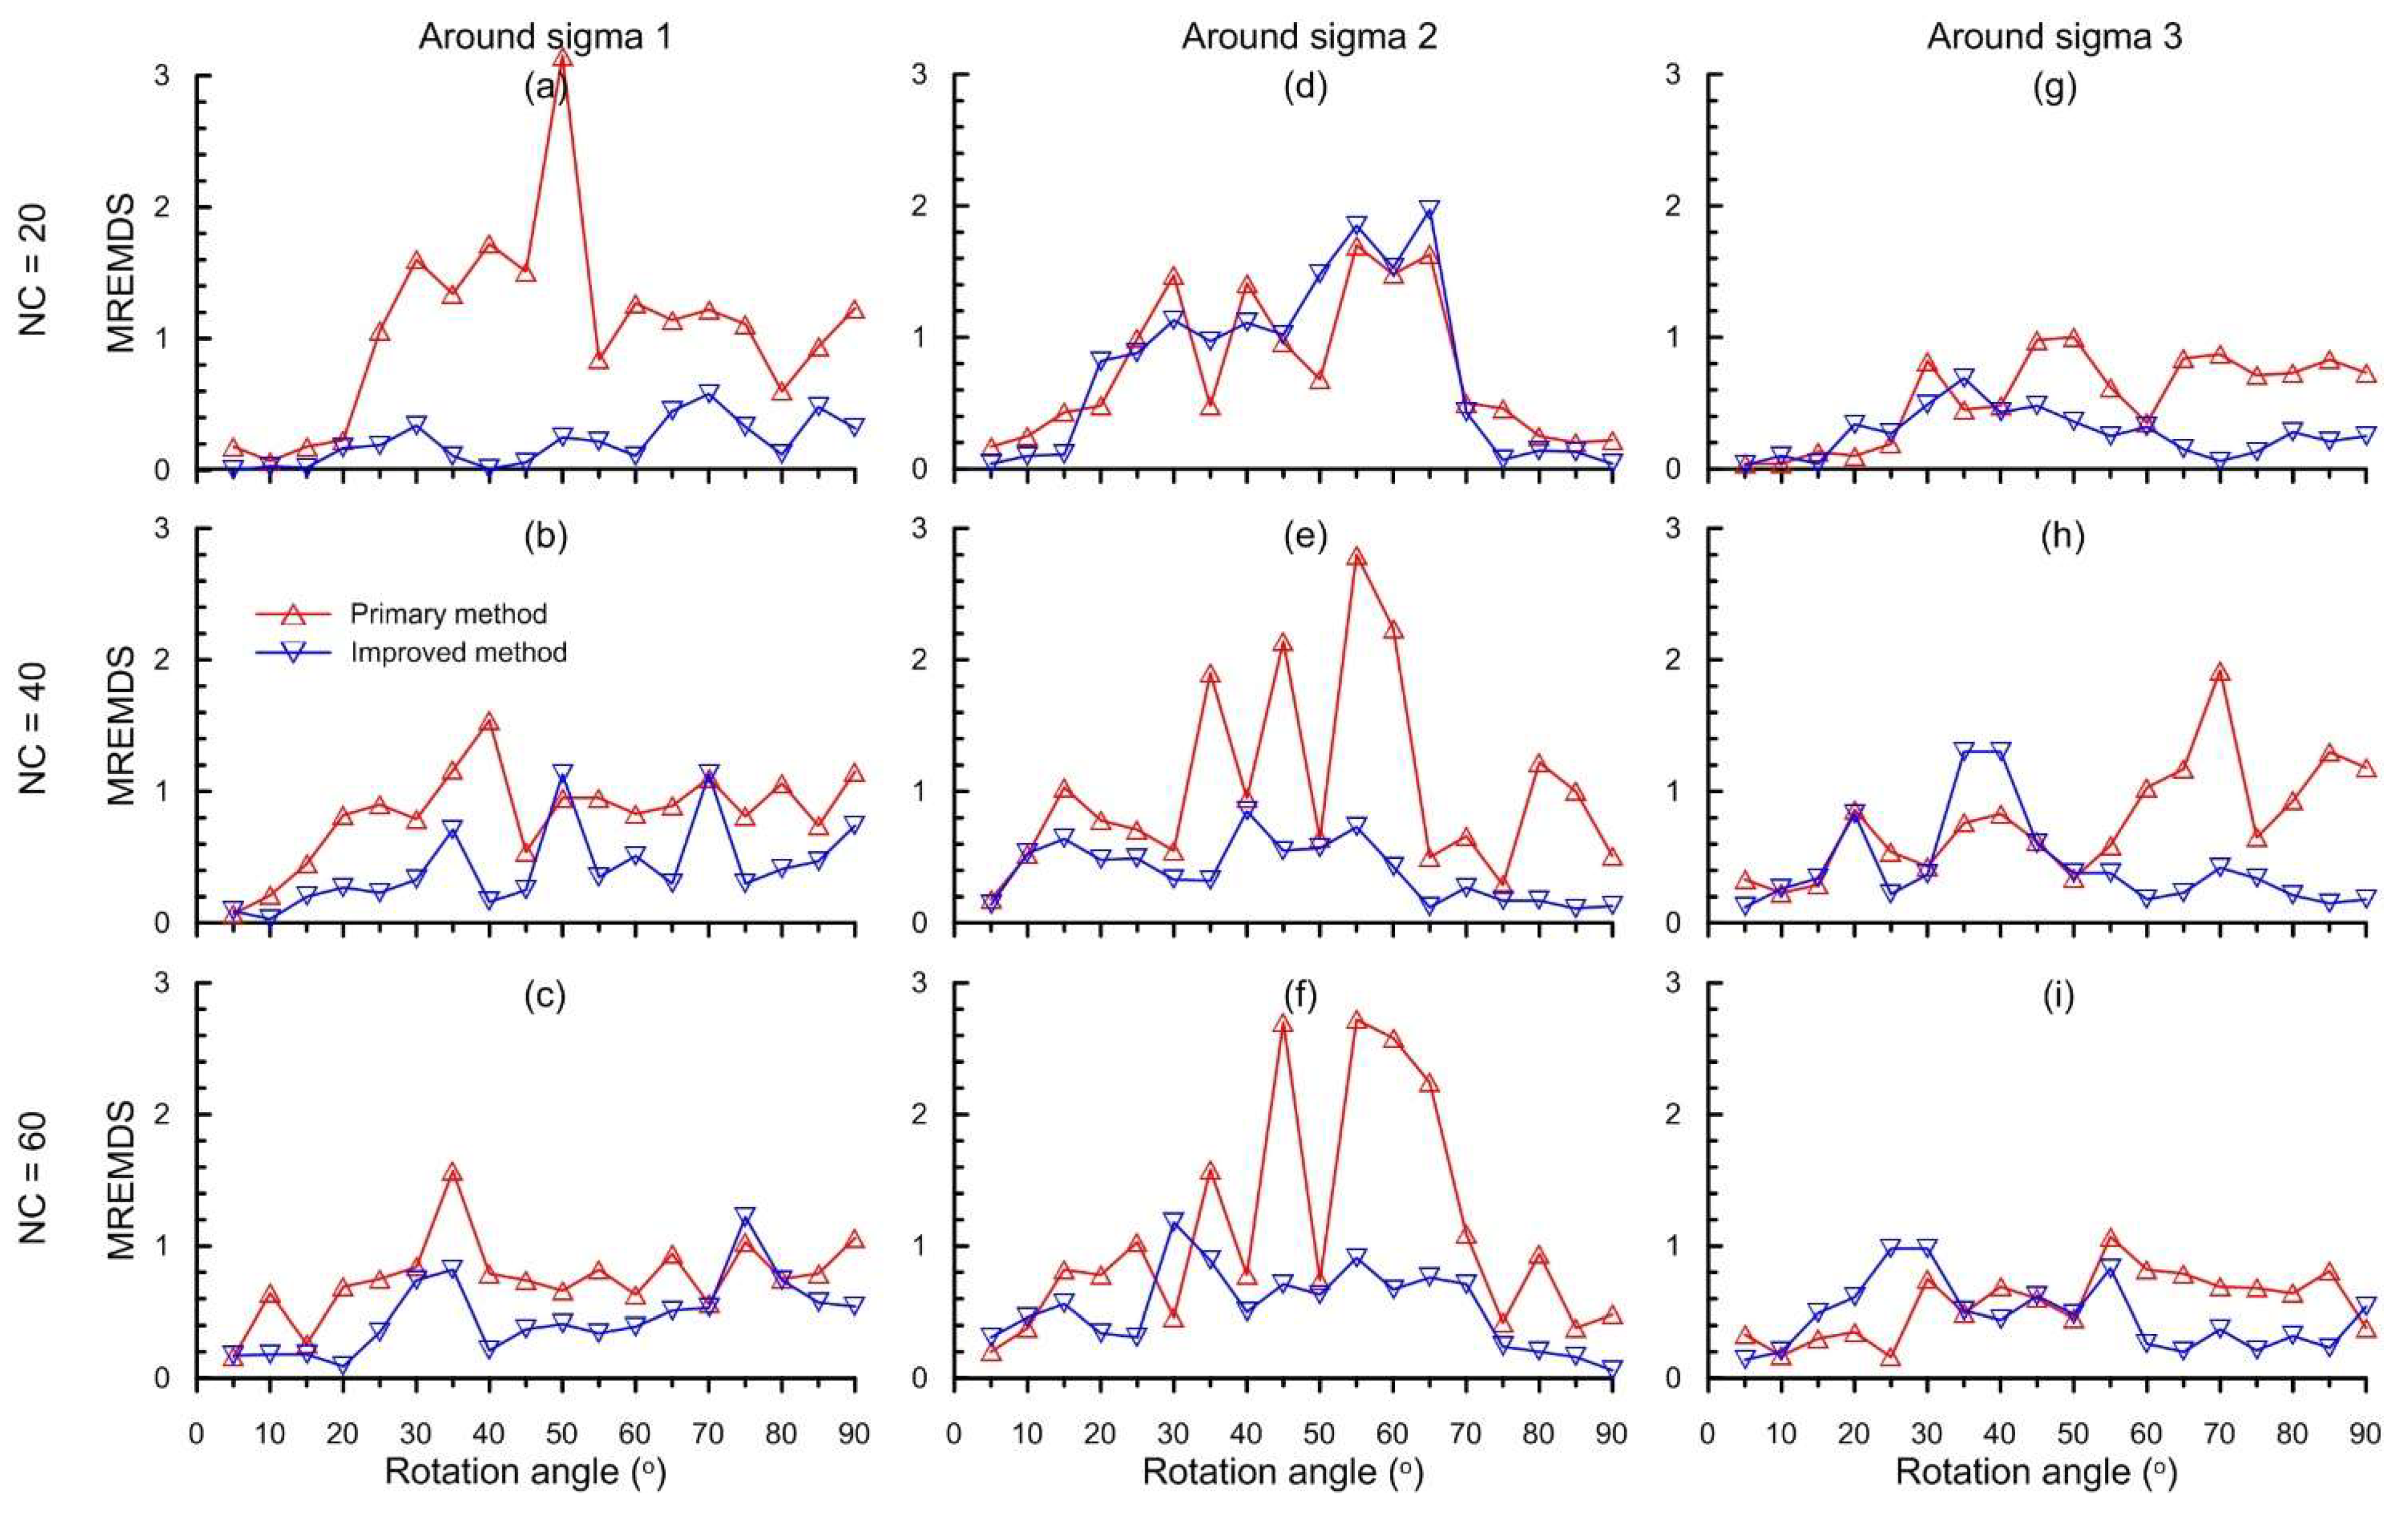
The maximum relative error of the maximum differential stress (MREMDS). This is the maximum relative error of the maximum differential stresses of the estimated stress tensors to the imposed stress tensors. As previously described, the imposed stress tensors are initiated with a maximum differential stress of 60 MPa.
Shown in Figure 4 and Figure 5 are results of applying the improved method and, for comparison, the primary method to the datasets. Both methods have a strong tendency to give an increasing accuracy of reduced stress with the ascent of rotation angle and crystal number (Figure 4). As a whole, the improved method has a smaller MSD value and hence a higher accuracy than the primary method, particularly in the case of rotation around the intermediate and minimum principal stress axes, respectively. The MREMDS is generally smaller in value for the improved method than for the primary method in all cases (Figure 5). These illustrate the feasibility of the improved method.
In addition, the improved method yields a MREMDS range of 0–1 for a MSD value of <0.3 and a crystal number of 60 (Figure 6). That is to say, when the estimates of reduced stress are acceptable, there is still a very large range or uncertainty of their maximum differential stresses.

5. Application

5.1. Samples and Measurements

In this study ten oriented samples (Table 1) were collected from the Middle Devonian and Carboniferous sparitic limestones on the flanks of the Longshan dome and, for comparison, on the eastern and southern limbs of the triangular tectonic basin abutting the northern flank (Figure 2a). All sampling locations are away from outcrop-scale interlayer fold(s) and fault(s). Each sample was cut into three mutually perpendicular thin sections, perpendicular to the reference plane along the dip and strike, respectively, and parallel to the reference plane.
Under the microscope, nearly all calcite grains are intensely involved in twinning, with an average density of ca. 50 twins per mm. They host one or, more significantly, two sets of twins. Twins in each set are thin, thick or hybrid (Figure 7a–b). Thin twins are < 1 μm thick and usually straight. Thick twins are generally 1−5 μm thick and rarely 10 μm or more. They have straight (Figure 7b), lenticular and curved (Figure 7c–d) shapes. Thin twins are parallel to thick twins (Figure 7b), crosscut them (Figure 7a–b) or stop at them (Figure 7b–c). These relationships indicate that thin twins have a similar age to thick twins, as a whole. Nowadays there are two different mechanisms about the formation of thick twins: the increase in strain [71] and the relatively high temperature [72,73]. Considering that the curved shape of some thick twins (Figure 7b–c) is diagnostic of the relatively high temperature [72], the measured twins in each sample are separated into two groups, thin-twin and thick-twin, for estimation of stress.
In each thin section, the crystal C-axes (Figure 8a,d) and twinned e-planes (Figure 8b,e) of more than 30 twinned calcite grains were measured under the universal stage. Each measurement was calibrated according to the crystallographic relationship and then used to calculate the untwinned e-plane(s). The calculated untwinned e-planes (Figure 8c,f) at an angle of <30° with the thin section are in fact uncertain under the universal stage and are, for safety, discarded. The measured C-axes for each sample tend to have an even distribution (Figure 8a,d), as required in stress inversion.

5.2. Results

Table 2 and Table 3 list the results obtained by applying the improved version of Shan et al.’s [30] inversion method to the measured datasets. The optimal phase number of each dataset is determined under the following restraints: a relatively small value of the minimized object function, a very small number of the common incompatible twinned e-planes, and the absence of a new different stress for the next phase number. As such thin-twin and thick-twin datasets are separated into two or three subsets. An exception is the thick-twin dataset of sample H27 that has an optimal number of 4. By comparing the best estimates in the current and untilted states we classified them into two types: layer-parallel shortening (LPS) and non-layer-parallel shortening (non-LPS). For LPS, the maximum principal stress axes (PSA) are more horizontal or less upright in the untilted state than in the current state. Afterwards, according to the similarity of the maximum PSAs, the stress estimates are further grouped into five subsets, two LPS and three non-LPS (Figure 9). There is no great difference in subsets between the thick-twin estimates (TKE) and the thin-twin estimates (TNE).
The first LPS subset (LPS1) represents a WNW–ESE compression and has an average maximum PSA of 101° (Figure 10a). Most of TKEs in the untilted state have a sub-vertical minimum PSA and a relatively wide range of the maximum PSA from NE to SE. The TNEs in this state have a high-angle intermediate PSA, and the maximum PSAs concentrate in the nearly east–west direction. A possible reason for this difference is the slight change of the tectonic stress field during the twinning.
The second LPS subset (LPS2) corresponds to a NNE–SSW compression with an average maximum PSA of 199° (Figure 10a). All TKEs and TNEs in the untilted state have a nearly horizontal maximum PSA and a high-angle or sub-vertical minimum PSA. This subset has a greater concentration of the maximum PSAs than the previous subset.
The first non-LPS subset (Non-LPS1) is characterized by a NW–SE compression, with an average maximum PSA of 120° (Figure 10b). An exception to this tectonic regime is the strike-slip regime of the TNE of sample H24. The presence of this subset in all samples suggests that the most intense deformation occurred in this region since the early Mesozoic. Besides, a few seemingly spurious estimates, such as TKEs for samples J90 and H30 and TNE for sample H27, have a medium-angle maximum PSA. It would be better to ascribe these to the syn-folding compression with respect to the non-LPS1. This was not endertaken for simplicity.
The second non-LPS subset (Non-LPS2) is dominated by a N–S or NE–SW compression that has an average maximum PSA of 194° (Figure 10b). Only the TNE of sample H30 has a strike-slip stress regime. There are however two clusters, NNW–SSE and NE–SW, of the maximum PSAs. This may be indicative of two tectonic phases, but we would like to relate it to the spatial variation of the tectonic stress field since this subset has a relatively small number of estimates, 7.
The third non-LPS subset reflects the extensional regime. It has two sub-subsets, NNE–SSW extension (non-LPS3a) and NW–SE extension (non-LPS3b), with an average minimum PSA of 20° and 116°, respectively (Figure 10c). Similar to the other subsets, this subset is present on the four flanks of the dome. This suggests a regional extent of the extension.
Interestingly, both the TKEs and the TNEs even belong to a similar subset for some samples, for example, the LPS subsets of sample H20 in the northern flank (Figure 9). This corresponds with the aforementioned observations about the similarity in age between thin twins and thick twins. In this manner thin and thick twins seem not diagnostic of relatively low and relatively high temperature, respectively, as found in the axial shortening experiment of single calcite crystal [58]. However, as previously described, slaty cleavages in the cover attests to the occurrence of low-grade regional metamorphism during the formation. Such a relatively high temperature is in accordance with the curved shape of some thick twins (Figure 7c–d; [72]). As a compromise, thin twins are considered to occur in a wider range of deformation temperature.
In addition, the maximum differential stresses (MDS) obtained from the samples were corrected (Figure 11), according to Rocher et al.’s [67] empirical correlation between the mean calcite size and the critical resolved shear stress. As this correlation is based on samples subjected to very small strain, ca. 1% [58,67], it may be inapplicable to many of our samples that had undergone relatively large strain in terms of densely-spaced twins. In light of an apparently smaller strain for thin twins than for thick twins, the corrected MDSs would be more accurate for thin twins. This is in agreement with the fact that the mean corrected MDSs have a narrower range for thin twins than for thick twins (Figure 11). There is a larger mean corrected MDS for thin twins than for thick twins in the LPS and Non-LPS1 subsets, and for thick twins in the Non-LPS2 and Non-LPS3 subsets. As a whole the former subsets, in particular the LPS subsets, have a narrower corrected-MDS range than the latter subsets. For thin twins in the LPS1 subset (Figure 12a) and for both thin twins and thick twins in LPS2 subset (Figure 12b), the corrected MDSs have a good positively-linear correlation to the buried depths, with slope values of 17.7–19.7 MPa/km. This illustrates the validity of the improved method, although it yields, as shown in Figure 6, a generally low accuracy of the MDS.

5.3. Interpretation

Our stress results (Figure 9) reveal the complex evolution of the tectonic stress field in the study area since the Mesozoic. This complexity is represented by four tectonic regimes: NWW−SEE compression (LPS1 and non-LPS1), NNE−SSW compression (LPS2 and non-LPS2), NW−SE extension (non-LPS3a) and NNE−SSW extension (non-LPS3b). The compressional regimes are nearly perpendicular to the transverse and longitudinal fold sets in the region (Figure 1b), respectively. In this manner both regimes have a regional extent. Their presence in the pre-folding stage indicates a much complex deformation history of the Longshan dome, in contrast with the generally accepted model, where transverse folds are simply overprinted by longitudinal folds [15,16,17,18,19].
Regional compression with respect to the first compressional regime happened in the Middle–Late Triassic, due to the collision between the South China and North China continents [37,38], and re-occurred in the Late Jurassic–Early Cretaceous, principally owing to the closure of the Mongolia-Okhotsk Ocean in the long distance to the north [11]. As a result a fold-and-thrust belt formed [37,38,74] and was subsequently reactivated [11,42] on the northern margin of the South China continent.
Regional compression with respect to the second compressional regime took place in the Middle–Late Triassic and again in the Late Jurassic–Early Cretaceous, as a result of the long-standing northwestward or westward subduction of the Izanagi and subsequently Pacific oceanic plates. A majority of the South China continent was involved in deformation and magmatism, presumably due to the flat-slab subduction [10]. In the study area, this Triassic compression is evidenced by the intrusion of a few NW-striking felsic dykes with a Zircon U–Pb age of 217−220 Ma on the eastern and northern flanks [75], and an angular unconformity between the Jurassic and Triassic (Figure 1).
The first extensional regime (non-LPS3a) belongs to NW−SE regional extension on the eastern margin of the Eurasian continent in the Cretaceous. This regional extension is characterized by a spread of NE-trending grabens or half-grabens in the central and eastern portions of the South China continent [76,77]. It is attributed to a variety of possible tectonic processes such as the collapse of the Early-Mesozoic marginal orogen [45], the high-angle subduction of the Pacific oceanic plate [9,40] and the roll-back of the subduction zone [46,47].
The second extensional regime (non-LPS3b) seems not to have a counterpart of regional extension. More about this will be discussed below.
Furthermore, in the ideal upper crust, where deformation is accommodated by the reactivation of pre-existing faults, the minimum differential stress gradient (MDSG) under the thrust regime is calculated in the below expression [78]:
d ( σ 1 σ 3 ) / d z = ( R 1 ) ρ g ( 1 λ )
where σ 1 and σ 3 are the maximum and minimum principal stresses, z is the buried depth, R is the minimum σ 1 / σ 3 , ρ is the rock density, g is the gravitational acceleration, and λ is the pore-fluid factor. ρ g is the hydrostatic pressure gradient at the depth (HPG). Under the nearly hydrostatic condition the friction coefficient reaches ca. 0.75, yielding a R value of 4. Then for a typical λ value of 0.4 [78,79] and the normal HPG, 22.7–25.0 MPa/km [80], we have a normal MDSG value of 40.9–45.0 MPa/km. The previously obtained MDS gradients for LPS, 15.2–19.7 MPa/km (Figure 12), are much smaller than this MDSG value but slightly smaller than the normal HPG. This indicates a difference in stress profile between the LPS state and the typical thrusting state, as it is.

6. Discussion

6.1. Chronology of Stress Subsets

As previously described, field observations do not provide direct evidence on the relative ages of the two fold sets, longitudinal and transverse, that made the Longshan dome. They are however informative in understanding the deformation history of the dome in the following respects:
(1) Secondary deformation structures pertaining to the longitudinal folds, such as bedding-parallel striations (Figure 3d) and spaced cleavages (Figure 3e), have an older age than the ones most probably pertaining to the transverse folds.
(2) Cleavages associated with the longitudinal folds are much more common than the ones associated with the transverse folds (Figure 2). This suggests a greater deformation temperature for the longitudinal folds.
(3) A combination of wedge-shaped calcite veins and stylolites (Figure 3f), diagnostic of the relatively high deformation temperature, has a generally older age than planar calcite veins. It formed under the local shortenings, roughly N–S and roughly E–W.
(4) The difference in vein sequence between the neighboring locations on the southern flank (Figure 3f,g) seems to characterize a complex deformation history of the dome.
These observations are helpful but insufficient to determine the relative and even absolute ages of the stress subsets. For example, the occurrence of parallel veining does not permit, as utilized [23], the use of the crosscutting relationships between the vein sets in timing the stress subsets favorable to form the sets. For this purpose, it is necessary to take into consideration more relevant geological observations and inferences as follows:
1.
In the east of Dongkou county there exists an angular unconformity where the folded platformal cover is overlain by Lower-Jurassic lacustrine sandstones (Figure 1b; [22]). The overlain rocks are much less strongly folded than the underlying rocks, where the longitudinal folds predominate. In this light the NW–SE compression should have made a more significant contribution to the deformation of the cover in the Middle–Late Triassic than in the Late Jurassic–Early Cretaceous.
2.
Exposed in Hunan province are numerous granitic intrusive bodies with zircon U–Pb ages of 210−225 Ma [81,82,83,84,85,86]. This widespread intrusion is presumably attributed to the mechanically thickening of the crust caused by intense compression at the time [87]. Meanwhile, Mesozoic granitic intrusion on the continent has a strong tendency to migrate towards the east with time [10]. The crust of the region would have been in a generally cooling state since the Middle–Late Triassic compression.
3.
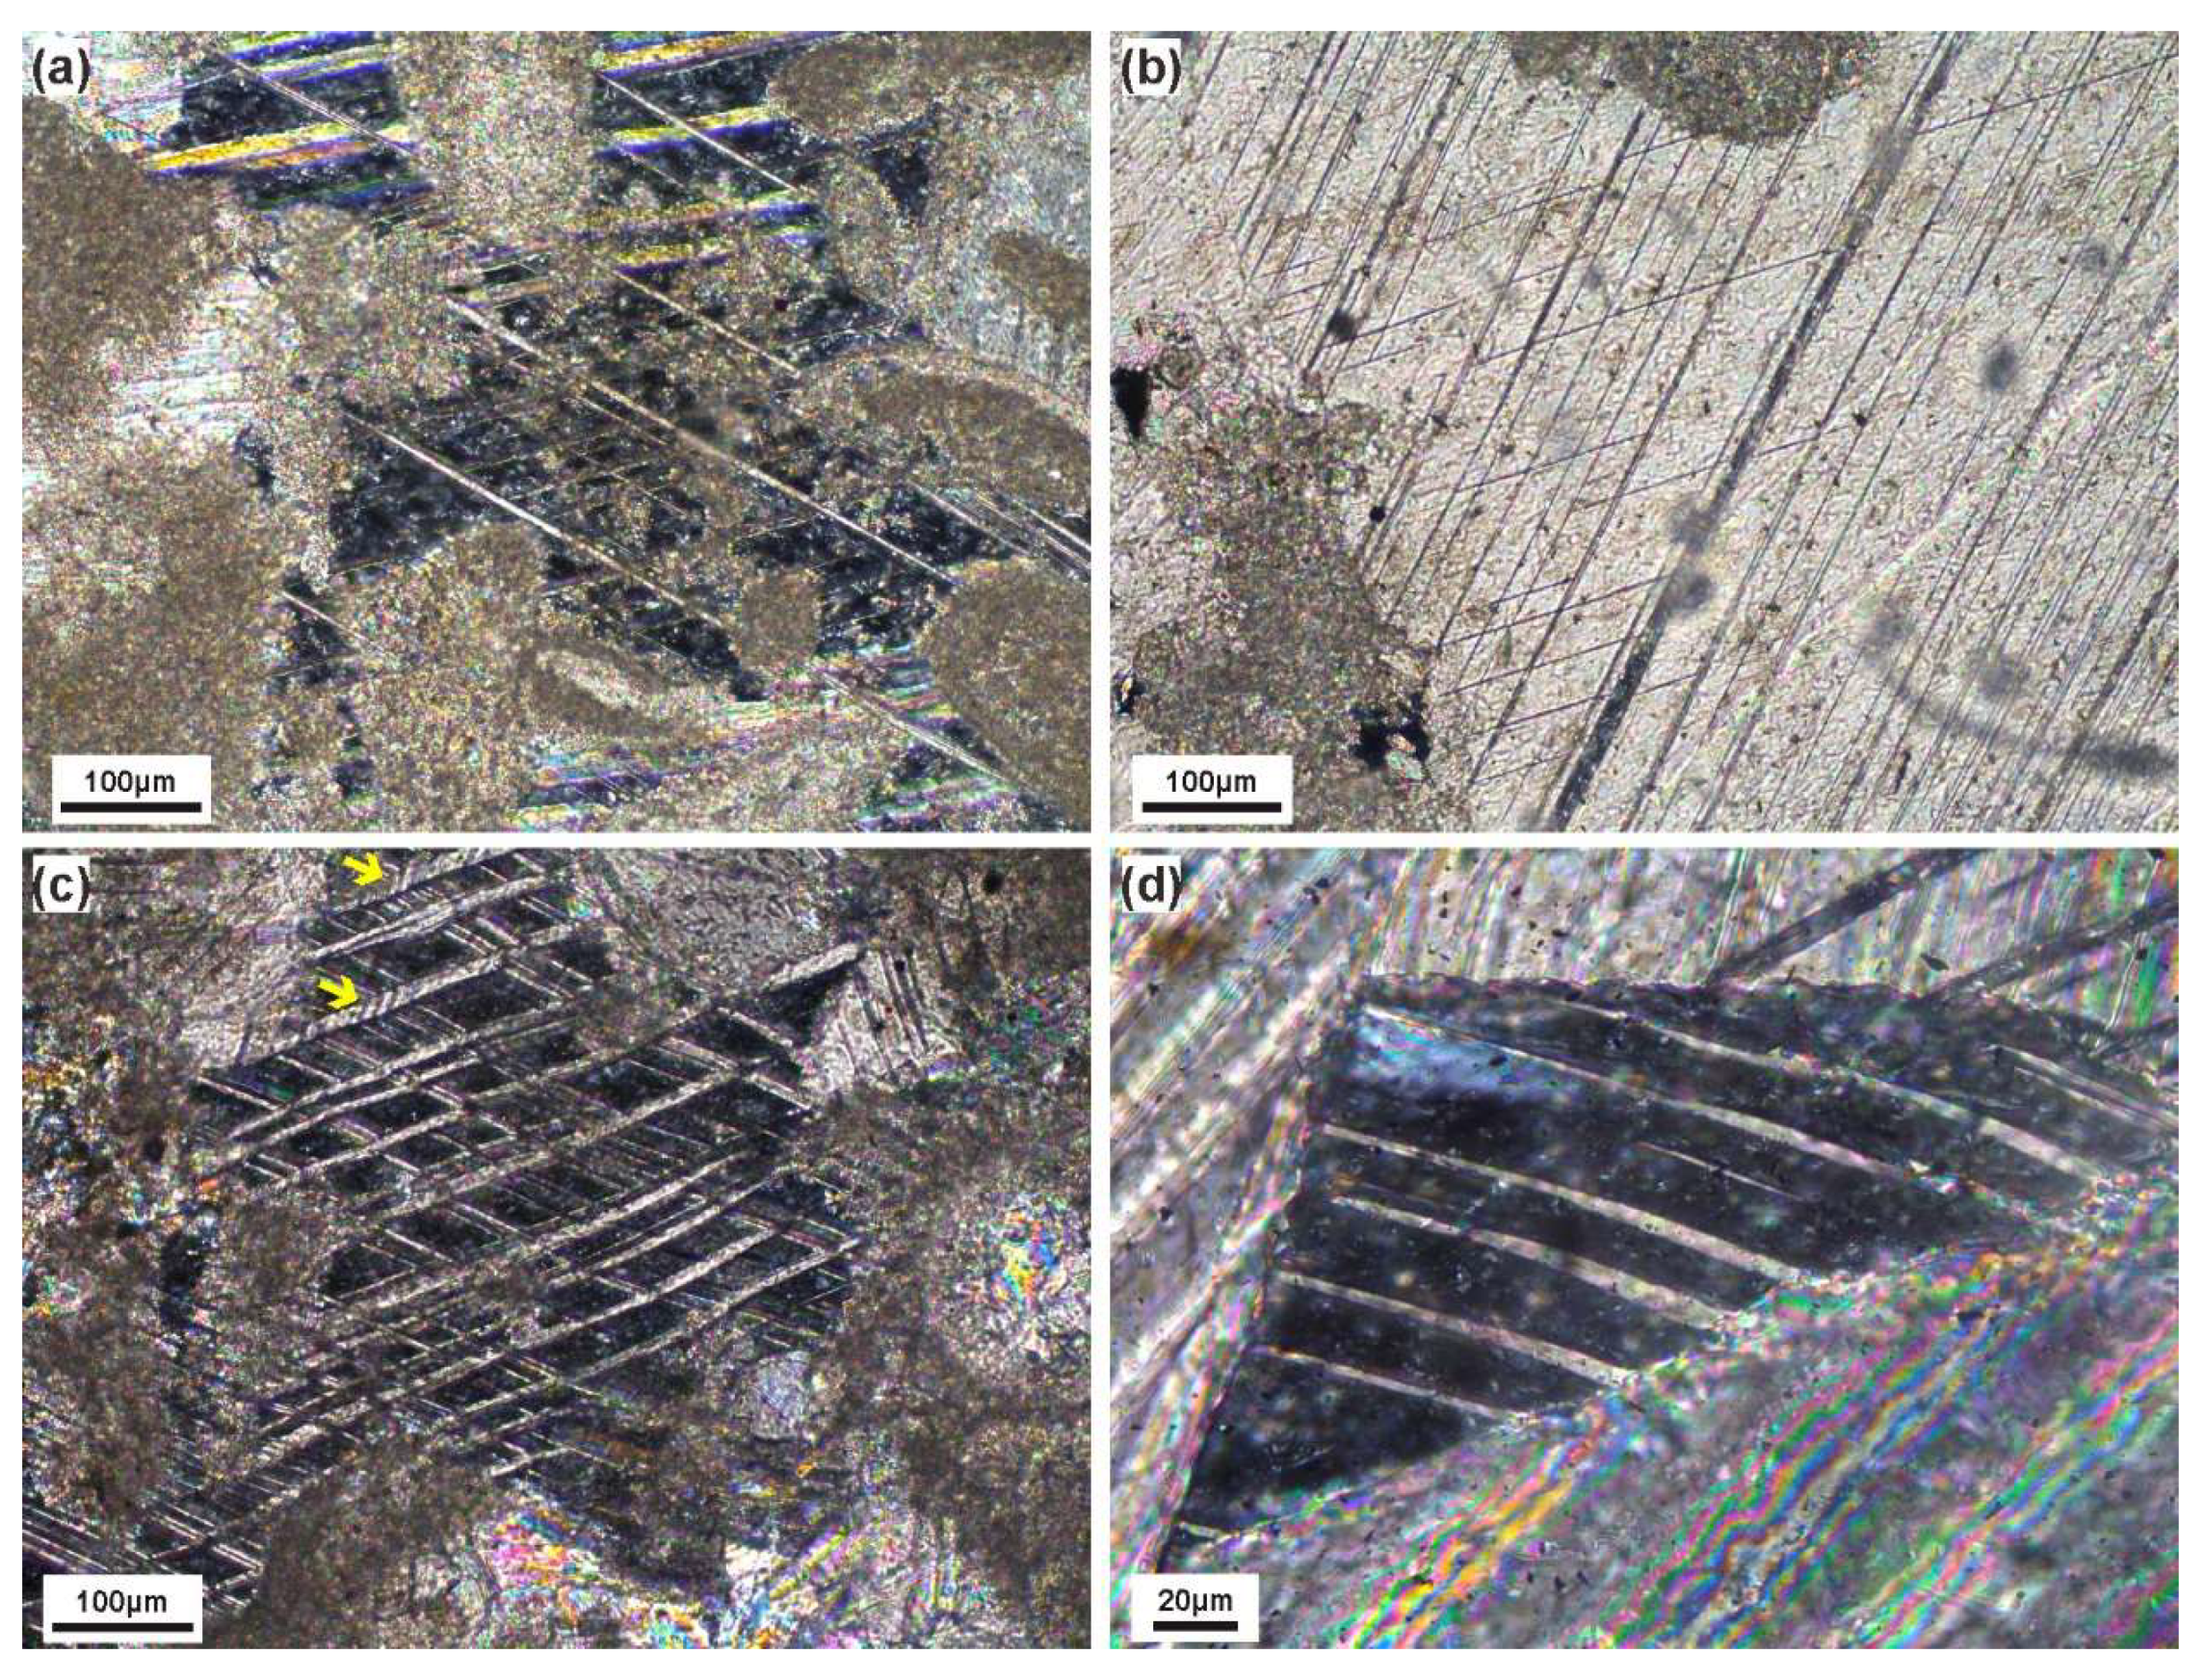
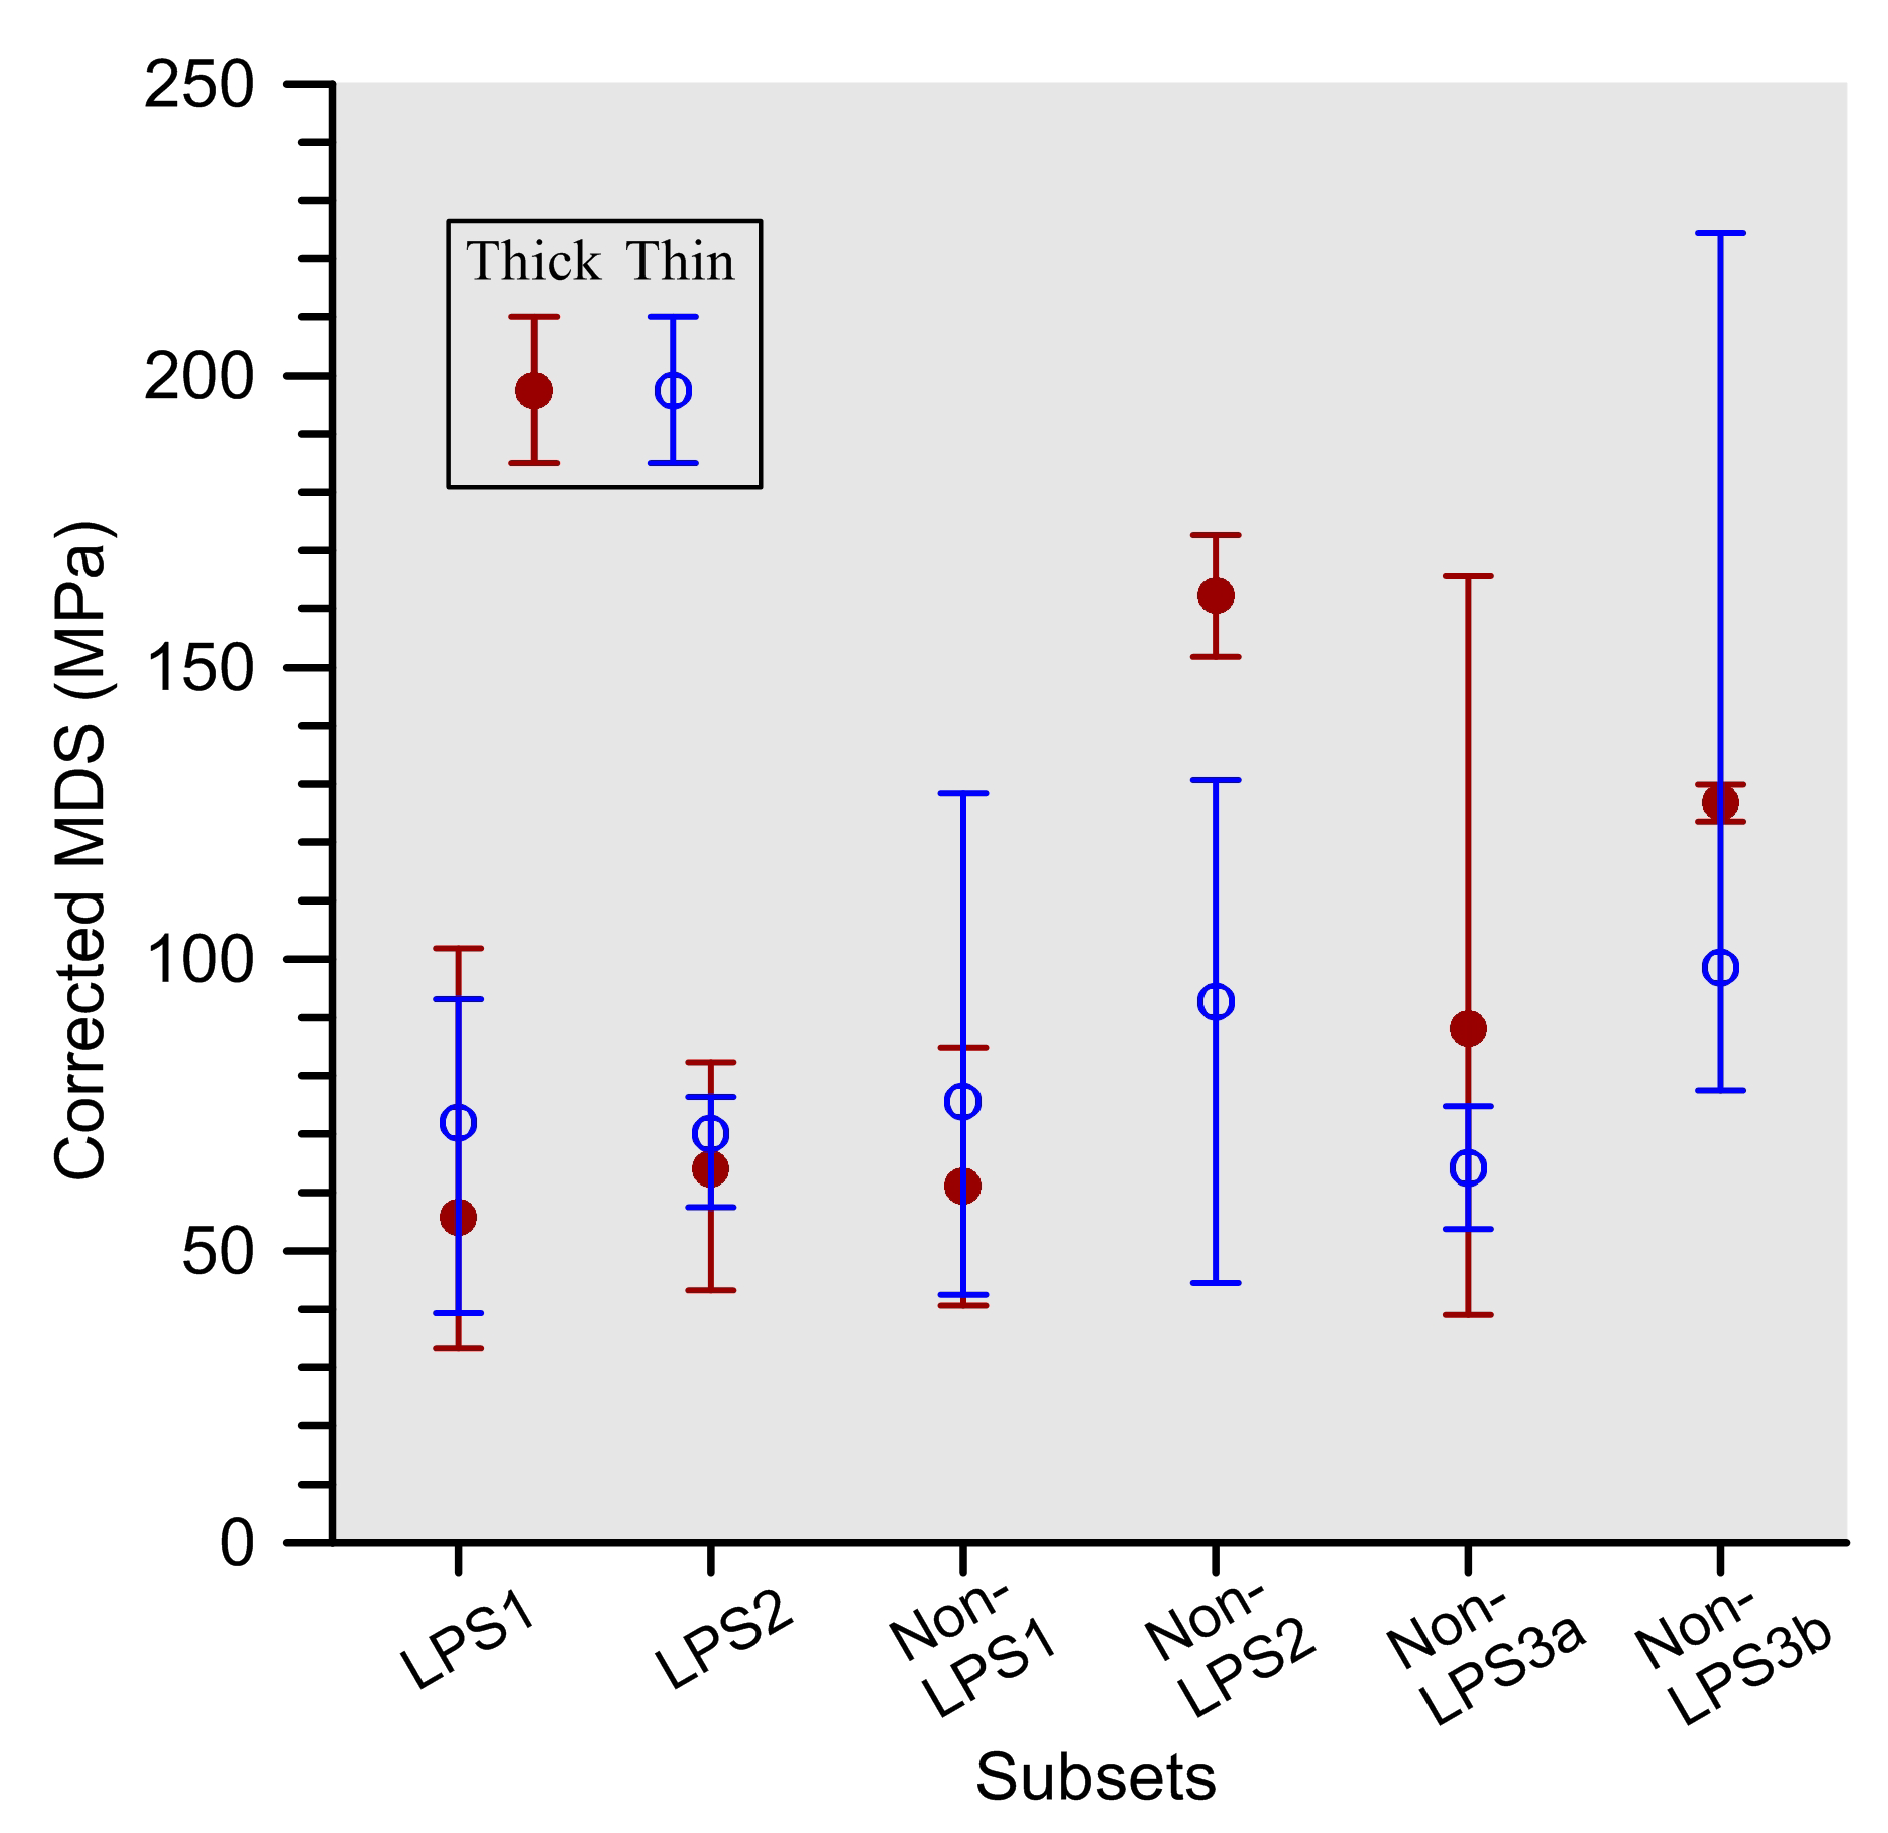
As previously described, thick twins abundant in samples are indicative of a relatively high deformation temperature (HDT), in correspondence with slaty or spaced cleavages in mudstones and muddy limestones, associated principally with the longitudinal folds. An issue thus arises about the recognition of the HDT stress subsets. In order to resolve this issue, the ratio of stress estimates for thick or thin twins to samples (RES) for a certain stress subset is introduced (Figure 13). It is more likely to have a HDT stress subset when there is a larger RES value for thick twins. In Figure 11, most of the subsets are separated into two groups: HDT (LPS1, LPS2 and non-LPS1) and non-HDT (non-LPS2 and non-LPS3b). The former group has a larger RES value for thick twins than for thin twins, and the latter group possesses a larger RES value for thin twins. Between the groups is the non-LPS3a subset that has a larger RES value for thick twins.
Based on these considerations the stress subsets are rearranged in a younging and temperature-decreasing order and further grouped into three stages (Figure 14): folding in the Middle–Late Triassic (LPS1, LPS2, non-LPS1 and non-LPS3a), refolding in the Late Jurassic–Early Cretaceous (non-LPS2) and extension in the Cretaceous (non-LPS3b). However, there are some uncertainties regarding this arrangement. Whether the LPS1 is older or younger than the LPS2 is yet unknown and requires additional observations. The non-LPS3a is placed immediately after the non-LPS1, since the former extension, approximately parallel to the longitudinal fold axes, is considered as a product of relaxation of strain accumulated by the latter intense deformation. Interestingly, its minimum principal stress axis is nearly perpendicular to the strikes of the most economically important Au-Sb-bearing quartz veins in the basement core. These veins are vertical and WNW-striking and have a 40Ar–39Ar age of 161.1 ± 1.2 Ma [88].

6.2. Tectonic Evolution

According to the established sequence of the stress subsets (Figure 14), the study area has the following scenarios of tectonic deformation during the Mesozoic:
1.
In the Middle–Late Triassic, both the westward subduction of the western Pacific oceanic basin(s) and the collision between the South China and North China continents were responsible for the tectonic stress field in the central portion of the South China continent (Figure 14a–b). The subduction process was sufficiently enhanced to deform the crust of the portion by means of folds and thrusts (Figure 14c). As strongly implied by the HDT state of the LPS subsets (Figure 13), the crust should have been heated and hence weakened before the onset of intense deformation. One line of probable evidence on this heating is the widespread occurrence of Triassic granitic intrusive bodies in the region.
Given the common phenomenon of fold-axis parallel extension in orogenic belts [89,90,91,92,93], we would like to relate the non-LPS3a extension (Figure 14d) to the non-LPS1 compression (Figure 14c) that generated the NNE-trending folds. There is however a lack of field observation about the relationship between them. Possible mechanisms about such a syn-folding extension include the difference in rate of amplification along an individual fold [94], and flattening on the fold axial plane [94].
2.
In the Late Jurassic–Early Cretaceous, the pre-existing NE- or NNE-trending fold set was refolded under the N–S or NNE–SSW compression (Figure 14e). The regional refolds comprise the dome-and-basin structure and the bending of longitudinal folds, as previously described. They belong to Ramsay’s [7] type 1 and type 2 superimposed folds, respectively. Both are common in nature for the interference of buckles. According to Ghosh et al.’s [95] experimental study, the type of fold interference depends on the tightness of pre-existing folds. The former type prefers relatively gentle pre-existing folds and the latter type would produce relatively tight pre-existing folds.
The non-HDT state of the non-LPS2 subset indicates the cooling of the study area caused by either uplift and erosion or the descent of geothermal flow. Under either condition, there is an increase in intensity of tectonic deformation from the LPS1 to non-LPS2. That is the reason why at this time the ancient fold-and-thrust belt on the northern margin was reactivated and propagated inland toward the south [96,97]. These deformation structures are the products of far-field compression that originated principally from the closure of the Mongolia-Okhotsk Ocean to the north [11,42].
Meanwhile, the continuous subduction of the western Pacific oceanic basin(s), for example the Izanagi basin, resulted in a more intense NW–SE compression that generated a remarkable fold belt on the eastern side of the Yangtze platform, about 400 km in width [98]. How this compression affected the pre-existing folds and faults in the region is poorly understood.
3.
In the Cretaceous after intense compression, NW–SE regional extension prevailed in the South China continent. It is characterized by grabens or half grabens bounded by NE-striking high-angle normal faults and infilled by red beds. In the uplift mountains this extension is well recorded by calcite e-twins in multi-deformed limestones (Figure 14f; [29]).
In the scenarios, NE−NNE-trending folds have an older age than E-trending folds. This is completely different from the generally accepted model for the formation of the dome [15,16,17,18,19,20]. The most important line of field evidence on this is the bending of longitudinal folds to the south of the study area (Figure 1b). It is typical of Ramsay’s [7] type 2 superimposed folds, and its interference map tells the relative age of two fold sets: the curved fold set has an older age. Unfortunately this phenomenon has been ignored or, as above mentioned, mis-explained ever since.

7. Conclusions

The oval-shaped Longshan dome is located in the central portion of the South China continent. It is the product of mega-fold superimposition during the Mesozoic. It is generally accepted that NE−NNE-trending folds overprinted E−W-trending folds to form the dome. Unfortunately, this model has not been confirmed ever since, because the cross-fold interference map does not tell the relative ages of the fold sets, and because there is no reliable field observation about the relationship regarding secondary deformation structures with respect to the sets.
In this paper we tried to resolve this issue by applying paleostress analysis of calcite e-twins to the dome. Ten limestone samples were collected from the Upper Paleozoic platformal cover on the flank of the dome, and measured for e-twins under the universal stage. E-twins in samples are thin (<1 μm) or thick (≥1 μm), and thick twins are diagnostic of relatively high temperature. Shan et al.’s [30] inversion method for polyphase twin data was improved and then applied to the measured datasets. The obtained stress estimates were classified into two layer-parallel shortening (LPS) subsets and three non-LPS subsets. These subsets comprise four tectonic regimes: NWW−SEE compression (LPS1 and non-LPS1), NNE−SSW compression (LPS2 and non-LPS2), NW−SE extension (non-LPS3a) and NNE−SSW extension (non-LPS3b). They are further arranged in a temperature-decreasing order to establish a complex deformation sequence of the study area.
There are three distinct stages of the sequence: folding in the Middle–Late Triassic (LPS1, LPS2, non-LPS1 and non-LPS3a), refolding in the Late Jurassic–Early Cretaceous (non-LPS2) and extension in the Cretaceous (non-LPS3b). In this manner E−W-trending folds overprinted NE−NNE-trending folds to form the dome. This is supported by the presence of E-W-trending transverse folds to the south. These folds are the bends of NE−NNE-trending longitudinal folds. Such a transverse fold is a typical Ramsay’s [7] type 2 cross fold, whose interference map tells the relative ages of the fold sets. What is more, the approximately N−S regional compression responsible for transverse folds happened in Late Jurassic–Early Cretaceous and should have a profound effect on the intensely deformed continent. This has been ignored in previous works.

Author Contributions

Conceptualization, J.Z. and Y.S.; Data curation, J.Z.; Formal analysis, J.Z. and Y.S.; Funding acquisition, Y.S.; Investigation, J.Z., Y.S. and S.H.; Methodology, Y.S.; Project administration, Y.S.; Resources, J.Z., Y.S. and S.H.; Supervision, Y.S.; Validation, Y.S.; Visualization, J.Z.; Writing—original draft, J.Z.; Writing—review and editing, Y.S. All authors have read and agreed to the published version of the manuscript.

Funding

This research was funded by Strategic Priority Research Program (B) of the Chinese Academy of Sciences, grant number XDB18030104, National Natural Science Foundation of China, grant number 41772206, and Key Special Project for Introduced Talents Team of Southern Marine Science and Engineering Guangdong Laboratory (Guangzhou), grant number GML2019ZD0204.

Data Availability Statement

Not applicable.

Acknowledgments

This manuscript was reviewed by O. Lacombe and two anonymous referees who made valuable comments on it. Richard Lisle kindly checked the written English. This is contribution No. IS-3086 from GIGCAS.

Conflicts of Interest

The authors declare no conflict of interest.

References

  1. Lennox, P.; Flood, P. Age and Structural Characterisation of the Texas Megafold, Southern New England Orogen, Eastern Australia. In Tectonics and Metallogenesis of the New England Orogen; Special Publication of the Geological Society of Australia; Geological Society of Australia: Sydney, NSW, Australia, 1997; Volume 19, pp. 161–177. [Google Scholar]
  2. Li, P.; Rosenbaum, G.; Donchak, P.J. Structural evolution of the Texas Orocline, eastern Australia. Gondwana Res. 2012, 22, 279–289. [Google Scholar] [CrossRef]
  3. Lim, C.; Cho, M. Two-phase contractional deformation of the Jurassic Daebo Orogeny, Chungnam Basin, Korea, and its correlation with the early Yanshanian movement of China. Tectonics 2012, 31, 1. [Google Scholar] [CrossRef]
  4. Tian, Z.H.; Xiao, W.J.; Shan, Y.H.; Windley, B.; Han, C.M.; Zhang, J.E.; Song, D.F. Mega-fold interference patterns in the Beishan orogen (NW China) created by change in plate configuration during Permo-Triassic termination of the Altaids. J. Struct. Geol. 2013, 52, 119–135. [Google Scholar] [CrossRef]
  5. Abu Sharib, A.; Bell, T. Radical changes in bulk shortening directions during orogenesis: Significance for progressive development of regional folds and thrusts. Precambrian Res. 2011, 188, 1–20. [Google Scholar] [CrossRef]
  6. Koushik, S.; Jörg, P. Himalayan basement rocks experienced superposed folding during the Orogeny: Insights from integrated mesoscopic and magnetic fabric analysis. In Proceedings of EGU General Assembly Conference Abstracts, Vienna, Austria, 7–12 April 2013. pp. EGU2013–6674. [Google Scholar]
  7. Ramsay, J.G. Interference patterns produced by the superposition of folds of similar type. J. Geol. 1962, 70, 466–481. [Google Scholar] [CrossRef]
  8. Hsu, K.J.; Shu, S.; Jiliang, L.; Haihong, C.; Haipo, P.; Sengor, A. Mesozoic overthrust tectonics in south China. Geology 1988, 16, 418–421. [Google Scholar] [CrossRef]
  9. Zhou, X.M.; Sun, T.; Shen, W.Z.; Shu, L.S.; Niu, Y.L. Petrogenesis of Mesozoic granitoids and volcanic rocks in South China: A response to tectonic evolution. Episodes 2006, 29, 26. [Google Scholar] [CrossRef] [PubMed] [Green Version]
  10. Li, Z.X.; Li, X.H. Formation of the 1300-km-wide intracontinental orogen and postorogenic magmatic province in Mesozoic South China: A flat-slab subduction model. Geology 2007, 35, 179–182. [Google Scholar] [CrossRef]
  11. Li, S.; Santosh, M.; Zhao, G.; Zhang, G.; Jin, C. Intracontinental deformation in a frontier of super-convergence: A perspective on the tectonic milieu of the South China Block. J. Asian Earth Sci. 2012, 49, 313–329. [Google Scholar] [CrossRef]
  12. Wang, Y.; Fan, W.; Zhang, G.; Zhang, Y. Phanerozoic tectonics of the South China Block: Key observations and controversies. Gondwana Res. 2013, 23, 1273–1305. [Google Scholar] [CrossRef]
  13. Mao, J.; Li, Z.; Ye, H. Mesozoic tectono-magmatic activities in South China: Retrospect and prospect. Sci. China Earth Sci. 2014, 57, 2853–2877. [Google Scholar] [CrossRef]
  14. Wang, J.; Peng, E.; Sun, Z.; Tang, Z. Tectonic evolution of Longshan Dome in middle Hunan. Hunan Geol. 1999, 18, 229–231, (In Chinese with English abstract). [Google Scholar]
  15. Zhang, Y.Q.; Xu, X.B.; Jia, D.; Shu, L.S. Deformation record of the change from Indosinian collision-related tectonic system to Yanshanian subduction-related tectonic system in South China during the Early Mesozoic. Earth Sci. Front. 2009, 16, 234–247, (In Chinese with English abstract). [Google Scholar]
  16. Wang, J.; Li, S.; Jin, C. Dome-and-basin pattern in centralHunan province: Stages and genesis of fold superposition. Geotecton. Met. 2010, 34, 159–165, (In Chinese with English abstract). [Google Scholar]
  17. Li, S.; Wang, T.; Jin, C.; Dai, L.; Liu, X.; Zhou, X.; Wang, Y.; Zhang, G. Features and causes of Indosinian intracontinental structures in the Xuefengshan Precambrian basement and its neighboring regions. J. Jilin Univ. (Earth Sci. Ed.) 2011, 41, 93–105, (In Chinese with English abstract). [Google Scholar]
  18. Shi, W.; Dong, S.; Zhang, Y.; Huang, S. The typical large-scale superposed folds in the central South China: Implications for Mesozoic intracontinental deformation of the South China Block. Tectonophysics 2015, 664, 50–66. [Google Scholar] [CrossRef]
  19. Li, Y.; Dong, S.; Zhang, Y.; Li, J.; Su, J.; Han, B. Episodic Mesozoic constructional events of central South China: Constraints from lines of evidence of superimposed folds, fault kinematic analysis, and magma geochronology. Int. Geol. Rev. 2016, 58, 1076–1107. [Google Scholar] [CrossRef]
  20. Li, Z.; Yan, D.; Chen, W.; Li, L.; Chen, F. The structural style and genetics mechanism of the Longshan dome in Xiangzhong basin, Xuefengshan orogenic belt. Acta Geol. Sin. 2019, 93, 2742–2758, (In Chinese with English abstract). [Google Scholar]
  21. Li, S.; Zhao, G.; Zhang, G.; Liu, X.; Dong, S.; Wang, Y.; Liu, X.; Suo, Y.; Dai, L.; Jin, C. Not all folds and thrusts in the Yangtze foreland thrust belt are related to the Dabie Orogen: Insights from Mesozoic deformation south of the Yangtze River. Geol. J. 2010, 45, 650–663. [Google Scholar] [CrossRef]
  22. Resources, H.B.G.M. Regional Geology of the Hunan Province; Geological Publishing House: Beijing, China, 1988; pp. 1–728. (In Chinese) [Google Scholar]
  23. Lacombe, O. Calcite twins, a tool for tectonic studies in thrust belts and stable orogenic forelands. Oil Gas Sci. Technol. 2010, 65, 809–838. [Google Scholar] [CrossRef] [Green Version]
  24. Amrouch, K.; Lacombe, O.; Bellahsen, N.; Daniel, J.M.; Callot, J.P. Stress and strain patterns, kinematics and deformation mechanisms in a basement-cored anticline: Sheep Mountain Anticline, Wyoming. Tectonics 2010, 29, 1. [Google Scholar] [CrossRef] [Green Version]
  25. Rocher, M.; Lacombe, O.; Angelier, J.; Chen, H.W. Mechanical twin sets in calcite as markers of recent collisional events in a fold- and -thrust belt: Evidence from the reefal limestones of southwestern Taiwan. Tectonics 1996, 15, 984–996. [Google Scholar] [CrossRef] [Green Version]
  26. Lacombe, O.; Amrouch, K.; Mouthereau, F.; Dissez, L. Calcite twinning constraints on late Neogene stress patterns and deformation mechanisms in the active Zagros collision belt. Geology 2007, 35, 263–266. [Google Scholar] [CrossRef]
  27. Lacombe, O.; Malandain, J.; Vilasi, N.; Amrouch, K.; Roure, F. From paleostresses to paleoburial in fold–thrust belts: Preliminary results from calcite twin analysis in the Outer Albanides. Tectonophysics 2009, 475, 128–141. [Google Scholar] [CrossRef]
  28. Arboit, F.; Amrouch, K.; Morley, C.; Collins, A.S.; King, R. Palaeostress magnitudes in the Khao Khwang fold-thrust belt, new insights into the tectonic evolution of the Indosinian orogeny in central Thailand. Tectonophysics 2017, 710, 266–276. [Google Scholar] [CrossRef]
  29. Zheng, J.; Shan, Y. Inversion of polyphase calcite-twin data for deviatoric stress tensors: 2. Application to the Huangling Dome, northern South China. J. Struct. Geol. 2020, 138, 104089. [Google Scholar] [CrossRef]
  30. Shan, Y.; Zheng, J.; Liang, X. Inversion of polyphase calcite twin data for deviatoric stress tensors: 1. A novel numerical approach. Journal of Structural Geology 2019, 128, 103873. [Google Scholar] [CrossRef]
  31. Shu, L.; Faure, M.; Wang, B.; Zhou, X.; Song, B. Late Palaeozoic–Early Mesozoic geological features of South China: Response to the Indosinian collision events in Southeast Asia. Comptes Rendus Geosci. 2008, 340, 151–165. [Google Scholar] [CrossRef] [Green Version]
  32. Faure, M.; Shu, L.; Wang, B.; Charvet, J.; Choulet, F.; Monie, P. Intracontinental subduction: A possible mechanism for the Early Palaeozoic Orogen of SE China. Terra Nova 2009, 21, 360–368. [Google Scholar] [CrossRef] [Green Version]
  33. Charvet, J.; Shu, L.; Faure, M.; Choulet, F.; Wang, B.; Lu, H.; Le Breton, N. Structural development of the Lower Paleozoic belt of South China: Genesis of an intracontinental orogen. J. Asian Earth Sci. 2010, 39, 309–330. [Google Scholar] [CrossRef] [Green Version]
  34. Charvet, J. The Neoproterozoic–early Paleozoic tectonic evolution of the South China Block: An overview. J. Asian Earth Sci. 2013, 74, 198–209. [Google Scholar] [CrossRef] [Green Version]
  35. Chu, Y.; Faure, M.; Lin, W.; Wang, Q. Early Mesozoic tectonics of the South China block: Insights from the Xuefengshan intracontinental orogen. J. Asian Earth Sci. 2012, 61, 199–220. [Google Scholar] [CrossRef]
  36. Lepvrier, C.; Maluski, H.; Van Tich, V.; Leyreloup, A.; Thi, P.T.; Van Vuong, N. The early Triassic Indosinian orogeny in Vietnam (Truong Son Belt and Kontum Massif); implications for the geodynamic evolution of Indochina. Tectonophysics 2004, 393, 87–118. [Google Scholar] [CrossRef]
  37. Faure, M.; Lin, W.; Schärer, U.; Shu, L.; Sun, Y.; Arnaud, N. Continental subduction and exhumation of UHP rocks. Structural and geochronological insights from the Dabieshan (East China). Lithos 2003, 70, 213–241. [Google Scholar] [CrossRef]
  38. Lin, W.; Shi, Y.; Wang, Q. Exhumation tectonics of the HP-UHP orogenic belt in Eastern China: New structural–petrological insights from the Tongcheng massif, Eastern Dabieshan. Lithos 2009, 109, 285–303. [Google Scholar] [CrossRef]
  39. Hu, R.-Z.; Zhou, M.-F. Multiple Mesozoic mineralization events in South China—An introduction to the thematic issue. Miner. Depos. 2012, 47, 579–588. [Google Scholar] [CrossRef]
  40. Zhou, X.; Li, W. Origin of Late Mesozoic igneous rocks in Southeastern China: Implications for lithosphere subduction and underplating of mafic magmas. Tectonophysics 2000, 326, 269–287. [Google Scholar] [CrossRef]
  41. Chen, C.-H.; Lee, C.-Y.; Shinjo, R. Was there Jurassic paleo-Pacific subduction in South China?: Constraints from 40Ar/39Ar dating, elemental and Sr–Nd–Pb isotopic geochemistry of the Mesozoic basalts. Lithos 2008, 106, 83–92. [Google Scholar] [CrossRef]
  42. Zhang, Y.; Dong, S. East Asia Multi-Plate Convergence in Late Mesozoic and the Development of Continental Tectonic Systems. J. Geomech. 2019, 25, 613–641, (In Chinese with English abstract). [Google Scholar]
  43. Jia, C.; Wei, G.; Li, B. Yanshanian tectonic features in west-central China and their petroleum geological significance. Oil Gas Geol. 2005, 26, 9–15, (In Chinese with English abstract). [Google Scholar]
  44. De Grave, J.; Buslov, M.M. Distant effects of India–Eurasia convergence and Mesozoic intracontinental deformation in Central Asia: Constraints from apatite fission-track thermochronology. J. Asian Earth Sci. 2007, 29, 188–204. [Google Scholar] [CrossRef]
  45. Li, X.H. Cretaceous magmatism and lithospheric extension in Southeast China. J. Asian Earth Sci. 2000, 18, 293–305. [Google Scholar] [CrossRef]
  46. Yoshida, M. A new conceptual model for whole mantle convection and the origin of hotspot plumes. J. Geodyn. 2014, 78, 32–41. [Google Scholar] [CrossRef]
  47. Matthews, K.J.; Maloney, K.T.; Zahirovic, S.; Williams, S.E.; Seton, M.; Mueller, R.D. Global plate boundary evolution and kinematics since the late Paleozoic. Glob. Planet. Chang. 2016, 146, 226–250. [Google Scholar] [CrossRef]
  48. Fossen, H. Structural Geology; Cambridge University Press: New York, NY, USA, 2010. [Google Scholar]
  49. Thiessen, R.L.; Means, W.D. Classification of fold interference patterns: A reexamination. J. Struct. Geol. 1980, 2, 311–316. [Google Scholar] [CrossRef]
  50. Qiu, Z.; Zhong, J.; Zhan, S. Tectonic features of Qiyang tectonic system and its mechanism of formation. Oil Gas Geol. 1980, 1, 75–81, (In Chinese with English abstract). [Google Scholar]
  51. Chen, C. A preliminary study of Qiyang E-type tectonic in Hunan. Nat. Sci. J. Hunan Norm. Univ. 1985, 8, 109–112, (In Chinese with English abstract). [Google Scholar]
  52. Bai, D.; Li, J.; Zhou, K.; Ma, T.; WAng, X. Query of Qiyang-type tectonic system in Hunan. Geotecton. Met. 2008, 32, 265–275, (In Chinese with English abstract). [Google Scholar]
  53. Wang, Y.; Zhang, Y.; Fan, W.; Peng, T. Structural signatures and 40Ar/39Ar geochronology of the Indosinian Xuefengshan tectonic belt, South China Block. J. Struct. Geol. 2005, 27, 985–998. [Google Scholar] [CrossRef]
  54. Chu, Y.; Lin, W.; Faure, M.; Xue, Z.; Ji, W.; Feng, Z. Cretaceous Episodic Extension in the South China Block, East Asia: Evidence from the Yuechengling Massif of Central South China. Tectonics 2019, 38, 3675–3702. [Google Scholar] [CrossRef]
  55. Groshong Jr, R.H. Low-temperature deformation mechanisms and their interpretation. Geol. Soc. Am. Bull. 1988, 100, 1329–1360. [Google Scholar] [CrossRef]
  56. Lacombe, O.; Laurent, P. Determination of deviatoric stress tensors based on inversion of calcite twin data from experimentally deformed monophase samples: Preliminary results. Tectonophysics 1996, 255, 189–202. [Google Scholar] [CrossRef]
  57. Laurent, P.; Kern, H.; Lacombe, O. Determination of deviatoric stress tensors based on inversion of calcite twin data from experimentally deformed monophase samples. Part II. Axial and triaxial stress experiments. Tectonophysics 2000, 327, 131–148. [Google Scholar] [CrossRef]
  58. Parlangeau, C.; Dimanov, A.; Lacombe, O.; Hallais, S.; Daniel, J.-M. Uniaxial compression of calcite single crystals at room temperature: Insights into twinning activation and development. Solid Earth 2019, 10, 307–316. [Google Scholar] [CrossRef] [Green Version]
  59. Pfiffner, O.A.; Burkhard, M. Determination of paleo-stress axes orientations from fault, twin and earthquake data. Ann. Tecton. 1987, 1, 48–57. [Google Scholar]
  60. Turner, F.J. Nature and dynamic interpretation of deformation lamellae in calcite of three marbles. Am. J. Sci. 1953, 251, 276–298. [Google Scholar] [CrossRef]
  61. Spang, J.H. Numerical Method for Dynamic Analysis of Calcite Twin Lamellae. Geol. Soc. Am. Bull. 1972, 83, 467–471. [Google Scholar] [CrossRef]
  62. Laurent, P.; Bernard, P.; Vasseur, G.; Etchecopar, A. Stress tensor determination from the study of e twins in calcite: A linear programming method. Tectonophysics 1981, 78, 651–660. [Google Scholar] [CrossRef]
  63. Laurent, P.; Tourneret, C.; Laborde, O. Determining deviatoric stress tensors from calcite twins: Applications to monophased synthetic and natural polycrystals. Tectonics 1990, 9, 379–390. [Google Scholar] [CrossRef]
  64. Etchecopar, A. Etude des Etats de Contraintes en Tectoniquecassanteet Simulation de Déformations Plastiques (Approchemathématique). Ph.D. Thesis, University Montpellier, Montpellier, France, 1984. [Google Scholar]
  65. Yamaji, A. Generalized Hough transform for the stress inversion of calcite twin data. J. Struct. Geol. 2015, 80, 2–15. [Google Scholar] [CrossRef] [Green Version]
  66. Shan, Y.; Zheng, J.; Liang, X. Synthetic slip plane, the combination of a pair of twinned and untwinned e-planes in a single calcite crystal: Application in dynamic analysis. J. Struct. Geol. 2019, 119, 81–92. [Google Scholar] [CrossRef]
  67. Rocher, M.; Cushing, M.; Lemeille, F.; Lozac'h, Y.; Angelier, J. Intraplate paleostresses reconstructed with calcite twinning and faulting: Improved method and application to the eastern Paris Basin (Lorraine, France). Tectonophysics 2004, 387, 1–21. [Google Scholar] [CrossRef]
  68. Parlangeau, C.; Lacombe, O.; Schueller, S.; Daniel, J.-M. Inversion of calcite twin data for paleostress orientations and magnitudes: A new technique tested and calibrated on numerically-generated and natural data. Tectonophysics 2018, 722, 462–485. [Google Scholar] [CrossRef] [Green Version]
  69. Orife, T.; Lisle, R.J. Numerical processing of palaeostress results. J. Struct. Geol. 2003, 25, 949–957. [Google Scholar] [CrossRef]
  70. Sato, K.; Yamaji, A. Embedding stress difference in parameter space for stress tensor inversion. J. Struct. Geol. 2006, 28, 957–971. [Google Scholar] [CrossRef]
  71. Rybacki, E.; Evans, B.; Janssen, C.; Wirth, R.; Dresen, G. Influence of stress, temperature, and strain on calcite twins constrained by deformation experiments. Tectonophysics 2013, 601, 20–36. [Google Scholar] [CrossRef]
  72. Burkhard, M. Calcite twins, their geometry, appearance and significance as stress-strain markers and indicators of tectonic regime: A review. J. Struct. Geol. 1993, 15, 351–368. [Google Scholar] [CrossRef] [Green Version]
  73. Ferrill, D.A.; Morris, A.P.; Evans, M.A.; Burkhard, M.; Groshong, R.H.; Onasch, C.M. Calcite twin morphology: A low-temperature deformation geothermometer. J. Struct. Geol. 2004, 26, 1521–1529. [Google Scholar] [CrossRef] [Green Version]
  74. Hacker, B.R.; Ratschbacher, L.; Webb, L.; Ireland, T.; Walker, D.; Shuwen, D. U/Pb zircon ages constrain the architecture of the ultrahigh-pressure Qinling–Dabie Orogen, China. Earth Planet. Sci. Lett. 1998, 161, 215–230. [Google Scholar] [CrossRef]
  75. Chen, Y.; Bi, X.; Fu, S.; Dong, S. Zircon U-Pb dating and Hf isotope of the felsic dykes in the Longshan Au-Sb deposit in Central Hunan Province and their geological significance. Acta Petrol. Sin. 2016, 32, 3469–3488, (In Chinese with English abstract). [Google Scholar]
  76. Ren, J.; Tamaki, K.; Li, S.; Junxia, Z. Late Mesozoic and Cenozoic rifting and its dynamic setting in Eastern China and adjacent areas. Tectonophysics 2002, 344, 175–205. [Google Scholar] [CrossRef]
  77. Shu, L.; Zhou, X.; Deng, P.; Wang, B.; Jiang, S.; Yu, J.; Zhao, X. Mesozoic tectonic evolution of the Southeast China Block: New insights from basin analysis. J. Asian Earth Sci. 2009, 34, 376–391. [Google Scholar] [CrossRef]
  78. Sibson, R.H. Frictional constraints on thrust, wrench and normal faults. Nature 1974, 249, 542–544. [Google Scholar] [CrossRef]
  79. Xypolias, P.; Koukouvelas, I. Paleostress magnitude in a fold-thrust belt (External Hellenides, Greece): Evidence from twinning in calcareous rocks. Episodes 2005, 28, 245–251. [Google Scholar] [CrossRef] [Green Version]
  80. Pashin, J.C. Coal as a Petroleum Source Rock and Reservoir Rock. In Applied Coal Petrology: The Role of Petrology in Coal Utiliztion; Suárez-Ruiz, J., Crelling, J.C., Eds.; Elsevier: Amsterdam, The Netherlands, 2008; pp. 227–262. [Google Scholar] [CrossRef]
  81. Ding, X.; Chen, P.; Chen, W.; Huang, H.; Zhou, X. LA-ICPMS zircon dating of Weishan granitic plutons in Hunan Province: Petrogenesis and tectonic implications. Sci. China Ser. D. 2005, 35, 606–616, (In Chinese with English abstract). [Google Scholar]
  82. Peng, B.; Wang, Y.; Fan, W.; Peng, T.; Liang, X. LA-ICPMS zircon U-Pb dating for three Indosinian granitic plutons from central Hunan and western Guangdong provinces and its petrogenetic implications. Acta Geol. Sin. (Engl. Ed.) 2006, 80, 660–669. [Google Scholar]
  83. Chen, W.; Chen, P.; Zhou, X.; Huang, H.; Ding, X. Single-Zircon LA-ICP-MS U-Pb dating of the Yangmingshan granitic study. Acta Geol. Sin. 2006, 80, 1066–1077, (In Chinese with English abstract). [Google Scholar]
  84. Chen, W.; Chen, P.; Huang, H.; Ding, X.; Sun, T. The geochronology and geochemistry studies on the Baimashan granites, Hunan. Sci. China Ser. D 2007, 37, 873–893, (In Chinese with English abstract). [Google Scholar]
  85. Luo, Z.; Wang, Y.; Zhang, F.; Zhang, A.; Zhang, Y. LA-ICPMS zircon U–Pb dating for Baimashan and Jintan Indosinian granitic plutons and its petrogenetic implications. Geotecton. Et Metallog. 2010, 34, 282–290, (In Chinese with English abstract). [Google Scholar]
  86. Li, J.H.; Zhang, Y.Q.; Xu, X.B.; Li, H.L.; Dong, S.W.; Li, T.D. SHRIMP U-Pb dating of zircons from the Baimashan Longtan super-unit and Wawutang granites in Hunan Province and its geological implication. J. Jilin Univ. (Earth Sci. Ed.) 2014, 44, 158–175, (In Chinese with English abstract). [Google Scholar]
  87. Wang, Y.; Zhang, Y.; Fan, W.; Xi, X.; Guo, F. Formation of Indosinian peraluminous granites in Hunan Province: Numerical simulation of thermal effects of magma underplating and crustal thickening. Sci. China (Ser. D) 2002, 32, 491–499. (In Chinese) [Google Scholar] [CrossRef]
  88. Zhang, Z.; Xie, G.; Li, S.; Li, W. Preliminary study on muscovite 40Ar−39Ar geochronology and its significance of the Longshan Ab-Au deposit in Hunan province. Acta Petrol. Sin. 2018, 34, 2535–2547, (In Chinese with English abstract). [Google Scholar]
  89. Flinn, D. On folding during three-dimensional progressive deformation. Q. J. geol. Soc. Lond. 1962, 118, 385–433. [Google Scholar] [CrossRef]
  90. Escher, A.; Watterson, J. Stretching fabrics, folds and crustal shortening. Tectonophysics 1974, 22, 223–231. [Google Scholar] [CrossRef]
  91. Ries, A.C.; Shackleton, R.M. Patterns of strain variations in arcuate fold belts. Philos. Trans. R. Sot. London, Ser. A 1976, 238, 281–288. [Google Scholar]
  92. Peñafiel, L.A.; Reyes, P.S.B.; Alcalá, F.J.; Ramírez, M.R.; Cabero, A. Fold-axis parallel extension along the southern ending of the Quito (Ecuadorian Andes) fault system: Implications in river network and aquifer geometry. Geotectonics 2020, 54, 256–265. [Google Scholar] [CrossRef]
  93. Dietrich, D. Fold-axis parallel extension in an arcuate fold- and-thrust belt: The case of the Helvetic nappes. Tectonophysics 1989, 170, 183–212. [Google Scholar] [CrossRef]
  94. Ramsay, J.G. Folding and Fracturing of Rocks; McGraw-Hill: New York, NY, USA, 1967. [Google Scholar]
  95. Ghosh, S.; Mandal, N.; Khan, D.; Deb, S. Modes of superposed buckling in single layers controlled by initial tightness of early folds. J. Struct. Geol. 1992, 14, 381–394. [Google Scholar] [CrossRef]
  96. Hu, J.; Chen, H.; Qu, H.; Wu, G.; Yang, J.; Zhang, Z. Mesozoic deformations of the Dabashan in the southern Qinling orogen, central China. J. Asian Earth Sci. 2012, 47, 171–184. [Google Scholar] [CrossRef]
  97. Shi, W.; Zhang, Y.; Dong, S.; Hu, J.; Wiesinger, M.; Ratschbacher, L.; Jonckheere, R.; Li, J.; Tian, M.; Chen, H. Intra-continental Dabashan orocline, southwestern Qinling, central China. J. Asian Earth Sci. 2012, 46, 20–38. [Google Scholar] [CrossRef]
  98. Yan, D.P.; Zhou, M.F.; Song, H.L.; Wang, X.W.; Malpas, J. Origin and tectonic significance of a Mesozoic multi-layer over-thrust system within the Yangtze Block (South China). Tectonophysics 2003, 361, 239–254. [Google Scholar] [CrossRef]
Figure 2. (a) Geological map and (b–c) transverse profile of the Longshan Dome (modified from [22]). The dome flank is divisable into four parts, eastern, southern, western and northern, for the convenience of this study. Equal-area, lower hemisphere projection (d–o) of beddings, slickenlines on bedding-parallel faults, and cleavages measured in the Upper Paleozoic and Triassic in each part. Each slickenline is represented by a slickenline-parallel short line at the bedding pole, with or without a directed arrow toward the relative slip movement of the overlying bed. Shown in (a) are locations of limestone samples collected in this study.
Geosciences 11 00456 g002
Figure 3. Field photographs of secondary deformation structures in the flanks of the Longshan Dome. (a) slaty cleavages within Middle Devonian marls and (b) slaty cleavages within Upper Devonian mudstone on the western flank, north of Cunshi village; (c) secondary folds of calcite veins subparallel to the bedding within Middle Devonian on the western flank, northeast of Cunshi village; (d) two sets of slickenlines, dip-parallel and strike-parallel, on a certain bedding-parallel fault within Middle Devonian marls at the location of sample H34, the former set turns gradually into the latter set; (e) spaced cleavages and bedding-perpendicular stylolites within Upper Devonian limestone on the northern flank, near Baima village; (f) two principal sets of calcite veins and (g) lenticular calcite veins cut through or abut by short stylolites within gently-dipping, Lower Carboniferous limestone on the southern flank, near Hetianpu village.
Geosciences 11 00456 g003
Figure 4. Variation of the maximum stress difference (MSD) between the imposed and estimated stresses with the rotation angle in the case of rotation around (ac) σ1, (df) σ2, and (gi) σ3, respectively. Both the primary method and the improved method are applied to a series of artificial two-phase e-twin datasets having 20, 40 or 60 twinned calcite crystals (NC).
Geosciences 11 00456 g004
Figure 5. Variation of the maximum relative error of the maximum differential stress (MREMDS) with rotation angle in the case of rotation around (ac) σ1, (df) σ2, and (gi) σ3, respectively.
Geosciences 11 00456 g005
Figure 6. The MSD vs. the MREMDS for NC = 60 in the case of rotation around (a) σ1, (b) σ2, and (c) σ3, respectively.
Geosciences 11 00456 g006
Figure 7. Microphotographs of calcite e-twins of limestone samples H20 (a), H36 (bc), and H34 (d) in crossed polars. Often thin twins either crosscut thick twins or stop at them. Rarely thin twins are strictly confined to thick twins, e.g. at yellow arrows in (c).
Geosciences 11 00456 g007
Figure 8. Lower-hemisphere, equal-area projections of calcite c-axes, twinned and untwinned e-planes for (ac) thick twins and (df) thin twins from sample H36. Each twinned or untwinned e-plane is symbolized by a short line at the pole to the e-plane, with an arrow directed toward the gliding or potentially gliding direction.
Geosciences 11 00456 g008
Figure 9. Paleostress results obtained by applying the improved version of Shan et al.’s [30] inversion method to the measured datasets in this study.
Geosciences 11 00456 g009
Figure 10. Lower-hemisphere, equal-area projection of the maximum principal stress axes of each compression subset (ab) and the minimum principal stress axes of the extension subset (c). For each subset, the mean direction and angular dispersion of these axes are displayed as a plus symbol and a small circle centered at it.
Geosciences 11 00456 g010
Figure 11. The range and mean value of the corrected (see [67]) maximum differential stresses (MDS) of each subset.
Geosciences 11 00456 g011
Figure 12. Buried depths vs. the corrected MDSs for (a) the LPS1 subset and (b) the LPS2 subset.
Geosciences 11 00456 g012
Figure 13. The ratio of stress estimates for thick and thin twins to samples for a certain stress subset.
Geosciences 11 00456 g013
Figure 14. Three-stage scenario of Mesozoic structural deformation in the study area.
Geosciences 11 00456 g014
Table 1. A list of limestone samples collected from the Longshan dome.
SampleLatitudeLongitudeRock AgeBedding Strike, dip (°)Calcite Twinned Crystals
Num.Mean Size, st. dev. (μm)
H2027°33′42′′ N111°48′21′′ EMiddle Devonian153, 48 NE127390, 120
H2427°41′58′′ N111°52′27′′ ELate Carboniferous35, 27 NW102670, 220
H2727°29′34′′ N111°52′39′′ EEarly Carboniferous45, 16 NW156380, 130
H2827°19′35′′ N111°46′07′′ ELate Carboniferous15, 34 E118480, 150
H3027°20′40′′ N111°38′46′′ EMiddle Devonian110, 25 SW127530, 180
H3127°22′00′′ N111°34′36′′ EEarly Carboniferous171, 36 W124400, 130
H3227°28′39′′ N111°37′00′′ EMiddle Devonian41, 47 NW149390, 110
H3427°30′09′′ N111°36′44′′ EEarly Carboniferous28, 45 SE129310, 160
H3627°25′08′′ N111°50′41′′ EMiddle Devonian26, 17 NW117410, 240
J9027°39′35′′ N111°44′32′′ ELate Carboniferous130, 64 NE81390, 180
Table 2. Stress results by applying the improved version of Shan et al.’s (2019) method to calcite thick-twin datasets measured for samples from the Longshan Dome. σ1, σ2, and σ3 represent the orientations (bearings and plunges) or magnitudes of the maximum, intermediate, and minimum principal stresses. Their orientations in the untilted state are bracketed. K is the phase number. Ts and UTs are twinned e-planes and untwinned e-planes. The stress ratio, Φ, is defined as (σ2σ3)/(σ1σ2). MDS is the maximum differential stress, σ1σ3. NSI is the number of incompatible (twinned and untwinned) e-planes to all stresses.
SamplesTs/UTsKPrincipal Stress Axes (°)ΦMDS (MPa)Comp. Ts/UTsNSI
σ1σ2σ3
H20112/1543167/10 (155/17)263/30 (302/70)061/58 (062/10)0.625059/910
082/47 (076/00)336/15 (346/08)233/40 (168/82)0.56047/122
027/25 (209/16)290/15 (314/41)172/61 (104/45)0.614064/112
H24102/1363331/12 (151/12)239/09 (060/02)113/75 (321/78)0.110057/1013
012/08 (191/03)104/16 (098/40)256/73 (285/50)0.39053/110
292/70 (299/43)132/19 (134/46)040/06 (036/08)0.58033/100
H27153/2264294/31 (296/16)201/06 (203/12)101/59 (077/70)0.5170113/1440
109/08 (108/22)017/22 (012/13)218/67 (253/64)0.57049/187
276/63 (289/50)114/26 (109/40)020/07 (019/00)0.612074/155
160/03 (161/18)251/06 (071/02)040/84 (336/72)0.728089/157
H2893/1232273/08 (270/42)182/08 (000/01)051/79 (091/49)0.210041/991
109/79 (106/45)358/04 (003/13)267/10 (261/42)0.323052/79
H30115/1373083/39 (105/46)175/03 (354/19)269/51 (248/38)0.714061/910
277/32 (264/23)029/31 (034/56)153/42 (164/23)0.37032/114
218/30 (216/06)117/20 (124/15)358/53 (326/74)0.79051/94
H31110/1583316/06 (139/14)226/01 (041/28)128/84 (252/58)0.26046/1410
178/12 (184/05)275/29 (093/06)068/59 (314/82)0.813058/112
307/85 (267/50)091/04 (094/40)181/03 (001/03)0.528055/99
H32138/1843004/55 (340/18)257/12 (075/17)160/32 (205/65)0.512049/1230
129/17 (127/64)231/35 (254/16)018/50 (350/20)0.27068/141
119/70 (319/62)300/20 (120/26)210/00 (214/08)0.312092/111
H34104/1532089/49 (099/08)196/15 (190/03)298/37 (298/82)0.452083/880
303/24 (311/69)191/41 (168/17)055/40 (074/12)0.86025/117
H36120/1312022/64 (352/58)217/26 (224/21)124/06 (125/23)0.723057/710
144/09 (146/24)239/29 (245/19)038/59 (010/58)0.116066/93
J9048/552249/47 (001/59)355/14 (167/30)096/40 (260/06)0.214026/400
143/09 (127/15)045/42 (224/22)242/47 (005/63)0.813022/38
Table 3. Stress results by applying the improved version of Shan et al.’s (2019) method to calcite thin-twin datasets measured for samples from the Longshan Dome. σ1, σ2, and σ3 represent the orientations (bearings and plunges) or magnitudes of the maximum, intermediate, and minimum principal stresses. Their orientations in the untilted state are bracketed. K is the phase number. Ts and UTs are twinned e-planes and untwinned e-planes. The stress ratio, Φ, is defined as (σ2σ3)/(σ1σ2). MDS is the maximum differential stress, σ1σ3. NSI is the number of incompatible (twinned and untwinned) e-planes to all stresses.
SamplesTs/UTsKPrincipal Stress Axes (°)ΦMDS (MPa)Comp. Ts/UTsNSI
σ1σ2σ3
H2096/1203124/00 (313/21)214/29 (173/63)034/61 (049/16)0.511038/790
018/48 (034/09)274/12 (294/49)174/40 (131/39)0.212045/94
095/58 (080/14)213/16 (189/54)312/27 (341/33)0.415041/82
H2457/723049/10 (043/15)143/23 (150/49)298/65 (301/38)0.414030/470
222/68 (266/53)039/22 (028/22)129/01 (130/28)0.620024/51
143/13 (147/38)260/64 (281/41)047/23 (035/25)0.39025/56
H2765/1023209/23 (217/26)119/02 (118/17)025/67 (359/58)0.67034/710
220/76 (271/70)024/14 (021/07)114/04 (113/19)0.39027/89
102/45 (089/58)314/40 (314/24)210/17 (215/20)0.49023/83
H28102/1193208/64 (150/53)302/02 (306/34)033/26 (044/12)0.410038/900
143/08 (326/19)050/25 (057/03)249/64 (156/71)0.616054/80
076/46 (084/15)216/37 (188/41)322/21 (339/45)0.514058/78
H3081/1142041/03 (044/26)136/60 (161/44)310/30 (294/35)0.415038/723
295/10 (290/11)080/78 (170/69)204/07 (024/18)0.414044/83
H3171/792112/06 (121/36)021/08 (011/24)239/79 (256/44)0.421033/470
239/77 (255/42)024/11 (012/28)115/07 (125/36)0.237041/55
H3299/1353348/17 (169/21)258/01 (068/25)166/73 (294/56)0.222035/1000
229/33 (251/17)107/39 (046/71)345/34 (159/08)0.512051/90
209/82 (300/44)037/08 (032/03)307/01 (125/46)0.513051/94
H3467/1023355/14 (014/33)086/01 (257/36)180/76 (134/37)0.717032/760
179/31 (166/04)271/04 (260/43)007/59 (072/47)0.111637/80
077/55 (095/16)275/34 (231/69)179/09 (001/14)0.46118/83
H3689/963008/63 (343/54)165/25 (174/36)260/09 (080/05)0.714039/630
183/67 (226/68)086/03 (085/18)355/23 (351/13)0.815043/59
205/06 (207/06)115/01 (115/18)012/84 (314/71)0.214037/63
J9097/863064/57 (233/04)324/06 (142/10)230/32 (345/79)0.710039/590
238/22 (299/74)330/07 (146/15)078/67 (054/07)0.721046/53
349/67 (027/15)245/06 (224/22)153/23 (005/63)0.510044/64
Publisher’s Note: MDPI stays neutral with regard to jurisdictional claims in published maps and institutional affiliations.

