
Behavior of Shallow Circular Tunnels—Impact of the Soil Spatial Variability


1
Laboratory InfraRES, Mohammed Cherif Messaadia University, Souk-Ahras 41000, Algeria
2
Laboratory 3SR, Grenoble Alpes University, 38000 Grenoble, France
3
School of Automotive and Transportation Engineering, Hefei University of Technology, Hefei 230000, China
*
Author to whom correspondence should be addressed.
Geosciences 2022, 12(2), 97; https://doi.org/10.3390/geosciences12020097
Submission received: 4 December 2021
/
Revised: 25 January 2022
/
Accepted: 16 February 2022
/
Published: 21 February 2022
(This article belongs to the Collection New Advances in Geotechnical Engineering)
Abstract
:Spatial variability is unavoidable for soils and it is important to consider such a feature in the design of geotechnical engineering as it may lead to some structure behaviors which cannot be predicted by a calculation assuming homogenous soils. This paper attempts to evaluate the performance of a shallow circular tunnel, in a context of the service limit state, considering the soil spatial variability. The Log-normal distributed random fields, generated by the Karhunen–Loeve expansion method, are used for the spatial modeling. A two-dimensional numerical model, based on the finite difference method, is constructed to deterministically estimate two quantities of interest (i.e., tunnel lining bending moment and surface settlement). The model is combined with the random fields and is implemented into the Monte Carlo simulation to investigate the effects of the soil spatial variability on the tunnel responses. The autocorrelation distance, an important parameter for random fields, is varied within multiple probabilistic analyses. For both of the two tunnel responses, their variabilities are increased with increasing the autocorrelation distance, while a minimum mean value can be observed with this parameter being approximately the tunnel radius. Such finding is very useful for practical designs. A sensitivity analysis is also conducted to show the importance of each random parameter.
1. Introduction
In recent years, many efforts have been devoted to investigating the probabilistic analysis of geotechnical structures. Using random variables, uncertain parameters were modeled based on simplified methods in which the soil is considered as a uniform material. However, in nature, soil parameters vary spatially in both the horizontal and vertical directions due to the gravity deposition and post-deposition processes. The behavior of geotechnical structures (foundations, tunnel, and slope stability) will then be affected by the spatial variability. Therefore, the soil parameters should be defined by random fields. In the literature, the probabilistic approaches were proposed. Due to the complexity of the geotechnical structures, deterministic models based on numerical methods (finite difference method (FDM) or finite element method (FEM)) are often developed. For the determination of the failure probability, the random field discretization should be converted into a number of random variables. Then, the obtained spatially variable values have to be implemented in the mesh discretization of a numerical model (deterministic model). In the literature, several methods for generating random fields are available such as the expansion optimal linear estimation (EOLE) and the Karhunen–Loeve (K-L) expansions. Several authors studied the spatial soil variability effects on the behavior of geotechnical structures by the use of these methods [1,2,3,4,5,6,7,8,9,10,11,12,13,14,15,16].
In recent years, several attempts were made to investigate the random variability effect of soil parameters on tunnel’s behavior. The tunneling phenomenon is a three-dimensional (3D) problem. However, during the design phase, two-dimensional (2D) calculations based on the stress release process remain the most commonly used approaches due to their low computational cost.
The approach of random variables was mainly used in the existing studies. Reference [17] studied the reliability of a tunnel for its face stability issue, by using random variables for soil variability modeling, with the classical reliability methods, such as the first-order reliability method (FORM), the first-order second-moment (FOSM) [18], the response surface method (RSM) [19], and the collocation-based stochastic response surface methodology (CSRSM) [17]. References [20,21] used the surface response methodology optimized by a genetic algorithm to study the reliability of shallow circular tunnels in homogeneous soils. Some works are based on the random field theory for tunnel reliability analysis. References [22,23] studied the spatial variability effects of the soil friction angle on the tunnel face stability, using a 2D failure mechanism based on the limit analysis theorem combined with the Monte Carlo simulations (MCS). Reference [10] evaluated the failure probability of a tunnel face in spatially variable soils by adopting the sparse polynomial chaos expansion-based MCS. Reference [24] studied the spatial variability influence of the soil Young’s modulus on the tunnel convergence using a linear elastic constitutive model with isotropic stratified random fields. Reference [25] studied the spatial variability effect of the soil Young’s modulus using a linear elastic constitutive model for the soil movements analysis caused by tunneling. Other researchers have investigated the tunnel lining bending moment reliability using the hyperstatic reaction method (HRM). Reference [26] calculated the reliability index using the FORM method with RSM. Homogeneous soils were simulated using random variables. In their analyses, they proposed five individual failure modes considering lining forces. Reference [12] followed this study and adopted the limit state functions proposed by [26] to consider the soil spatial variability. All the above-mentioned works clarified the effect of the soil uncertainties on the movements due to the tunneling. In the case of random variables, a significant underestimation of the heterogeneity of the soil was noted. Therefore, the simulation of soil properties with its spatial variation is essential to extend the currently existing probabilistic analyses of tunnels.
The proposed study consists in investigating the soil spatial variability effects on the tunnel design regarding two quantities of interest (surface settlements and lining bending moments) by considering a nonlinear constitutive model for the soil. Most of the previous studies considered the spatial variability of only one soil parameter and a classical constitutive model (linear elastic perfectly plastic) was commonly used.
A probabilistic analysis of a circular tunnel is presented in this article. Non-Gaussian anisotropic random fields are used for modeling the soil spatial variability. The discretization of the random fields is realized with the Karhunen–Loeve expansion (K-L). The system response is considered using the tunnel lining bending moment and the settlement. Deterministic models are implemented using two-dimensional finite differences numerical models (FLAC2D). Reference [27] showed the limitation of simple constitutive models (non-reliable settlement values) like the linear elastic perfectly plastic model (Mohr Coulomb shear failure criteria). It is why in this work, a nonlinear elastic model with a cap-yield hardening (CYsoil) is adopted to simulate a clayey sand behavior. The convergence-confinement method (CCM) is used to simulate the ground-support interaction analysis. The probability density function (PDF) of the tunnel response is determined by using the MCS. Another aim of this study is to investigate the effects of the autocorrelation distance and coefficient of variation on the tunnel lining bending moment and on the surface settlements.
2. Random Fields and Discretization
An autocorrelation function and a distribution law are used to define the random fields. The generated random fields are two-dimensional and follow a log-normal distribution (transformed from standard-normal distribution) in this work. The mean and standard deviation of the field (Z) are respectively named μZ, σZ, and then the mean (μln) and the standard deviation (σln) of the lognormal field Z are given by
Among the available methods, the Karhunen–Loeve expansion (K-L) [28,29] and the Cholesky decomposition [30,31] are often used to randomly generate spatially correlated values. In this study, the K-L expansion was used.
The Karhunen–Loeve (K-L) series expansion method presented by [32] is used to express random fields through truncated series using a number (M) of terms [33,34]. Then the random field expression is divided into a part defined by a representation of the mean , and a random element depending on φi eigenvalues and functions λi of the corresponding covariance function
With θ is a series of standard normal random variable, ξi(θ) represents the ith realization and X is the vector coordinates where the Z values are to be generated.
The main advantage is that this method allows the decoupling of stochastic and spatial variables (X and θ, respectively). The solutions of Equation (4) are the eigenfunctions and eigenvalues (respectively λi and φi) of the covariance function C (X1, X2)
For some autocorrelation function types, this integral can be resolved analytically. Reference [32] gave an analytical solution for the exponential autocorrelation function which is adopted in this study. Through the random variables ξi the stochastic dependence appears. The spatial correlation is defined by the eigenmodes (λi and ϕi) of the covariance kernel (Equation (4)).
The correlation length L and the variance σ2 of the Gaussian random field are introduced by the covariance function expression and presented in Equation (5). The covariance function contains all the terms C12 of the covariance matrix between node 1 (position X1) and node 2 (position X2) of the spatial mesh.
In this paper, two spatial directions are distinguished by two correlation lengths (horizontal and vertical). When a two-dimensional field is considered, the covariance function is given as
The covariance between node 1 and 2 is given by Equation (6), for which the coordinates of node i are (xi, yi). The autocorrelation distances in the horizontal and vertical directions are respectively Llnx and Llny.
The number of terms M depends on the targeted accuracy as shown in the following equation which allows commutating the error of a K-L random field due to truncation [35].
To meet certain conditions, the mesh should be discredited according to the deformation’s location (fine mesh in the areas close to the tunnel). A transfer of the stochastic data towards the mesh is then necessary. To this end, two transfer methods exist:
- -
- -
The local average method tends to under-represent the true field variability, while the middle method over-represents the field variability [36]. A comparative study between these two methods was conducted by [41]; they found that the middle method is better suited to non-Gaussian random fields because it retains the initial field probability distribution. The middle method is thus used in this study since the soil properties are represented by non-Gaussian random fields.
3. Numerical Modeling
3.1. Geometry and Parameters
The Italian Bologna-Florence high-speed rail tunnel project is considered as the reference case in this study. The project focuses on the excavation of a tunnel in Bologna. The tunnel has an external excavation diameter of 9.4 m and an internal diameter of 8.3 m, for a useful area of 46 m2.
The tunnel was excavated at 20 m deep in clayey sand. Table 1 summarizes the main parameters adopted in this study [42,43]. The numerical simulations are done using the finite difference program FLAC2D [44]. The cap-yield (CYsoil) constitutive model is adopted to govern the soil behavior. The CYsoil model allows to consider the nonlinear behavior and to represent the loading/unloading response of soils. It includes frictional strain-hardening and softening shear behavior, an elliptic volumetric cap with strain-hardening behavior, and an elastic modulus function of plastic volumetric strain [45].
The Young’s module, in the CYsoil model, is calculated according to the effective confinement and leads to a higher unload-reload modulus.
which is the elastic tangent shear modulus at the reference effective pressure (equal to 100 kPa),
the elastic tangent bulk modulus at the reference effective pressure (equal to 100 kPa),
- Rf: the failure rate which is constant and lower than 1,
- φf: the ultimate friction angle,
- β: a calibration factor,
- m: a constant (m < 1).
The parameters given by [42] were adopted due to the lack of experimental data from the excavated soil. These parameters are for the well-known constitutive model: linear elastic perfectly plastic model using Mohr Coulomb criterion.
For other parameters that are necessary for the CYsoil model, they were obtained by calibrating with three numerical triaxial tests. The confinement stresses (σ3) of 100 kPa, 170 kPa, and 250 kPa were chosen to take into account the stress level at which the tunnel is excavated. The results of the calibration are showed in Table 1. The stress–strain curves obtained for the different values of σ3 are illustrated in Figure 1. To calibrate the initial modulus value (Table 1), the confining pressure σ3 equaling to 170 kPa in the center of the tunnel (20 m deep) has been chosen.
Precast reinforced concrete segments are used as lining elements for the tunnel. Each precast concrete ring is 0.4 m thick and 1.5 m long and has a diameter of 9.1 m. The behavior of the tunnel structure is assumed to be linear elastic (no joints are considered between the segments in the numerical modeling). The employed lining parameters, based on [42,43], are summarized in Table 2.
The two-dimensional numerical model implemented to simulate the tunnel excavation is shown in Figure 2. Quadrangular elements with four nodes of discretization are used for the mesh [44]. The elements size increases as one moves away from the tunnel. The numerical model has a width of 240 m in the x-direction and a depth of 60 m in the y-direction. It consists of approximately 7500 elements. The nodes are blocked in all directions at the model base while a horizontal fixation of the nodes on the two vertical limits is considered.
To consider the three-dimensional effect due to the tunnel excavation, the convergence-confinement method (CCM) is used. This method has already been carried out by other authors [20,21,27,43]. Their works underlined that, for certain geotechnical conditions and construction process, after having estimated the stress relaxation ratio, the CCM method is one of the better methods to correctly simulate the surface settlements. The stress relaxation ratio is generally specified on the basis of a feedback analysis that uses the monitoring data obtained on the tunneling process.
A three-phase process was used to simulate the tunnel excavation and setting up of the lining as follows:
- Phase 0: Initial state of stress (σ0). Considering the gravity effect and the coefficient at rest, the initial state of stresses is calculated.
- Phase 1: Stress release phase. The excavated soil inside the tunnel is deactivated and a radial pressure to the tunnel wall is applied. The value of this pressure is done by using Equation (10). This pressure is not constant over the circumference of the tunnel and depends on the initial stresses state (Figure 3).where λd: the stress relaxation ratio; σ0: the initial soil stresses (kN/m2); σ: the applied radial pressure (kN/m2). A gradual reduction of this radial pressure is applied to the excavation circumference until its value reaches the specified stress relaxation λd. In this study, the coefficient λd is taken equal to 0.65. This value was obtained by a previous analysis in 3D calculations by [43].σ = (1 − λd) σ0
- Phase 2: Installation of the tunnel lining. The lining is activated around the tunnel wall considering its total relaxation (λd = 1).
3.2. Deterministic and Sensitivity Analysis Results
Figure 4 illustrates the vertical movements at the ground surface from a deterministic analysis. At the tunnel center, the settlement values increase, with a maximum value located above the tunnel center, due to the conditions of symmetry. Then, far from the center of the tunnel, the settlement decreases.
The structural lining forces in terms of bending moments are shown in Figure 5. In the studied case, the maximum bending moment occurs at the bottom of the tunnel.
To assess the influence of the input parameters on the tunnel behavior, a parametric study was carried out. The maximum lining bending moment and the maximum surface settlement respectively called Mmax and Smax are the output parameter considered. These two model responses are considered as they are often used in the tunnel design of real projects.
Using Equations (8) and (9), E and υ can be deduced from . and and are used in the following work.
In order to evaluate the input parameters’ influence on the system behavior, the values of the two output parameters (Mmax and Smax) are deduced by using numerical calculations for the reference case. The obtained values are: Sref = 12.44 mm and Mref = 30.18 kN·m. Then, numerical calculations were done to study the influence of each input parameter in a given range defined by its minimum and maximum values (Table 3). When studying the influence of a parameter, the other parameters are kept at their reference value. The results of this parametric study are shown in Figure 6; Figure 7. The soil parameters which have the main influence on Smax are the soil unit weight, Young’s modulus, and Poisson’s ratio. For the Mmax, only the Poisson’s ratio and Young’s modulus have significant impacts. It is noted that the calibration parameters (effective reference pressure pref, calibration factor β, and failure rate Rf) are remained constant in the parametric studies.
According to the parametric study of the input soil parameters, the parameters to be modelled by random fields for the following probabilistic analyses are the soil unit weight, Young’s modulus, and the Poisson’s ratio.
The proposed study focuses on the spatial variability of the soil parameters (E, ν, and γ). The corresponding random field follows a log-normal distribution, where only positive values for the soil parameters (E, ν, and γ) can be generated. The mean and the standard deviation are respectively noted μln and σln. An exponential autocorrelation function allows representing the correlation between two distinct points of the soil mass.
Each random field of the soil parameters (E, ν, and γ) is implemented in the constructed numerical model using MATLAB. A two-dimensional field represents the whole soil mass and is discretized in Nx × Ny elements, where Nx and Ny are the elements number in respectively the directions x and y. For each soil element, a value of soil parameters (E, ν and γ) is given. Using the Karhunen–Loeve (K-L) series expansion method, developed by [32], each element is assumed to be homogeneous and is affected by a single value of the soil parameters at its centered. In other words, according to the distribution law and the selected autocorrelation function, a given soil configuration is generated for each random field realization. The values of the soil parameters (E, ν and γ) assigned to the center of each elements is done according to its position in space. The middle method [41] is used to assign the values of the random field at the gravity center of each element on the finite difference mesh.
Finally, to reduce the computation time, a link between the MATLAB and FLAC2D was created with an automatic data exchange in both directions.
The lognormal distribution defines the spatial variability of the soil parameters (E, ν and γ). The following parameters were considered: μE = 150 MPa, COVE = 15% [18,19,46], μν = 0.3, COVν = 5% [46], μγ = 17 kN/m3, and COVγ = 10% [47,48] with an autocorrelation distance equaling to 1.0 m in both directions and a second-order exponential autocorrelation function. Figure 8 shows a random field for the tangent bulk modulus.
4. Probabilistic Analysis Using the Monte Carlo Simulations
4.1. Selection of the Optimal Number of Monte Carlo Simulations
The effect of the soil spatial variability on the surface maximum settlement and the liner maximum moment is evaluated using the MCS for several combinations of autocorrelation distances in both directions (x and y). For each studied combination, MCS requires the generation of a large number of samples. Each one is represented by a random field realization. The maximum settlement (Smax) and the liner maximum tunnel lining moment (Mmax) are then calculated for each of these realizations. The means (μSmax, μMmax) and the standard deviations (σSmax and σMmax) of all the values for the two quantities of interest are then compared. The required number N of simulations is determined by regarding the convergence of the two statistical moments. Figure 9 illustrates both the variations of the calculated means and of the COV with respect to the simulation number N. It is observed from Figure 9 that the variation of the means and of the COV is <2% when N is higher than 800. Consequently, convergent solutions of these two statistics can be obtained roughly at 800 simulations. Thus, N = 800 is adopted for the following MCS-based probabilistic analysis. It should be noted that N = 800 is only sufficient for the analysis of the mean and the COV of the behavior of the tunnel in this study. It may not be sufficient to estimate low probabilities of failure when the strain limit is strict in tunnel engineering.
4.2. Influence of Isotropic and Anisotropic Random Fields on Smax and Mmax
The aim of this section is to study the effect of the different probabilistic governing parameters (autocorrelation distances) of the random fields on the PDF of Smax and Mmax.
Several combinations of the autocorrelation distances (L) in the two directions were used to study the effect of the soil spatial variability on the maximum surface settlement and the lining maximum bending moment. In fact, when a small autocorrelation length is considered, the random field values of the soil parameter are strongly correlated and quickly change its value from one point to another in the concerned direction. However, when the autocorrelation distance is large, the values change slowly and tend to be homogeneous.
In this work, input soil parameters are presented by isotropic and anisotropic random fields according to a lognormal distribution law considering a variation of the autocorrelation distance in both directions (x and y). The mean and the variation coefficient of the soil input parameter (γ, E, ν) adopted equal to 17 kN/m3; 150 MPa; 0.3 and 10%; 15%; 5% respectively. Some examples of the generated random fields for Young’s modulus E considering different autocorrelation distances are shown in Figure 10. The lightest regions correspond to larger values and the darkest regions to small values of Young’s modulus where the values of Young’s modulus vary between 143 MPa and 162 MPa.
In the next analyses, isotropic and anisotropic random fields are both considered with the following combinations:
Case 1D: Lx and Ly are different (anisotropic random fields).
In this case and for large autocorrelation distances, the ground presents stratification. The stratified layers are parallel to the direction of the greatest autocorrelation distance.
Case 2D: Lx and Ly are the same (isotropic random fields).
This case presents a variation of the input soil parameters from one point to another (heterogeneous soils). Several cases of autocorrelation distances (L) are considered in this study using L = 1, 5, 10, 50, 100, and 150 m.
For all the cases considered, the first two statistical moments of the maximum surface settlement and the maximum bending moment of the liner are calculated for 800 realizations of the random field. The results are then compared and evaluated.
Figure 11 provides the PDF of Smax and Mmax for different cases of isotropic random fields (Lx = Ly = 1, 5, 10, 50, 100, and 150 m). Figure 11 shows that the PDF is less spread out when the autocorrelation distance decreases. On the other hand, for large values of the autocorrelation distance, the standard deviation tends towards a maximum value.
4.3. Soil Spatial Variability Effect on the Average of Smax and Mmax
The variation of the mean of Smax and Mmax as a function of autocorrelation distance for different types of anisotropic random fields is shown in Figure 12.
The same shape for all curves is observed. With the increase of the autocorrelation distance, the mean of Smax and Mmax decreases to a minimum at an autocorrelation length equaling to a half of the tunnel diameter, and then increases. For this autocorrelation distance, the ground around the tunnel is less stable (indicated by its minimum). Similar results for shallow foundations were observed by [6]. This can be explained as follows:
For small autocorrelation distances, the variability of the soil is very high and this results in a mixture of large and small values of the soil input parameters (E, ν, and γ). This gives a Smax and Mmax close to the deterministic value.
The movement of the ground is more important in the zones where E and ν are weak and γ large. For intermediate autocorrelation distances (e.g., length L ≈ tunnel diameter/2), agglomerates of strong and weak zones are created. Their distribution within the tunnel excavation zone varies from one construction to another.
For greater autocorrelation distances: For the case of a single direction, the columns and the layers of soil alternately form large and small values of E, ν, and γ. A stabilizing barrier for the movements of the ground is constituted by the zones of the ground with a high E, ν, and γ value. It induces a small value of Smax and Mmax and a more stable structure. As for cases with very high autocorrelation distances (e.g., Lx = Ly = 150 m), the soil is close to be homogeneous. In this case, Smax and Mmax have a difference of 24.67% and 18.09% respectively compared to the deterministic results.
In the cases where the vertical direction of the spatial variability is considered, the values are lower than those obtained for the case in the horizontal direction and close to the deterministic model. This is due to the fact that the variation of the soil input parameters (E, ν, and γ) along the vertical axis leads to a vertical “pounded layer” soil, which prevents their subsidence and also makes this case different with the other cases (two directions and horizontal direction).
Finally, for the 2D case (Lx = Ly), the values of Smax and Mmax are higher than that of the vertical direction case and lower than that of the horizontal direction. As explained above, this is due to the introduction of vertical variability which reduces the deformations of the ground around the tunnel. On the other hand, the direction of the two-dimensional autocorrelation reveals higher values compared to the vertical 1D direction.
The observation of the effect of the direction of spatial variability on Smax and Mmax reveals that considering the same variation of input parameters in both directions leads to a less stable tunnel. However, taking into account the spatial variability in the vertical and/or longitudinal directions improves the settlement of the surface and the lining maximum moment and therefore a smaller value Smax and Mmax are necessary to avoid failure of the structure.
4.4. Effect of the Soil Spatial Variability on the Variance of Smax and Mmax
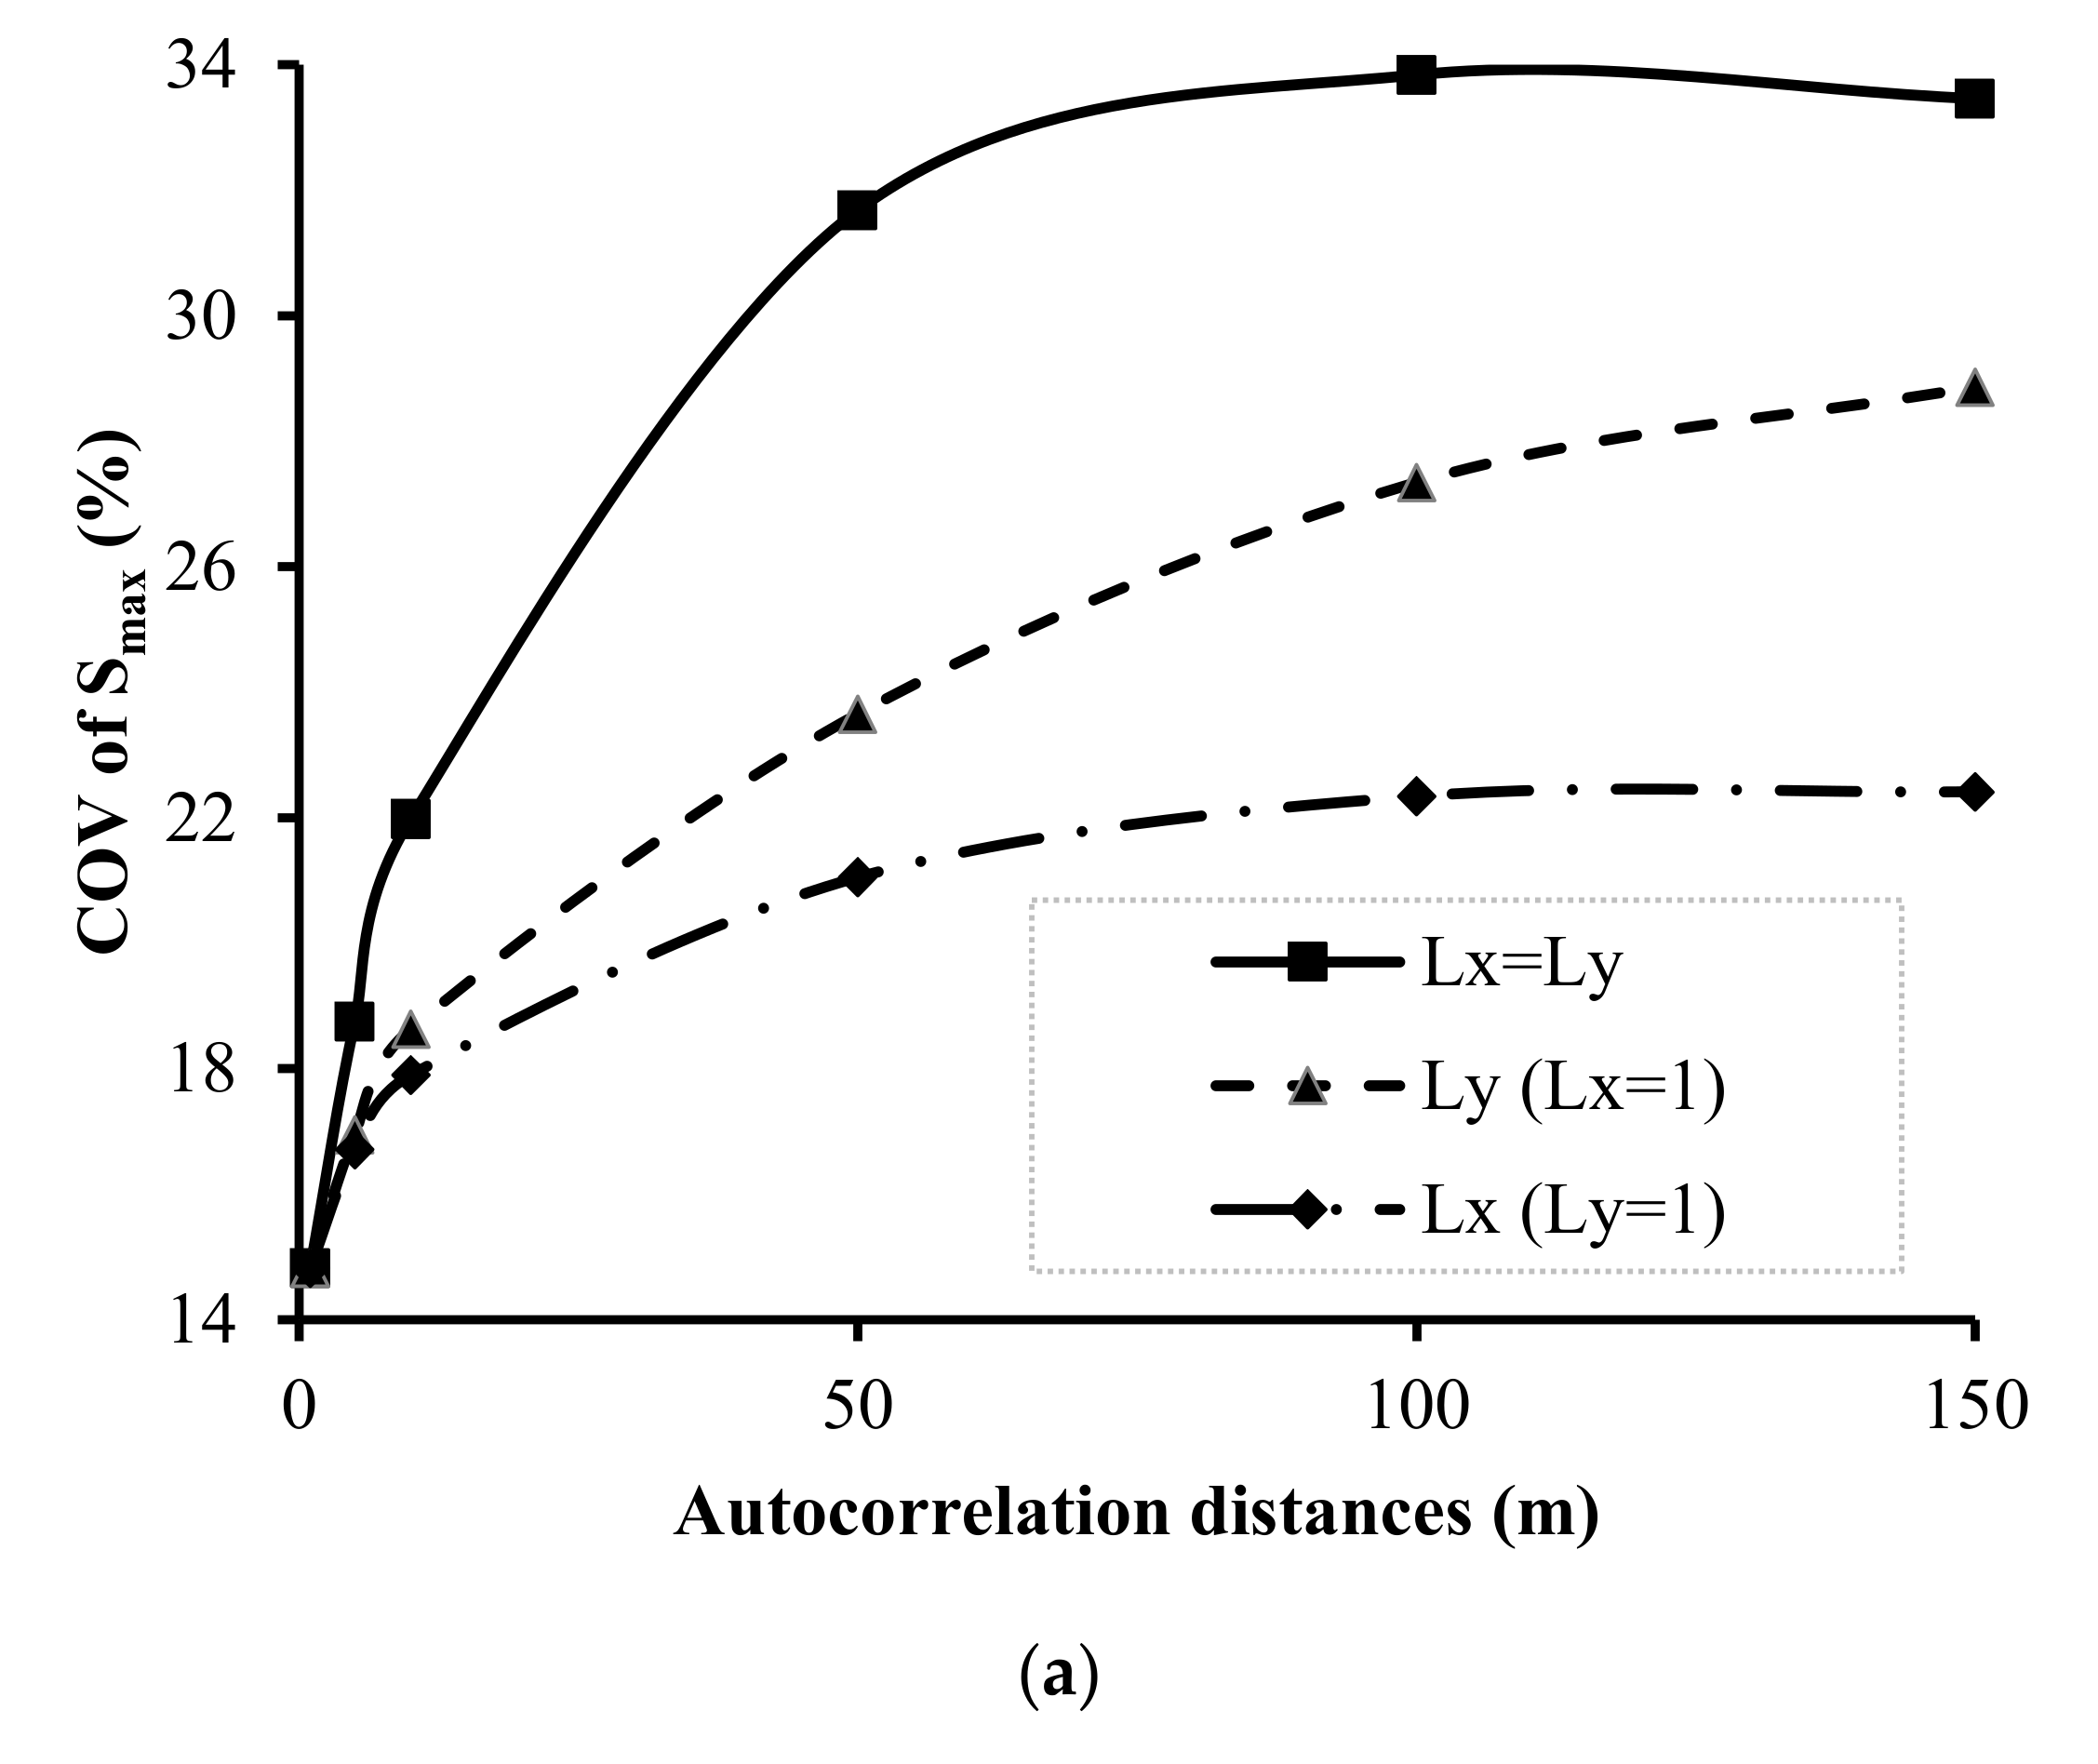
Figure 13 shows that the variance of Smax and Mmax depends on the autocorrelation distance. All the curves have the same trend regardless of the variability considered. With increasing autocorrelation distance, the variance increases.
Indeed, the values of the input parameters of the ground generated are very heterogeneous. For small autocorrelation distances, a mix of small and large values is considered. It leads to an ‘average’ of the values soil properties. The resulting Smax and Mmax are more homogeneous. The values of the soil input parameters, although more homogeneous within the same soil mass. For greater autocorrelation distances, more dispersed values of Smax and Mmax are obtained.
Figure 12 shows that the smallest variation of Smax and Mmax is observed for the case 1D along axis X and it is followed by the cases 1D along the axis Y. The greatest variation is obtained for the case 2D and this can be explained as follows:
For very large autocorrelation distances (Lx = Ly = 150 m), the variance of Smax and Mmax tends towards a maximum constant value. Indeed, the values of soil input parameters (E, ν, and γ) are strongly or almost perfectly correlated, thus generating a homogeneous soil mass in one realization. However, according to the statistical and theoretical distribution adopted, different values of the soil input parameters (E, ν, and γ) are generated for different realizations. A large variation in the values of the soil input parameters (E, ν, and γ) presents the mass of the soil, which has a direct effect on the response of the system. (i.e., Smax and Mmax) so leading to higher variability in these two quantities of interest.
The cases considering a spatial variability in one direction (case 1D), have a lower variability Smax and Mmax than the 2D case, that is to say, Lx = Ly = 150 m. Indeed, by introducing a variation of the soil input parameter (E, ν, and γ) in a given direction, all the Smax and Mmax values opposite will tend to increase, thus excluding the low values of Smax and Mmax. Consequently, the variability of Smax and Mmax will decrease compared to the case of a homogeneous soil mass.
5. Conclusions
The soil spatial variability effects on the behavior of a shallow circular tunnel are investigated in this article within the framework of the service limit state. Deterministic models are constructed by two-dimensional finite differences numerical methods. The soil properties are represented by non-normal isotropic and anisotropic random fields. The random fields are discretized using the Karhunen–Loeve (K-L) expansion method. The tunnel response variability is then obtained by using the MCS. The main results of this paper are as follows:
The main input parameters that have a significant effect on the lining bending moments are the soil elastic parameters, for the settlements, mainly the elastic parameters and the soil unit weight have a significant effect.
Numerical results have shown that the variability of Smax and Mmax increases when the random fields autocorrelation distance increases.
Whatever the scenario studied, for an intermediate value of the autocorrelation distance (approximately the tunnel diameter divided by two), a minimum probabilistic mean is reached. For this autocorrelation distance, the ground around the tunnel is less stable.
An increase of Smax and Mmax is induced by taking into account a spatial variability of the input parameters (elastic parameters and volume weight) along the transverse direction. This results in Smax and Mmax values higher than those obtained in case of spatial variability in both directions and longitudinal directions. The latter scenarios would lead to minimal settlements of the surface and lining efforts.
For all the scenarios considered, the variance of Smax and Mmax increases with increasing autocorrelation distance.
Finally, the importance of considering the spatial variability of soil properties is shown by the results obtained in this article. Such as the non-symmetrical soil movements which cannot be seen when the soil is assumed as homogeneous.
Author Contributions
A.H., conceptualization, methodology, writing—original draft; D.D., supervision, writing—review and editing, X.G., conceptualization, methodology, writing—review and editing. All authors have read and agreed to the published version of the manuscript.
Funding
This research received no external funding.
Institutional Review Board Statement
Not applicable.
Informed Consent Statement
Not applicable.
Data Availability Statement
Not applicable.
Conflicts of Interest
The authors declare no conflict of interest.
References
- Griffiths DV Fenton, G.A. Bearing capacity of spatially random soil: The undrained clay Prandtl problem revisited. Geotechnique 2001, 51, 351–359. [Google Scholar] [CrossRef]
- Griffiths, D.V.; Fenton, G.A.; Manoharan, N. Bearing capacity of rough rigid strip footing on cohesive soil: Probabilistic study. J. Geotech. Geoenviron. Eng. 2002, 128, 743–755. [Google Scholar] [CrossRef]
- Fenton, G.A.; Griffiths, D.V. Bearing capacity prediction of spatially random c-φ soils. Can. Geotech. J. 2003, 40, 54–65. [Google Scholar] [CrossRef]
- Popescu, R.; Deodatis, G.; Nobahar, A. Effects of random heterogeneity of soil properties on bearing capacity. Probabilistic Eng. Mech. 2005, 20, 324–341. [Google Scholar] [CrossRef]
- Ahmed ASoubra, A.H. Extension of subset simulation approach for uncertainty propagation and global sensitivity analysis. Georisk Assess. Manag. Risk Eng. Syst. Geohazards 2012, 6, 162–176. [Google Scholar] [CrossRef] [Green Version]
- Al-Bittar, T.; Soubra, A.H. Bearing capacity of strip footing on spatially random soils using sparse polynomial chaos expansion. Int. J. Numer. Anal. Methods Geomech. 2013, 37, 2039–2060. [Google Scholar] [CrossRef] [Green Version]
- Gheris, A.; Hamrouni, A. Treatment of an expansive soil using vegetable (DISS) fibre. Innov. Infrastruct. Solut. 2020, 5, 34. [Google Scholar] [CrossRef]
- Hamrouni, A.; Dias, D.; Sbartai, B. Probabilistic analysis of a piled earth platform under a concrete floor slab. Soils Found. 2017, 57, 828–839. [Google Scholar] [CrossRef]
- Hamrouni, A.; Dias, D.; Sbartai, B. Reliability analysis of a mechanically stabilized earth wall using the surface response methodology optimized by a genetic algorithm. Geomech. Eng. 2018, 15, 937–945. [Google Scholar]
- Pan QDias, D. Sliced inverse regression-based sparse polynomial chaos expansion for reliability analysis in high dimensions. Reliab. Eng. Syst. Saf. 2017, 167, 484–493. [Google Scholar]
- Guo, X.; Dias, D.; Carvajal, C.; Peyras, L.; Breul, P.A. Comparative study of different reliability methods for high dimensional stochastic problems related to earth dam stability analyses. Eng. Struct. 2019, 188, 591–602. [Google Scholar] [CrossRef]
- Guo, X.; Du, D.; Dias, D. Reliability analysis of tunnel lining considering soil spatial variability. Eng. Struct. 2019, 196, 109332. [Google Scholar] [CrossRef]
- Hamrouni, A.; Dias, D.; Sbartai, B. Soil spatial variability impact on the behaviour of a reinforced earth wall. Front. Struct. Civ. Eng. 2020, 15, 518–531. [Google Scholar] [CrossRef]
- Hamrouni, A.; Sbartai, B.; Dias, D. Ultimate dynamic bearing capacity of shallow strip foundations—Reliability analysis using the response surface methodology. Soil Dyn. Earthq. Eng. 2021, 144, 106690. [Google Scholar] [CrossRef]
- Guo, X.; Sun, Q.; Dias, D.; Antoinet, E. Probabilistic assessment of an earth dam stability design using the adaptive polynomial chaos expansion. Bull. Eng. Geol. Environ. 2020, 79, 4639–4655. [Google Scholar] [CrossRef]
- Guo, X.; Dias, D. Kriging based reliability and sensitivity analysis—Application to the stability of an earth dam. Comput. Geotech. 2020, 120, 103411. [Google Scholar] [CrossRef]
- Mollon, G.; Dias, D.; Soubra, A.-H. Probabilistic Analysis of Pressurized Tunnels against Face Stability Using Collocation-Based Stochastic Response Surface Method. J. Geotech. Geoenviron. Eng. 2011, 137, 385–397. [Google Scholar] [CrossRef] [Green Version]
- Mollon, G.; Dias, D.; Soubra, A.-H. Probabilistic Analysis and Design of Circular Tunnels against Face Stability. Int. J. Geéomeéch. 2009, 9, 237–249. [Google Scholar] [CrossRef] [Green Version]
- Mollon, G.; Dias, D.; Soubra, A.-H. Probabilistic Analysis of Circular Tunnels in Homogeneous Soil Using Response Surface Methodology. J. Geotech. Geoenviron. Eng. 2009, 135, 1314–1325. [Google Scholar] [CrossRef] [Green Version]
- Hamrouni, A.; Dias, D.; Sbartai, B. Reliability analysis of shallow tunnels using the response surface methodology. Undergr. Space 2017, 2, 246–258. [Google Scholar] [CrossRef]
- Hamrouni, A.; Dias, D.; Sbartai, B. Probability analysis of shallow circular tunnels in homogeneous soil using the surface response methodology optimized by a genetic algorithm. Tunn. Undergr. Space Technol. 2019, 86, 22–33. [Google Scholar] [CrossRef]
- Mollon, M.G.; Phoon, K.-K.; Dias, D.; Soubra, A.-H. Influence of the Scale of Fluctuation of the Friction Angle on the Face Stability of a Pressurized Tunnel in Sands. In Proceedings of the GeoRisk 2011, Atlanta, GA, USA, 26–28 June 2011; pp. 225–232. [Google Scholar]
- Mollon, G.; Phoon, K.-K.; Dias, D.; Soubra, A.-H. Validation of a New 2D Failure Mechanism for the Stability Analysis of a Pressurized Tunnel Face in a Spatially Varying Sand. J. Eng. Mech. 2011, 137, 8–21. [Google Scholar] [CrossRef] [Green Version]
- Huang, H.W.; Xiao, L.; Zhang, D.M.; Zhang, J. Influence of spatial variability of soil Young’s modulus on tunnel convergence in soft soils. Eng. Geol. 2017, 228, 357–370. [Google Scholar] [CrossRef]
- Cheng, H.; Chen, J.; Li, J. Probabilistic Analysis of Ground Movements Caused by Tunneling in a Spatially Variable Soil. Int. J. Geéomeéch. 2019, 19, 04019125. [Google Scholar] [CrossRef]
- Kroetz, H.M.; Do, N.A.; Dias, D.; Beck, A.T. Reliability of tunnel lining design using the hyperstatic reaction method. Tunn. Undergr. Space Technol. 2018, 77, 59–67. [Google Scholar] [CrossRef]
- Hejazi, Y.; Dias, D.; Kastner, R. Impact of constitutive models on the numerical analysis of underground constructions. Acta Geotech. 2008, 3, 251–258. [Google Scholar] [CrossRef]
- Spanos, P.D.; Ghanem, R. Stochastic Finite Element Expansion for Random Media. J. Eng. Mech. 1989, 115, 1035–1053. [Google Scholar] [CrossRef]
- Sahraoui, Y.; Chateauneuf, A. The effects of spatial variability of the aggressiveness of soil on system reliability of corroding underground pipelines. Int. J. Press. Vessel. Pip. 2016, 146, 188–197. [Google Scholar] [CrossRef]
- Vu-Bac, N.; Rafiee, R.; Zhuang, X.; Lahmer, T.; Rabczuk, T. Uncertainty quantification for multiscale modeling of polymer nanocomposites with correlated parameters. Compos. Part B Eng. 2015, 68, 446–464. [Google Scholar] [CrossRef]
- Vu-Bac, N.; Lahmer, T.; Zhuang, X.; Nguyen-Thoi, T.; Rabczuk, T. A software framework for probabilistic sensitivity analysis for computationally expensive models. Adv. Eng. Softw. 2016, 100, 19–31. [Google Scholar] [CrossRef]
- Ghanem, R.G.; Spanos, P.D. Stochastic Finite Elements: A Spectral Approach; Springer: New York, NY, USA, 1991. [Google Scholar]
- Cho, S.E. Effects of spatial variability of soil properties on slope stability. Eng. Geol. 2007, 92, 97–109. [Google Scholar] [CrossRef]
- Cho, S.E.; Park, H.C. Effect of spatial variability of cross-correlated soil properties on bearing capacity of strip footing. Int. J. Numer. Anal. Methods Geéomeéch. 2010, 34, 1–26. [Google Scholar] [CrossRef]
- Sudret, B.; Berveiller, M. Stochastic finite element methods in geotechnical engineering. In Reliability-Based Design in Geotechnical Engineering: Computations and Applications; Phoon, K.K., Ed.; Taylor & Francis: Oxford, UK, 2008; p. 260296. [Google Scholar]
- Der Kiureghian, A.; Ke, J.B. The stochastic finite element method in structural reliability. Probabilistic Eng. Mech. 1988, 3, 83–91. [Google Scholar] [CrossRef]
- Shinozuka, M.; Dasgupta, G. Stochastic fields and their digital simulation. In Stochastic Methods in Structural Dynamics; Schueller, G.I., Shinozuka, M., Eds.; Martinus Nijhoff Publishers: Boston, MA, USA, 1987; pp. 93–133. [Google Scholar]
- Deodatis, G. Stochastic FEM sensitivity analysis of nonlinear dynamic problems. Probabilistic Eng. Mech. 1989, 4, 135–141. [Google Scholar] [CrossRef]
- Vanmarcke, E. Probabilistic modeling of soil profiles. J. Geotech. Eng. ASCE 1977, 103, 1227–1246. [Google Scholar] [CrossRef]
- Vanmarcke, E. Random Fields: Analysis and Synthesis; MIT Press: Cambridge, UK, 1983; 382p. [Google Scholar]
- Popescu, R. Stochastic Variability of soil Properties: Data Analysis, Digital Simulation, Effects on System Behavior. Ph.D. Thesis, Princeton University, Princeton, NJ, USA, 1995. [Google Scholar]
- Croce, A. Analisi Dati di Monitoraggio del Rivestimento della Galleria del Passante Ferroviario di Bologna. Degree Dissertation, Polytechnics of Torino, Torino, Italy, 2011. [Google Scholar]
- Do, N.A.; Dias, D.; Oreste, P.P.; Djeran-Maigre, I. 2D tunnel numerical investigation - the influence of the simplified excavation method on tunnel behaviour. Geotech. Geol. Eng. 2014, 32, 43–58. [Google Scholar] [CrossRef]
- Itasca Consulting Group. FLAC fast Lagrangian Analysis of Continua, Version 7. User’s Manual. FLAC fast Lagrangian Analysis of Continua, Version 7. User’s Manual.; Itasca Consulting Group: Minneapolis, MN, USA, 2011. [Google Scholar]
- Deghoul, L.; Gabi, S.; Hamrouni, A. The influence of the soil constitutive models on the seismic analysis of pile-supported wharf structures with batter piles in cut-slope rock dike. Stud. Geotech. Et Mech. 2020, 42, 191–209. [Google Scholar] [CrossRef]
- Massih, D.S.Y.A.; Soubra, A.-H. Reliability-Based Analysis of Strip Footings Using Response Surface Methodology. Int. J. Geomech. 2008, 8, 134–143. [Google Scholar] [CrossRef] [Green Version]
- Low, B.K.; Tang, W.H. Efficient Reliability Evaluation Using Spreadsheet. J. Eng. Mech. 1997, 123, 749–752. [Google Scholar] [CrossRef]
- Low, B.K.; Tang, W.H. Reliability analysis of reinforced embankments on soft ground. Can. Geotech. J. 1997, 34, 672–685. [Google Scholar] [CrossRef]
Figure 1.
Stress–strain curves with loading phases.
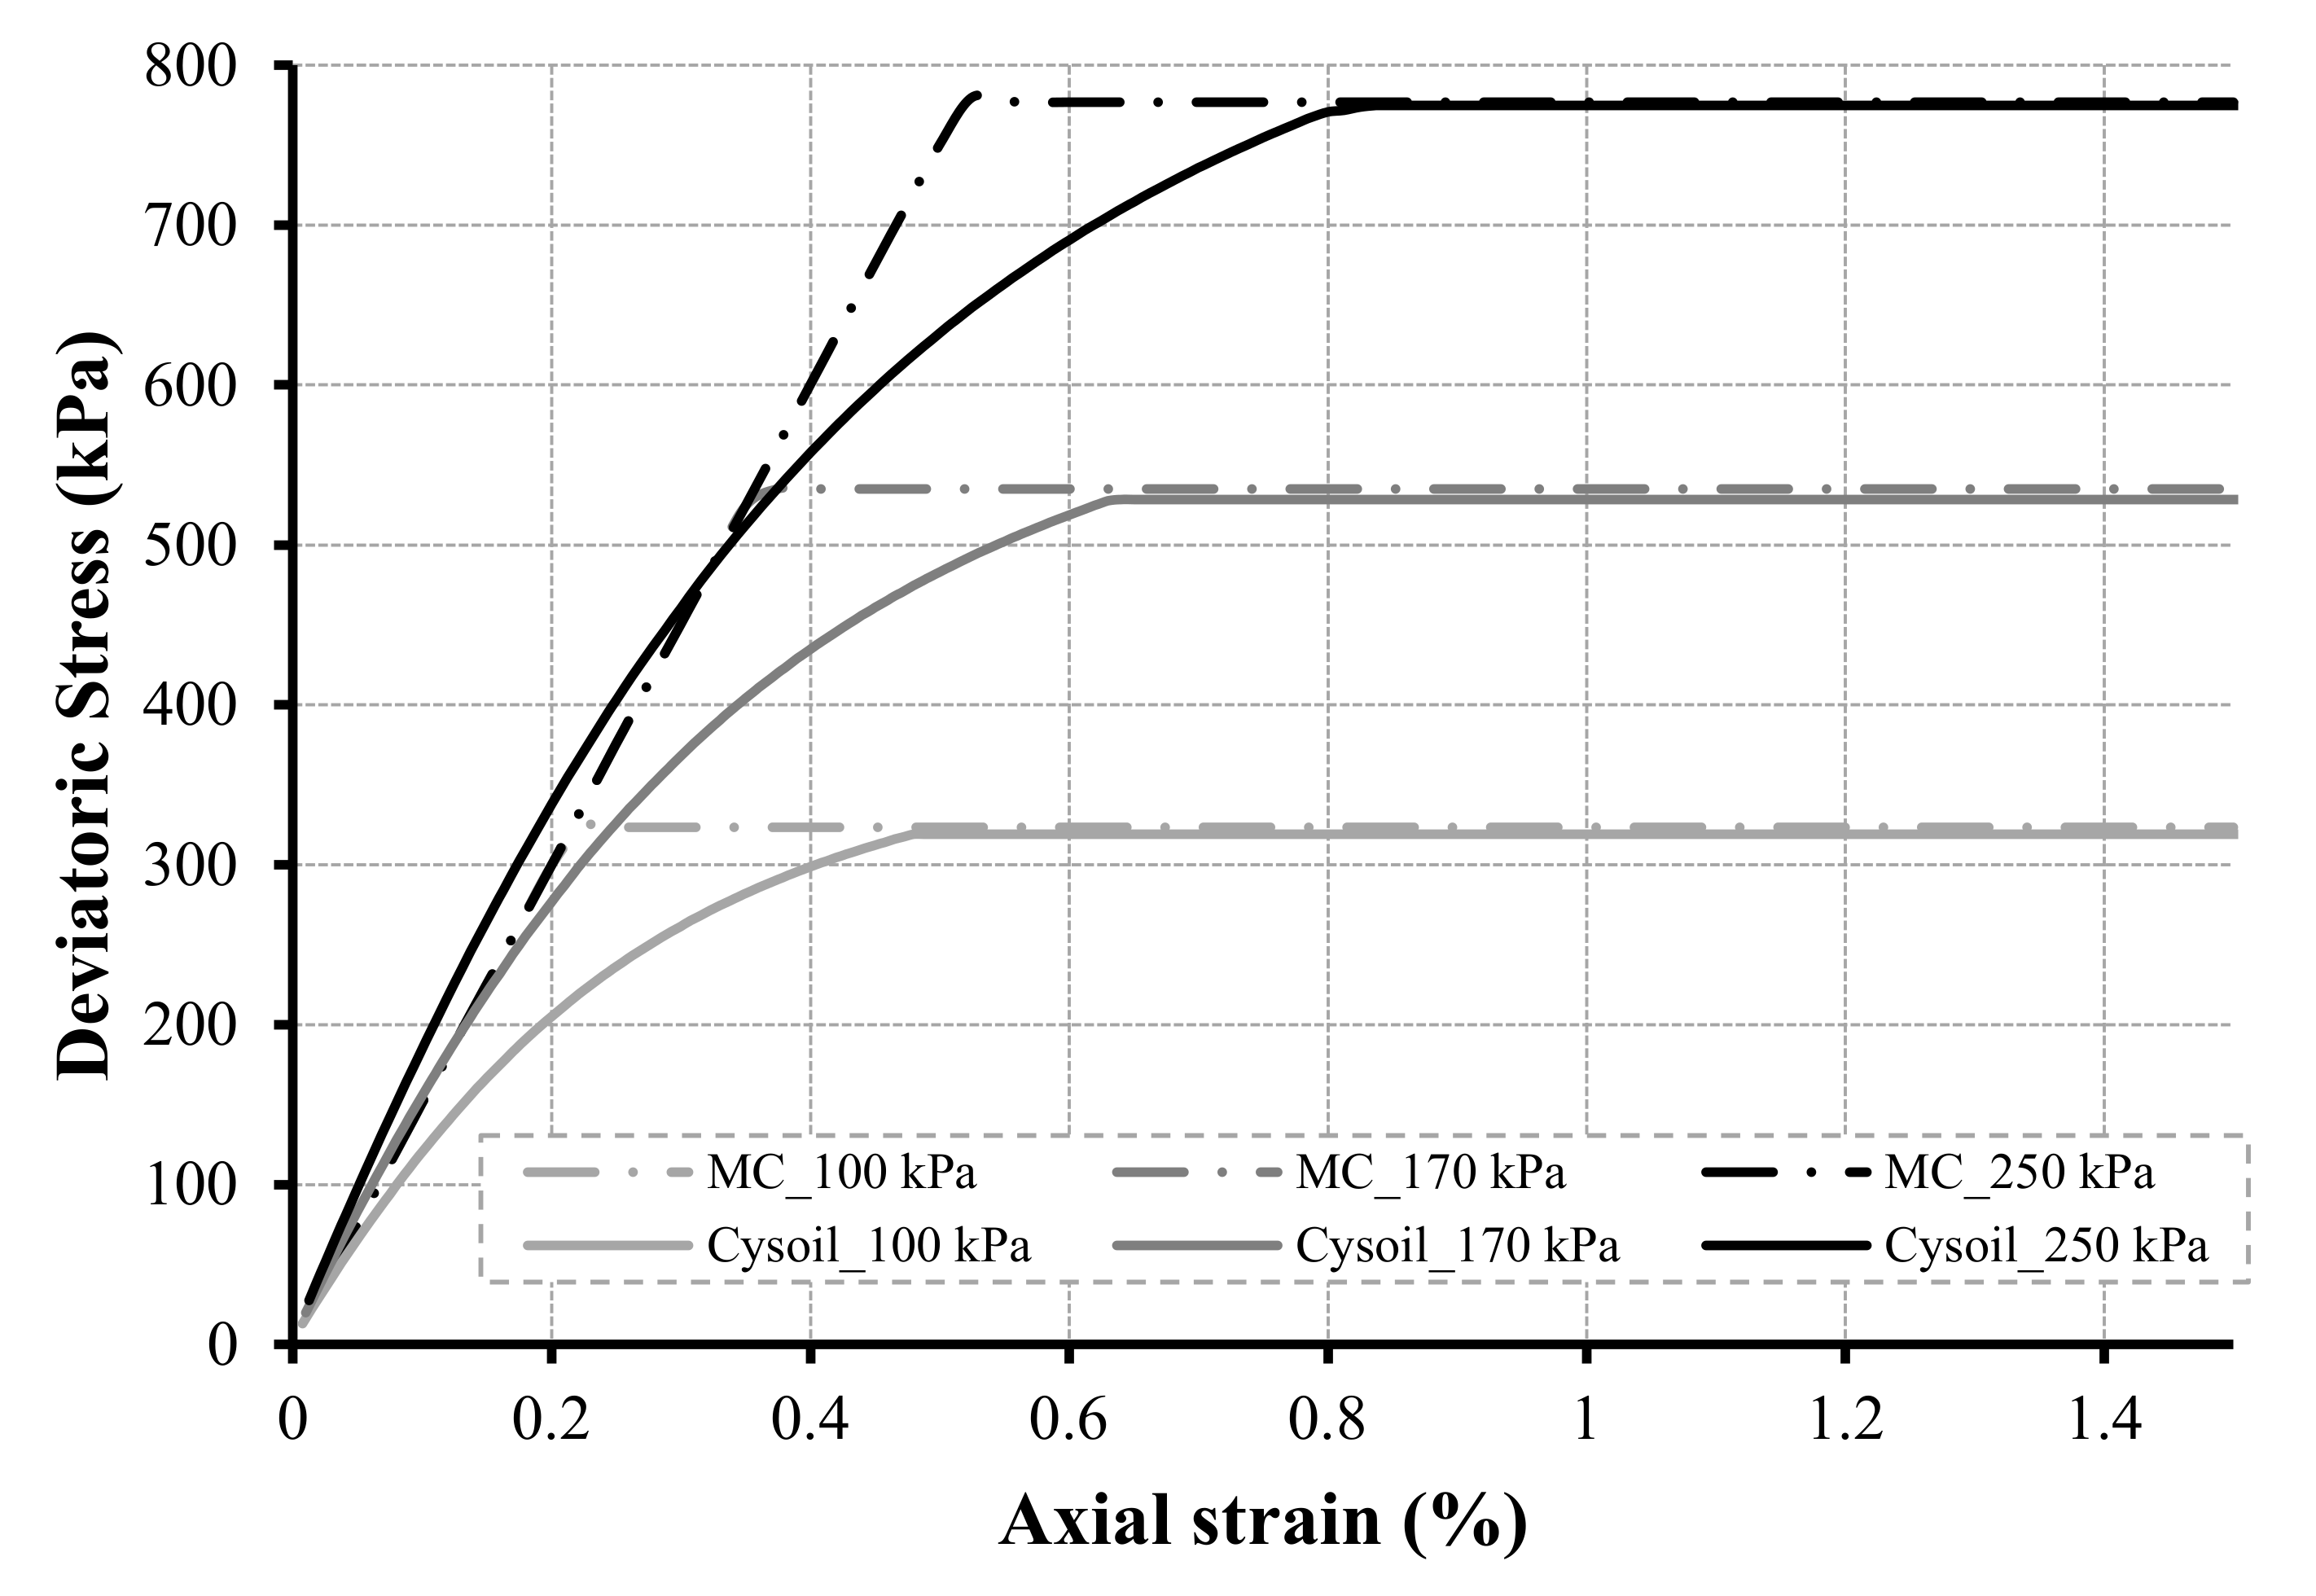
Figure 2.
Adopted numerical model.
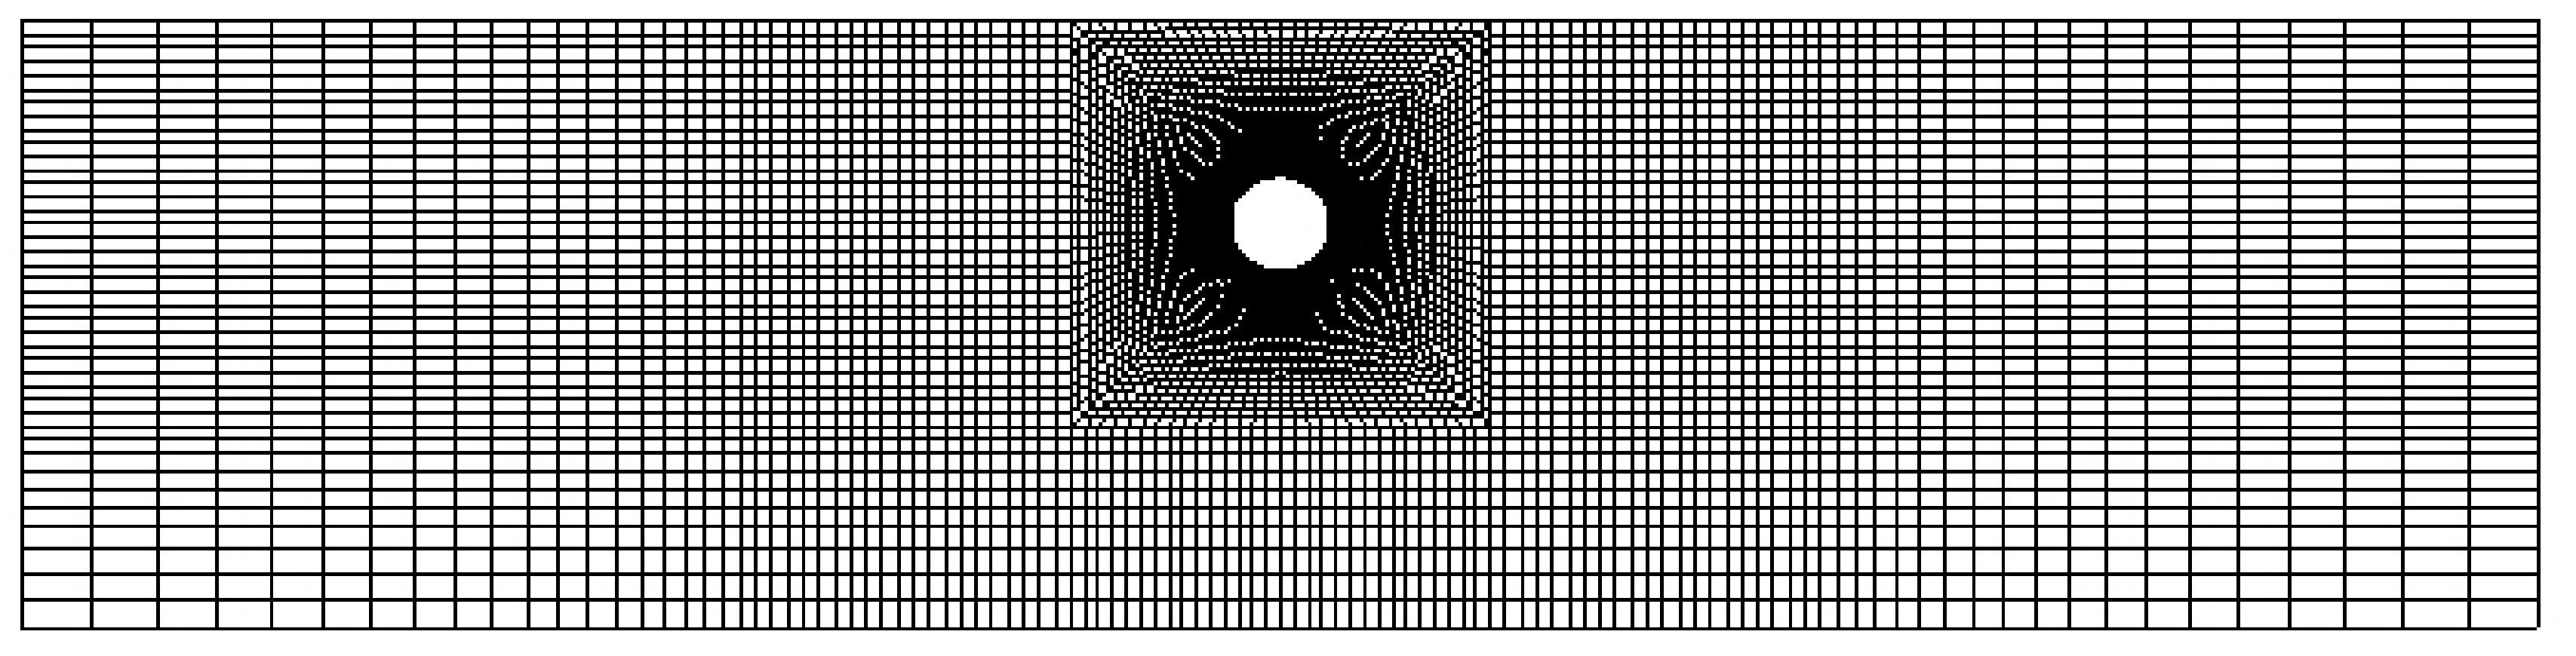
Figure 3.
Tunneling simulation considering CCM.
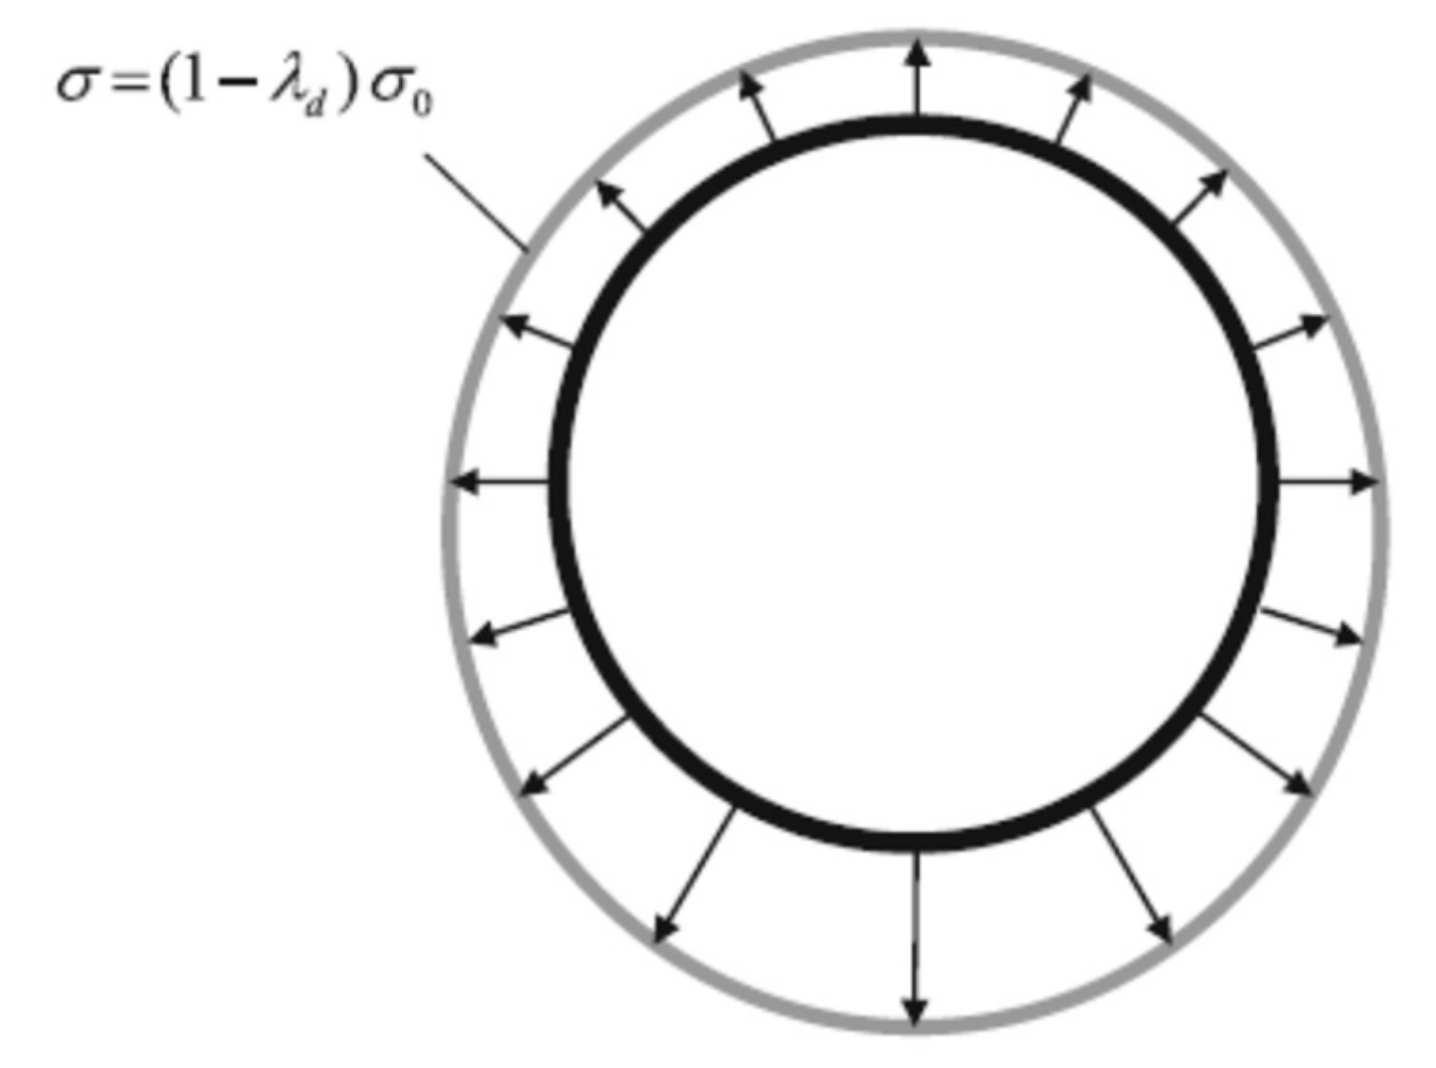
Figure 4.
Surface settlement curve.
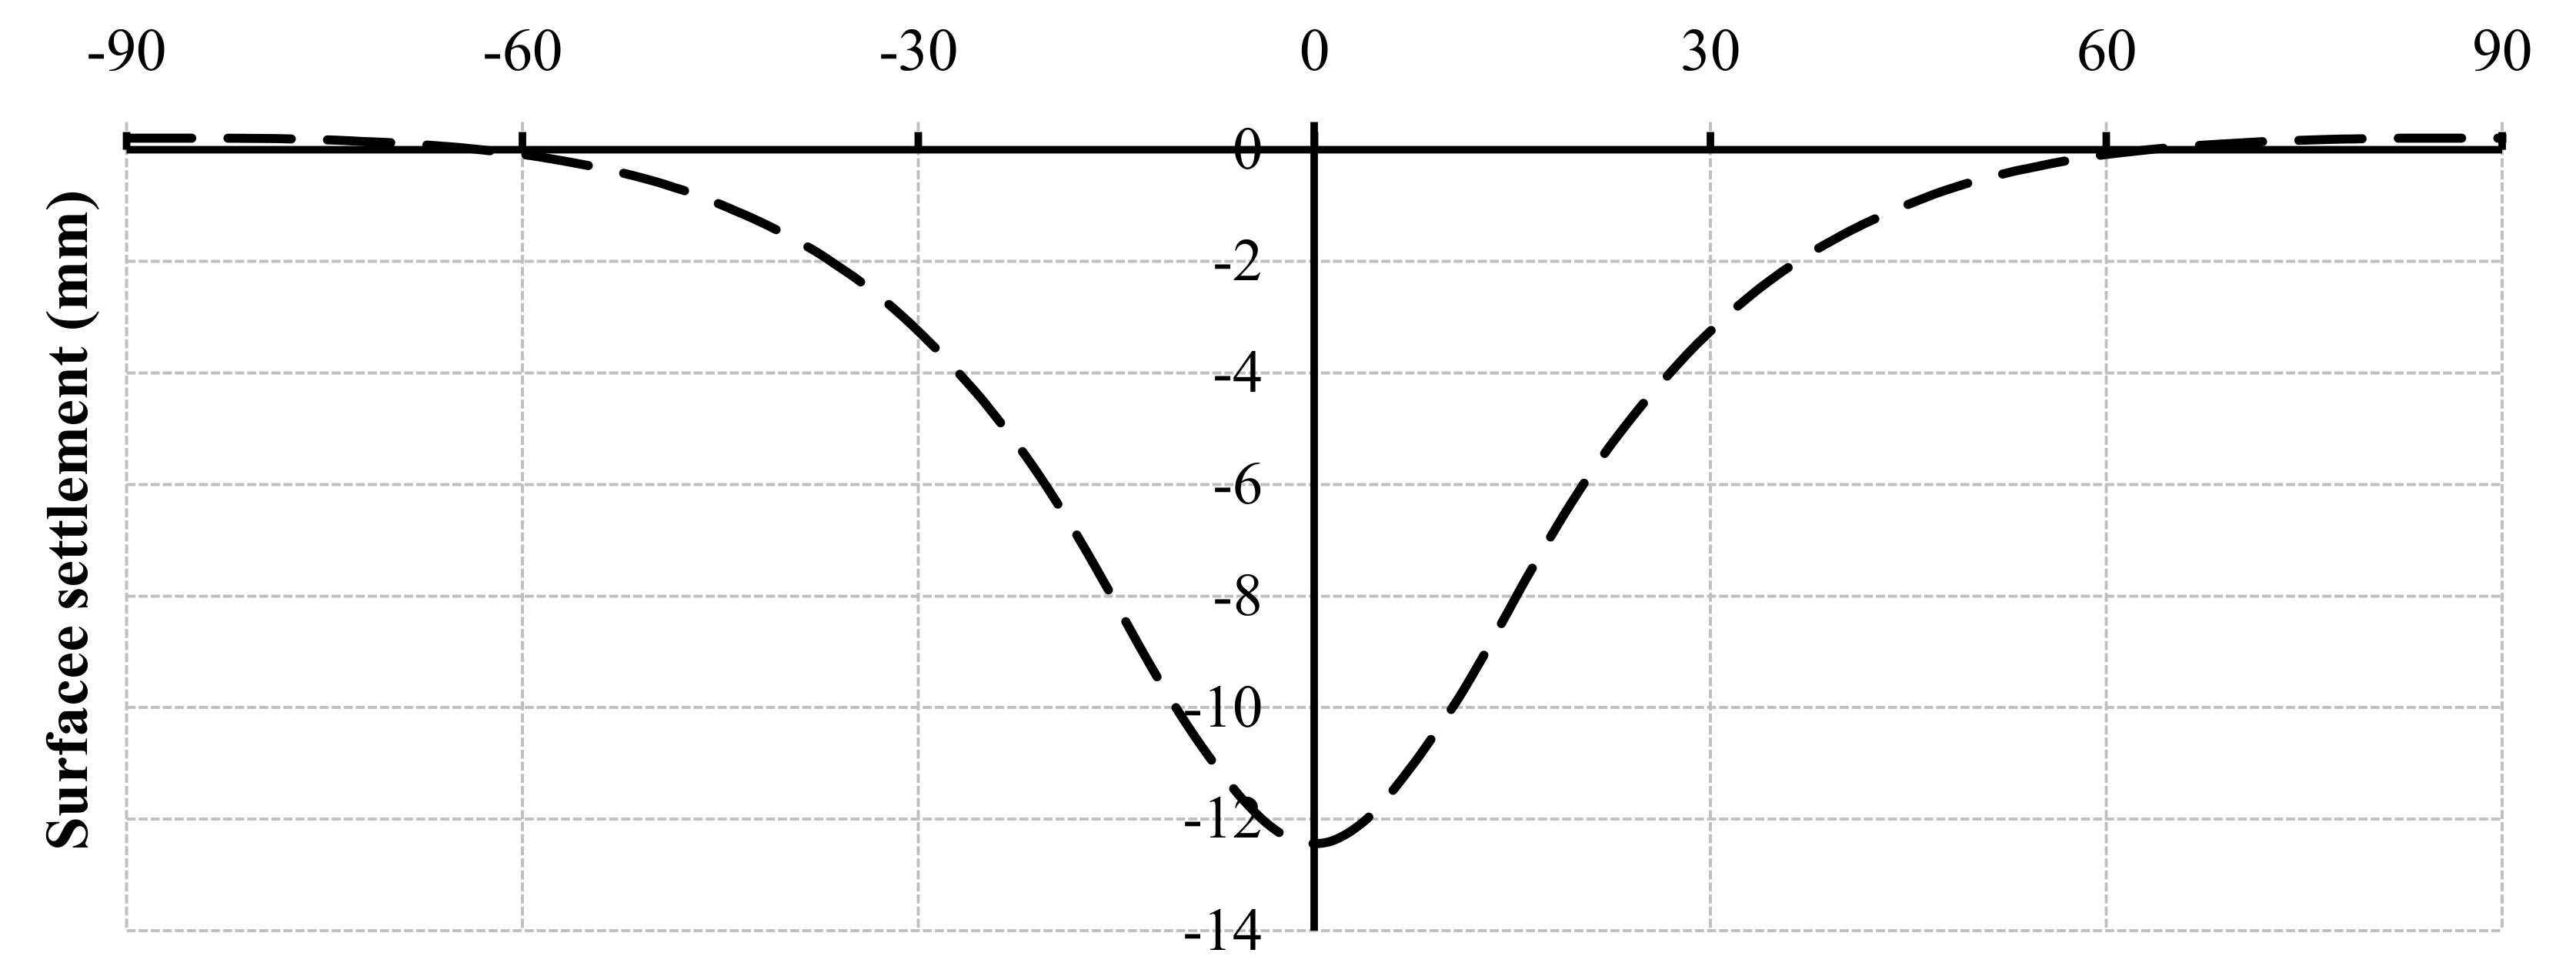
Figure 5.
Lining bending moment (kN·m/m).
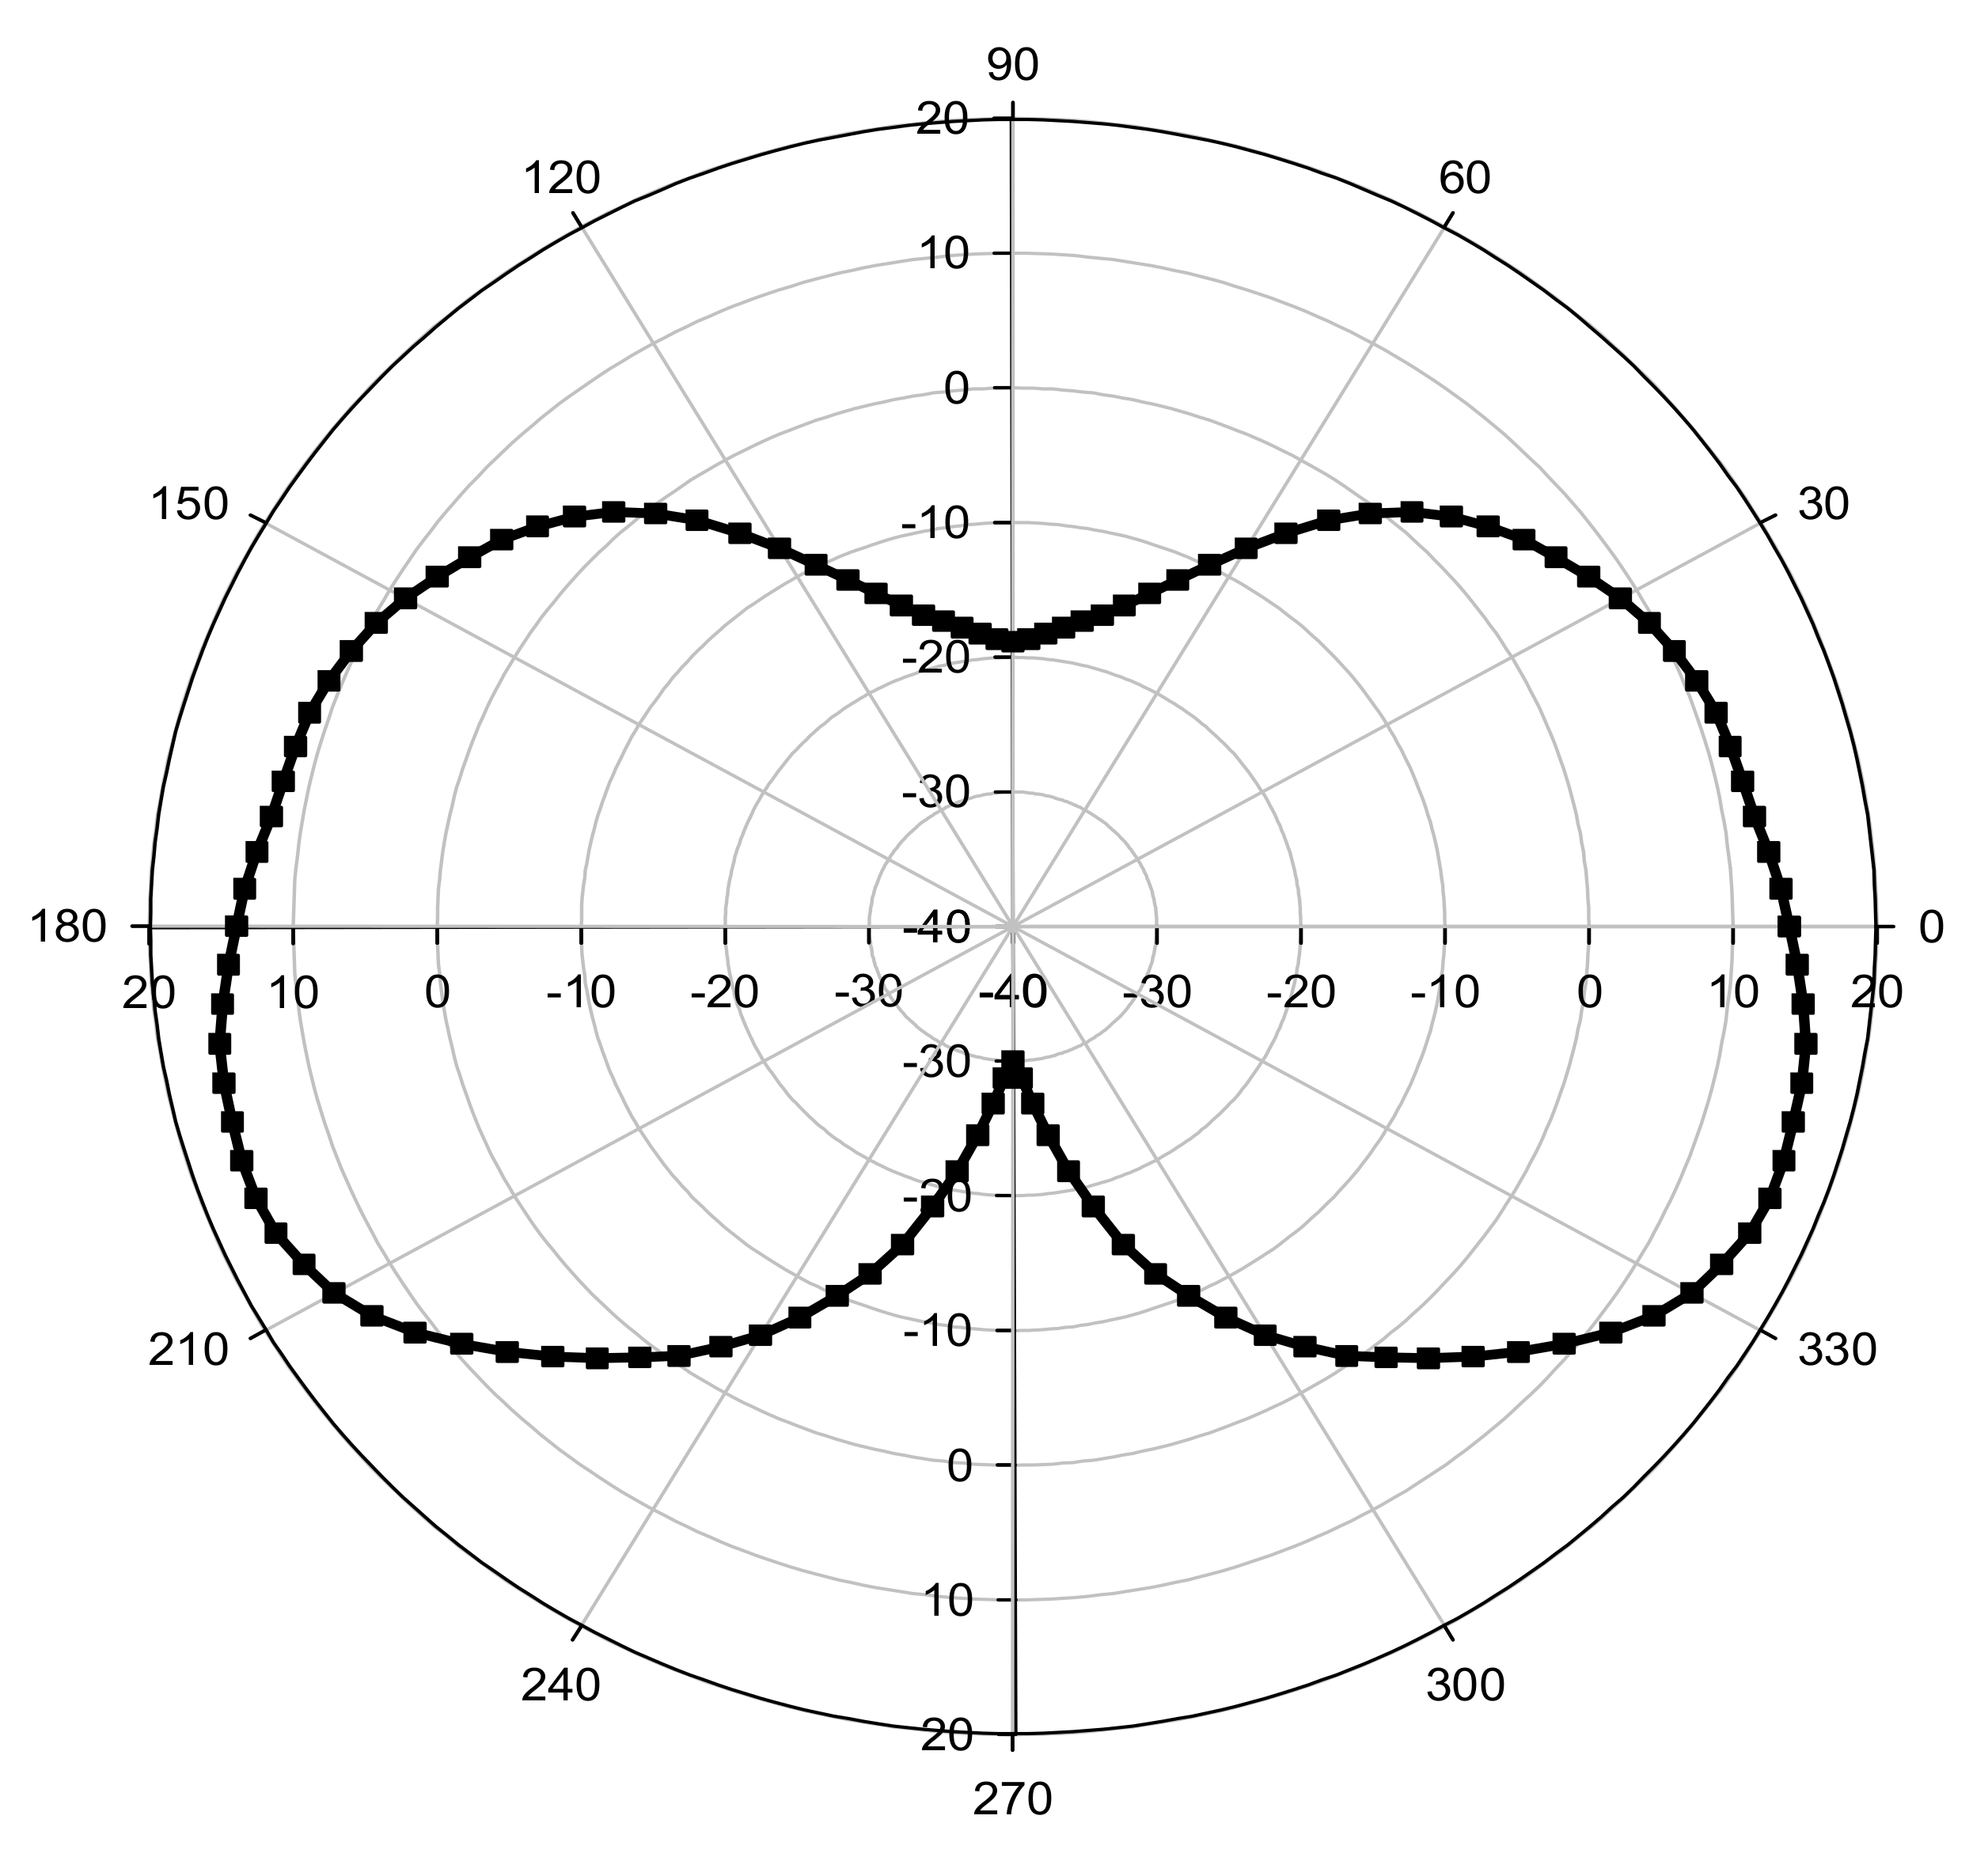
Figure 6.
Influence of the input parameters on the maximum surface settlements.
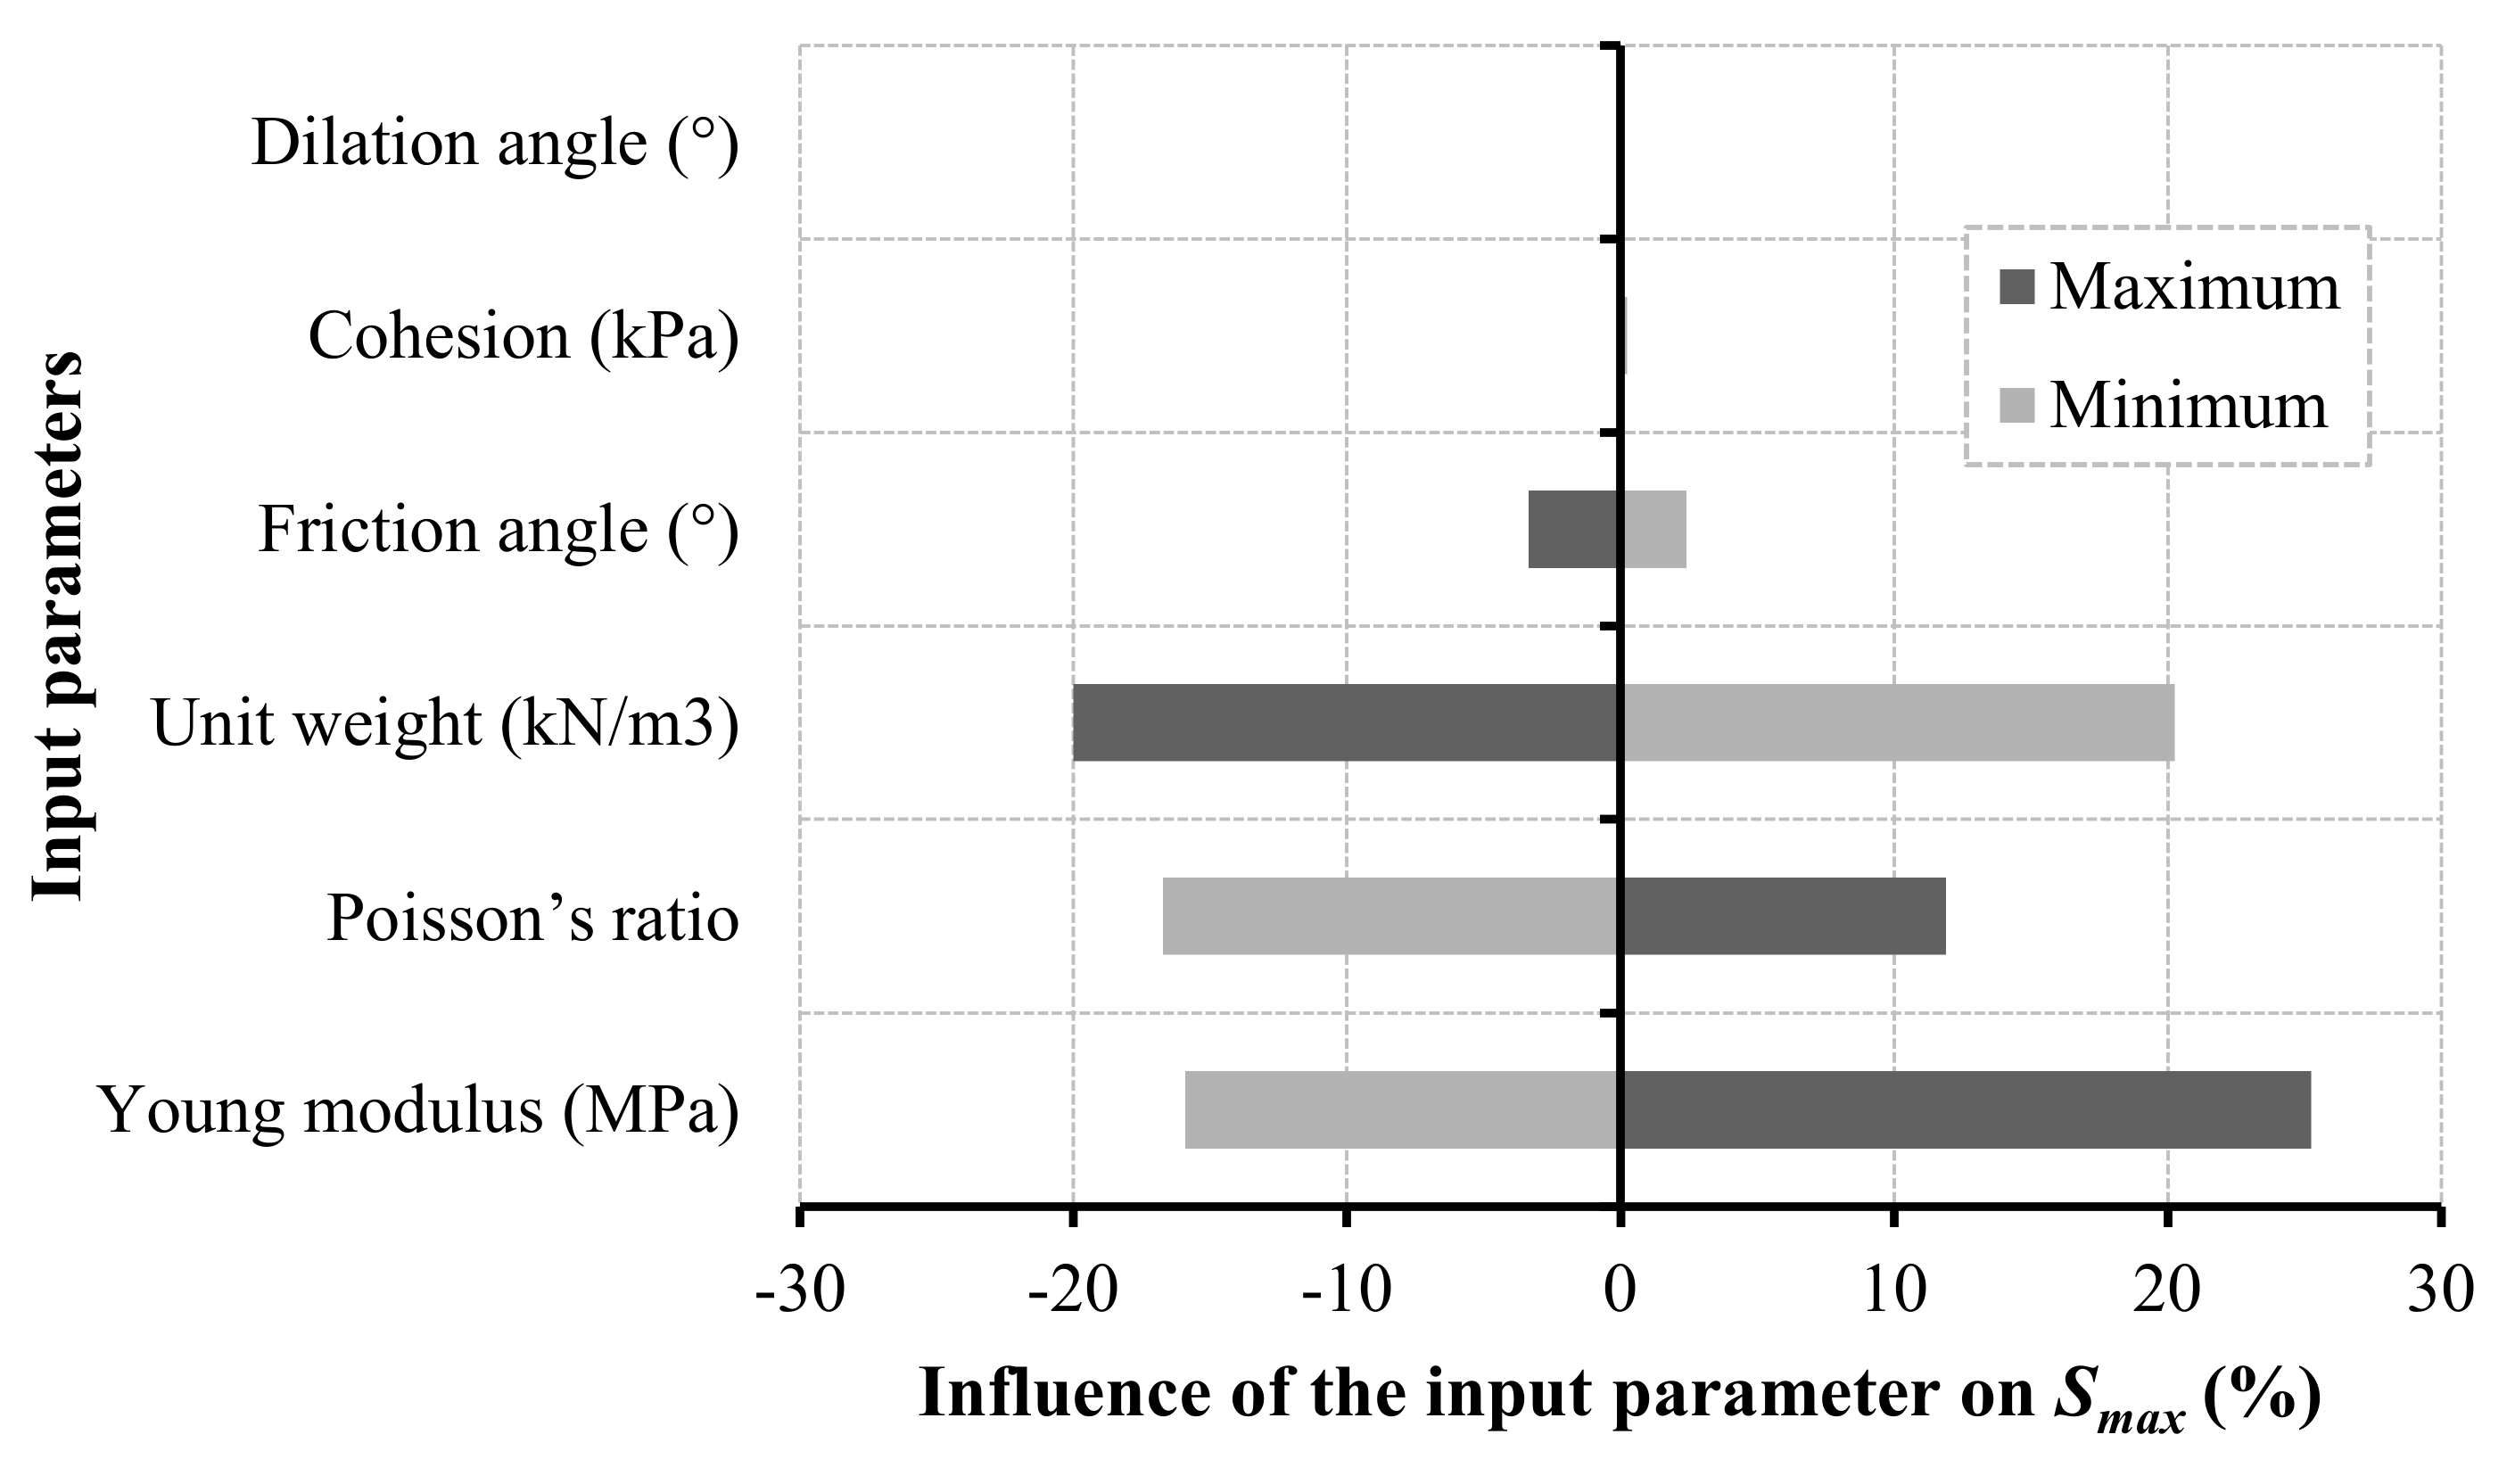
Figure 7.
Influence of the input parameters on the maximum liner bending moments.
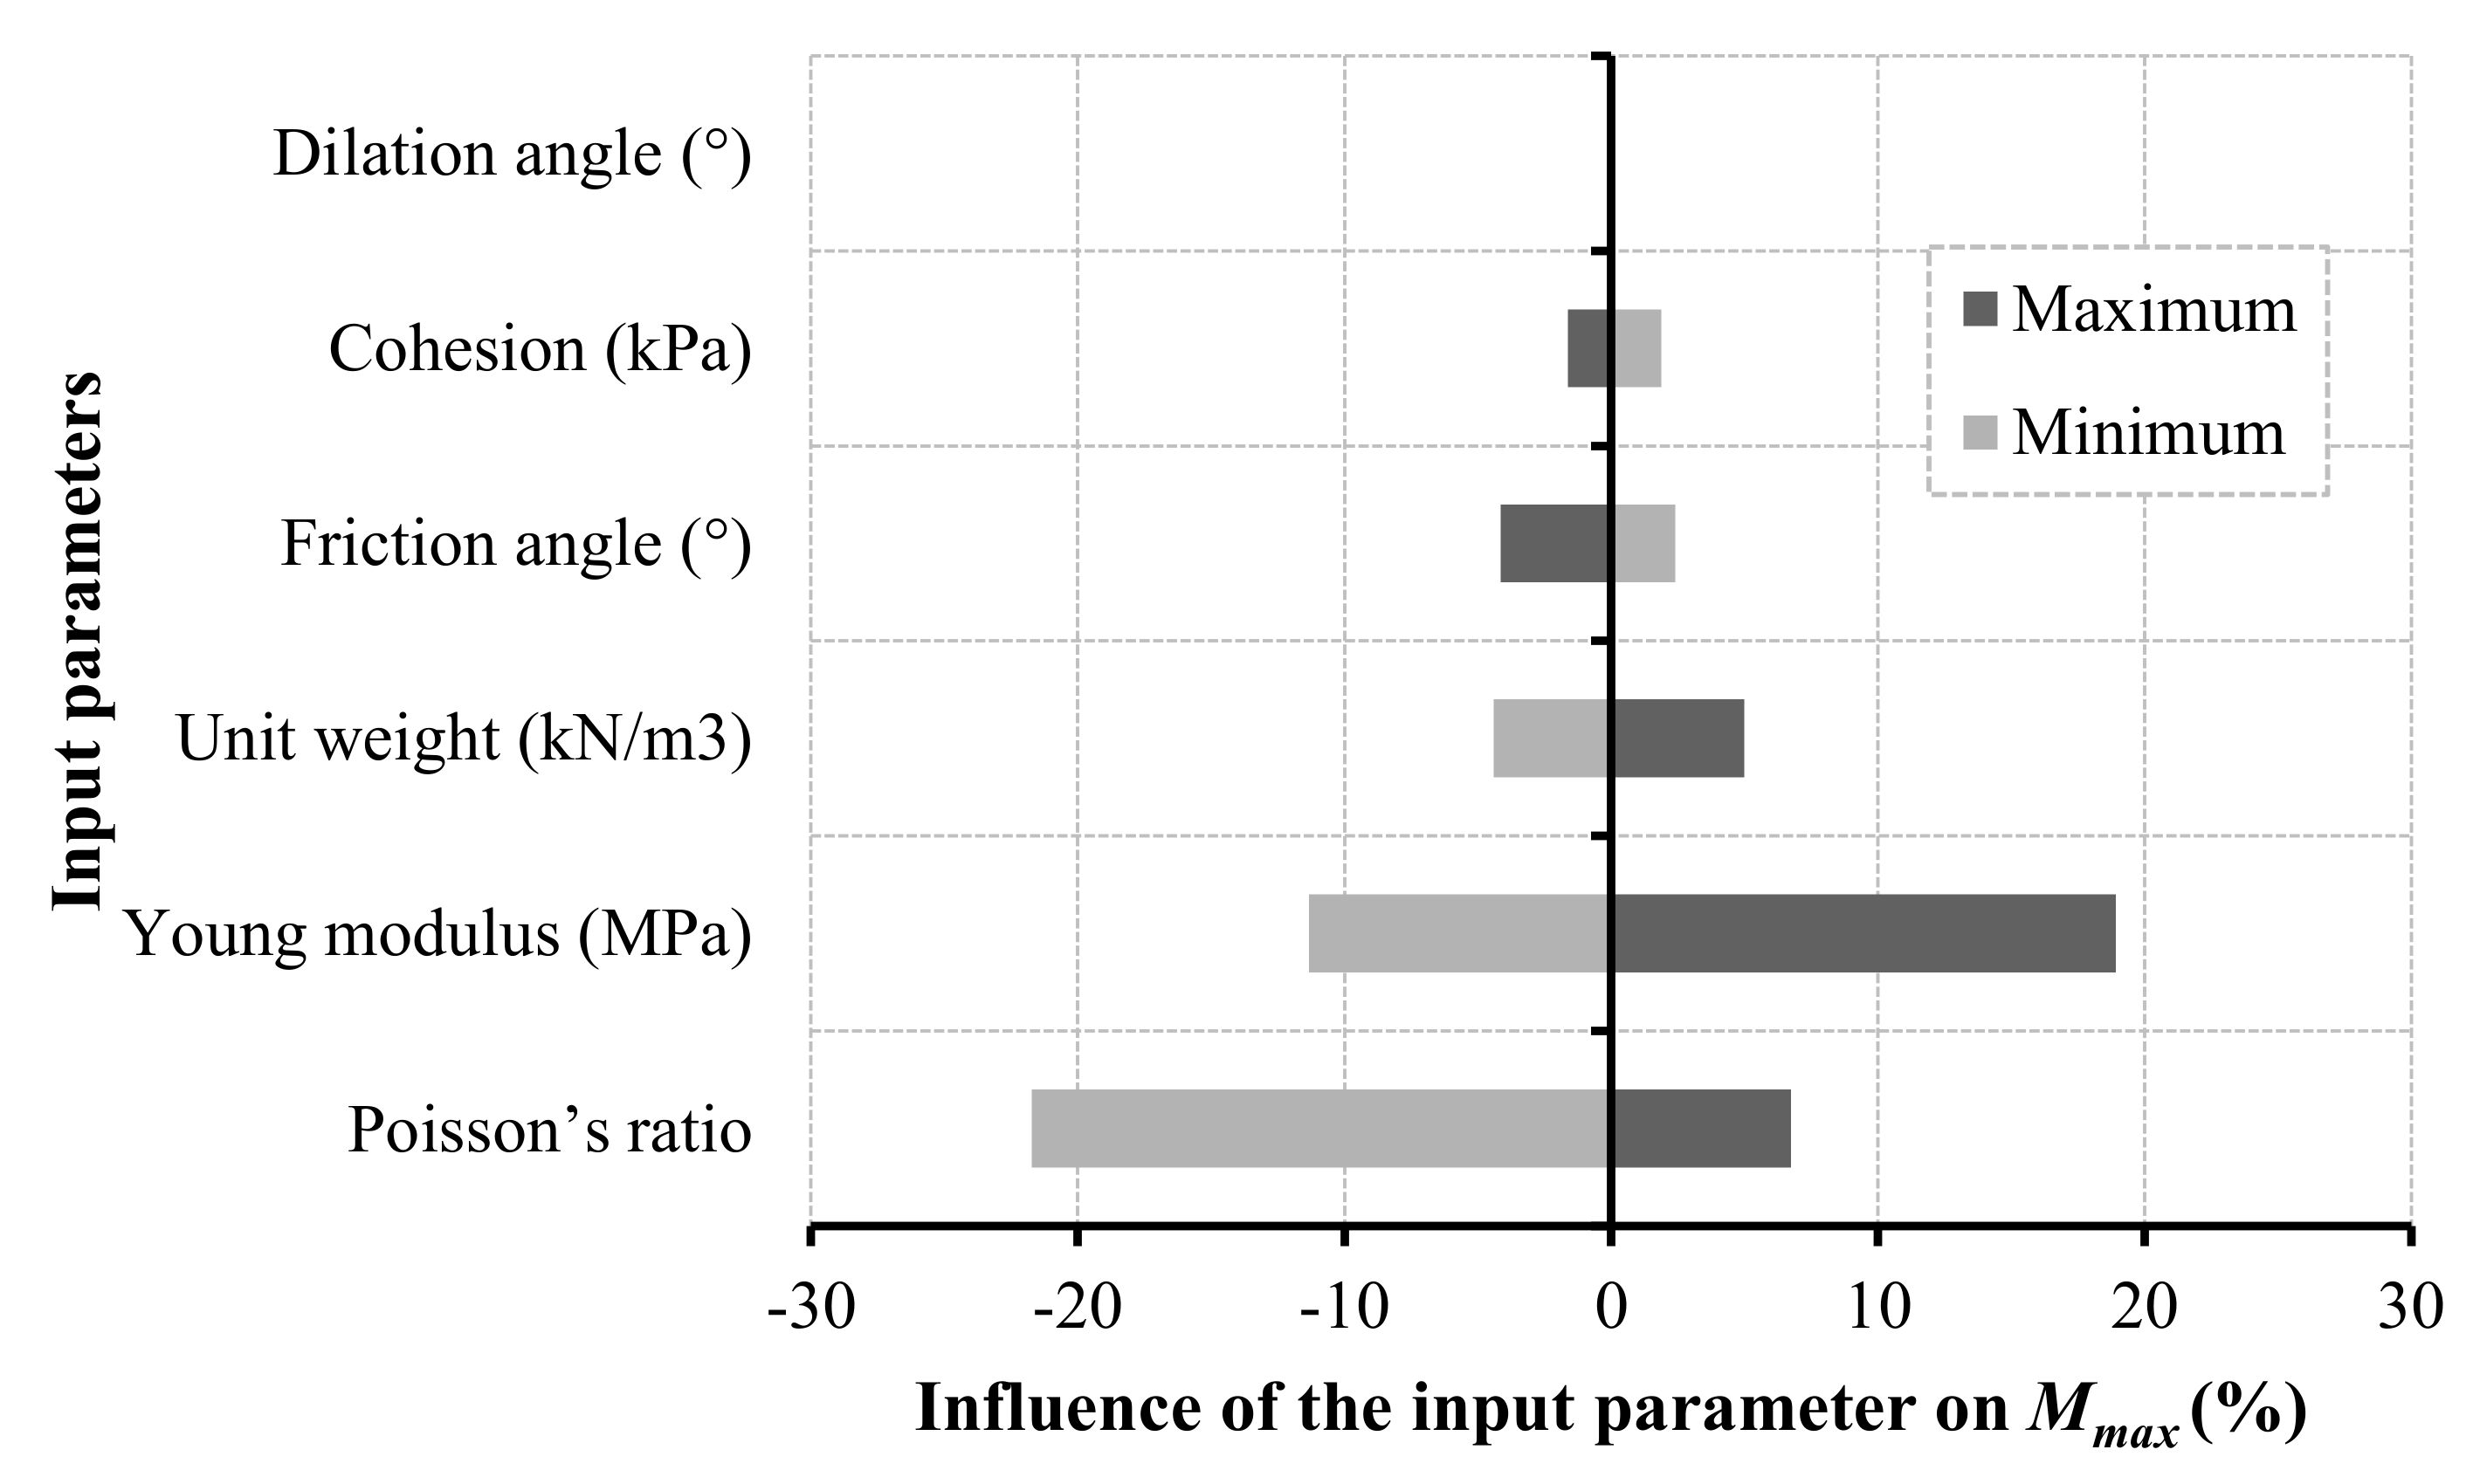
Figure 8.
Transformation of the random field data to the numerical model.

Figure 9.
The converging trend of maximum surface settlement and liner bending moment statistics: (a) Mean of Smax; (b) COV of Smax; (c) Mean of Mmax; (d) COV of Mmax.
Figure 9.
The converging trend of maximum surface settlement and liner bending moment statistics: (a) Mean of Smax; (b) COV of Smax; (c) Mean of Mmax; (d) COV of Mmax.
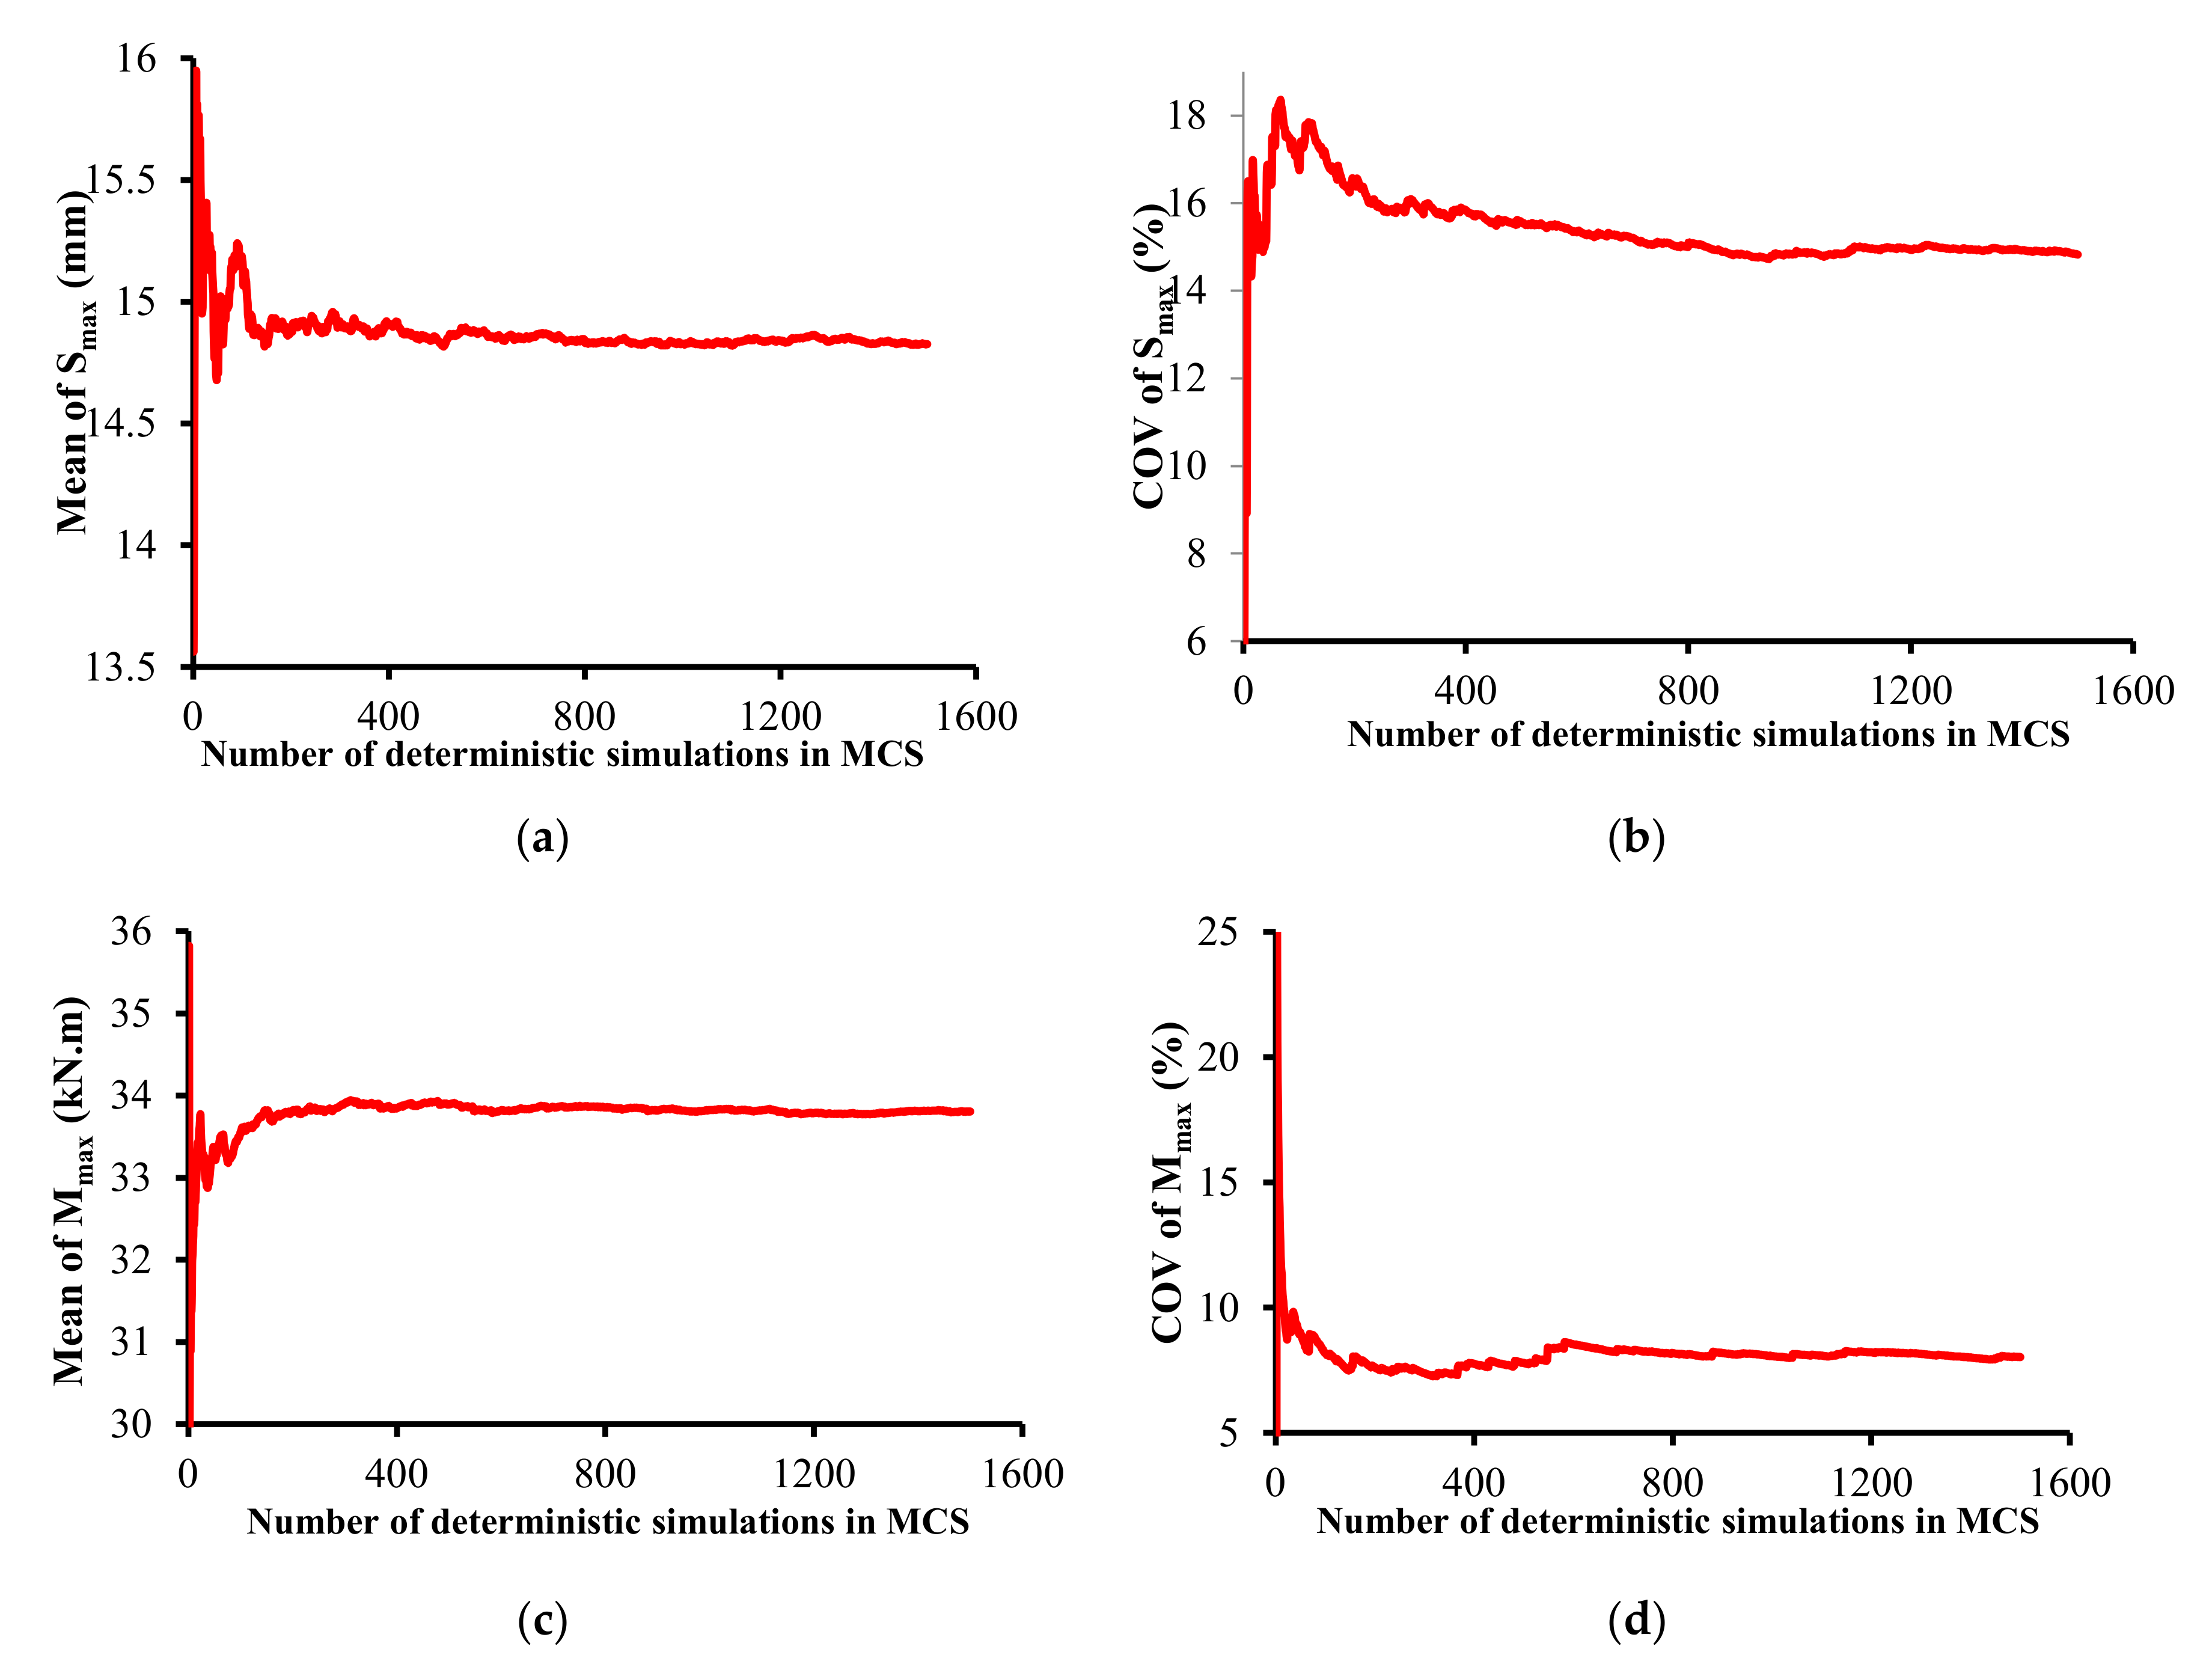
Figure 10.
Generated random fields of Young’s modulus using different autocorrelation distances: (a) Lx = 1 m, Ly = 1 m; (b) Lx = 10 m, Ly = 1 m; (c) Lx = 100 m, Ly = 1 m; (d) Lx = 200 m, Ly = 1 m.
Figure 10.
Generated random fields of Young’s modulus using different autocorrelation distances: (a) Lx = 1 m, Ly = 1 m; (b) Lx = 10 m, Ly = 1 m; (c) Lx = 100 m, Ly = 1 m; (d) Lx = 200 m, Ly = 1 m.
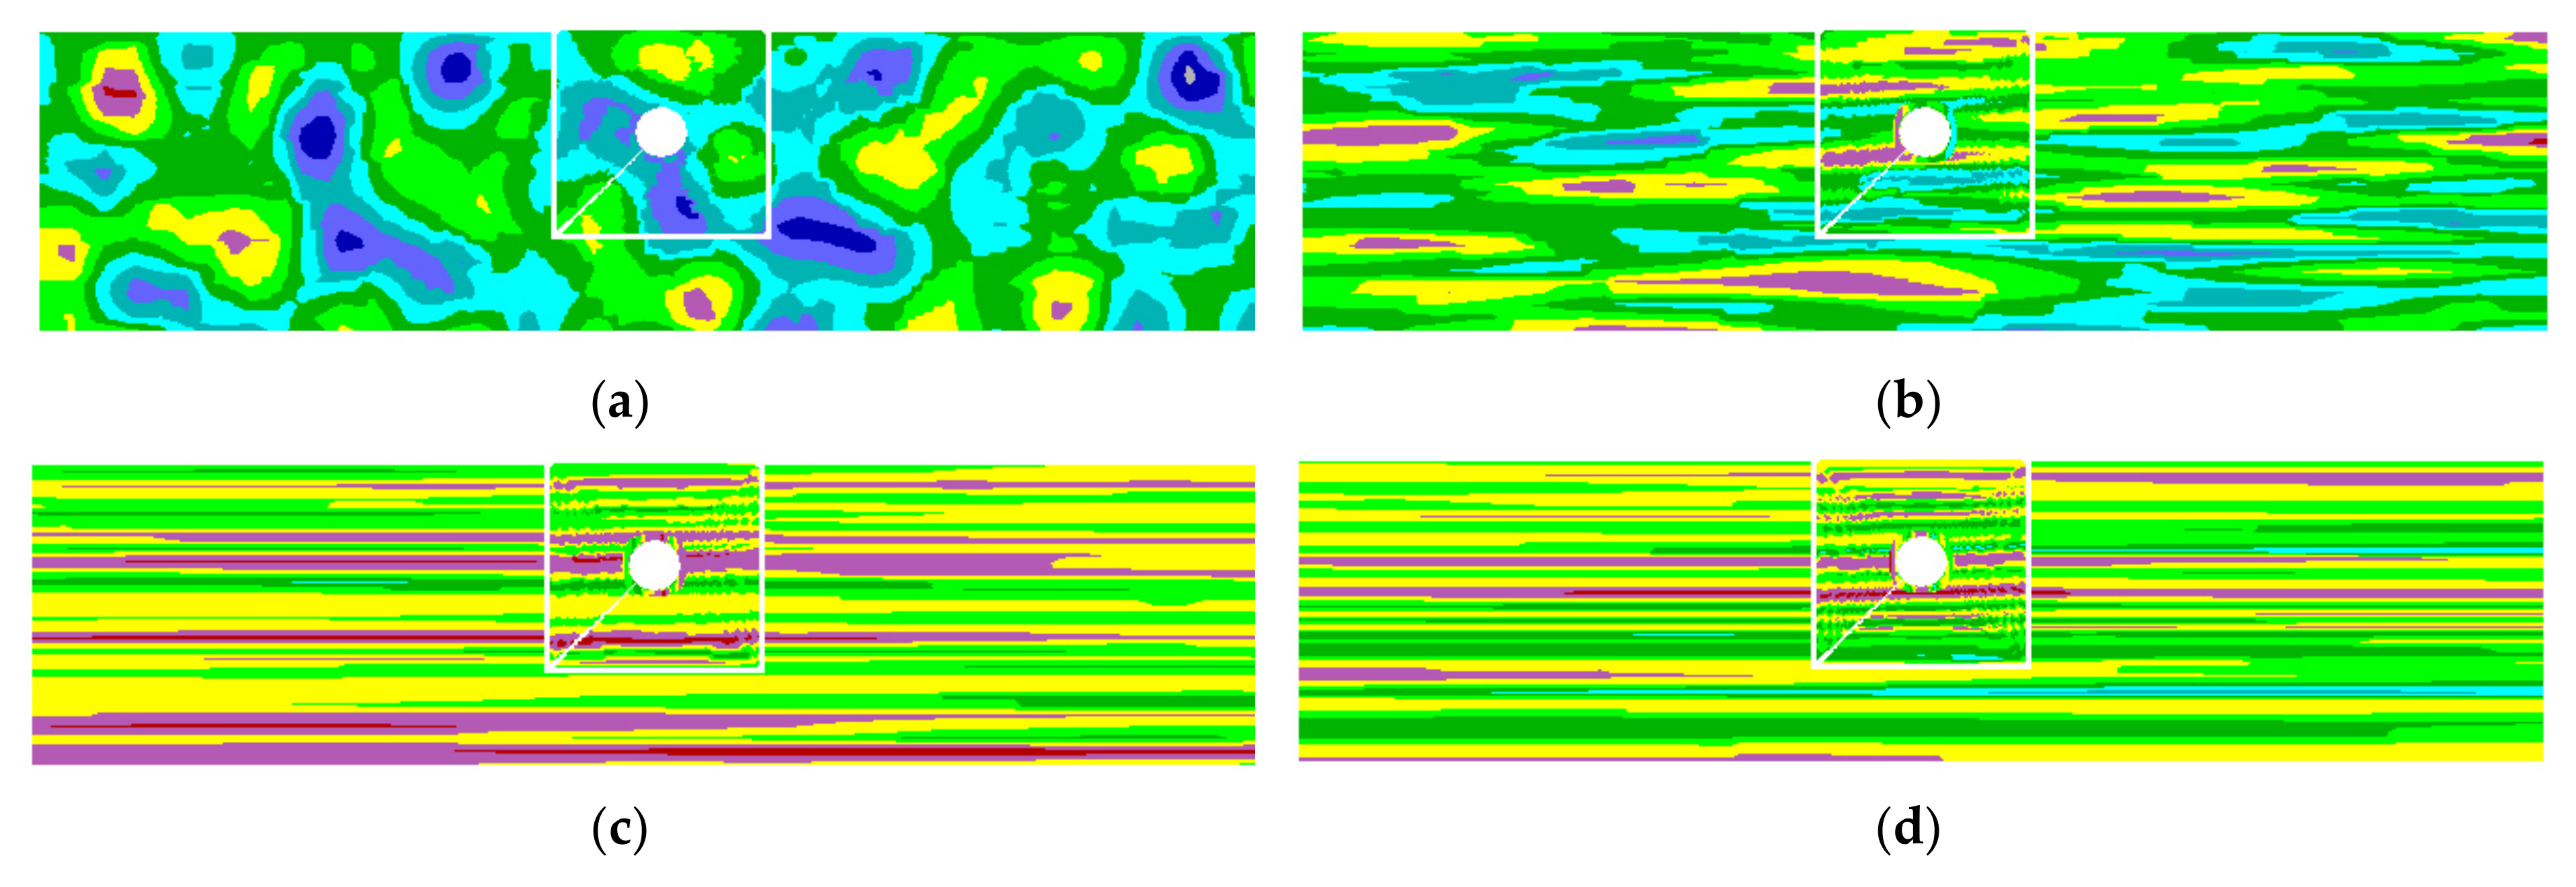
Figure 11.
Influence of the isotropic autocorrelation distance Lx = Ly on the PDF of the: (a) Smax; (b) Mmax.
Figure 11.
Influence of the isotropic autocorrelation distance Lx = Ly on the PDF of the: (a) Smax; (b) Mmax.
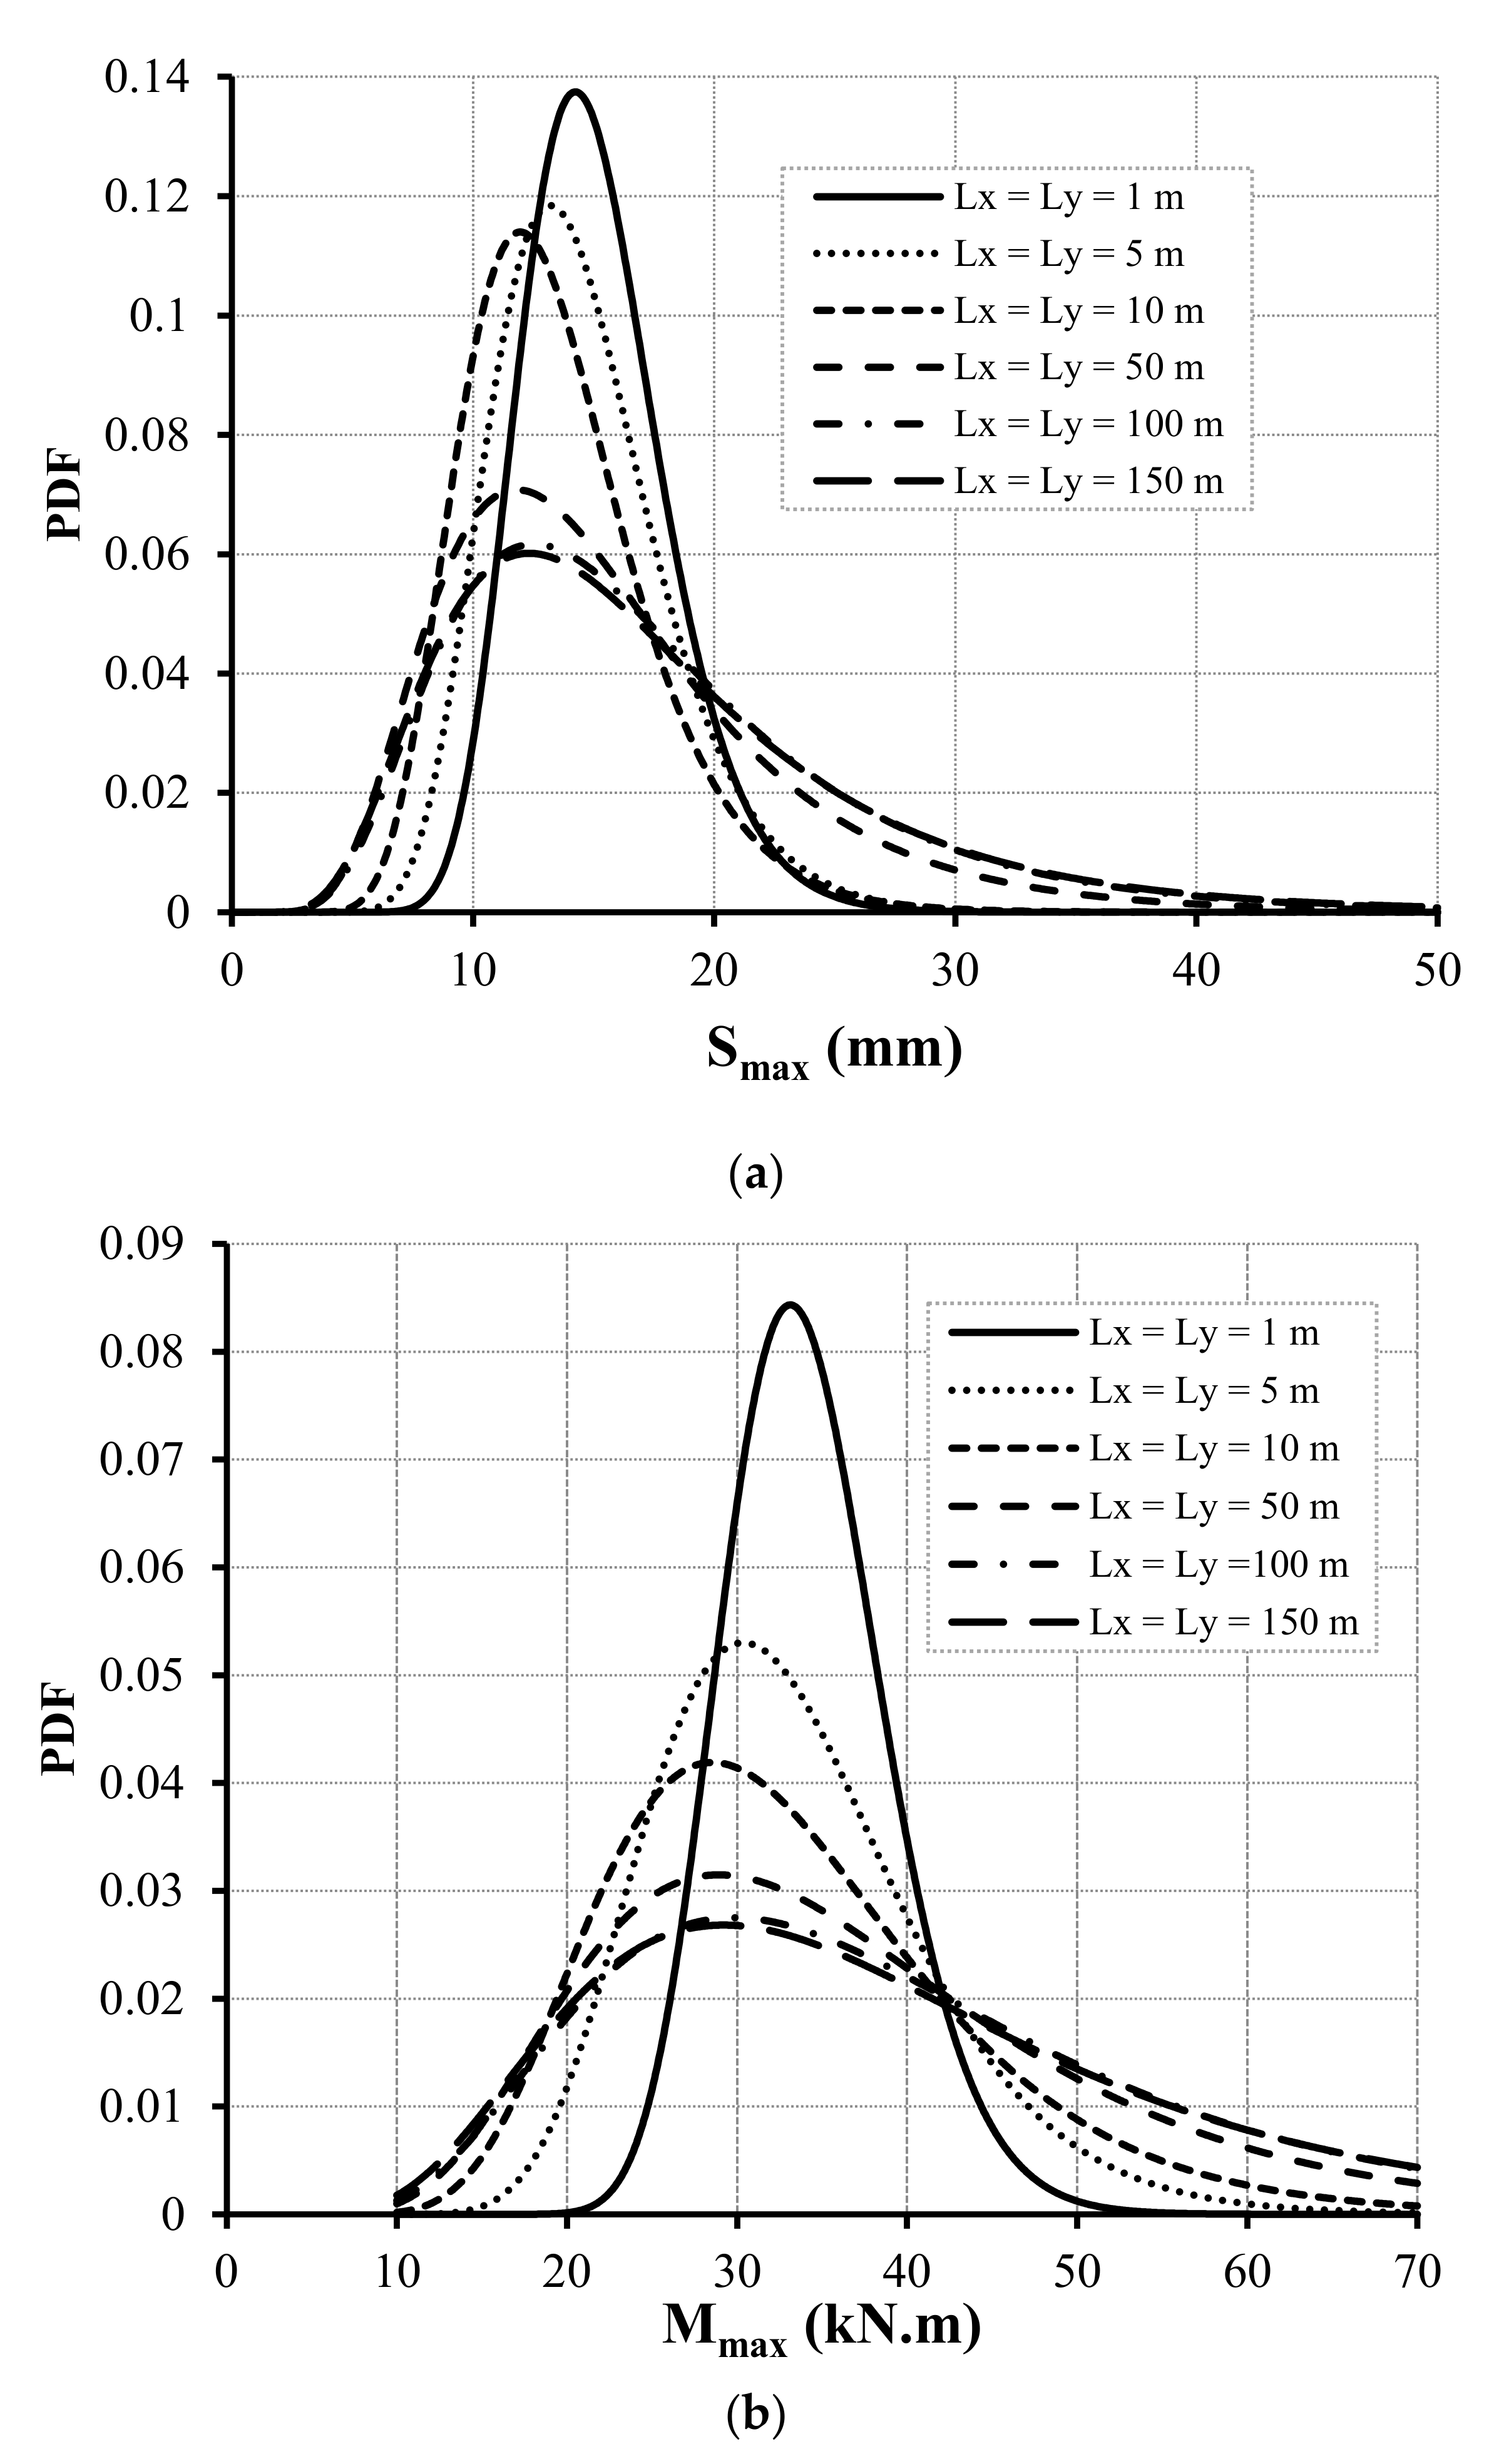
Figure 12.
Variation of the mean in terms of autocorrelation distance for both direction random fields. (a) Smax; (b) Mmax.
Figure 12.
Variation of the mean in terms of autocorrelation distance for both direction random fields. (a) Smax; (b) Mmax.
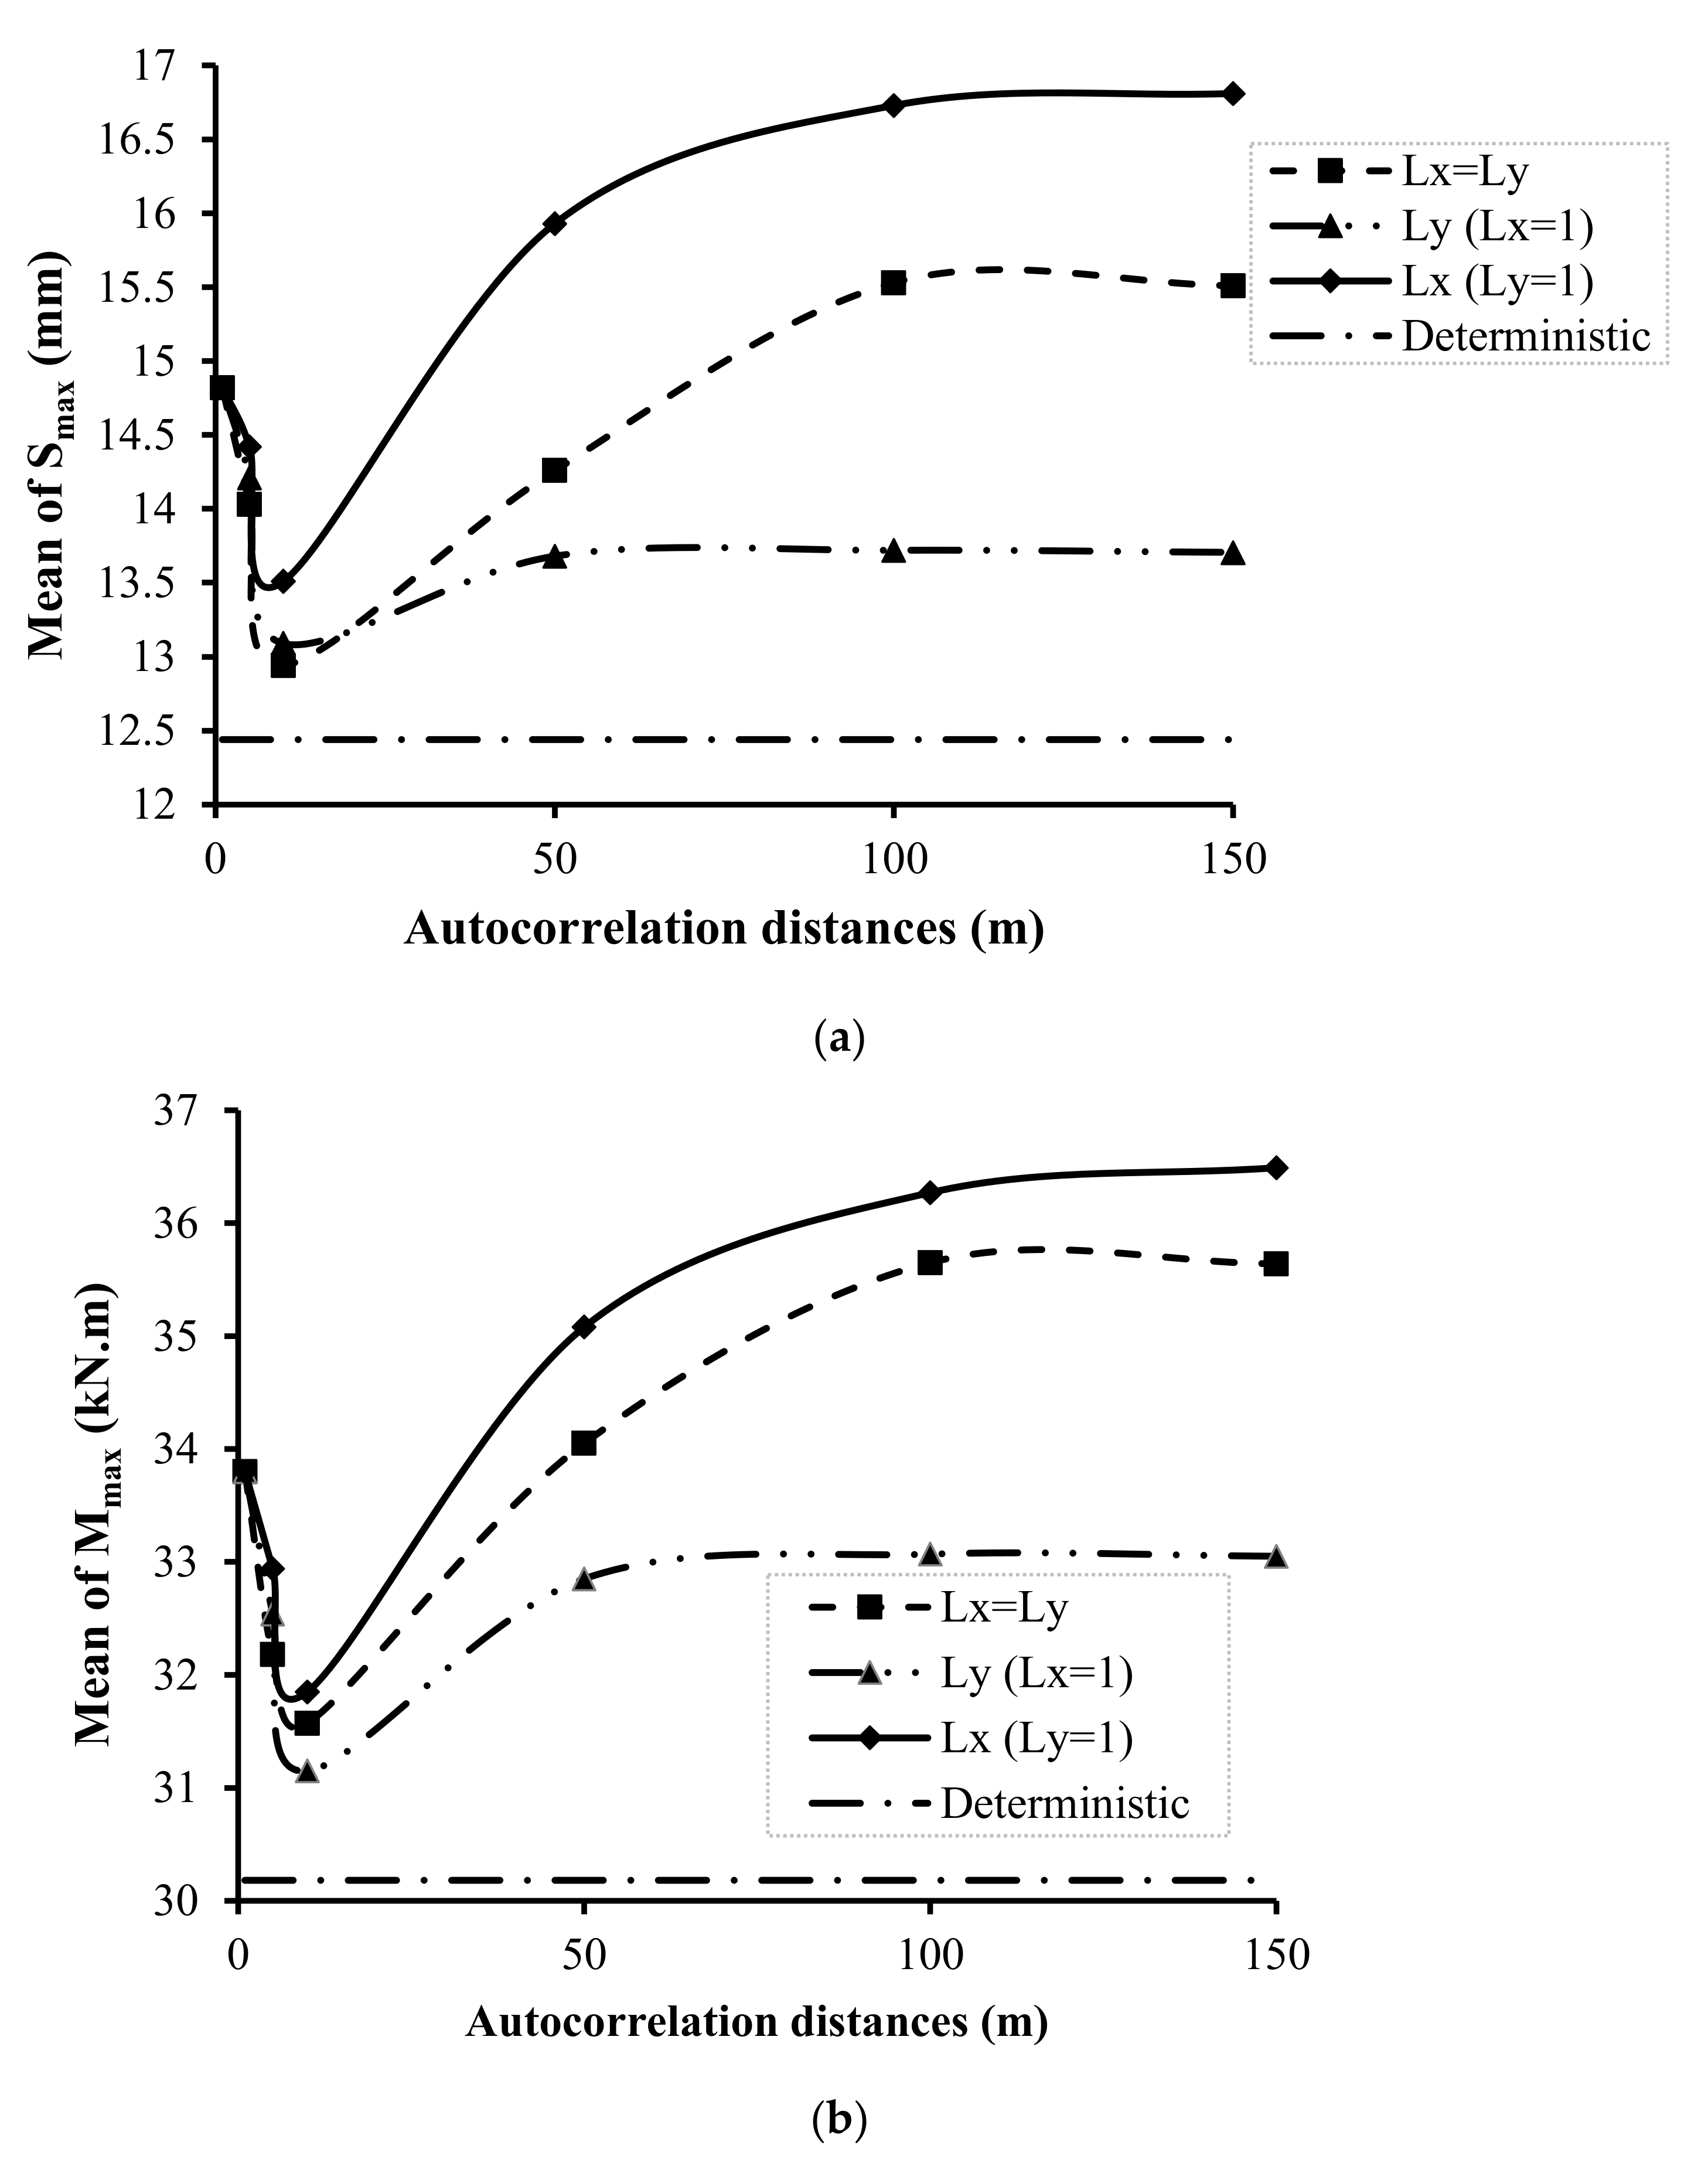
Figure 13.
Variation of the covariance versus the autocorrelation distance. (a) Smax; (b) Mmax.


Table 1.
Soil mass properties.
| MC Model | Value | CYsoil Model | Value |
|---|---|---|---|
| E (Young’s modulus) (MPa) | 150 | Reference elastic tangent shear modulus (MPa) | 58 |
| ν (Poisson ratio) | 0.3 | Reference Elastic tangent bulk modulus (MPa) | 125 |
| φ (friction angle) (degrees) | 37 | Elastic tangent shear modulus | 98 |
| Ψ (dilation angle) (degrees) | 0 | Elastic tangent bulk modulus | 213 |
| C (cohesion) (kPa) | 5 | Reference effective pressure pref (kPa) | 100 |
| k0 (lateral earth pressure factor) | 0.5 | Failure ratio Rf | 0.90 |
| Density (kg/m3) | 1700 | Ultimate friction angle φf (degrees) | 37 |
| Calibration factor β | 2.35 | ||
| Cohesion (kPa) | 5 | ||
| M | Constant (m < 1) | 0.5 |
Table 2.
Mechanical properties of the precast segments.
| Parameter | E (Young’s Modulus) (MPa) | ν (Poisson’s Ratio) | γ (Unit Weight) (kN/m3) |
|---|---|---|---|
| Tunnel Lining | 35000 | 0.2 | 25 |
Table 3.
Influence of the soil parameters on the tunnel behavior.
| Parameters | Reference Value | Variation | |
|---|---|---|---|
| Min | Max | ||
| Young modulus (MPa) | 150 | 120 | 180 |
| Poisson’s ratio | 0.3 | 0.24 | 0.36 |
| Friction angle (°) | 37 | 29.6 | 44.4 |
| Cohesion (kPa) | 5 | 4 | 6 |
| Dilation angle (°) | 0 | 0 | 5 |
| Unit weight (kN/m3) | 17 | 13.6 | 20.4 |
Publisher’s Note: MDPI stays neutral with regard to jurisdictional claims in published maps and institutional affiliations. |
© 2022 by the authors. Licensee MDPI, Basel, Switzerland. This article is an open access article distributed under the terms and conditions of the Creative Commons Attribution (CC BY) license (https://creativecommons.org/licenses/by/4.0/).
Share and Cite
MDPI and ACS Style
Hamrouni, A.; Dias, D.; Guo, X. Behavior of Shallow Circular Tunnels—Impact of the Soil Spatial Variability. Geosciences 2022, 12, 97. https://doi.org/10.3390/geosciences12020097
AMA Style
Hamrouni A, Dias D, Guo X. Behavior of Shallow Circular Tunnels—Impact of the Soil Spatial Variability. Geosciences. 2022; 12(2):97. https://doi.org/10.3390/geosciences12020097
Chicago/Turabian StyleHamrouni, Adam, Daniel Dias, and Xiangfeng Guo. 2022. "Behavior of Shallow Circular Tunnels—Impact of the Soil Spatial Variability" Geosciences 12, no. 2: 97. https://doi.org/10.3390/geosciences12020097
Note that from the first issue of 2016, this journal uses article numbers instead of page numbers. See further details here.