

Not Every Circle Is a Crater: Kettle Hole Size Distributions and Their Implications in Planetary Surface Age Dating

1
Department of Earth, Planetary, and Space Sciences, University of California Los Angeles, 595 Charles Young Drive E, Los Angeles, CA 90095, USA
2
Los Angeles Pierce College, 6201 Winnetka Ave, Woodland Hills, Los Angeles, CA 91367, USA
*
Author to whom correspondence should be addressed.
Geosciences 2023, 13(1), 18; https://doi.org/10.3390/geosciences13010018
Submission received: 31 August 2022
/
Revised: 6 December 2022
/
Accepted: 14 December 2022
/
Published: 10 January 2023
Abstract
:Circular landscape features, including kettle lakes, sinkholes, pingos, calderas, and craters, develop from a variety of different geomorphic processes on Earth. On many rocky extraterrestrial surfaces, including Mars, the most common circular landscape features are craters, and the density of these craters is commonly used to estimate the age of the surface. On planetary bodies where fluvial, volcanic, and glacial geomorphic processes are not present, alternative interpretations of circular features can safely be ignored. However, Mars once hosted an Earth-like climate and many elements of the Martian landscape that are visible today were formed by ancient fluvial, glacial, or volcanic processes. In this work, we focus on the potential presence of postglacial kettle hole depressions on Mars. We explore the size and density distribution of kettle lakes in three analog postglacial landscapes on Earth and discuss the implications for planetary surface age dating if kettles and craters are present together in the landscape on Mars.
1. Introduction
When studying the geologic history of planetary surfaces, it is helpful to estimate the surface age. This can be done relatively, using stratigraphy and geologic context (e.g., [1,2,3]), and has even been done isotopically, using samples returned from the Moon [4,5] and using instruments onboard the Mars Science Laboratory rover Curiosity [6,7]. Most commonly, however, planetary surface ages are estimated using the density of impact craters (hereafter, simply “craters”) [8,9,10]. Older surfaces host more craters, and by comparing the number and size distribution of craters in a given area to production functions that describe the rate at which craters form, the age of a surface can be quantitatively estimated [11,12,13,14].
Crater-based methods of dating planetary surfaces rely on craters being discernible in the available data (i.e., satellite images) and differentiable from other, non-impact-generated circular depressions (e.g., sinkholes, pingos, calderas). Although fresh craters are distinguishable from other features by their sharp topography, characteristic depth-to-diameter ratios, and radially splaying ejecta [15,16,17,18,19], degraded craters may become less easily differentiable over time. Topographic diffusion causes rounding of crater rims, sediment transport fills in crater basins, and surface processes rework the crater ejecta. The processes that drive crater degradation and the processes that create non-impact circular depressions depend on the particular planetary body. For example, volcanic deposition reworks the surface of Venus and circular depressions include calderas and vents as well as impact craters [20]. On Earth, resurfacing occurs over geologically short timescales via aeolian, fluvial, volcanic, and glacial processes, as well as via recycling of tectonic plates. Impact craters can be found on Earth, but so can many other circular depressions, including sinkholes, pingos, calderas, and the topic of this work: kettle holes.
Among the many geomorphologic features associated with glacial landscapes (e.g., drumlins, eskers, moraines; [21]), kettle holes develop when ice blocks, left by a retreating glacier, melt and leave a depression in the surface (Figure 1; [21]). The detached ice blocks sit on the surface and become partially or entirely buried. Later, when the ice melts, a void is left behind, creating a topographic pit. Sometimes called “kettle lakes”, simply “kettles”, or more generally “thermokarst lakes”, kettles vary in morphology depending on the amount of debris in the ice, and whether or how the ice is buried after the glacier retreats [22,23]. They are usually approximately circular, and can have raised rims or be flush with the surrounding plains (Figure 2). One work notably refers to a sub-type of kettles with raised rims as “crater” type kettle holes, highlighting the morphological similarity between some kettles and craters [24]. Another example of crater and kettle confusion comes from the Chiemgau lake depression in Germany. The lake became popularly known as “Chiemgau Impact” until the idea was debunked and the lake demonstrated to be a kettle hole, although some misconceptions still persist [25].
On Earth, kettles can be found in the proglacial high latitudes in such locations as Iceland [26], and high-latitude North America [27,28]. On Mars, kettles have also been hypothesized to be present in northern circumpolar regions [29], as well as at lower latitudes, including in Juventae Chasma [30], Kasei Valles [31], Ares Vallis [32], and Athabasca Valles [33]. On modern Mars, with its thin atmosphere, resurfacing is dominated by aeolian transport at the equatorial and mid-latitudes, and by ice formation at the poles [34]. However, ancient Mars hosted a thicker atmosphere, flowing liquid water, and continental-scale glacial processes [35,36]. Evidence of past and present glacial activity on Mars has been found in geomorphologic (e.g., [37,38,39]) and radar (e.g., [40,41]) surveys of the Martian surface. Landforms on Mars suggest that glaciers were intermittently present during the Amazonian, Hesperian [37,42], and Noachian periods [43]. Cycles of glacial maxima and minima have been identified based on superposition of glacial features [44], and models indicate that changes in obliquity may have influenced the formation and retreat of glaciers [45]. During the late Hesperian, a large, elevated province known as the Tharsis Rise was likely covered by an ice cap [42,46]. As recently as a few million years ago, alpine glaciers were active [44] and glacial deposits down to latitudes of ~30° have been dated to a recent ice age between 2.1–0.4 Mya [47]. Glaciers are still present on Mars today [39,41], but while current conditions on Mars only allow for ice deposition and sublimation, atmospheric conditions in Hesperian and Noachian [35] allowed for the participation of liquid water during the development of the landscape as glaciers retreated, and therefore, likely created Earth-like proglacial landscapes.
Figure 2.
Kettle holes on Earth and Mars. (A) An example of the studied kettle hole features from Study Area C in Nunavut, Canada (see Figure 3 for location). (B) Degraded circular depressions observed in satellite images of Mars in the vicinity of Juventae Chasma where kettle holes on Mars have previously been interpreted [30]. HiRISE image ESP_024373_1895.
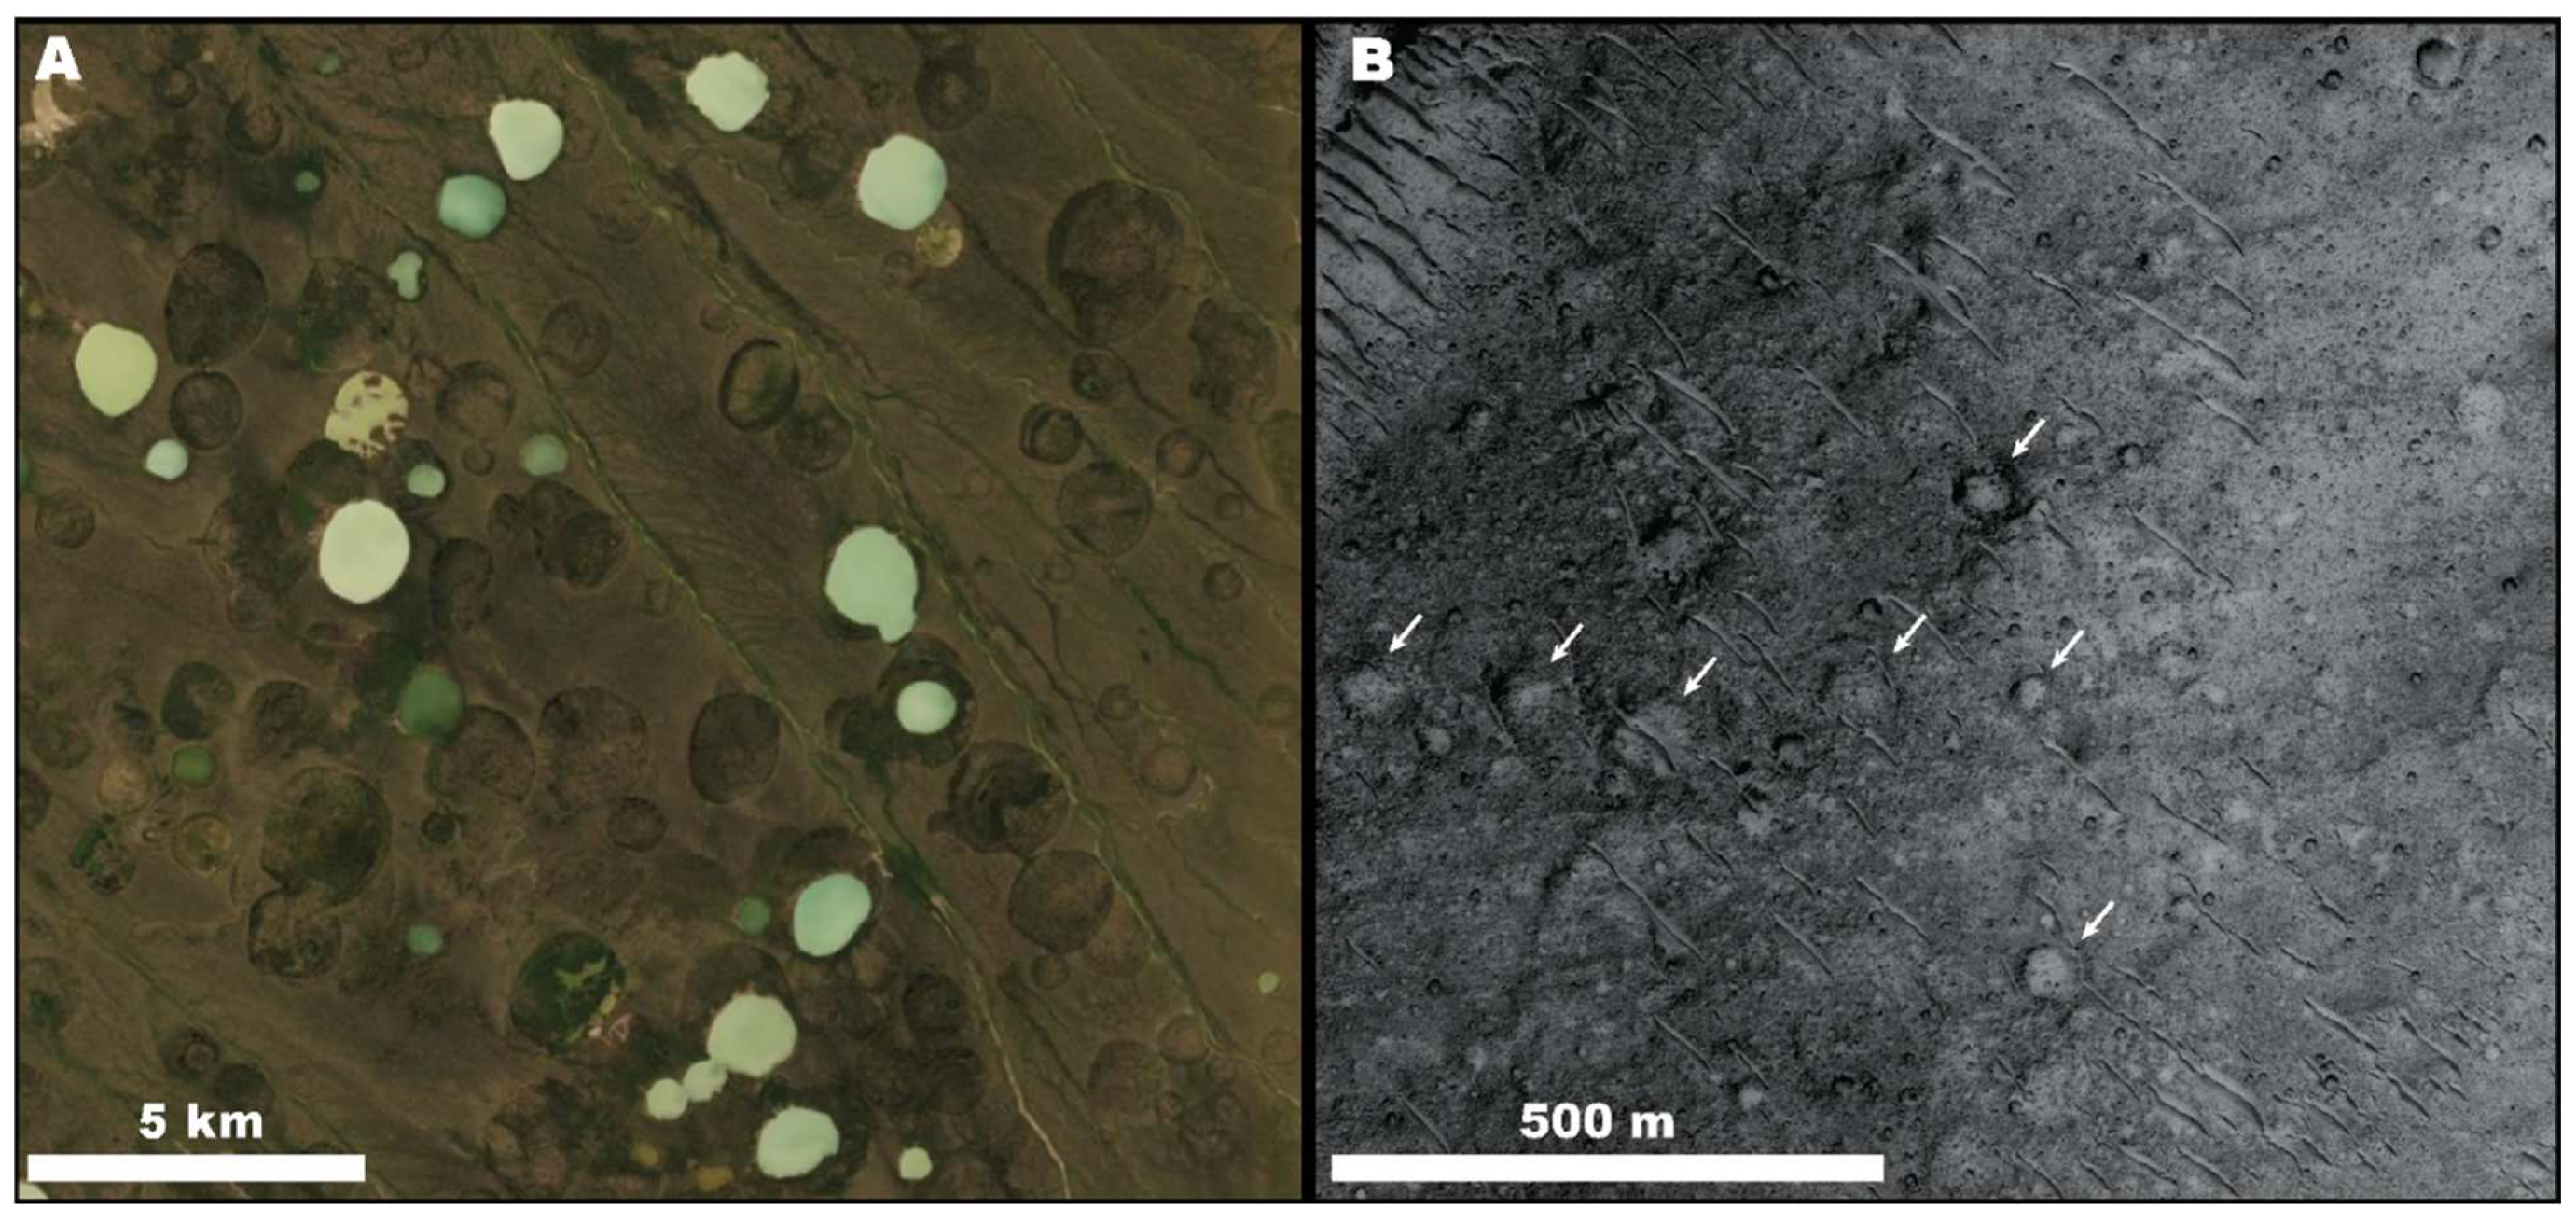
Figure 3.
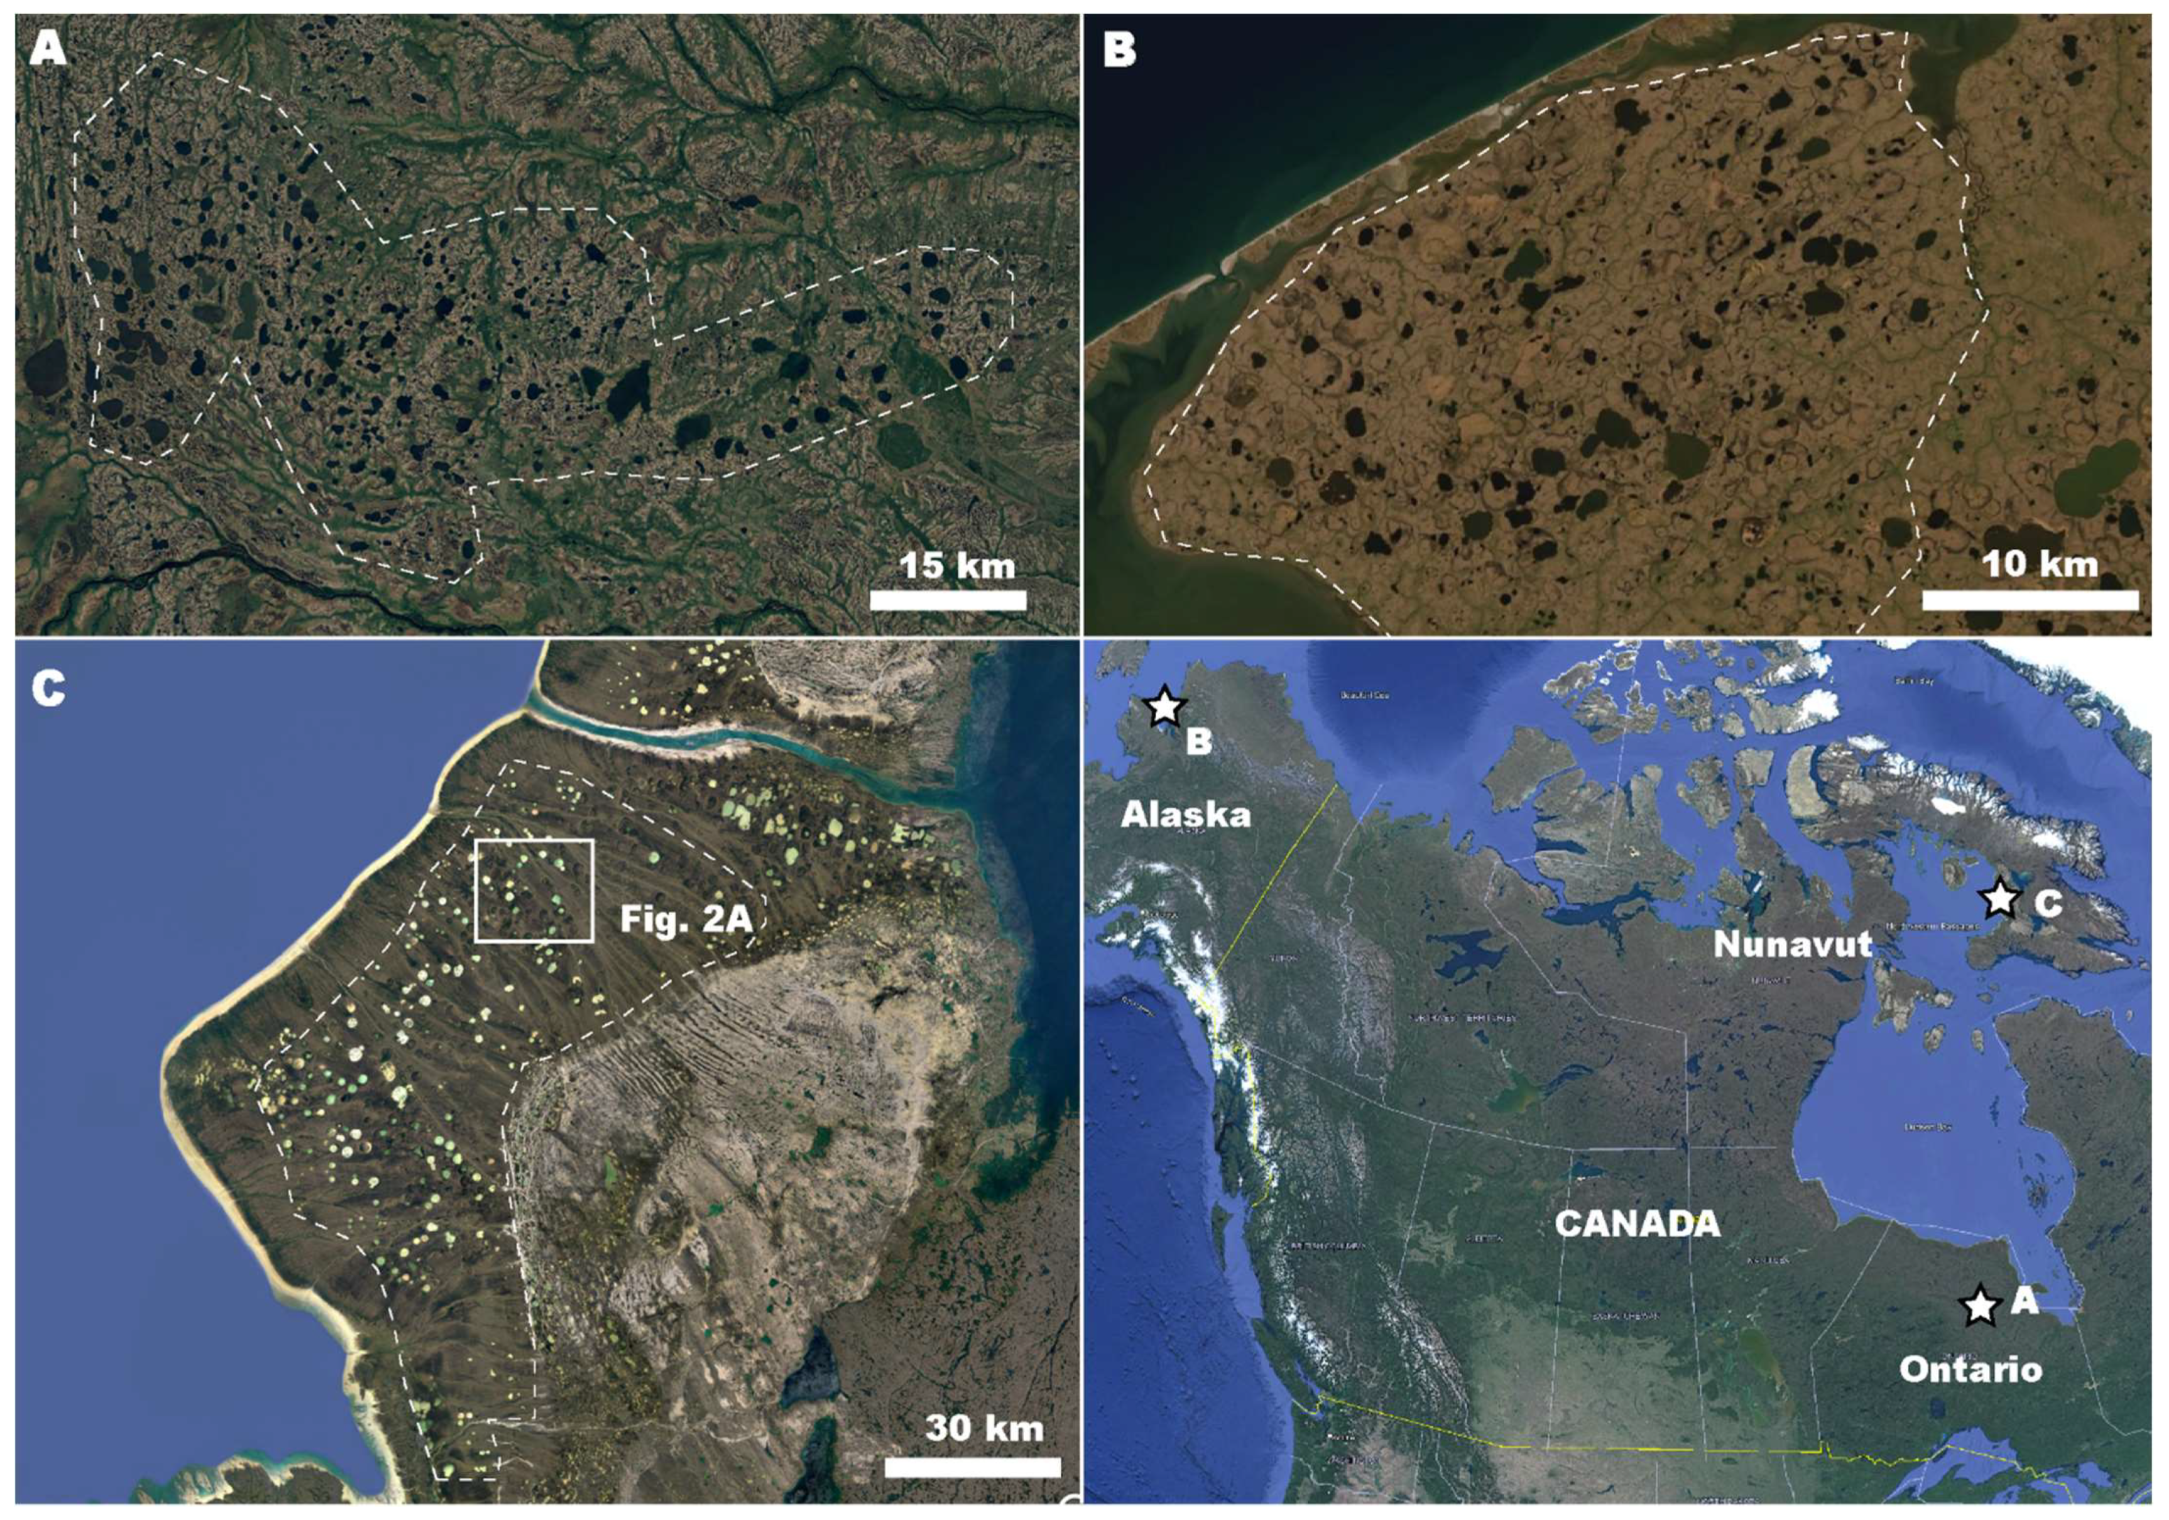
Study areas on Earth. Kettle holes within the dashed lines were measured in each study area. Lower right panel shows the locations of (A–C). (A) Kettle lakes in northern Ontario, Canada. (B) Kettle and thermokarst lakes on Seward Peninsula, Alaska, United States. (C) Kettle lakes on Baffin Island, Nunavut, Canada.
Figure 3.
Study areas on Earth. Kettle holes within the dashed lines were measured in each study area. Lower right panel shows the locations of (A–C). (A) Kettle lakes in northern Ontario, Canada. (B) Kettle and thermokarst lakes on Seward Peninsula, Alaska, United States. (C) Kettle lakes on Baffin Island, Nunavut, Canada.

In this work, we study the size distribution and density of kettle lakes in three previously glaciated plains on Earth. We discuss whether ancient, degraded, kettle holes presumed to be present on Mars could be misidentified as craters, and bound the potential error kettle lakes could contribute to planetary surface age dating.
2. Study Areas and Methods
Three post-glacial terrains in North America were selected for study based on their abundance of approximately circular kettle and thermokarst depressions as established in previous research. The first study area (Study Area A: 53.3° N, 83.0° W; [48]) is located in northern Ontario, Canada, between the Ekwan and Attawapiskat rivers (Figure 3A), and covers a total area of 2656 km2. The second study area (Study Area B: 66.3° N, 165.3° W; [49]) is located on the coast of Seward Peninsula, Alaska, east of the town of Shishmaref, in the Bering Land Bridge National Preserve, and covers a total area of 840 km2 (Figure 3B). The final study area (Study Area C: 66.0° N, 73.5° W; [50]), is located in the coastal southwest region of the Dewey Soper (Isulijarnik) Migratory bird sanctuary of Baffin Island (Qikiqtaaluk) in Nunavut, Canada, and covers a total area of 4428 km2 (Figure 3C).
In each study area, kettle lakes were measured using Google Earth’s (version 7.0) measurement tool and the most recent available satellite images (~15 m/px resolution). Lakes were measured at approximately 1:150,000 scale and the lengths of both the short and long axis of each lake were recorded. The ratio of these axes is reported in Table 1 and demonstrates quantitatively the circularity of the kettle lakes in the study areas. For simplicity, we hereafter refer to the lake “diameter” which in all cases is the measured long axis. We use the long axis instead of the short axis as an upper bound of the potential measured “diameter” in features, and therefore an upper bound on the potential contributed error to a planetary surface age estimate. Both dry and water-filled kettle holes were included in this study.
To bound how degraded kettle holes present on planetary bodies might influence crater-density-based surface age estimates, we evaluated the kettle hole size frequency distributions as though all kettles were interpreted as craters of the measured diameter. We present the size frequency distributions based on the standard formats recommended by the 1979 Crater Analysis Techniques Working Group [51], namely as cumulative and relative size frequency distribution plots (Figure 4). Additionally, we further present the differential size frequency distribution of the kettle hole data. Although not part of the 1979 recommendations, more recent works have shown the utility of these plots in assessing the distribution [52,53,54], and we present this third view for increased diversity. These three standardized formats are widely used (e.g., [52,54,55,56,57]) and can be directly compared to populations of craters measured on Mars in existing literature. Cumulative size distribution functions are generated by plotting the crater diameter D versus the total number of craters, N, with diameter > D, normalized by the area, A, in which the craters were observed (i.e., D vs. N/A). The differential size frequency distribution plot is created by binning D and then plotting the crater diameter of the bin center, Dmid, versus the number of craters in each bin, normalized by the bin width and study area (i.e., Dmid vs. Nbin/(A(Dn − Dn−1))). By convention, the bin size is set to increase by a factor of root-2 at increasing diameters. Finally, the relative size frequency distribution (or “R-plot”) is a derivative of the differential plot but normalized to a Pareto (power law) trend with a slope in log-space of −3 (i.e., proportional to D−3). If the data follow the −3 power law slope, as is expected for populations of craters, the data will converge to a flat line in the R-plot (e.g., [55,58]). The actual value for the power-law slope of the kettle hole distribution was measured using kettle holes <500 m in diameter and separately with kettle holes >1 km in diameter (Table 1). The power-law slope was found by applying a linear regression to the logarithm of the values in the differential distribution (i.e., log10(Nbin/(A(Dn − Dn−1))) as the dependent variable and log10(Dmid) as the independent variable). The slope of this regression represents the power law exponent in the relationship of the form Nbin/(A(Dn − Dn−1)) ≈ cD−m where c is a constant of proportionality and m is the slope of the linear regression in logarithmic space.
To compare the measured kettle distribution with actual crater data from Mars, craters in the interior and immediate environs of Henry crater were measured using a mosaic of images from the Context Camera (6 m/px; [59,60]) onboard the Mars Reconnaissance Orbiter. Craters were measured in a 25,815 km2 square study area centered on Henry crater, a ~170 km diameter crater in Arabia Terra [61,62]. We present actual Martian crater count data rather than generating synthetic data from a Pareto distribution to show a real-world example of variability and imperfect alignment with the −3 power law slope expected for crater distributions (and assumed when creating the R-plot) [51,52].
To understand how kettle holes misidentified as craters might influence a derived surface age, we compared the measured population of kettle holes to isochrons representing the expected population of craters on a surface of a given age [11,63,64]. Isochrons are determined based on an assumed production function describing the history of Martian crater generation with time [63], an assumed saturation equilibrium at which point craters generated obliterate at least one already present crater and the density can no longer increase [65], and an assumed chronology function with defined epochs [66]. By fitting the data to an isochron with a given slope and intercept (adjusted for the formation of secondary craters at small diameters [63,67,68]) the approximate exposure age of the surface can be estimated [63,64,69,70]. In this work, we used the widely used CraterStats software tool (version 2.0) [11,71] to create the cumulative, relative, and differential size frequency distribution plots for both kettle holes in our three study areas and in Henry crater on Mars. We further used the tool to conduct a best fit of the data to isochrons and estimate an age that would be interpreted if the kettle data were erroneously included in a crater dataset. We present the estimated “age” of the kettle hole populations and superimpose the data from Area A on Henry crater measurements (Figure 5) to estimate how surface age estimates could be influenced by the addition of non-crater kettle morphologies. For this last case, we added data from Area A and assumed the study area size of the Henry crater region, analogous to a kettle hold field unnoticed in a large study area. Kolmogorov–Smirnov and t-tests were used to assess the normality of the kettle data and compare study areas to each other.
3. Results
A summary of the measurements made in each study area is given in Table 1. The kettle hole diameters ranged from 12 m to 7 km. Qualitatively, the size frequency distribution of the kettle holes is similar in each of the three study areas, following a power-law relationship that changes slope (exponent) from low to high crater diameters. Quantitatively, we used a Kolmogorov–Smirnov test [72] to test the null hypothesis that the kettle hole measurements from each area are normally distributed. The null hypothesis was rejected with >99.9% confidence (α < 0.001) for all three areas. Using a two-sample Student’s t-test with unequal variance, we tested the null hypothesis that the kettle holes in any two of the three study areas come from populations with equal means [73]. In all three combinations of two study areas, the hypothesis was rejected, suggesting that there is no characteristic mean kettle hole size that defines the size frequency distribution for kettle holes in general, but that it is instead locally controlled.
The cumulative size frequency distribution of kettle holes in each of the three study areas follows the same trend commonly observed in measurements of craters on Mars (Figure 5). Namely that, at large diameters, the distribution is approximately linear (in log-log space) following a power law slope of ~−3. At smaller diameters, this slope shallows and the distribution “rolls over”. The causes of this shallowing in crater distributions and potential causes in the populations of kettles are discussed in the next section, but we note here that the shallowing of the distribution at small diameters is present in both the kettle (Figure 4a) and the Mars data from Henry crater (Figure 4b). The diameter position at which the cumulative size frequency distribution shallows differs across the three terrestrial study areas and Mars. For the kettle measurements, the position is between 150 m and 1 km, whereas in the Henry crater, the shallowing occurs nearer ~30 m. The shallowing at small diameters is highlighted in the relative size frequency distributions (R-plots; Figure 4c,d), which show a sharp downward trend and deviation from the assumed −3 power law for diameters ~<1 km. For diameters >1 km, the kettle hole data are distributed around a horizontal line, similar to the expectation for craters on Mars.
Using only the large diameter craters (>500 m and >1 km), we approximated the slope of the linear portion of the differential size frequency distribution (Figure 4e,f). The results of this analysis are shown in Table 1 and all lie within 1 of the assumed slope for craters of −3, with the exception of >1 km diameter features in Area C which are notably more steeply distributed. Using the >500 km kettle diameters (that approximately parallel the Martian isochrons), we calculated an approximate surface age that would have been estimated if this population of features were assumed to be craters on Mars.
If the observed kettle lakes were present on Mars and assumed to be craters, Study Area A would have an estimated surface age of 4.0 Ga ± 8 Ma, Study Area B an estimated surface age of 3.9 Ga ± 10 Ma, and Study area C an estimated surface age of 4.0 Ga ± 5 Ma. This process was repeated for the measurements of craters on Mars in Henry crater and again for the population of data that is a combination of the Henry crater and Area A data. In the latter case, the addition of the non-crater kettle hole data increased the estimated surface age by 15% from 3.2 Ga to 3.7 Ga.
4. Discussion
The idea that degraded circular depressions on Mars may not all be formed by impacts has been highlighted by previous studies [74,75,76]. In this work, we focus on kettle holes and assume, based on ample evidence of Martian glaciation [33,38] and proposed examples of kettle holes on Mars [30,31], that kettle holes developed on Mars at one time. Allowing for slight differences between Earth and Mars kettle morphologies based on the lower gravity, we further assume that the size frequency distribution of kettles observed on Earth is representative of kettle distributions on Mars, particularly for those formed when Mars had a more Earth-like atmosphere [77].
For regions where kettle holes and craters are both present on Mars, it then becomes necessary to differentiate between the two. Morphological differences noted in the introduction may fade with time, leaving the size and size frequency distribution as potential differentiators. If kettle holes were larger or smaller than typical craters, or confined to a particular size, then features in that size range could be specifically targeted. Similarly, if the size frequency distribution of kettle holes differed significantly from craters, then a mixed population of craters and kettle holes would exhibit a skewed or misshapen distribution that would warn of the inclusion of non-craters (i.e., including kettle measurements would change the slope of the data to be dissimilar from crater isochrons).
However, the range of observed kettle diameters overlaps with the range of crater diameters and does not exhibit a characteristic diameter, making considerations of one diameter or diameter range insufficient for differentiation. Similarly, the size frequency distribution of the kettle hole data, rather than being dissimilarly distributed to Martian craters (e.g., following something other than a power-law relationship with diameter and a slope of −3) matches macro-scale trends in crater distribution. The size range, from meters to kilometers in scale, is analogous to the size range of typical craters, but more importantly, the distributions of size and density parallel the Mars cratering isochrons at diameters > 500 m. Fitting the large kettle diameters to a power law approximation yielded slopes of −3 ± 0.7 in all but one case. This variability is similar to what is found in populations of measured craters on Mars, meaning that if a population of Martian kettle holes was mixed with a population of craters, the combined distribution would not likely be recognizable as erroneous, based on the distribution alone. Superposition of similarly distributed data would drive the estimated surface age older than the actual age but would not change the overall shape of the distribution.
4.1. Small Diameter Kettles and Craters
At diameters <500 m, the kettle holes become less abundant, causing a change in the slope of the distribution that could be diagnostically useful in differentiating these features on Mars. However, the same behavior, a “roll over” in the distribution at small diameters, also appears in small craters on Mars [57,78]. In craters, the flattening of the distribution at small diameters has been attributed to obliteration [78,79] and resolution limitations [57,80]. The exact diameter at which a population of small craters changes slope on Mars varies across the planet and depends on the local resurfacing processes and impacted substrate [79,81]. Secondary craters, craters formed by the material ejected by other crater-forming impacts [67,82], further complicate the use of small crater diameters in planetary surface age dating. Whereas resurfacing processes work to reduce the number of observable small craters with respect to the overall population, secondary crater formation increases the number of non-random, non-primary small craters. Many works have proposed methods of correcting for or incorporating secondary craters into estimates of surface age [63,83,84,85]. As non-random, non-primary, circular depressions in the ground, secondary craters and kettle holes both pose a significant source of uncertainty with respect to surface age dating. Similarly, both features occur at diameters reasonable for primary craters, but their upper limit in diameter is lower than for primary craters over geologic time.
The cause of rollover in the distribution of kettle holes in this work is not evident from the data, but we can speculate about the potential explanation. One notable difference between crater populations and the populations of kettles studied in this work is the position of the rollover in the cumulative distribution. The image resolution (~15 m/px) is approximately an order of magnitude below the diameter at which each of the study site distributions changes slope (Figure 5). This suggests that image resolution is not responsible for the flattening of the kettle distributions. Obliteration could account for the loss of some kettle features but is unlikely in this case. Kettles necessarily form in a single geologic event (the receding of a glacier), and any post-formational obliteration would influence all of the kettle holes similarly. The study areas in this work were chosen for their clarity of exposure, and it is unlikely that obliteration selectively removed only some of the kettle holes. One possible explanation for the size of the kettle holes is a characteristic size of the ice blocks left behind by the glacier. Given that the Student’s t-test rejected the hypothesis that the different study areas reflect populations of similar means, if there is a characteristic block scale and variability defining the kettle size frequency distribution is must be dependent on the particular glacier (height, retreat rate, etc.). An inversion of this idea might one day help determine the properties of glaciers on Mars, but kettle sizes are not characteristic enough to easily distinguish them from craters (either primary or secondary).
4.2. Uncertainty
When measuring craters to determine a potential age, some best practices reduce the uncertainty and improve the reproducibility of results. For example, using a consistent viewing scale and resolution of images while studying the area, as well as defining a geologically distinct (not mixed) surface. Previous work has suggested a method for identifying a minimum area needed to expect a statistically robust estimate of surface age [86]. Even with precautionary measures, one previous work found that trained observers varied in their assessment of an area by plus or minus 10–35% [87].
The results in Figure 5 highlight two scenarios in which, if kettle hole terrains developed after glaciers receded on Mars, the surface age determined when not differentiating between kettles and craters could be significantly overestimated. First, a geologically young surface on which kettles developed (with an actual surface age of ~0.0 Ma). The study areas in this work are analogous to ~1000 km2 areas on Mars, densely populated with kettles, but with actual ages of approximately zero. In this scenario, assuming all kettle holes are craters overestimated the true 0 Ma age by ~4 Ga. This first scenario places a bound on the potential contributed error but assumes a freshly deglaciated surface and a study area focused on the kettle population, an unlikely situation to encounter on present Mars.
Second, the mixed population of Henry crater data and Study Area A measurements represents a situation where data collected from a ~10,000 km2 scale area unknowingly include a ~1000 km2 scale area of kettle-rich terrain. In this example, if the kettle holes are not differentiated, the addition of non-crater measurements increased the estimated age by 15% or ~300 Ma.
4.3. Differentiating Kettle Holes from Craters
Given the magnitude of the potential error contributed to an age estimate by kettle misidentification, it is worth discussing whether mistaking a kettle hole for a crater is a realistic error a human observer could make. Certainly, freshly formed craters and freshly formed kettles will have differentiating features that can be identified even in satellite images (Figure 1). Fresh craters have sharp rims raised above the level of the surrounding plains, and rayed ejecta that extend multiple crater radii from the impact. Kettle holes have flat floors, no or only slight rims, and form in proglacial terrains where other glacial landforms provide differentiating context (e.g., drumlins, kames, eskers, etc., all suggest a glacial origin; [21]). However, surfaces of interest on Mars may be millions or billions of years old. Although fresh craters and fresh kettles may be readily distinguished, millennia of fluvial and aeolian erosion worked to degrade Martian topography of both kettles and craters. The differentiating topography of both features becomes muted, and flat floors develop in the basins from sedimentary infilling. Over time, kettles and craters converge on the same morphology: an approximately circular hole in the ground. Although including a paleo-proglacial terrain in a study area would likely be noticed by a trained observer (e.g., local variability in morphology and density of the features), the potential error is still worth a note of caution. In the case where kettles and craters have been morphologically degraded and are not immediately differentiable, other methods of differentiation must be found. Based on the results of this work, the size frequency distributions of craters and kettles are similar enough that they do not provide a straightforward mechanism of differentiation on their own. Despite the similarities, two differentiating features are notable in the measured distributions: (1) the diameter at which the kettle size frequency distribution changes slope (150 m–1 km) is large with respect to the image resolution, and (2) kettles overpopulate the expected saturation equilibrium density, as would not be expected to occur with craters. More specifically, the R-plot in Figure 4c shows how kettle holes with diameter ~1 km overpopulate and plot above the solid line that represents the saturation equilibrium. Whereas newly formed craters will eventually replace one another in their formation, the density of kettles slightly exceeds this expected value. However, this over-saturation is closely tied to the small and densely populated study area. Diluting the total area observed by even a small amount would overwhelm this signal.
In the absence of a statistical metric for differentiation, the observer must rely heavily on interpretation and geologic context. To some extent, this work has already been done. Geologic maps of Mars exist at global scale [9,88]. Craters >1 km in diameter have been identified and cataloged on Mars and these catalogs include information about the context and preservation state [15,82,89]. For smaller craters, however, the responsibility of geologic interpretation and contextual information rests with the observer.
As with most geomorphological studies of Mars, this work only employed satellite imaging when interpreting and measuring the surface. Other tools and methods to differentiate degraded craters and kettle holes could be used and might provide a reliable distinguisher. For example, craters have a characteristic depth to diameter ratio that could be measured with digital elevation models and likely differs from the depth to diameter ratios of kettle holes [16,90]. However, determining a surface age may involve measuring a large number of input craters, making investigation of features individually or even in groups potentially impractical. Previous research also concluded that kettles are clustered as compared to craters, and a nearest neighbor analysis can be used [74]. Regardless of the method, one must first be aware of the potential need for such a method of differentiating between craters and non-craters, making interpretation of the geologic context the most important first step.
In practice, the assumption that circular features on Mars are craters holds well. Planet-wide, the total number of impact-generated-craters on Mars far exceeds the instances of any other single circular-depression-forming mechanism. Further, in cases where circular depressions are not impact craters (e.g., sublimation pits in polar regions, calderas at the peaks of volcanoes), they can often be distinguished by a trained observer and geologic context. The aim of this work is not to suggest a community-scale oversight or past error, but to advocate caution. With the advent of machine learning [76] and other automated image processing methods [91], simple assumptions that work well most of the time, may lead to significant error in particular cases. Here, we give an example of the potential error that could arise in regions of past glaciation. True, craters and kettles can generally be differentiated, but after more than a billion years of erosion on Mars, when estimating the age of a surface, it is worth remembering: not every circle is a crater.
Author Contributions
Conceptualization, M.D.; data collection D.L.; writing, M.D. and J.M.B. All authors have read and agreed to the published version of the manuscript.
Funding
This research was funded by the NASA Minority Undergraduate Research and Education Program grant 80NSSC18M0124.
Data Availability Statement
Shapefiles delineating the measurements and areas covered in this work are available at https://github.com/GALE-Lab/ [to be posted on acceptance].
Acknowledgments
The authors thank T. Orloff for facilitating the undergraduate participation in this work. The authors also thank four anonymous reviewers for their feedback.
Conflicts of Interest
The authors declare no conflict of interest.
References
- Greeley, R.; Spudis, P.D. Volcanism on mars. Rev. Geophys. 1981, 19, 13–41. [Google Scholar]
- Bernhardt, H.; Hiesinger, H.; Ivanov, M.A.; Ruesch, O.; Erkeling, G.; Reiss, D. Photogeologic mapping and the geologic history of the Hellas basin floor, Mars. Icarus 2016, 264, 407–442. [Google Scholar] [CrossRef]
- Stack, K.M.; Williams, N.R.; Calef, F.; Sun, V.Z.; Williford, K.H.; Farley, K.A.; Eide, S.; Flannery, D.; Hughes, C.; Jacob, S.R.; et al. Photogeologic Map of the Perseverance Rover Field Site in Jezero Crater Constructed by the Mars 2020 Science Team. Space Sci. Rev. 2020, 216, 127. [Google Scholar] [CrossRef] [PubMed]
- Lugmair, G.W.; Marti, K. Lunar initial 143Nd/144Nd: Differential evolution of the lunar crust and mantle. Earth Planet. Sci. Lett. 1978, 39, 349–357. [Google Scholar] [CrossRef]
- Turner, G. Argon-40/argon-39 dating of lunar rock samples. Science 1970, 167, 466–468. [Google Scholar] [CrossRef]
- Farley, K.A.; Hurowitz, J.A.; Grant, J.A.; Miller, H.B.; Arvidson, R.; Beegle, L.; Calef, F.; Conrad, P.G.; Dietrich, W.E.; Eigenbrode, J.; et al. In situ radiometric and exposure age dating of the martian surface. Science 2014, 343, 1247166. [Google Scholar] [CrossRef]
- Martin, P.E.; Farley, K.A.; Malespin, C.A.; Mahaffy, P.R.; Edgett, K.S.; Gupta, S.; Dietrich, W.E.; Malin, M.C.; Stack, K.M.; Vasconcelos, P.M. Billion-year exposure ages in Gale crater (Mars) indicate Mount Sharp formed before the Amazonian period. Earth Planet. Sci. Lett. 2021, 554, 116667. [Google Scholar] [CrossRef]
- Hartmann, W.K.; Malin, M.; McEwen, A.; Carr, M.; Soderblom, L.; Thomas, P.; Danielson, E.; James, P.; Veverka, J. Evidence for recent volcanism on Mars from crater counts. Nature 1999, 397, 586–589. [Google Scholar]
- Tanaka, K.L.; Skinner Jr, J.A.; Dohm, J.M.; Irwin, I.I.I.R.P.; Kolb, E.J.; Fortezzo, C.M.; Platz, T.; Michael, G.G.; Hare, T.M. Geologic map of Mars: U.S. Geological Survey Scientific Investigations Map 3292. 2014. Available online: http://pubs.usgs.gov/sim/3292/ (accessed on 5 December 2022).
- Barlow, N.G. Crater size-frequency distributions and a revised Martian relative chronology. Icarus 1988, 75, 285–305. [Google Scholar] [CrossRef]
- Michael, G.G.; Neukum, G. Planetary surface dating from crater size–frequency distribution measurements: Partial resurfacing events and statistical age uncertainty. Earth Planet. Sci. Lett. 2010, 294, 223–229. [Google Scholar] [CrossRef]
- Neukum, G.; Ivanov, B.A. Crater production function for Mars. In Proceedings of the Lunar and Planetary Science Conference, Houston, TX, USA, 12–16 March 2001; Volume 32. [Google Scholar]
- Ivanov, B.A. Mars/Moon Cratering Rate Ratio Estimates BT—Chronology and Evolution of Mars; Kallenbach, R., Geiss, J., Hartmann, W.K., Eds.; Springer: Dordrecht, The Netherlands, 2001; pp. 87–104. [Google Scholar]
- Neukum, G.; Ivanov, B.A.; Hartmann, W.K. Cratering records in the inner solar system in relation to the lunar reference system. In Chronology and Evolution of Mars; Springer: Berlin/Heidelberg, Germany, 2001; pp. 55–86. [Google Scholar]
- Robbins, S.J.; Hynek, B.M. A new global database of Mars impact craters ≥ 1 km: 1. Database creation, properties, and parameters. J. Geophys. Res. Planets 2012, 117, E06001. [Google Scholar] [CrossRef]
- Melosh, H.J.; Ivanov, B.A. Impact Crater Collapse. Annu. Rev. Earth Planet. Sci. 1999, 27, 385–415. [Google Scholar] [CrossRef]
- Mouginis-Mark, P. Martian fluidized crater morphology: Variations with crater size, latitude, altitude, and target material. J. Geophys. Res. Solid Earth 1979, 84, 8011–8022. [Google Scholar] [CrossRef] [Green Version]
- Barlow, N.G. A review of Martian impact crater ejecta structures and their implications for target properties. Large Meteor. Impacts III 2005, 384, 433–442. [Google Scholar]
- Boyce, J.M.; Garbeil, H. Geometric relationships of pristine Martian complex impact craters, and their implications to Mars geologic history. Geophys. Res. Lett. 2007, 34, L16201. [Google Scholar] [CrossRef]
- Head, J.W.; Crumpler, L.S.; Aubele, J.C.; Guest, J.E.; Saunders, R.S. Venus volcanism: Classification of volcanic features and structures, associations, and global distribution from Magellan data. J. Geophys. Res. Planets 1992, 97, 13153–13197. [Google Scholar] [CrossRef] [Green Version]
- Benn, D.I.; Evans, D.J.A. Glaciers & Glaciation; Routledge: London, UK, 2014; ISBN 0203785010. [Google Scholar]
- Maizels, J.K. Experiments on the origin of kettle-holes. J. Glaciol. 1977, 18, 291–303. [Google Scholar] [CrossRef] [Green Version]
- Fay, H. Formation of kettle holes following a glacial outburst flood (jökulhlaup), Skeiðarársandur. In The Extremes of the Extremes: Extraordinary Floods; International Assn of Hydrological Sciences: Wallingford, UK, 2002; Volume 205. [Google Scholar]
- Maizels, J. Boulder ring structures produced during jökulhlaup flows: Origin and hydraulic significance. Geogr. Ann. Ser. A Phys. Geogr. 1992, 74, 21–33. [Google Scholar] [CrossRef]
- Huber, R.; Darga, R.; Lauterbach, H. Der späteiszeitliche Tüttensee-Komplex als Ergebnis der Abschmelzgeschichte am Ostrand des Chiemsee-Gletschers und sein Bezug zum „Chiemgau Impakt “(Landkreis Traunstein, Oberbayern). E&G Quat. Sci. J. 2020, 69, 93–120. [Google Scholar]
- Price, R.J. Moraines, sandar, kames and eskers near Breidamerkurjökull, Iceland. Trans. Inst. Br. Geogr. 1969, 46, 17–43. [Google Scholar] [CrossRef]
- Hamilton, T.D. Glacial Geology of the Toolik Lake and Upper Kuparuk River Regions; University of Alaska, Institute of Arctic Biology: Fairbanks, AK, USA, 2003. [Google Scholar]
- Campbell, D.R.; Duthie, H.C.; Warner, B.G. Post-glacial development of a kettle-hole peatland in southern Ontario. Ecoscience 1997, 4, 404–418. [Google Scholar] [CrossRef]
- Fishbaugh, K.E.; Head, J.W., III. North polar region of Mars: Topography of circumpolar deposits from Mars Orbiter Laser Altimeter (MOLA) data and evidence for asymmetric retreat of the polar cap. J. Geophys. Res. Planets 2000, 105, 22455–22486. [Google Scholar] [CrossRef]
- Chapman, M.G.; Gudmundsson, M.T.; Russell, A.J.; Hare, T.M. Possible Juventae Chasma subice volcanic eruptions and Maja Valles ice outburst floods on Mars: Implications of Mars Global Surveyor crater densities, geomorphology, and topography. J. Geophys. Res. Planets 2003, 108. [Google Scholar] [CrossRef] [Green Version]
- Woodworth-Lynas, C.; Guigné, J. Ice Keel Scour Marks on Mars: Evidence for Floating and Grounding Ice Floes in Kasei Valles. Oceanography 2003, 16, 90–97. [Google Scholar] [CrossRef]
- Warner, N.; Gupta, S.; Lin, S.-Y.; Kim, J.-R.; Muller, J.-P.; Morley, J. Late Noachian to Hesperian climate change on Mars: Evidence of episodic warming from transient crater lakes near Ares Vallis. J. Geophys. Res. Planets 2010, 115. [Google Scholar] [CrossRef]
- Gaidos, E.; Marion, G. Geological and geochemical legacy of a cold early Mars. J. Geophys. Res. Planets 2003, 108. [Google Scholar] [CrossRef]
- Diniega, S.; Bramson, A.M.; Buratti, B.; Buhler, P.; Burr, D.M.; Chojnacki, M.; Conway, S.J.; Dundas, C.M.; Hansen, C.J.; McEwen, A.S. Modern Mars’ geomorphological activity, driven by wind, frost, and gravity. Geomorphology 2021, 380, 107627. [Google Scholar] [CrossRef]
- Wordsworth, R.D. The Climate of Early Mars. Annu. Rev. Earth Planet. Sci. 2016, 44, 381–408. [Google Scholar] [CrossRef] [Green Version]
- Irwin, R.P.; Howard, A.D.; Craddock, R.A.; Moore, J.M. An intense terminal epoch of widespread fluvial activity on early Mars: 2. Increased runoff and paleolake development. J. Geophys. Res. 2005, 110. [Google Scholar] [CrossRef] [Green Version]
- Baker, V.R.; Strom, R.G.; Gulick, V.C.; Kargel, J.S.; Komatsu, G.; Kale, V.S. Ancient oceans, ice sheets and the hydrological cycle on Mars. Nature 1991, 352, 589–594. [Google Scholar] [CrossRef]
- Head, J.W.; Marchant, D.R.; Agnew, M.C.; Fassett, C.I.; Kreslavsky, M.A. Extensive valley glacier deposits in the northern mid-latitudes of Mars: Evidence for Late Amazonian obliquity-driven climate change. Earth Planet. Sci. Lett. 2006, 241, 663–671. [Google Scholar] [CrossRef]
- Souness, C.; Hubbard, B.; Milliken, R.E.; Quincey, D. An inventory and population-scale analysis of martian glacier-like forms. Icarus 2012, 217, 243–255. [Google Scholar] [CrossRef]
- Putzig, N.E.; Smith, I.B.; Perry, M.R.; Foss, F.J.; Campbell, B.A.; Phillips, R.J.; Seu, R. Three-dimensional radar imaging of structures and craters in the Martian polar caps. Icarus 2018, 308, 138–147. [Google Scholar] [CrossRef]
- Smith, I.B.; Schlegel, N.-J.; Larour, E.; Isola, I.; Buhler, P.B.; Putzig, N.E.; Greve, R. Carbon Dioxide Ice Glaciers at the South Pole of Mars. J. Geophys. Res. Planets 2022, 127, e2022JE007193. [Google Scholar] [CrossRef]
- Yin, A.; Moon, S.; Day, M. Landform evolution of Oudemans crater and its bounding plateau plains on Mars: Geomorphological constraints on the Tharsis ice-cap hypothesis. Icarus 2021, 360, 114332. [Google Scholar] [CrossRef]
- Boatwright, B.D.; Head, J.W. A Noachian Proglacial Paleolake on Mars: Fluvial Activity and Lake Formation within a Closed-source Drainage Basin Crater and Implications for Early Mars Climate. Planet. Sci. J. 2021, 2, 52. [Google Scholar] [CrossRef]
- Hepburn, A.J.; Ng, F.S.L.; Livingstone, S.J.; Holt, T.O.; Hubbard, B. Polyphase Mid-Latitude Glaciation on Mars: Chronology of the Formation of Superposed Glacier-Like Forms from Crater-Count Dating. J. Geophys. Res. Planets 2020, 125, e2019JE006102. [Google Scholar] [CrossRef] [Green Version]
- Forget, F.; Haberle, R.M.; Montmessin, F.; Levrard, B.; Head, J.W. Formation of Glaciers on Mars by Atmospheric Precipitation at High Obliquity. Science 2006, 311, 368–371. [Google Scholar] [CrossRef]
- Kite, E.S.; Hindmarsh, R.C.A. Did ice streams shape the largest channels on Mars? Geophys. Res. Lett. 2007, 34. [Google Scholar] [CrossRef] [Green Version]
- Head, J.W.; Mustard, J.F.; Kreslavsky, M.A.; Milliken, R.E.; Marchant, D.R. Recent ice ages on Mars. Nature 2003, 426, 797–802. [Google Scholar] [CrossRef]
- Boissonneau, A.N. Glacial history of northeastern Ontario II. The Timiskaming–Algoma area. Can. J. Earth Sci. 1968, 5, 97–109. [Google Scholar] [CrossRef]
- Kaufman, D.S.; Hopkins, D.M. Glacial History of the Seward Peninsula; AAPG: Tulsa, OK, USA, 1986. [Google Scholar]
- King, C.A.M.; Buckley, J.T. Geomorphological investigations in west-central Baffin Island, NWT, Canada. Arct. Alp. Res. 1969, 1, 105–119. [Google Scholar] [CrossRef]
- Group, C.A.T.W. Standard techniques for presentation and analysis of crater size-frequency data. Icarus 1979, 37, 467–474. [Google Scholar]
- Robbins, S.J.; Riggs, J.D.; Weaver, B.P.; Bierhaus, E.B.; Chapman, C.R.; Kirchoff, M.R.; Singer, K.N.; Gaddis, L.R. Revised recommended methods for analyzing crater size-frequency distributions. Meteorit. Planet. Sci. 2018, 53, 891–931. [Google Scholar] [CrossRef]
- Robbins, S.J.; Singer, K.N. Pluto and Charon Impact Crater Populations: Reconciling Different Results. Planet. Sci. J. 2021, 2, 192. [Google Scholar] [CrossRef]
- Landis, M.E.; Byrne, S.; Daubar, I.J.; Herkenhoff, K.E.; Dundas, C.M. A revised surface age for the North Polar Layered Deposits of Mars. Geophys. Res. Lett. 2016, 43, 3060–3068. [Google Scholar] [CrossRef] [Green Version]
- Strom, R.G.; Malhotra, R.; Xiao, Z.-Y.; Ito, T.; Yoshida, F.; Ostrach, L.R. The inner solar system cratering record and the evolution of impactor populations. Res. Astron. Astrophys. 2015, 15, 407. [Google Scholar] [CrossRef] [Green Version]
- Malin, M.C.; Edgett, K.S.; Posiolova, L.V.; McColley, S.M.; Dobrea, E.Z.N. Present-day impact cratering rate and contemporary gully activity on Mars. Science 2006, 314, 1573–1577. [Google Scholar] [CrossRef]
- Daubar, I.J.; McEwen, A.S.; Byrne, S.; Kennedy, M.R.; Ivanov, B. The current martian cratering rate. Icarus 2013, 225, 506–516. [Google Scholar] [CrossRef]
- Strom, R.G.; Malhotra, R.; Ito, T.; Yoshida, F.; Kring, D.A. The origin of planetary impactors in the inner solar system. Science 2005, 309, 1847–1850. [Google Scholar] [CrossRef] [Green Version]
- Malin, M.C.; Bell, J.F.; Cantor, B.A.; Caplinger, M.A.; Calvin, W.M.; Clancy, R.T.; Edgett, K.S.; Edwards, L.; Haberle, R.M.; James, P.B.; et al. Context Camera Investigation on board the Mars Reconnaissance Orbiter. J. Geophys. Res. Planets 2007, 112. [Google Scholar] [CrossRef] [Green Version]
- Dickson, J.L.; Kerber, L.A.; Fassett, C.I.; Ehlmann, B.L. A Global, Blended CTX Mosaic of Mars with Vectorized Seam Mapping: A New Mosaicking Pipeline Using Principles of Non-Destructive Image Editing. In Proceedings of the Lunar and Planetary Science Conference, The Woodlands, TX, USA, 19–23 March 2018; Volume 49, pp. 1–2. [Google Scholar]
- Day, M.D.; Catling, D.C. Potential aeolian deposition of intra-crater layering: A case study of Henry crater, Mars. GSA Bull. 2019, 132, 608–616. [Google Scholar] [CrossRef]
- Zimbelman, J.R. Henry Crater, Mars: Thick, Layered Deposit Preserved on a Crater Floor in the Martian Highlands. In Proceedings of the Lunar and Planetary Science Conference, Houston, TX, USA, 12–16 March 1990; Volume 21. [Google Scholar]
- Hartmann, W.K.; Daubar, I.J. Martian cratering 11. Utilizing decameter scale crater populations to study Martian history. Meteorit. Planet. Sci. 2017, 52, 493–510. [Google Scholar] [CrossRef]
- Hartmann, W.K. Martian cratering 8: Isochron refinement and the chronology of Mars. Icarus 2005, 174, 294–320. [Google Scholar] [CrossRef]
- Hartmann, W.K. Does crater “saturation equilibrium” occur in the solar system? Icarus 1984, 60, 56–74. [Google Scholar] [CrossRef]
- Michael, G.G. Planetary surface dating from crater size–frequency distribution measurements: Multiple resurfacing episodes and differential isochron fitting. Icarus 2013, 226, 885–890. [Google Scholar] [CrossRef]
- Bierhaus, E.B.; McEwen, A.S.; Robbins, S.J.; Singer, K.N.; Dones, L.; Kirchoff, M.R.; Williams, J. Secondary craters and ejecta across the solar system: Populations and effects on impact-crater–based chronologies. Meteorit. Planet. Sci. 2018, 53, 638–671. [Google Scholar] [CrossRef] [Green Version]
- Calef III, F.J.; Herrick, R.R.; Sharpton, V.L. Geomorphic analysis of small rayed craters on Mars: Examining primary versus secondary impacts. J. Geophys. Res. Planets 2009, 114, E10007. [Google Scholar] [CrossRef]
- Hartmann, W.K. Martian cratering III: Theory of crater obliteration. Icarus 1971, 15, 410–428. [Google Scholar] [CrossRef]
- Hartmann, W.K. Martian cratering VI: Crater count isochrons and evidence for recent volcanism from Mars Global Surveyor. Meteorit. Planet. Sci. 1999, 34, 167–177. [Google Scholar] [CrossRef]
- Platz, T.; Michael, G.; Tanaka, K.L.; Skinner, J.A.; Fortezzo, C.M. Crater-based dating of geological units on Mars: Methods and application for the new global geological map. Icarus 2013, 225, 806–827. [Google Scholar] [CrossRef]
- Lilliefors, H.W. On the Kolmogorov-Smirnov test for normality with mean and variance unknown. J. Am. Stat. Assoc. 1967, 62, 399–402. [Google Scholar] [CrossRef]
- Ruxton, G.D. The unequal variance t-test is an underused alternative to Student’s t-test and the Mann–Whitney U test. Behav. Ecol. 2006, 17, 688–690. [Google Scholar] [CrossRef]
- Burr, D.M.; Bruno, B.C.; Lanagan, P.D.; Glaze, L.S.; Jaeger, W.L.; Soare, R.J.; Wan Bun Tseung, J.-M.; Skinner, J.A.; Baloga, S.M. Mesoscale raised rim depressions (MRRDs) on Earth: A review of the characteristics, processes, and spatial distributions of analogs for Mars. Planet. Space Sci. 2009, 57, 579–596. [Google Scholar] [CrossRef]
- Soare, R.; Osinski, G.; Roehm, C. Thermokarst lakes and ponds on Mars in the very recent (late Amazonian) past. Earth Planet. Sci. Lett. 2008, 272, 382–393. [Google Scholar] [CrossRef]
- Lee, C. Automated crater detection on Mars using deep learning. Planet. Space Sci. 2019, 170, 16–28. [Google Scholar] [CrossRef] [Green Version]
- Schmidt, F.; Way, M.J.; Costard, F.; Bouley, S.; Séjourné, A.; Aleinov, I. Circumpolar ocean stability on Mars 3 Gy ago. Proc. Natl. Acad. Sci. USA 2022, 119, e2112930118. [Google Scholar] [CrossRef]
- Smith, A.R.; Gillespie, D.R.; Montgomery, M.R. Efect of obliteration on crater-count chronologies for Martian surfaces. Geophys. Res. Lett. 2008, 35. [Google Scholar] [CrossRef] [Green Version]
- Chapman, C.R.; Jones, K.L. Cratering and obliteration history of Mars. Annu. Rev. Earth Planet. Sci. 1977, 5, 515–538. [Google Scholar] [CrossRef]
- Williams, J.-P.; Pathare, A.V.; Aharonson, O. The production of small primary craters on Mars and the Moon. Icarus 2014, 235, 23–36. [Google Scholar] [CrossRef] [Green Version]
- Dundas, C.M.; Keszthelyi, L.P.; Bray, V.J.; McEwen, A.S. Role of material properties in the cratering record of young platy-ridged lava on Mars. Geophys. Res. Lett. 2010, 37. [Google Scholar] [CrossRef]
- Robbins, S.J.; Hynek, B.M. The secondary crater population of Mars. Earth Planet. Sci. Lett. 2014, 400, 66–76. [Google Scholar] [CrossRef]
- McEwen, A.S.; Preblich, B.S.; Turtle, E.P.; Artemieva, N.A.; Golombek, M.P.; Hurst, M.; Kirk, R.L.; Burr, D.M.; Christensen, P.R. The rayed crater Zunil and interpretations of small impact craters on Mars. Icarus 2005, 176, 351–381. [Google Scholar] [CrossRef]
- McEwen, A.S.; Bierhaus, E.B. The importance of secondary cratering to age constraints on planetary surfaces. Annu. Rev. Earth Planet. Sci. 2006, 34, 535–567. [Google Scholar] [CrossRef] [Green Version]
- Powell, T.M.; Rubanenko, L.; Williams, J.-P.; Paige, D.A. Chapter 6—The role of secondary craters on Martian crater chronology. In Mars Geological Enigmas; Soare, R.J., Conway, S.J., Williams, J.-P., Oehler, D.Z., Eds.; Elsevier: Amsterdam, The Netherlands, 2021; pp. 123–145. ISBN 978-0-12-820245-6. [Google Scholar]
- Warner, N.H.; Gupta, S.; Calef, F.; Grindrod, P.; Boll, N.; Goddard, K. Minimum effective area for high resolution crater counting of martian terrains. Icarus 2015, 245, 198–240. [Google Scholar] [CrossRef]
- Robbins, S.J.; Antonenko, I.; Kirchoff, M.R.; Chapman, C.R.; Fassett, C.I.; Herrick, R.R.; Singer, K.; Zanetti, M.; Lehan, C.; Huang, D. The variability of crater identification among expert and community crater analysts. Icarus 2014, 234, 109–131. [Google Scholar] [CrossRef] [Green Version]
- Scott, D.H.; Tanaka, K.L. Geologic Map of the Western Equatorial Region of Mars; US Geological Survey: Reston, VA, USA, 1986. [Google Scholar]
- Barlow, N.G. Impact craters in the northern hemisphere of Mars: Layered ejecta and central pit characteristics. Meteorit. Planet. Sci. 2006, 41, 1425–1436. [Google Scholar] [CrossRef]
- Cintala, M.J.; Head, J.W.; Mutch, T.A. Martian crater depth/diameter relationships-Comparison with the moon and Mercury. In Proceedings of the Lunar and Planetary Science Conference, Houston, TX, USA, 15–19 March 1976; Volume 7, pp. 3575–3587. [Google Scholar]
- Michael, G.G. Coordinate registration by automated crater recognition. Planet. Space Sci. 2003, 51, 563–568. [Google Scholar] [CrossRef]
Figure 1.
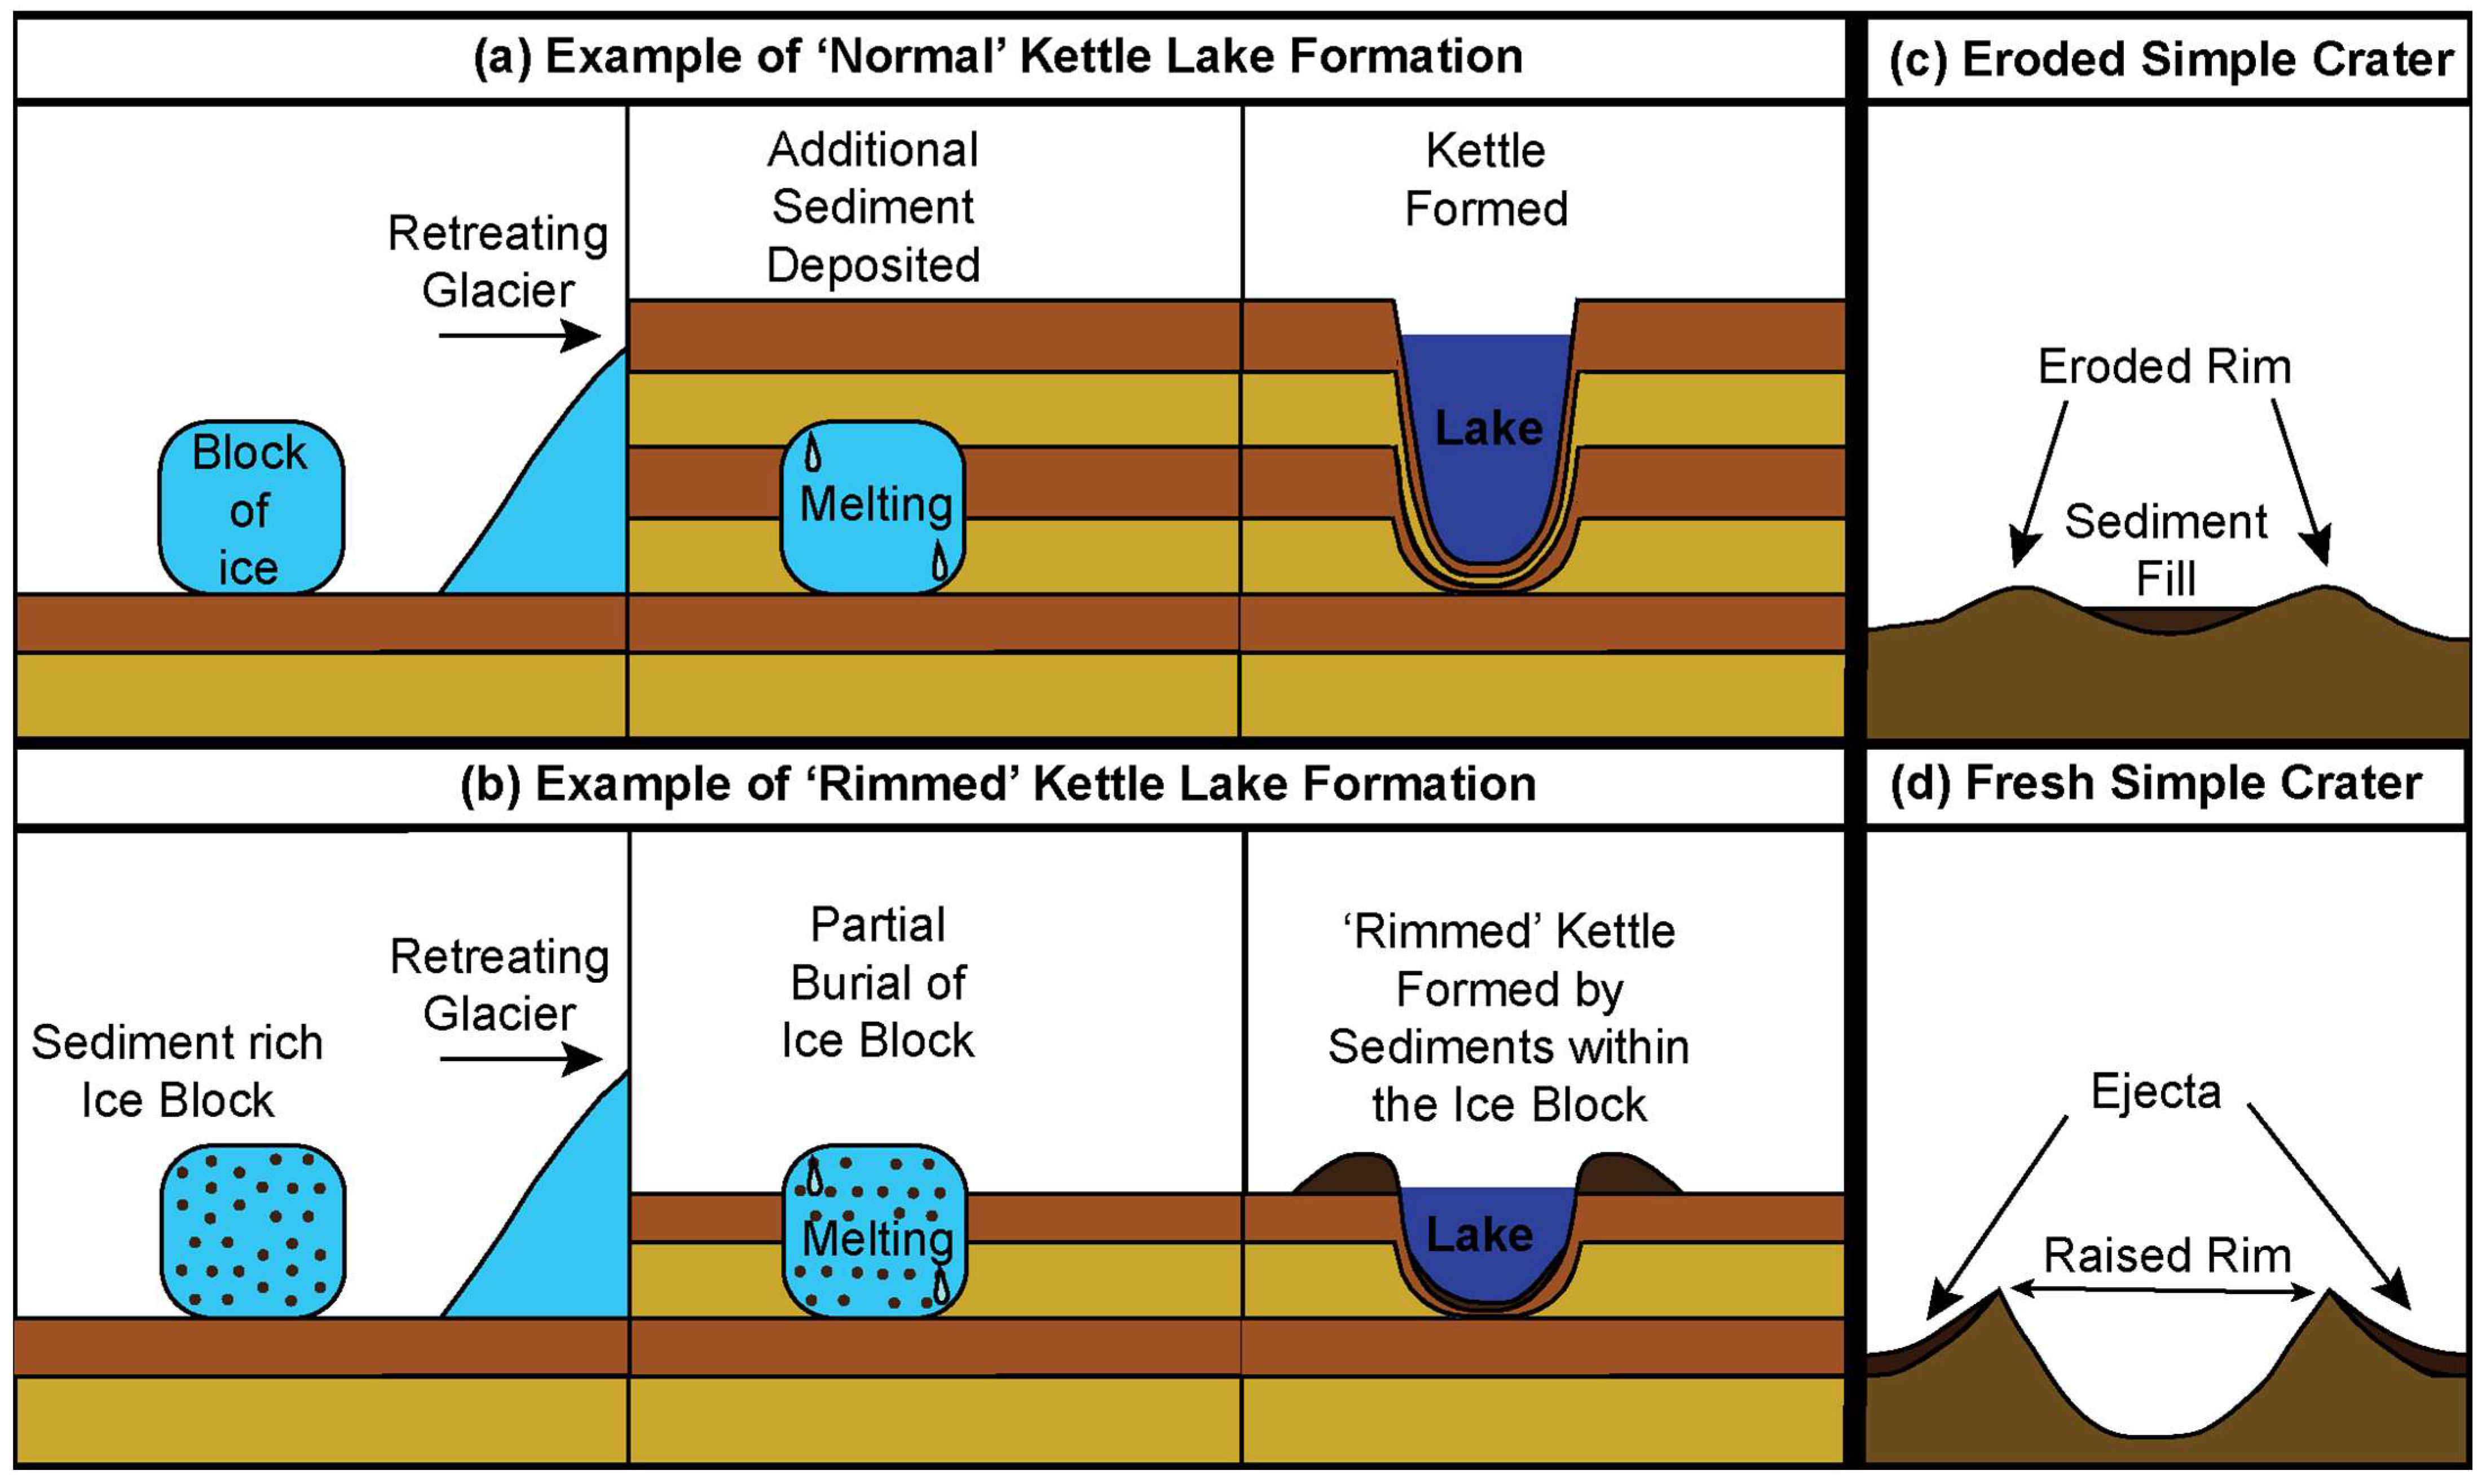
Schematic comparison between kettle holes and craters. (a,b) Kettle hole formation. Kettle holes form when blocks of ice left behind by a retreating glacier are buried by sediment (brown and yellow layers), and then melt. The ice may be entirely (a) or partially (b) buried and may contain little (a) or significant (b) sediment in the block interior. When the ice block melts, the surrounding and overlying sediment collapses, forming a local pit that is often filled with water. In cases where sediment was contained within the block of ice, a raised rim may form around the margins of the kettle hole or lake (b). Craters also form local depressions of a similar scale to kettle holes (c,d). Simple craters (as opposed to complex craters with central uplift peaks, not shown) form depressions with respect to the surrounding topography and have raised rims (d). These rims may become degraded (more rounded, lower relief) over time, and sediment infilling of the crater can change the depth-to-diameter ratio and give the crater a flat floor (c). The formation mechanisms of craters and kettle holes are distinct, but significant morphological overlap exists between the two resulting features.
Figure 1.
Schematic comparison between kettle holes and craters. (a,b) Kettle hole formation. Kettle holes form when blocks of ice left behind by a retreating glacier are buried by sediment (brown and yellow layers), and then melt. The ice may be entirely (a) or partially (b) buried and may contain little (a) or significant (b) sediment in the block interior. When the ice block melts, the surrounding and overlying sediment collapses, forming a local pit that is often filled with water. In cases where sediment was contained within the block of ice, a raised rim may form around the margins of the kettle hole or lake (b). Craters also form local depressions of a similar scale to kettle holes (c,d). Simple craters (as opposed to complex craters with central uplift peaks, not shown) form depressions with respect to the surrounding topography and have raised rims (d). These rims may become degraded (more rounded, lower relief) over time, and sediment infilling of the crater can change the depth-to-diameter ratio and give the crater a flat floor (c). The formation mechanisms of craters and kettle holes are distinct, but significant morphological overlap exists between the two resulting features.

Figure 4.
Size frequency distribution plots showing the populations of kettle holes in this study and craters in the Henry crater Martian study area. The cumulative size frequency distribution (a,b), was used to compare the feature distributions to Martian surface age isochrons and estimate a surface exposure age, assuming all the measured features were interpreted as craters. Ages for the kettle hole study areas are shown in (a). In (b), we show both actual Martian craters measured in Henry crater (Figure 5), and the result of mixing that population with the kettle hole depressions measured in Study Area A. The relative size frequency distribution (c,d), also called an “R-plot” emphasizes deviations from the assumed −3 power-law exponent. In particular, at small diameters, the features under-fit this assumed distribution. The R-plot is derived from the differential size frequency distribution (e,f) in which features are binned in intervals of increasing size, scaling by the square root of two. Epochs from Michael (2013), Equilibrium Function (EF) from Hartmann (1984), Production Function (PF) from Hartmann and Daubar (2017), Chronology Function (CF) from Hartmann (2005) and Michael (2013).
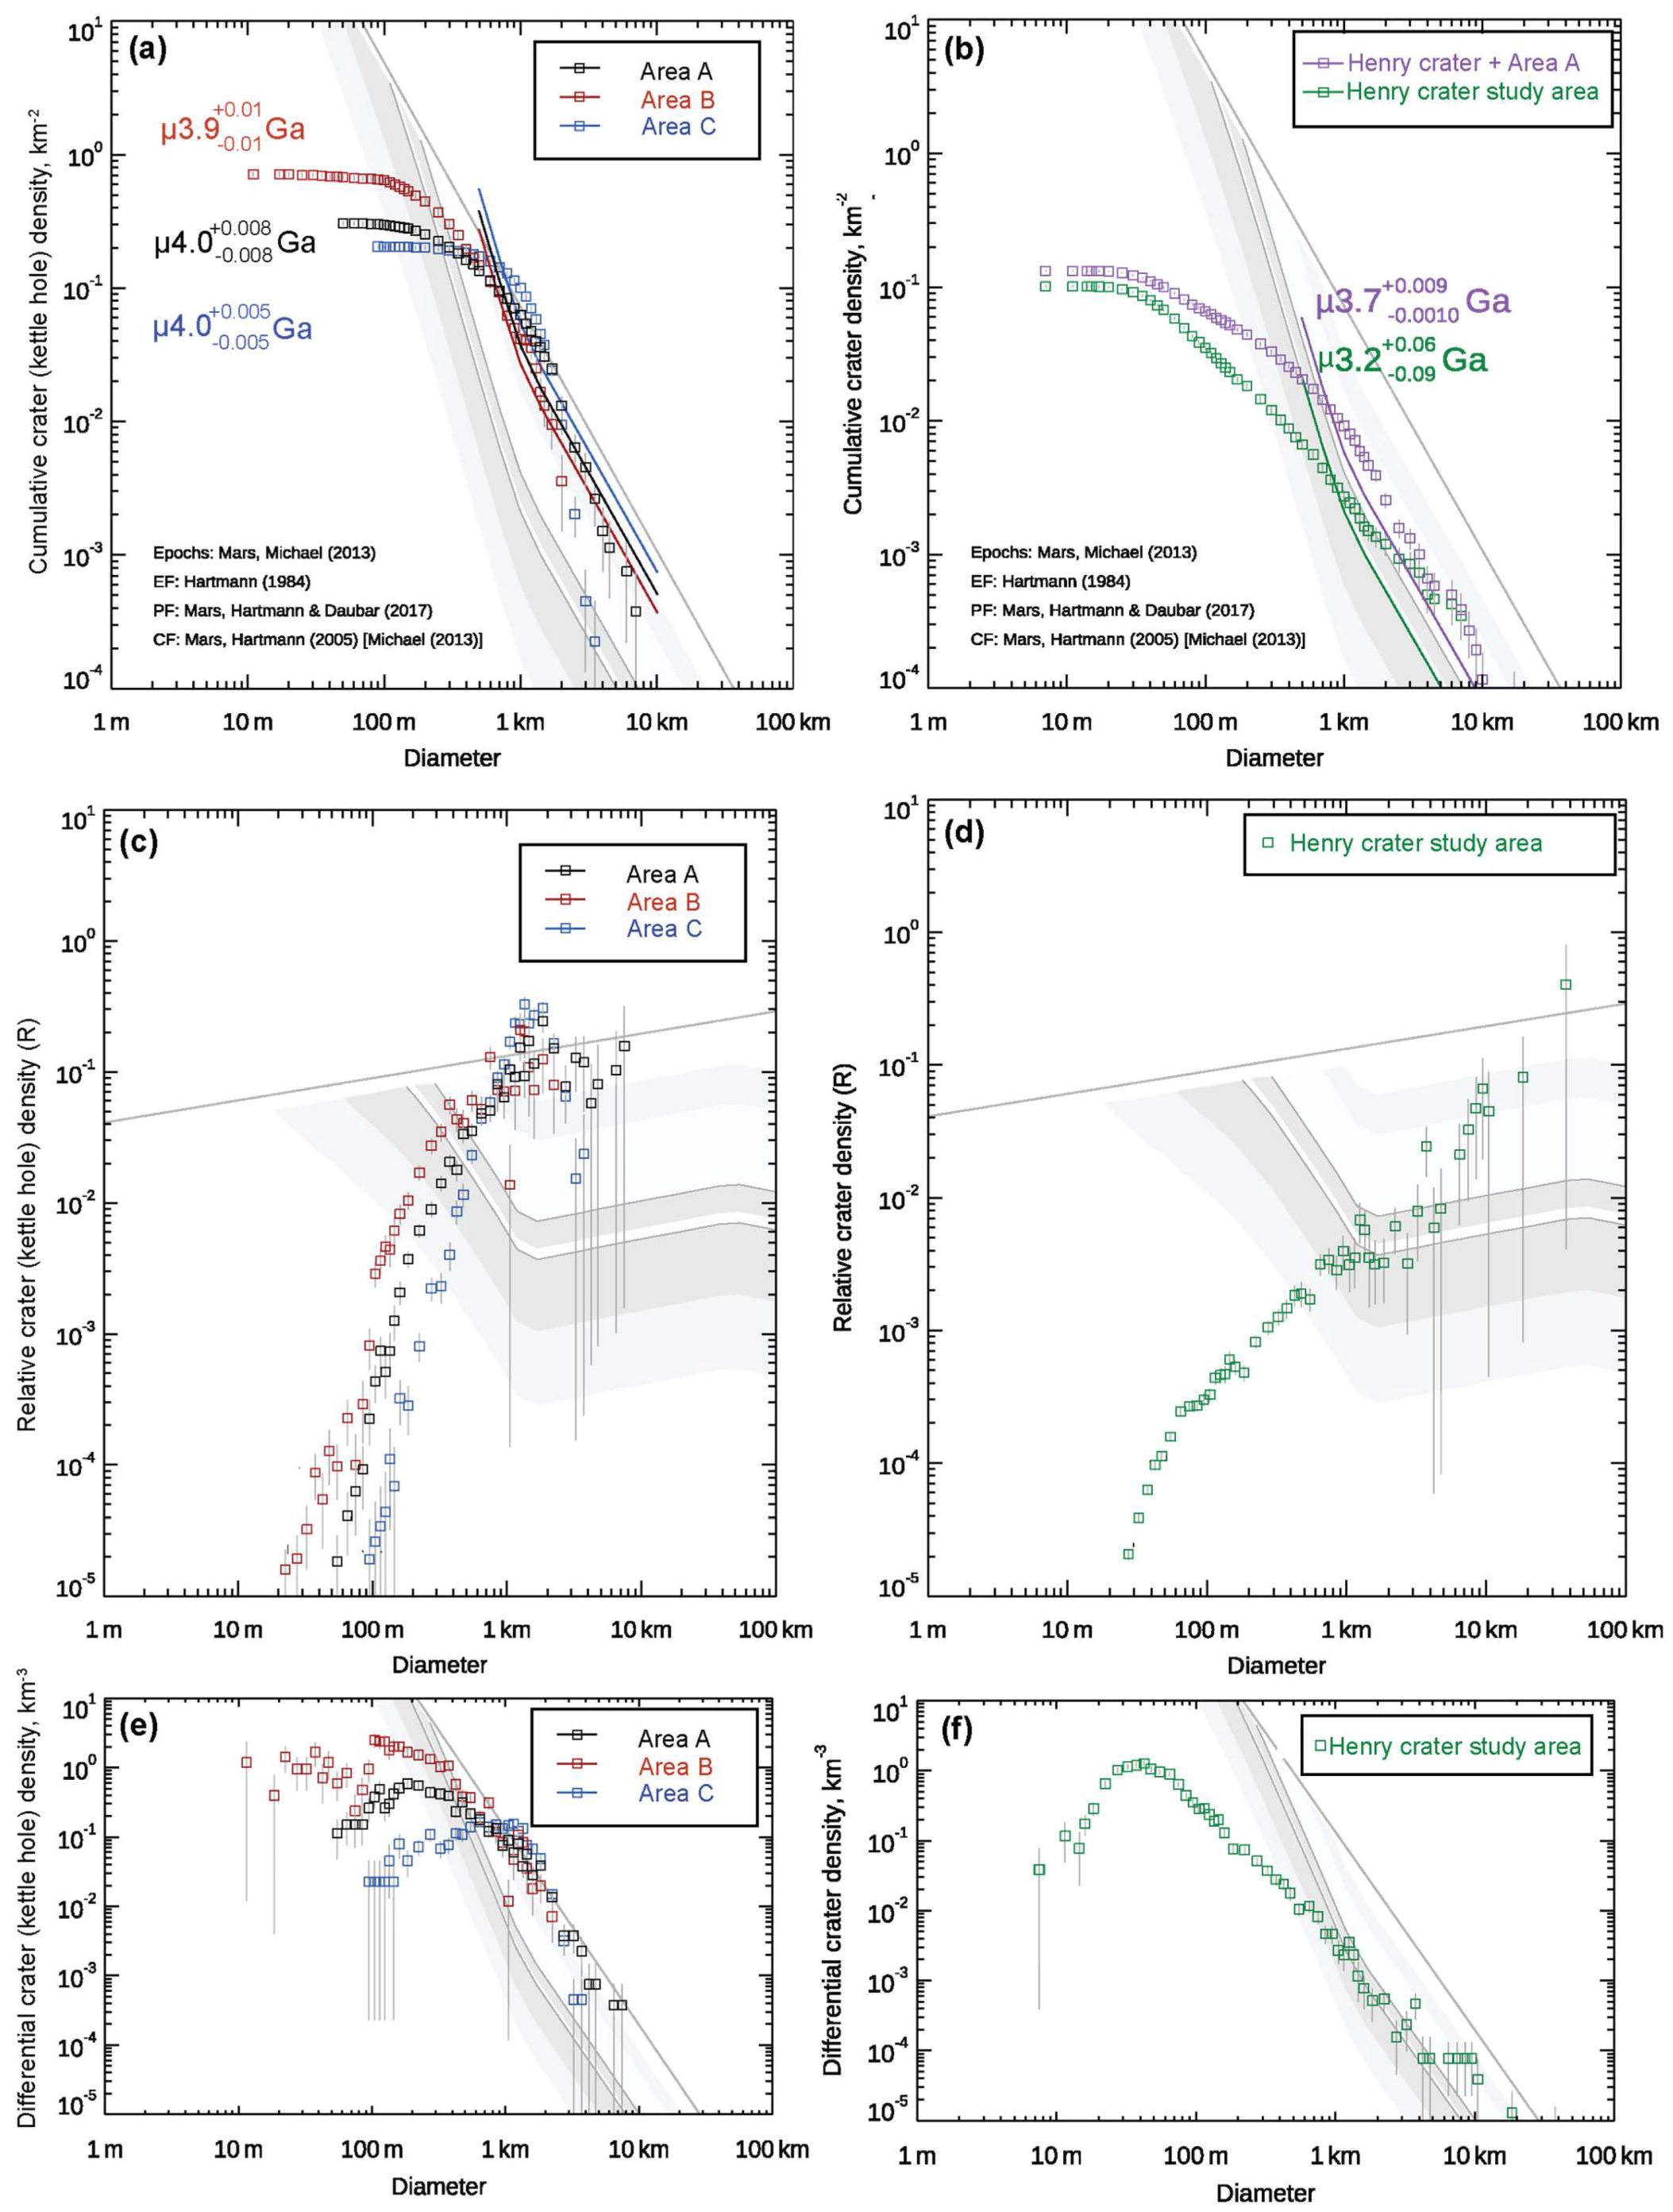
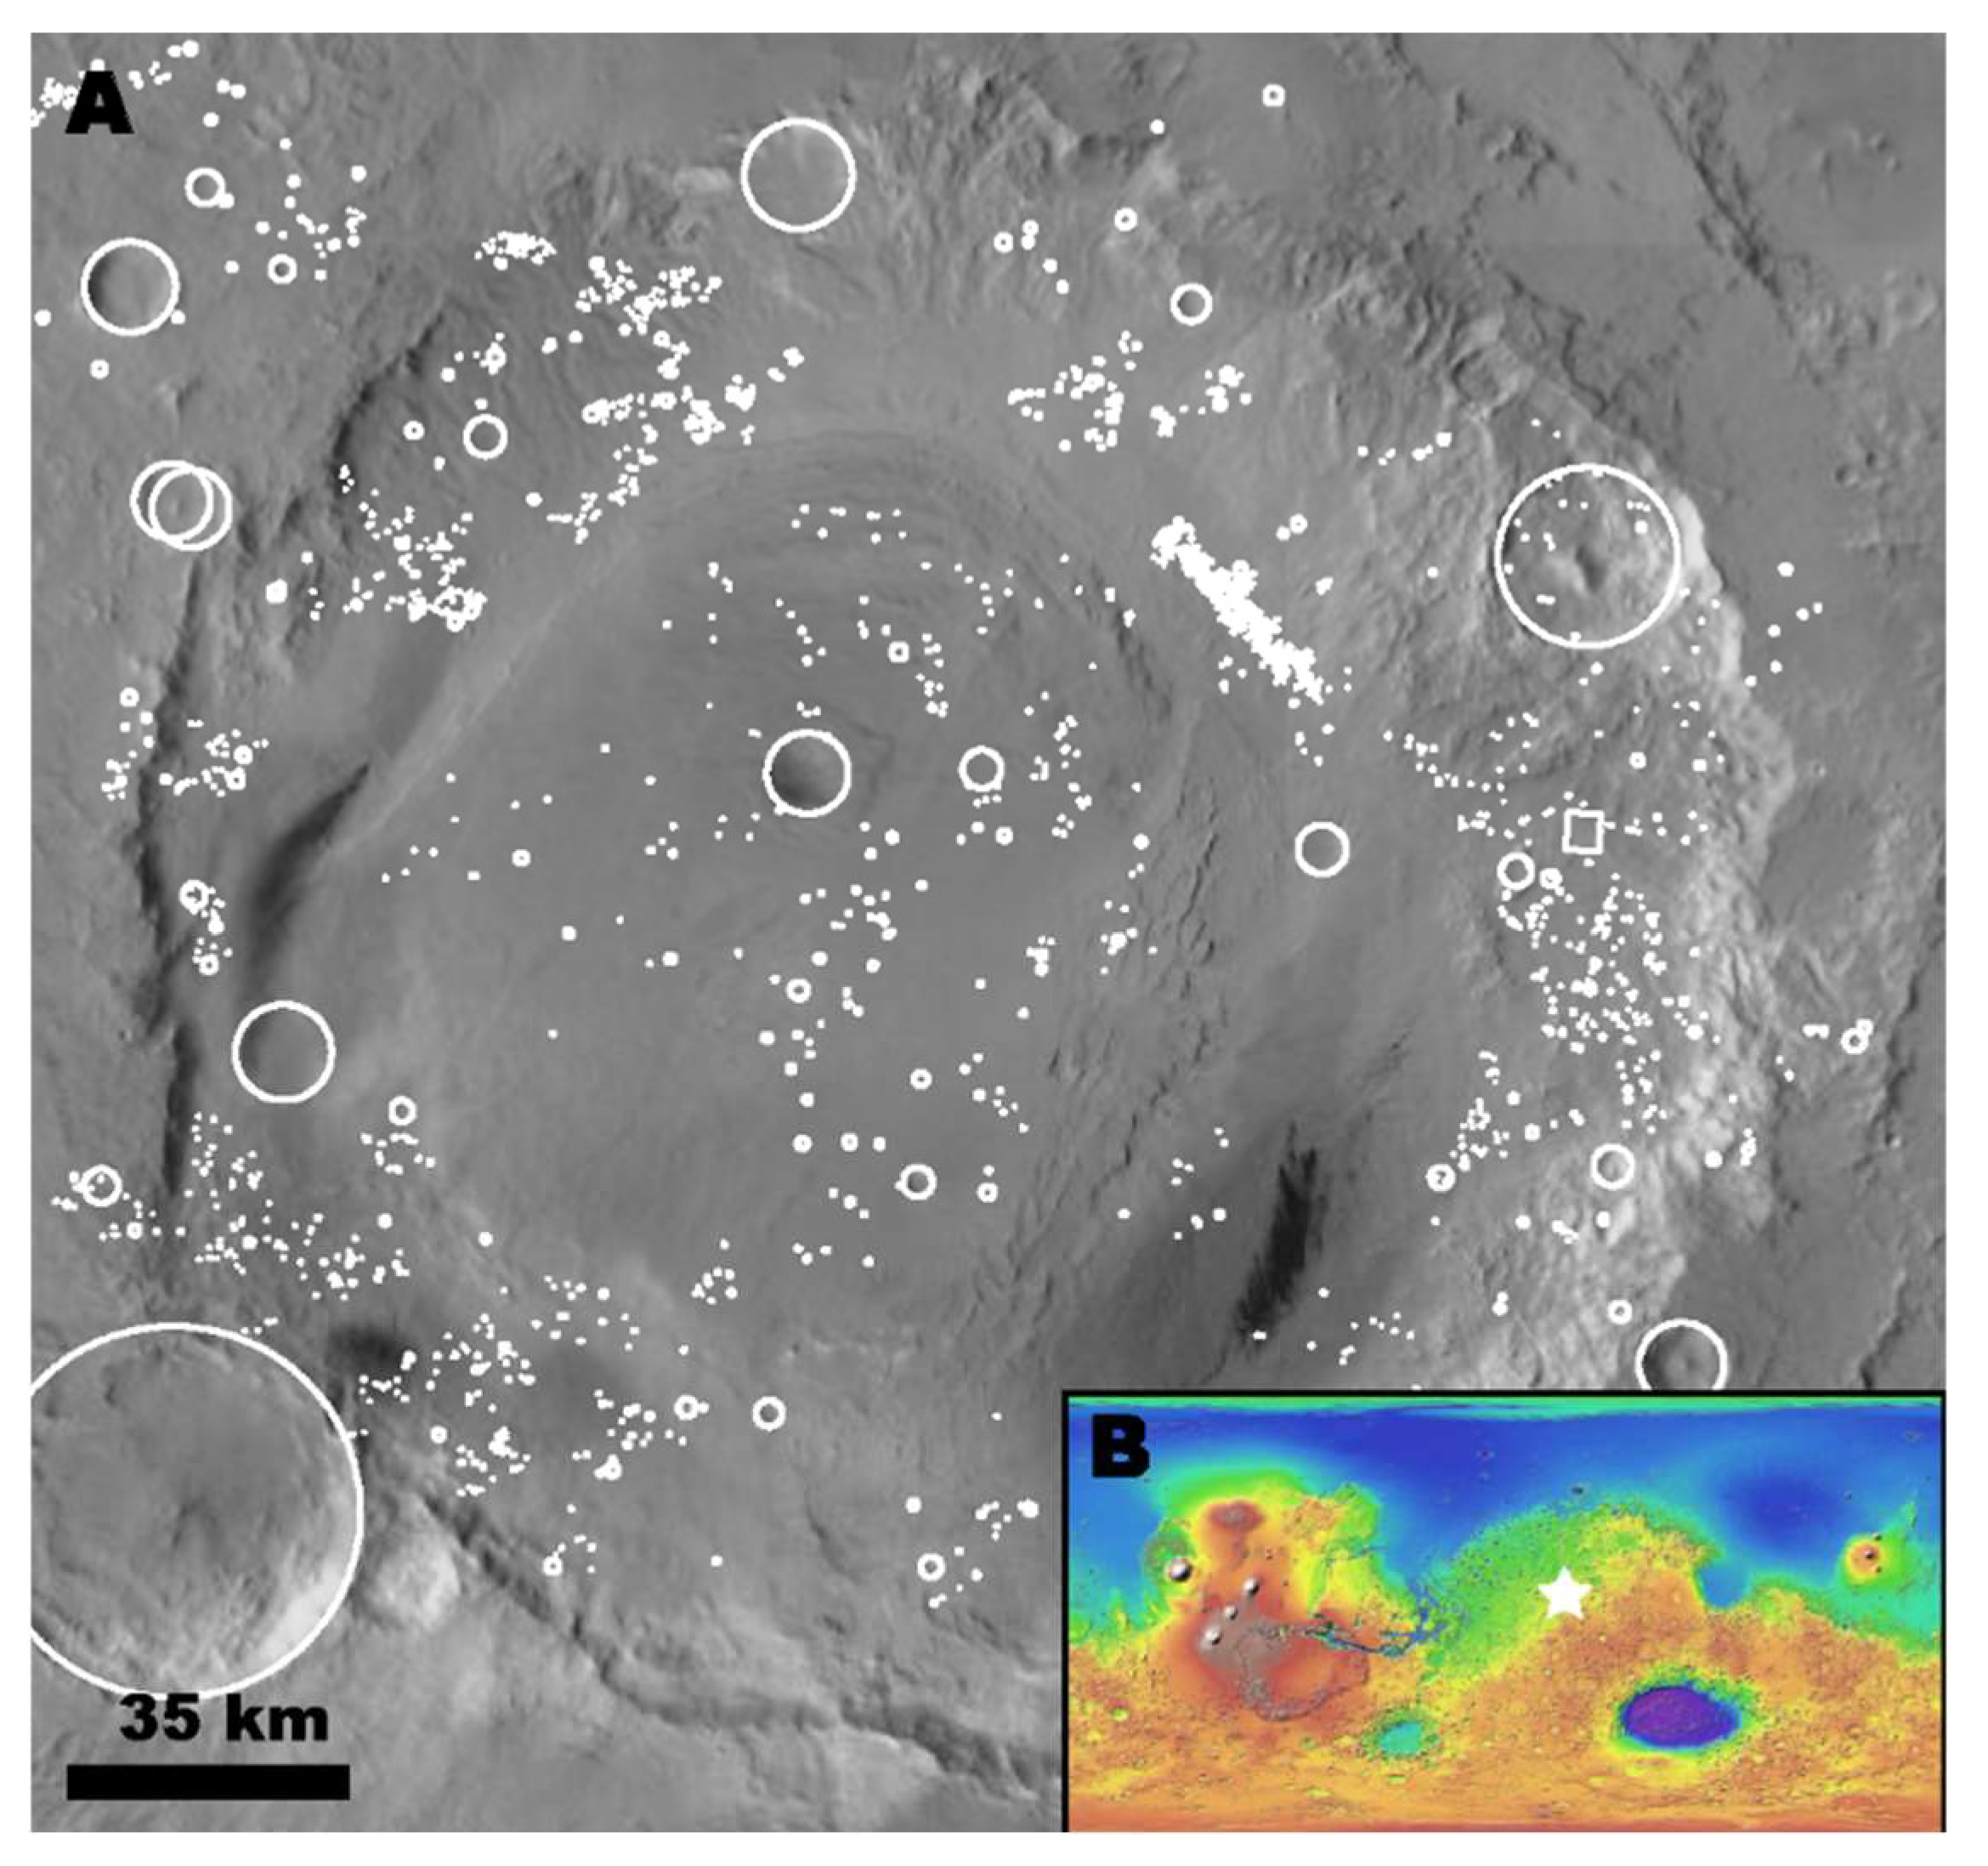
Figure 5.
Study area on Mars. (A) Henry crater as seen in a CTX image mosaic. The study area is approximately the extent shown. Craters measured in the Henry crater study area are outlined in white. (B) A Mars Orbiter Laser Altimeter topographic map of Mars with the location of the Henry crater (star).


Table 1.
Kettle hole summary measurements.
| Area A (Ontario) | Area B (Alaska) | Area C (Nunavut) | |
|---|---|---|---|
| Total area studied (km2) | 2656 | 840 | 4428 |
| Number of kettle holes measured | 814 | 599 | 908 |
| Number of kettle holes >500 m in diameter | 358 | 125 | 767 |
| Kettle hole long axis (diameter); µ ± 1σ (m) | 675 ± 707 | 364 ± 347 | 1039 ± 533 |
| Kettle hole short axis; µ ± 1σ (m) | 469 ± 448 | 241 ± 252 | 901 ± 467 |
| Aspect ratio; µ ± 1σ (m) | 1.46 ± 0.41 | 1.62 ± 0.50 | 1.18 ± 0.19 |
| Power law slope of the differential dist. for d > 500 m | −2.87 | −2.35 | −2.55 |
| Power law slope of the differential dist. for d > 1 km | −3.19 | −3.12 | −4.44 |
Disclaimer/Publisher’s Note: The statements, opinions and data contained in all publications are solely those of the individual author(s) and contributor(s) and not of MDPI and/or the editor(s). MDPI and/or the editor(s) disclaim responsibility for any injury to people or property resulting from any ideas, methods, instructions or products referred to in the content. |
© 2023 by the authors. Licensee MDPI, Basel, Switzerland. This article is an open access article distributed under the terms and conditions of the Creative Commons Attribution (CC BY) license (https://creativecommons.org/licenses/by/4.0/).
Share and Cite
MDPI and ACS Style
Day, M.; Bretzfelder, J.M.; Le, D. Not Every Circle Is a Crater: Kettle Hole Size Distributions and Their Implications in Planetary Surface Age Dating. Geosciences 2023, 13, 18. https://doi.org/10.3390/geosciences13010018
AMA Style
Day M, Bretzfelder JM, Le D. Not Every Circle Is a Crater: Kettle Hole Size Distributions and Their Implications in Planetary Surface Age Dating. Geosciences. 2023; 13(1):18. https://doi.org/10.3390/geosciences13010018
Chicago/Turabian StyleDay, Mackenzie, Jordan M. Bretzfelder, and Duyen Le. 2023. "Not Every Circle Is a Crater: Kettle Hole Size Distributions and Their Implications in Planetary Surface Age Dating" Geosciences 13, no. 1: 18. https://doi.org/10.3390/geosciences13010018
Note that from the first issue of 2016, this journal uses article numbers instead of page numbers. See further details here.