Review

An Analytical Review of the Recent Crustal Uplifts, Tectonics, and Seismicity of the Caucasus Region

by
Vladimir I. Kaftan
1,
Alexei D. Gvishiani
1,2,
Alexander I. Manevich
1,3,
Boris A. Dzeboev
1,4,*,
Viktor N. Tatarinov
1,2,
Boris V. Dzeranov
1,4,
Alina M. Avdonina
1 and
Iliya V. Losev
1
1
Geophysical Center of the Russian Academy of Sciences (GC RAS), 119296 Moscow, Russia
2
Schmidt Institute of Physics of the Earth of the Russian Academy of Sciences (IPE RAS), 119296 Moscow, Russia
3
College of Mining, National University of Science and Technology MISIS, 119049 Moscow, Russia
4
Geophysical Institute, Vladikavkaz Scientific Center RAS (GPI VSC RAS), 362002 Vladikavkaz, Russia
*
Author to whom correspondence should be addressed.
Geosciences 2024, 14(3), 70; https://doi.org/10.3390/geosciences14030070
Submission received: 11 November 2023 / Revised: 14 February 2024 / Accepted: 5 March 2024 / Published: 7 March 2024
(This article belongs to the Special Issue Precursory Phenomena Prior to Earthquakes 2023)

Abstract

:
This paper analyzes and reviews the rapid uplifts of the Earth’s crust in the Caucasus that occurred over the last century. The uplifts were registered by precise repeated state leveling and reflected on officially published maps of vertical movements of the Earth’s crust. This study summarizes information on the region’s vertical movements over more than a century. The present study describes the technology for creating maps of recent vertical movements of the Earth’s crust using precision leveling data. This paper summarizes cases of recording uplifts of the Earth’s surface in other regions of the world in connection with seismic activity. The authors carried out intercomparison of vertical movements with tectonics, seismicity, and geophysical fields, which discovered their apparent mutual correspondence. This indicates the deep tectonic nature of the observed uplifts of the Earth’s crust. Spatial and temporal agreement with the distribution of strong earthquakes showed a natural relationship. It has been shown that strong earthquakes are confined to the boundaries of zones of rapid uplift. They occur predominantly in areas of transition between uplifts and subsidence. The results obtained demonstrate the role of the study and observations of vertical movements of the Caucasus in assessing periods and areas of increased seismic hazard.

1. Introduction

Today, repeated continuous geodetic measurements are widely used to study recent geodynamic phenomena, as well as to test current ideas about tectonic processes in the Earth’s crust. Such measurements in seismically and geodynamically active regions of the Earth are of particular interest. The most common measuring tools for solving these problems are global navigation satellite systems (GNSS) and repeated high-precision leveling. GNSS observation stations cover a huge part of the Earth’s surface and thus contribute to the determination of recent movements and deformations of the Earth’s crust. Within the framework of modern models of global plate tectonics [1,2], velocity varies from centimeters to decimeters per year if we talk about unidirectional and monotonous movements of the Earth’s surface. Areas of relatively rapid movements include seismically active zones. Such an area is the Caucasus. The latter is a region of active mountain building and a zone of increased seismic hazard [3].
The history of studying crustal movements in the Caucasus using GNSS spans approximately three decades. During this time, large-scale international projects were implemented to conduct field GNSS campaigns [4,5,6]. Continuous GNSS stations were created [7,8]. Local studies were carried out repeatedly in different parts of the Caucasus region. The oldest continuous station is the ZECK station of the Zelenchuk Observatory of the Institute of Applied Astronomy of the Russian Academy of Sciences, which has been accumulating coordinate determinations since 1997 [7].
It should be noted that in numerous publications, insufficient attention was paid to the study of the vertical movements of the Caucasus. At the same time, the tectonics and morphology of the Caucasus directly indicate the significant role of vertical movements in the construction of geodynamic models and testing of tectonic hypotheses. Researchers were mainly limited to determining the velocity of horizontal movements and the degree of horizontal shortening of the crust in the region. The reason for this was probably the lower accuracy of determining the vertical component and, possibly, a fascination with plate tectonic hypotheses [5,9,10,11,12], where the leading role is given to the horizontal drift of global plates.
The study of vertical movements in the Caucasus region has a history of about a century. Repeating precise state leveling allowed us to obtain accurate characteristics and construct maps of recent vertical crustal movements (RVCM) for this region. However, these works do not find sufficient resonance among researchers of geodynamics and tectonics of the Caucasus. Moreover, they are increasingly used throughout the world to solve geodynamic problems. Taking into account the indicated circumstances, the authors set themselves the task of conducting a historical review study of the results of determining the RVCM of the Caucasus in connection with the seismic activity of the region and its tectonics, taking into account new scientific results and modern ideas.

2. Geophysical Fields, Tectonics, Seismicity, and Cartographic Models of Vertical Movements

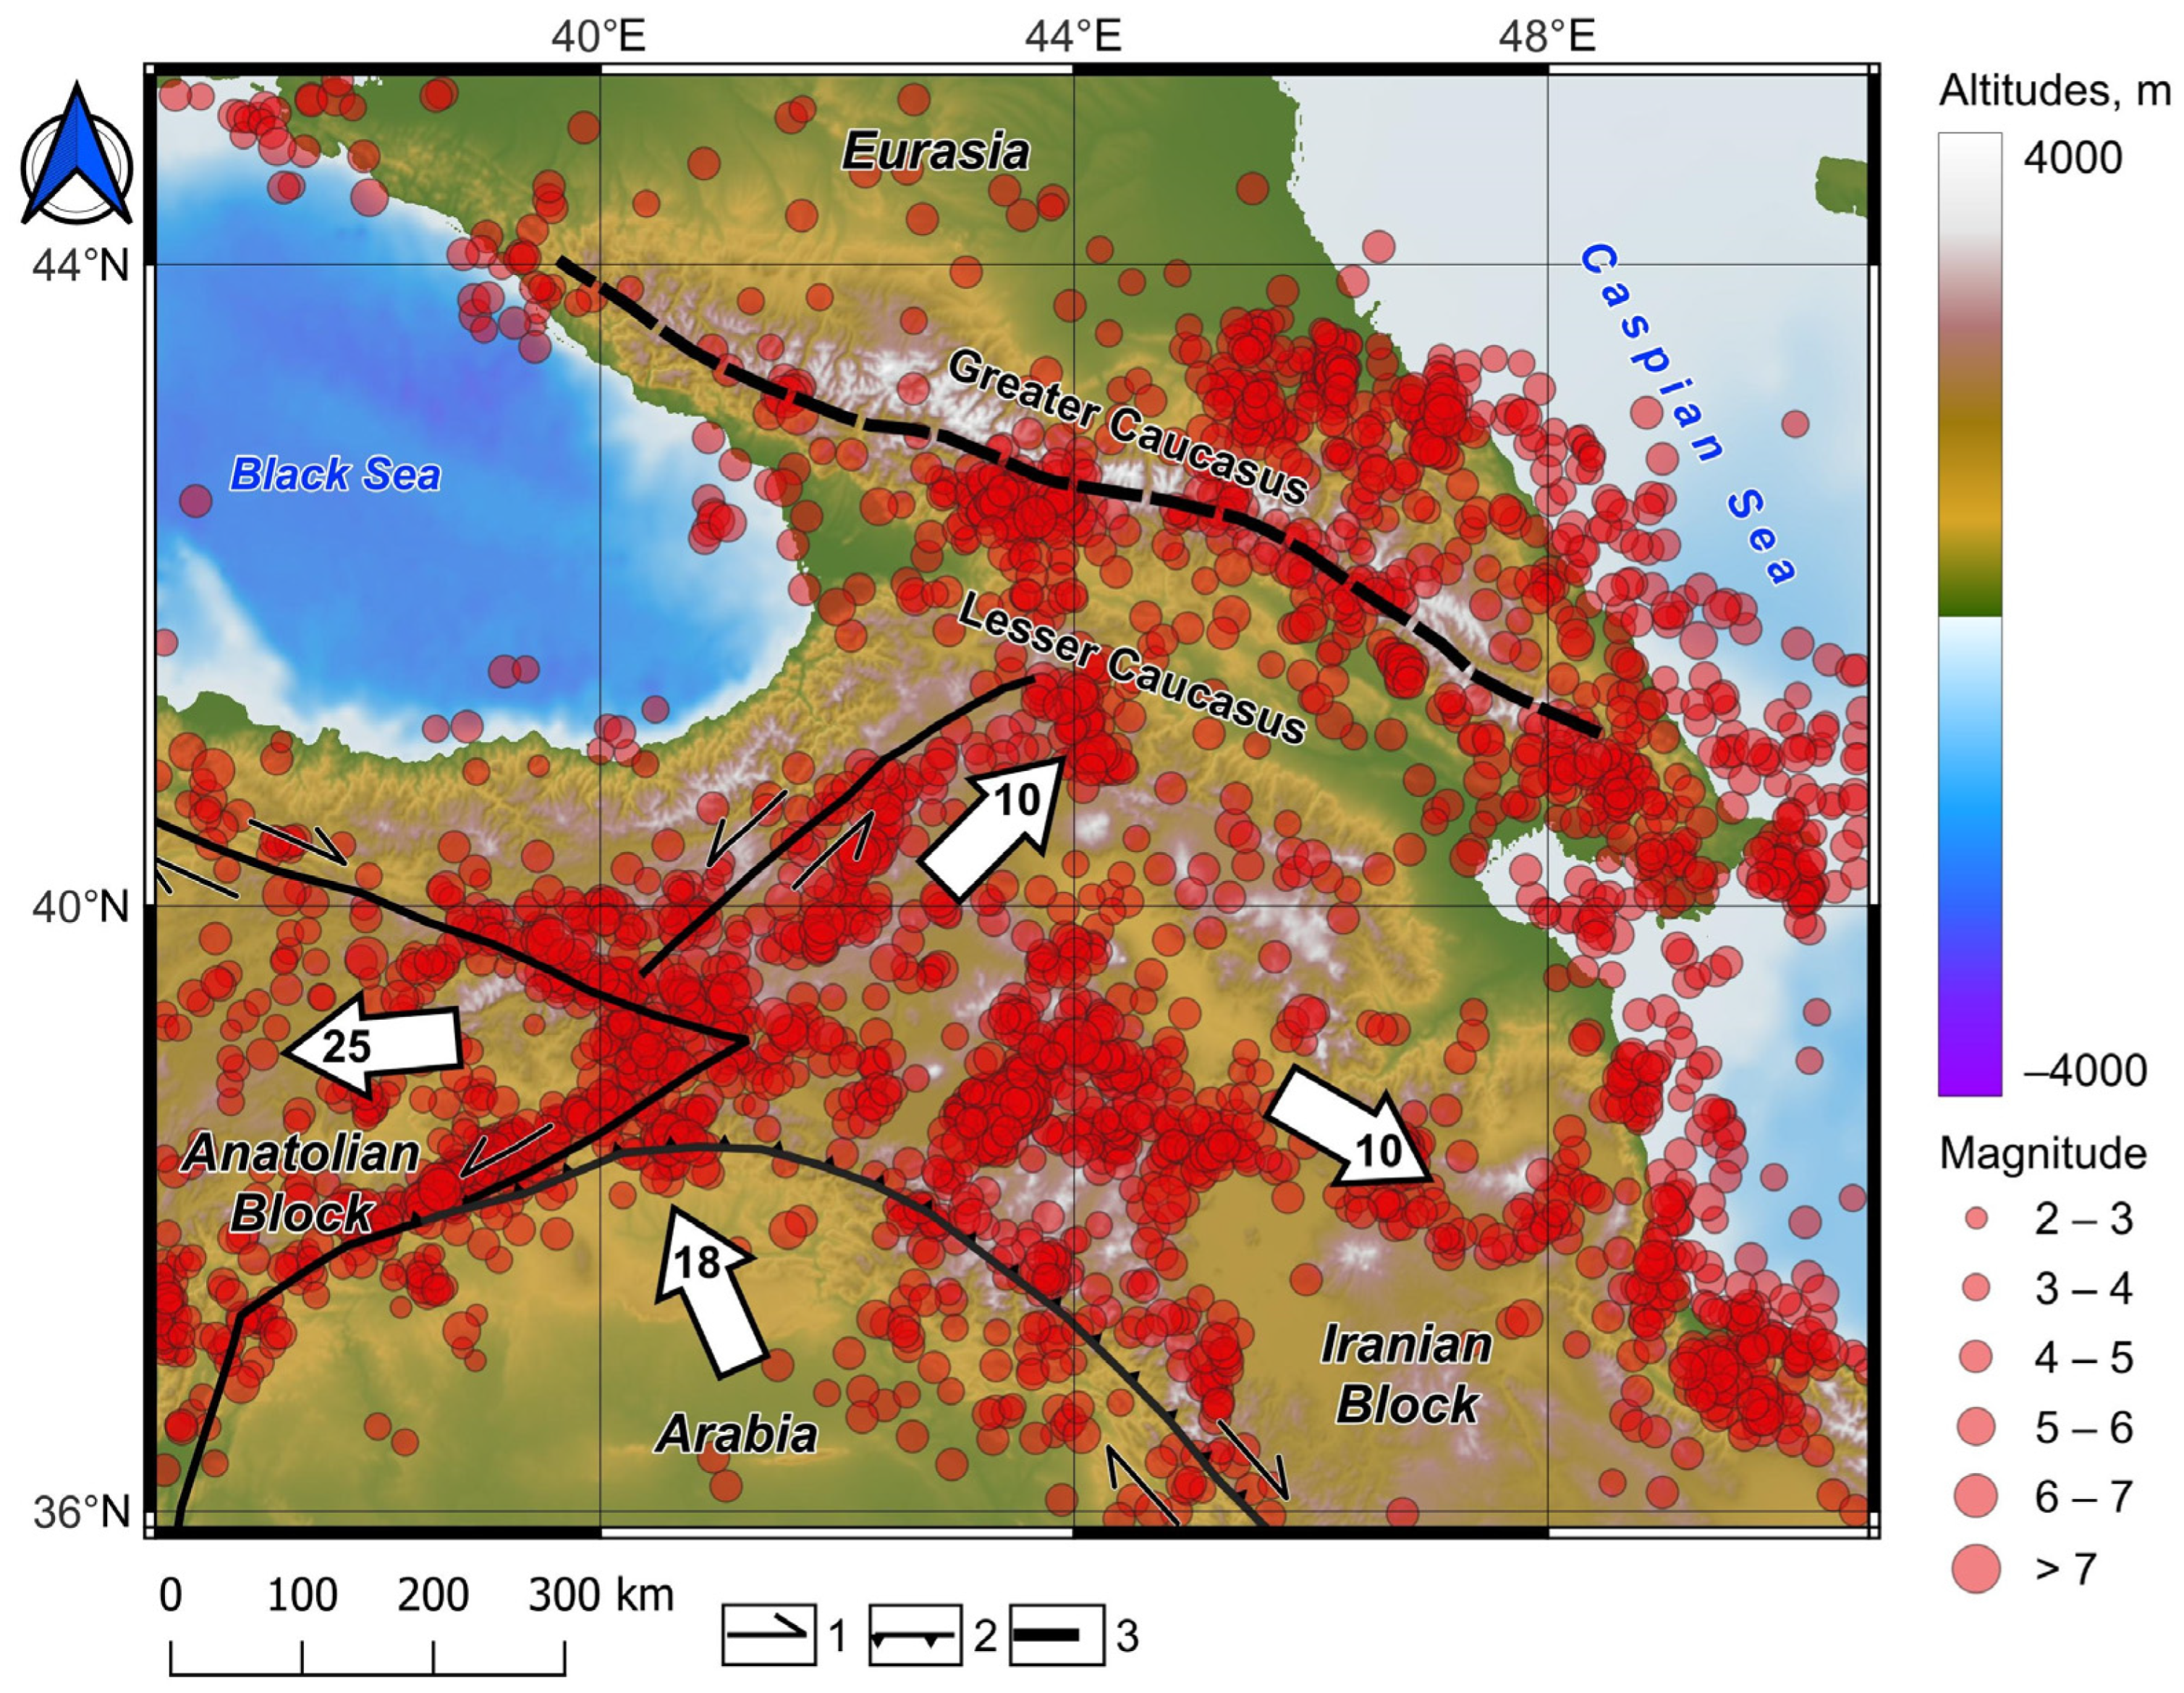
2.1. Topography, Fault Tectonics, Seismicity, and Geodynamics of the Caucasus

The Caucasus is a zone of young alpine folding, a segment of the Alpine–Himalayan mountain belt. The main morphostructural elements of the region are the mountain structures of the Greater and Lesser Caucasus, separated from each other by lower forms of relief—the basins of the Kura and Rioni rivers (Figure 1). The East Anatolian Plateau adjoins the region from the south as a transition zone from the Arabian tectonic plate to the meganticlinoriums of the Lesser and Greater Caucasus. The peaks of the Greater Caucasus Range reach heights of about 5600 m. The Lesser Caucasus is expressed on average by mountain structures with a height of about 3000 m. The main intermountain depressions in the northwestern and southeastern parts of the region form a connection between the sedimentary basins of the Black and Caspian Seas.
The axial line of the Greater Caucasus Range is expressed by the Main Caucasus Fault with a thrust displacement mechanism (CMT, Figure 1). The main structural fractures of the Greater Caucasus are represented by thrust faults. Tectonic faults of the Lesser Caucasus and Eastern Anatolia have a predominantly strike-slip mechanism, often with a reverse fault component. The Anatolian Plateau, moving north under the pressure of the Arabian tectonic plate (Figure 2), creates wedging forces expressed by left-sided and right-sided displacements in the west and east of the pressure axis, respectively (Figure 1) [9,11,12,13].
In connection with the development of global navigation satellite systems in the region, characteristics of horizontal movements of tectonic blocks of the Earth’s crust were obtained. Horizontal movements, according to modern concepts, determine the tectonics of the region at the present stage (Figure 2) [5,6,10,11].
Density inhomogeneities of the mantle play a crucial role in the analysis of the main forces that determine both horizontal and vertical movements of global lithosphere blocks [14]. A map of mantle gravity anomalies in Eurasia, based on the latest data on the structure of the Earth’s crust in conjunction with other lithosphere parameters, is presented in [14].
To understand the ongoing geodynamic and tectonic processes, it is advisable to consider and associate different geophysical regional models. Of particular interest are the sedimentary layer thickness model, gravity field anomaly models, mantle density model, and Mohorovicic surface model (Figure 3) [14].
Maps of Bouguer gravity anomalies, information about the depth of the Mohorovicic boundary, as well as the thickness of the sedimentary layers were adopted from [14]. At the same time, Bouguer gravity anomalies (Figure 3d) were calculated using the EIGEN-6c4 model [15] using the GRACE and GOCE satellite projects, as well as ground surveys and aerial surveys. The Moho boundary model (Figure 3b) is based on EuCRUST-07 data [16,17]. As can be seen, various regional geophysical fields significantly correlate with each other. This fact should provide information about the consistency of these characteristics with tectonic and geodynamic processes. It is evident that the contours of all anomalies are also naturally repeated to one degree or another in the maps of the region’s RVCM.
The study of [14] found a significant redistribution of low-density sediments in the Black Sea. Another principal feature is the increase in the thickness of relatively low-density sediments in the Eastern Greater Caucasus. The deepest part of the South Caspian Basin is shifted to the north, near the Apsheron Trough. Another principal finding [14] is that metamorphosed sediments in the East Greater Caucasus are characterized by remarkably lower densities than was suggested in the initial model [15,16,17], in which they are almost indistinguishable from the crystalline rocks of the Western Greater Caucasus already at rather shallow depths. The greatest thickness of the sediment layer is accumulated in the northern part of the foothills of the Greater Caucasus, close to the Stavropol Rise. The largest gravity anomalies of the area are confined to the Black Sea area, where rock consolidation took place under the influence of sedimentological processes, while the mountains of the Greater and Lesser Caucasus are characterized by lower values of gravity anomalies.
The thickness of the sedimentary layer is naturally related to exogenous processes of rock denudation. The processes of denudation and vertical uplifts of the Earth’s crust have a different nature—exogenous and endogenous, respectively. It would seem that these processes do not determine the tectonics of the Earth’s crust, but they are some of its consequences [14,16,17]. At the same time, the ratio for the rates of denudation processes and vertical uplifts makes a significant contribution to the formation of the relief of the Earth’s surface. Earthquakes make a certain contribution to the destruction of the crystalline part of the Earth’s crust. In the next section, we will consider the consistency of strong earthquakes with vertical movements of the Earth’s crust.
It is significant that the nature of the Moho surface field is strictly consistent with the morphostructures of the Caucasus, as well as with the character of recent vertical movements of the Earth’s crust. The mountain structures of the Greater and Lesser Caucasus have deep “roots”, which have to inevitably manifest themselves in regional tectonics and geodynamics.
The depths of the Mohorovicic surface (Figure 3b) are naturally consistent with the topography of the region and, accordingly, with the thickness of the sedimentary layer. The thickness of the crystalline shell determines its mass, which is naturally reflected in gravity anomalies (Figure 3c), which in turn correlates with geoid heights (Figure 3d).
According to [18,19], in recent times (from the Oligocene, which began 33.9 million years ago), the Western Caucasus has undergone an uplift of more than 7000 m, and the Eastern Caucasus has undergone an uplift of 6000 m (Figure 4). The total amplitude of the uplift of the Western Caucasus, according to [20,21], amounted to 5000 m, and the Eastern Caucasus amounted to 4000 m. In the late Pliocene and Pleistocene (the latter began 2.58 million years ago), the rate of uplift of the Eastern Caucasus exceeded the rate of uplift of the Western Caucasus [11,18,19,20].
The Caucasus is a highly seismic region. Manifestations of seismic activity should be reflected in the nature of crustal movements. To collect data on strong seismic events that occurred in the studied Caucasus region, we used the global instrumental catalog of earthquakes ISC-GEM [22,23,24,25]. It was developed by the International Seismological Center. ISC-GEM is being created to expand and improve existing modern data bulletins on large earthquakes (magnitude 5.5 and above, as well as continental events up to magnitude 5.0) [23]. Today, the catalog contains events for the period 1904–2019. We used the tenth version of the ISC-GEM catalog [26]. All of our data (including the vertical movement data below, topography, and geophysics) were compiled into one GIS project for collaborative visualization and interpretation. The 17 strongest events were selected for the studied area (Table 1). Low-to-moderate-magnitude earthquakes (M < 5.5) were not taken into account since their manifestation in the movements of the Earth’s crust is insignificant at the level of accuracy of geodetic measurements.
The eastern part of the Greater Caucasus is more prone to earthquakes than the central and western parts. If we consider the Greater Caucasus Range, earthquakes are distributed along its margins, while the axial zone is aseismic except for the eastern part, where the presence of a subduction tectonic mechanism is assumed [10]. The presence of a seismic gap along the axial line of the Greater Caucasus Range is also discussed in [27].
In recent decades, the modern orogeny of the Caucasus has been associated by researchers mainly with the plate tectonic concept of regional tectonics. The main mechanism of modern geodynamics of the Caucasus is predominantly considered to be the intense convergence of the Arabian and Eurasian tectonic plates (Figure 2). Due to this, the shortening of the Earth’s crust occurs, leading to folding, the growth of mountain structures, and the general uplift of the region [4,5,6]. The harsh pressure of the wedge-shaped northern end of the Arabian Plate creates compressive stresses that determine the nature of seismic activity.
The initial stage of continental collision in the Caucasus, according to the data from the end of the last century, is studied in [9]. A comprehensive analysis of modern geophysical and geodetic studies of the Caucasus region is presented in [11].
Various modern geological and geophysical research programs in the Caucasus present conflicting information about regional geodynamic and seismotectonic mechanisms. Often, the plate tectonic model is questioned or refined based on more modern research [8,9,10,11,12].
Analysis of the seismic tomography data allowed some authors to propose a regional three-dimensional model of sublithospheric flows originating from the Ethiopian–Afar superplume [28,29]. One of the branches of such a flow is oriented submeridionally. It crosses the western segment of the Arabian Plate and reaches the lesser and central parts of the Greater Caucasus. In this regard, the late stage of development of the Caucasian orogen is accompanied by intense upward movements.
A fundamentally different concept of geosynclinal platform evolution of the Caucasus mountain system is proposed in [30]. The description of this model is discussed in [31]. The authors of these studies, based on the analysis of seismic tomography data, do not confirm the plate tectonic collision model of the evolution of the Caucasus region.
Based on the analysis of the earthquake source mechanisms, tectonic conditions, and GNSS observations, in addition to the plate tectonic model, the existence of an independent local process in the Caucasus is assumed. It is associated with an increase in the volume of rock strata and the subsequent uplift of the Earth’s crust [32]. The existence of such a mechanism is indicated by subvertical tensile stresses in models of focal earthquake sources, as well as horizontal extension strains across the strike of the Greater Caucasus Range. Milyukov et al. [33], using the example of the North Ossetian segment, explain this feature through the phenomenon of diapirism within the framework of the tectonic paradigm of V.V. Belousov [34]. The considered studies are not based on data on vertical movements of the Caucasus region. Instrumental definitions of vertical movements are ignored.
According to Rastsvetaev [35], Lukina [36], and Trifonov [37], in the Caucasus, in recent times (Quaternary Period), there have been fields of submeridional tangential compression. Lukk et al. [32] make an important assumption that the source of subhorizontal compression stresses in the Greater Caucasus is not necessarily associated with plate tectonic mechanisms but rather may have a purely own, local, autonomous character.
A similar conclusion was formulated by Nikolaev [38]: “processes leading to deformations and tectonic movements of the main structural elements of the Caucasus … are localized within their boundaries”. The author argues that in the structures of the Caucasus, which are experiencing modern uplift, a decompression of the substance occurs with the rock being squeezed upward. In [39], the differentiated nature of the vertical movement of blocks of the Earth’s crust is associated with gravitational inertial forces.
Recent studies [40] confirmed the presence of earthquakes at intermediate depths of ~150 km beneath the northern foothills of the Greater Caucasus. This fact is explained by the manifestation of oceanic subduction in the Kura Basin area [40]. The subduction mechanism of the geodynamics of the Eastern Caucasus is also discussed in [41,42].
Regarding the mechanism of mountain building on a planetary scale [43], researchers believe that plate tectonic theories are not entirely consistent. The authors consider that vertical uplifts can form mountain ranges independently, without the influence of lateral horizontal stresses.
Instrumental observations of the seismic process and recent crustal movements are extensively used by the authors of various geotectonic concepts. For this purpose, as a rule, GNSS observation data for no more than the last 30 years are used. A review of scientific publications shows that the use of information about recent vertical movements of the Earth’s crust in testing geotectonic concepts and hypotheses is extremely limited, which negatively affects the quality of theoretical constructions.

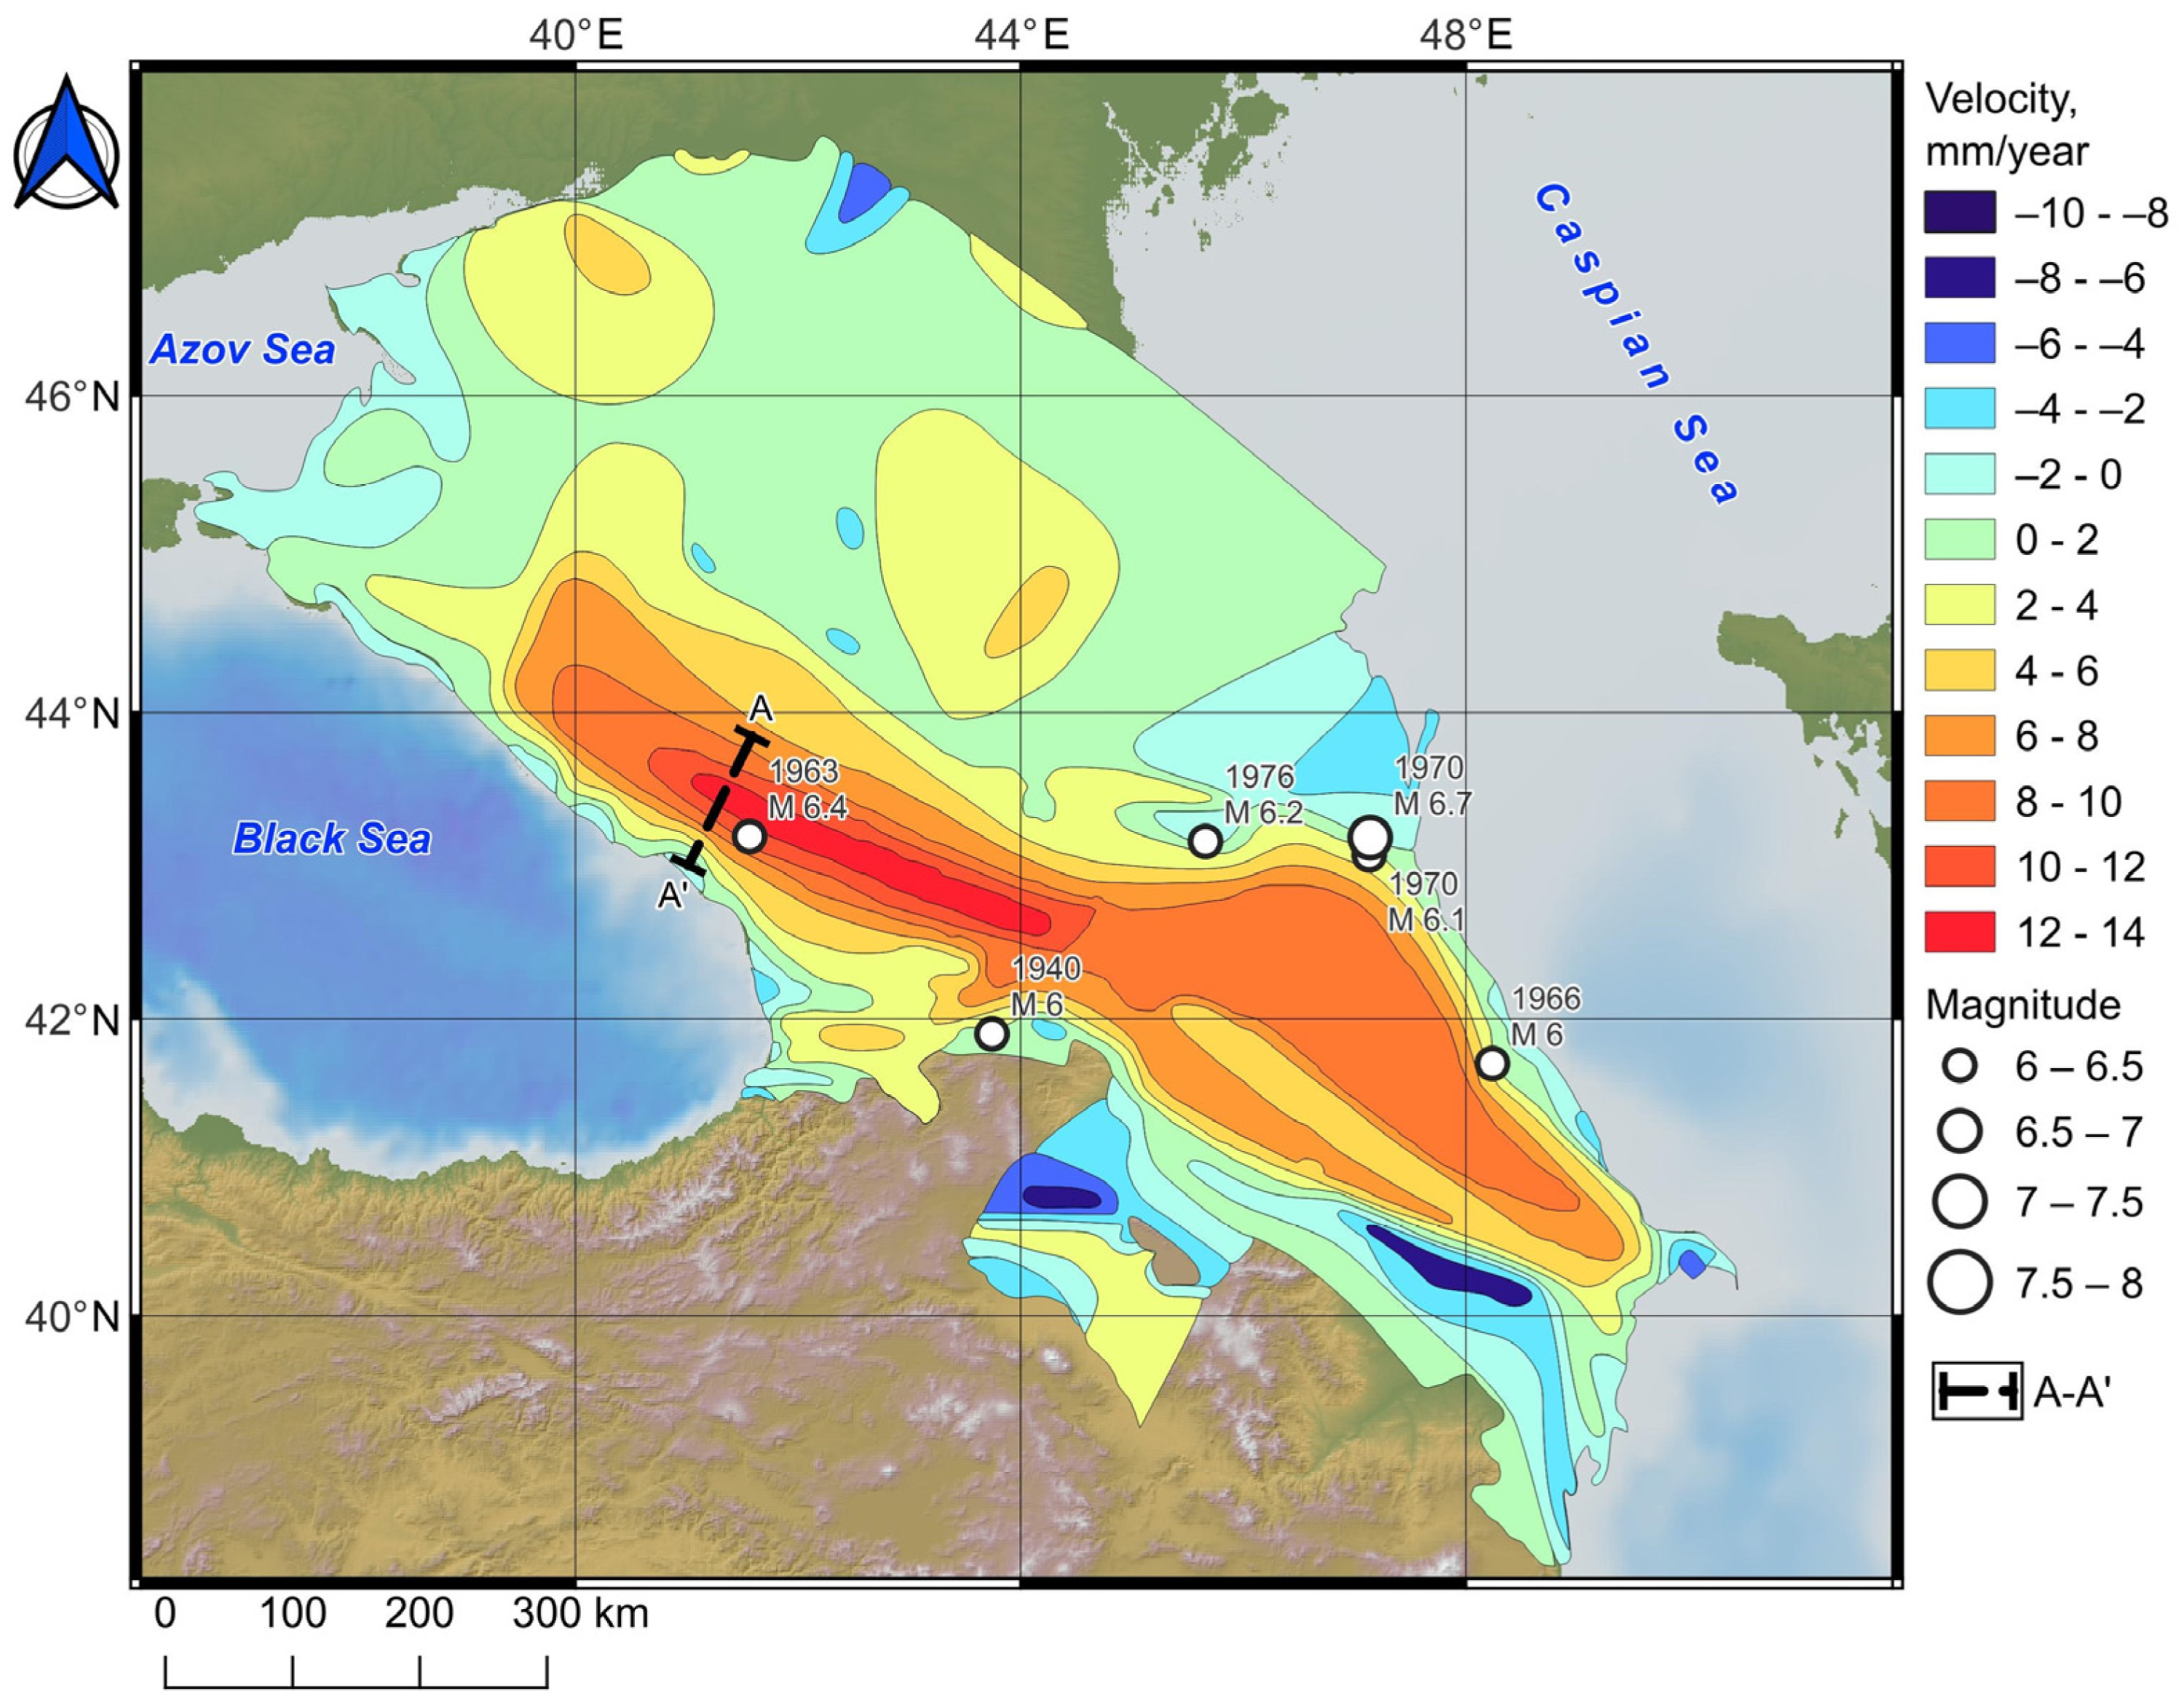
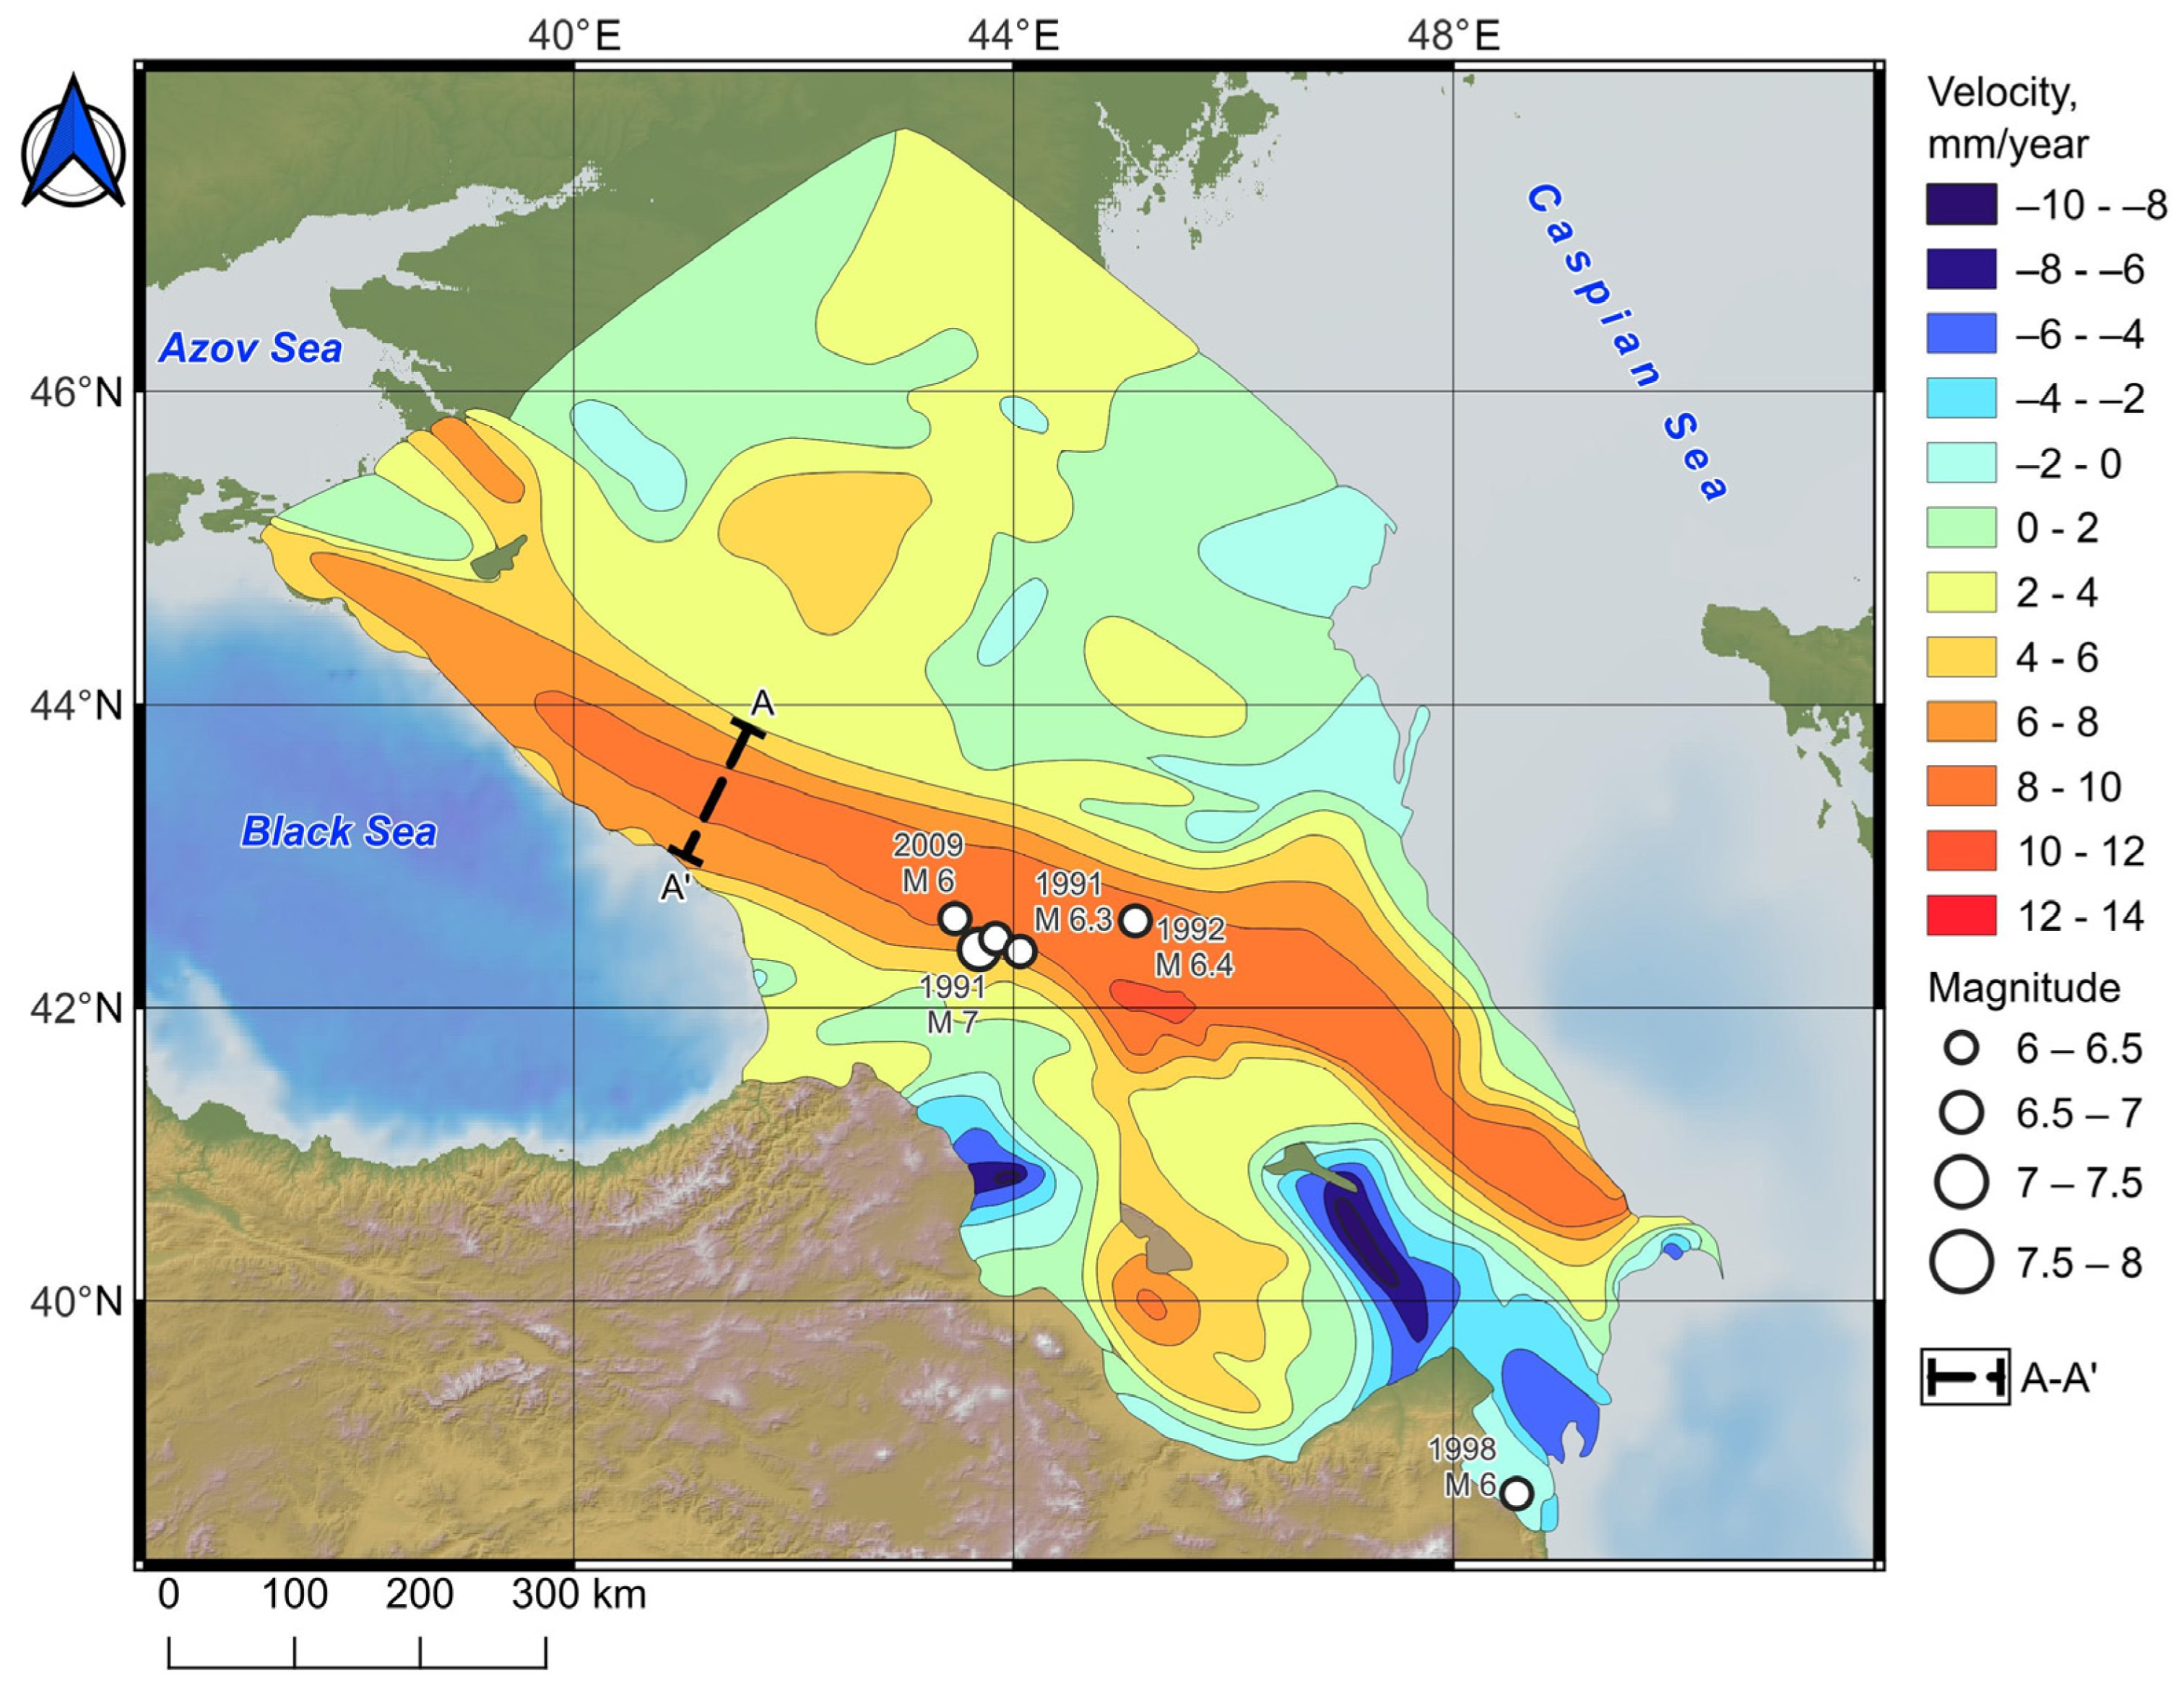
2.2. Precise Geometric Leveling and Maps of Recent Vertical Movements of the Earth’s Crust

High-precision geometric leveling, which is the height reference frame of different states, was often used to determine the vertical movements of the Earth’s crust. It was the first measuring tool in many national and international programs to determine recent vertical movements of the Earth’s crust. Mainly thanks to the development and application of this method, in 1963, a special commission, VII “Recent Crustal Movements”, began to function as part of the International Association of Geodesy [44,45].
The first mentions of the possibilities of recording vertical movements of the Earth’s crust using repeated precise leveling belong to Russian military topographers of the century before the last. This guess served as the impetus for regulating the timing of repeating measurements along national leveling lines. To mitigate the outdating of heights of state leveling benchmarks, time intervals were established, after which leveling had to be repeated.
Until recent decades, precise leveling was carried out using optical instruments with horizontal cylindrical levels. This study primarily examines and analyzes the work and results of determining the vertical movements of the Earth’s crust using spirit levels. Modern electronic devices have not yet been widely used in the studied areas.
Determining recent vertical movements in the USSR was not the main task of using the geometric leveling method. The main task was to spread the unified system of heights over vast territories of the state for its economic development. Leveling, first of all, served as the basis for state mapping and economic development. However, the study of changes in the Earth’s surface over time is one of the main scientific tasks of geodesy, which requires an effective solution.
In the national leveling of the Russian Federation [46], repetition intervals for state leveling of classes I and II are established after 24 and 30 years, respectively. For seismically active regions where the fastest movements occur, appropriate repetitions are provided once every 15 and 25 years.
The accuracy of determining elevations along the USSR state leveling lines of classes I and II is characterized by values of the order of 1.5–2.5 mm/km. It should be noted that in the early state leveling work at the end of the 19th century, the maximum error of high-precision leveling did not exceed 3 mm/km. This regulation complied with the recommendations of the International Association of Geodesy [47]. This circumstance indicates a high degree of homogeneity in the accuracy of national state leveling throughout the century.
An important fundamental scientific result of precise geometric leveling is the creation of maps of recent vertical crustal movements (RVCM). Such maps were compiled for individual regions and the entire territory of the USSR.
Kinematic models of the RVCM, obtained from precise leveling data, represent a field of velocities of vertical movements in the form of a map of vertical movements of the Earth’s surface in the studied region [48,49]. The most important advantage of this model is its significant spatial coverage. A natural disadvantage of such models is the small number of repeated measurements along high-precision leveling lines.
The main difficulty in solving this problem is the spatiotemporal irregularity of the measurement data since it is objectively quite difficult to perform repeated leveling along extended lines with equal repetition intervals and to place the benchmarks of these lines at equidistant ranges from each other.
Summary information about the RVCM maps used in the paper is presented on the website http://zeus.wdcb.ru/wdcb/sep/data/lists/list6_2.html (accessed on 31 October 2023).
The quality and information content of RVCM maps is discussed in detail in the article [49]. The territory of the Caucasus region is covered by several RVCM maps. The results of the first determinations of the vertical movements of the Earth’s crust in the Caucasus based on the precise leveling data are presented in [50,51]. Statistical studies of leveling cycles, which served as the basis for creating maps of the European part of the USSR, showed a significant positive correlation between errors (residuals of leveling circuits) of different epochs [52,53]. This may indicate the existence of unidirectional errors in repeated measurements, as well as their weakening in the inequality in measurements for different epochs.
The first of these officially published maps was the “Map of recent vertical crustal movements of Eastern Europe” [53,54]. The initial and final epochs of re-leveling varied between 1933–1950 and 1968–1971, respectively. Later, at the XVI General Assembly of the IAG/IUGG, a report was presented clarifying the contents of this map [55]. By this time, the state program for the development of class I and II leveling in the territory of the USSR, adopted in 1968, had been successfully completed. When calculating the velocities of vertical movements, special attention was paid to the Caucasus region. The total length of the lines of the new re-leveling of the Caucasus was 3.2 thousand km. This provided determinations of the velocities of vertical movements of 266 new leveling benchmarks. On this map, an intensive uplift of the Greater Caucasus Range was discovered for the first time.
The second cartographic model of vertical movements was the map of recent vertical crustal movements in the territories of Bulgaria, Hungary, East Germany, Poland, Romania, USSR (European part), and Czechoslovakia [56]. Vertical movements were determined as a result of a leveling cycle carried out in 1959–1975. Regardless of foreign territories, a map of recent vertical movements for the territory of the USSR was compiled [57]. On these two maps, the information about the vertical movements of the Caucasus was the same.
The third result of determining the RVCM of the Caucasus is reflected on the map of vertical movements of the Earth’s surface of the Caspian region [58,59,60]. The velocities of vertical movements were determined from the last two measurement cycles. The average time interval between repeated measurements was 29 years.
The accuracy of determining the velocities of vertical movements of the three indicated maps is statistically uniform and varies within the range of 0.2–2.6 mm/year.
All published cartographic models of vertical movements of the Caucasus region predominantly demonstrated the uplift of the Earth’s surface of mountain structures and the subsidence of low relief forms. The high seismic activity of the region prompted us to study similar uplifts in other regions of the Earth based on previously published results.

3. Crustal Uplifts and Seismicity

3.1. Crustal Uplifts and Seismicity in Different Regions of the World

Studies of recent movements of the Earth’s surface using geodetic methods, both in Russia and abroad, have a centuries-old history. Today, the seismically active regions of the world are the most studied within this scientific direction. The reasons for this circumstance are obvious and are associated with the natural desire of society to understand the processes of generation for destructive earthquakes and ensure safe living in these regions. Over recent decades, especially in the 1970s–1980s, the greatest attention of researchers was drawn to identifying the connection between recent movements and deformations of the Earth’s crust with seismic activity and, in particular, to the search for short-term deformation precursors of strong earthquakes. For these purposes, special geodynamic test areas were created in seismically active zones, providing regular monitoring of the movements and deformations of the territories they cover. Systematic work at geodynamic test areas made it possible to identify patterns in the “behavior” of the Earth’s surface before, during, and after strong earthquakes. The vertical deformations of the Earth’s surface accompanying strong earthquakes have been studied the most extensively, and most importantly, the patterns of deformation during the preparation of strong seismic events have been identified. One of the more interesting scientific results is the above-mentioned diagram of the course of vertical movements of the Earth’s surface in the period of preparation, during and after the earthquake, formulated by Yu.A. Mescherikov [44]. Later, it was detailed by other researchers.
Regular, with a recurrence of at least 4 times a year, repeated determinations of excesses along leveling lines of classes I and II can make it possible to detect medium- and short-term signs of preparation for a strong earthquake and, thus, give the occurrence-time prediction. However, these observations do not provide the location of a possible earthquake, as well as its long-term forecast.
In the mid-1960s–early 1970s, researchers of recent movements of the Earth’s surface, using precise leveling data, discovered interesting phenomena. These were large-scale uplifts of the Earth’s surface at velocities significantly exceeding the errors in their determinations and covering vast areas of hundreds of square kilometers or more. These are known and described in the scientific literature as cases of anomalous and large-scale uplifts of the Earth’s surface before earthquakes in Niigata M = 7.4 (Japan, 1964) [61] and in the Palmdale area (USA, Southern California) [62]. The last of which was not accompanied by a strong earthquake.
To date, several dozen cases of large-scale uplifts of the Earth’s surface in seismically active regions are known, most of which were preceded by strong earthquakes.
The coseismic uplift of the Earth’s crust in connection with the powerful earthquake of 22 April 1991 in Costa Rica is described in [63]. Coseismic uplifts as a result of mega-earthquakes in the subduction zones of Alaska (1964) and Chile (1960) are discussed in the article [64].
Several anomalous uplift events have been recorded in the Japanese archipelago. Mogi considered the uplift of the Earth’s crust in the Tokai area to be a precursor of a strong earthquake. In [65], using the author’s method of re-leveling data processing, it is shown that in the Tokai region, there is a conformable relative movement of the uplift and subsidence of the Earth’s crust. Moreover, the minor axis of the elliptical shape of these anomalies coincides with the direction of movement of the Philippine tectonic plate. This fact is interpreted as a connection with the subduction process and is considered a precursor of a strong earthquake. Uplifts of the Earth’s crust in the coastal areas of Japan in the Tokai region are considered medium-term precursors of a strong seismic event in [66]. The author shows that uplifts of the Earth’s crust in the indicated area occur approximately a decade before strong earthquakes. The reason for this is the process of subduction of the Philippine tectonic plate under the Eurasian plate at a velocity of 4–5 cm per year. Based on an analysis of precise leveling, an unfulfilled forecast of the next earthquake in the Tokai region for 2007 was calculated.
The Tohoku region, where the strongest earthquake of the last century occurred, will also be subject to the study of vertical movements of the Earth’s crust. The authors show that from 1966 to 1995, there was a stable interseismic tilt of the area towards the Japan Trench and an uplift in its southwestern part [67]. This anomaly is consistent with the geodynamic model of the subduction process. Two strong earthquakes occurred near the studied area: 1983 Nihonkai-chubu (M7.7) and 1978 Miyagi-Oki (M7.4). The epicenter of the latter is located near the epicenter of the Great East Japan Earthquake of 11 March 2011 (M = 9.0–9.1).
One case of anomalous uplift occurred on the west coast of Canada in the area of Vancouver Island [68], and two cases occurred at the beginning and in the second half of this century in Southern California [62,69,70].
In the region of the Western Transverse Ranges of Southern California, the rate of uplift of mountain structures was estimated using GPS, InSAR, precision leveling, and tide gauges [71,72]. The GPS data cover a five-year observation interval. InSAR observations were carried out from 1992 to 2009. Observations at tide gauges have been carried out for more than 70 years. Precision leveling covers a period of 30 to 70 years. The uplift of mountain structures at a rate of 1–2 mm/year is considered by the authors to be continuous. The observed uplift is associated with compression across the Big Band of the San Andreas Fault.
Using the original method of mathematical processing, GPS imaging, the vertical movements of the Sierra Nevada ridges were estimated [71]. A stable uplift at a rate of 2 mm/year was revealed almost throughout the entire mountain range. A decline in the uplift was observed during the drought period in California from 2011 to 2016.
The phenomenon of anomalous uplift of the Earth’s crust, according to leveling data, has been thoroughly studied by Chinese researchers [73] since nine episodes of anomalous uplift of the Earth’s surface before strong earthquakes were identified in Northern China.
The article [73] provides general information about known episodes of uplifts, presents patterns of the spatial distribution of uplifts and epicenters of future earthquakes, and formulates principles for identifying areas of high seismic risk and its formal assessment using available geodetic and seismological information.
The authors of [73] showed that strong earthquakes occur both within zones of anomalous uplifts of the Earth’s surface and in their immediate vicinity in areas of high values of horizontal gradients of vertical movements, i.e., in places of sharp transition from positive to negative deformations and vice versa. To identify an anomalous seismic region, the following principles are formulated [73]:
  • An area where the average rate of vertical deformations (uplifts) is significantly higher than the rate of neotectonic movements obtained from geological data can be considered an anomalous area;
  • Within the leveling network, an area with uplift rates exceeding the average deformation rate for the entire territory can be considered an anomalous area;
  • An area where the uplift rate is more than twice as high as the mean square error in determining the speed at the “weakest” point of the leveling network can also be considered an anomalous area.
Retrospective analysis of information on the velocities of vertical movements and seismicity in the Carpatho-Balkan region using a map of vertical movements compiled under the scientific supervision of Istvan Joo [74,75,76] showed that before the strongest seismic events of the Balkans—the Vrancea earthquakes—there were also anomalous uplifts of the Earth’s surface, shown on the maps.
In recent decades, the ability to monitor vertical movements of the Earth’s surface using InSAR satellite remote sensing tools has been realized. We will mention here only some of the results of determining vertical movements in mountainous areas in connection with seismic and volcanic activity, as those closest to the subject of our research, and also refer to a review of the capabilities and areas of application of the method.
In its original form, the method offers the possibility of determining the displacement of the Earth’s surface along the line of sight, which does not always correspond to the vertical. Some limitations of the InSAR method can be overcome by combining it with GNSS. A thorough review of the use of a combination of InSAR and GNSS in Europe is presented in [77]. The review examines numerous areas of application of the combination of these methods, not only for solving geodynamic problems, based on a study of about two hundred scientific publications. Such an extensive bibliography is of undoubted interest to researchers in various fields of geosciences.
Interesting studies of the uplift of mountain structures in Nepal are presented in [78]. The authors estimate the rate of uplift of the central part of Nepal and try to reconcile this estimate with the tectonic mechanism of mountain building. The authors explain the obtained growth rate of the central part of the Main Himalayan Thrust (MHT) system of 7 mm/year by the lateral sliding rate of 18–21 mm/year in the direction of movement of the Indian Plate to the north. At the same time, the authors emphasize that the interseismic rise is facilitated by the elastic locking of the MHT during this period. This situation is similar to the geodynamic features of the rise of the Caucasus.
Local studies of post-seismic displacements in connection with the strong earthquake Palu Mw7.4 (28 September 2018) on the island of Sulawesi (Indonesia) are described in the article [79]. In different parts of the study area, displacements vary from subsidence to uplift in the range from −10 to +5 cm. The authors compare two alternative hypotheses for the mechanism of post-seismic deformation in the epicentral zone of the earthquake.
In the volcanic region of the Central Andes, InSAR identified regular rises associated with stress in volcanic chambers and the formation of a magmatic intrusion at a depth of 10 km [80]. Uplifts at a rate of up to 3 cm/year were identified in the interval of 2003–2008 in the area of existing eruptive fissures. At the same time, no volcanic eruptions occurred on the surface.

3.2. Recent Uplifts of the Earth’s Crust, Seismicity, and Geodynamics of the Caucasus

Today, we can say that the geotectonic evolution of the Caucasus remains insufficiently studied. There is no unambiguous idea about the occurrence of geological processes in the region. In the territories of the Caucasus region, according to the precise leveling data before strong earthquakes, anomalous uplifts of the Earth’s surface were identified [81,82] (Figure 5, Figure 6 and Figure 7). These include three episodes of uplifts that occurred in the Caucasus region, two in the Greater Caucasus (Figure 5 and Figure 7), and one in the Lesser Caucasus near the tragic Spitak earthquake (Figure 6).
It can be seen that uplifts are characteristic of positive relief forms, while subsidence is observed in intermountain depressions. The territory of the Absheron Peninsula is also experiencing subsidence, which is explained by the production of hydrocarbons in this area.
On all maps, differences in the coverage of the territories of the west and east of the region by uplifts are obvious, which is noted in the difference in the geodynamics of these territories [9]. It can be noted that, according to all the geophysical fields discussed above, the Eastern Caucasus differs from the Western.The paper [83] presents an attempt to assess the vertical movements of the Earth’s crust in the Greater Caucasus based on research data from the Russian–German WEGENER project [5] to evaluate modern geotectonic concepts. Repeated GNSS measurements from 1993 to 1994 were used. This period practically continues the time interval of research reflected on the third map of the RVCM (Figure 7). These independent studies, using a qualitatively different geodetic method, showed results very close to the results of precise leveling. At the same time, the authors identify the zone of the trans-Caucasian transverse uplift, which is experiencing uplift at a rate of about 1 cm/year, as more mobile.
In the 21st century, assessments of vertical movements in the Caucasus were carried out within the framework of local and short-term studies. The work [8] estimated the velocity of vertical movements in the Central Caucasus at the stations Zelenchuk (ZECK), Kislovodsk (KISL), Vladikavkaz (VLKK), and Terskol (TRSK). For the periods 2007–2013 (KISL), 2005–2014 (TRSK), and 2008–2014 (VLKK), uplift rates of +3.6, +4.4, and +2.5 mm/year were obtained, respectively. The highest velocity of uplift is demonstrated by the TRSK station, which is closest to the axis of the Greater Caucasus Range. Thus, during this period, the uplift of the Greater Caucasus in its central part continued.
For the territory of the North Caucasus in 2005–2019, according to GNSS data, estimates of vertical movements were obtained [84]. Due to the small territorial coverage of the region, it is generally very difficult to compare the results in detail with studies of the last century. Nevertheless, there is a reason to talk about maximum movement velocities of up to +4 mm near the central part of the Greater Caucasus Range.
The modern GNSS observation data suggest the continuation of moderate uplift of the Earth’s crust in certain local parts of the region in the 21st century.
The Greater Caucasus Range experienced intense uplifts twice, interrupted by an epoch of calm (Figure 5 and Figure 7). For a better and more detailed understanding of this phenomenon, the separate precision leveling line Zelenchuk–Sukhumi, repeated three times and crossing the Greater Caucasus Range, should be considered (Figure 8).
In the last century, the mountain structures of the Lesser Caucasus demonstrated one uplift, which ended with a partial collapse in the Spitak earthquake zone (Figure 6 and Figure 7).
An interesting fact that testifies to the reality of a connection between anomalous uplifts of the Earth’s surface in different regions of the world and strong earthquakes is their location within and nearby (in high-gradient zones of transition from subsidence to uplift) from the territories of anomalous uplifts (Figure 5, Figure 6 and Figure 7). At the same time, there are areas of anomalous uplifts that were not followed by earthquakes (or have not yet followed). Such an area is the Stavropol uplift, isolated from the uplift of the Greater Caucasus (Figure 5, Figure 6 and Figure 7), located on a tectonic platform. Noteworthy is the fact that in 1921, a strong earthquake with M ~ 6.0 occurred within this area. These circumstances force us to consider this area seismically hazardous.
Analysis of the data at our disposal made it possible to identify both similarities and differences in the course of deformation and seismic processes in the Caucasus with similar cases in other regions of the world.
The main difference is that the areas covered by anomalous deformations of the Earth’s surface in the Caucasus are much larger, for example, the areas of anomalous deformations in Northern China [73]. This circumstance can be explained, for example, by the fact that in Northern China, repeated leveling is carried out much more often than in the territories of the former USSR and Eastern Europe. In seismically active regions of China, leveling is repeated at intervals of 1–5 years. This is 5–10 times more common than in the countries of the former USSR and Eastern Europe. While in China, every uplift is associated with only one strong earthquake [73], in the Caucasus, uplifts were accompanied by several earthquakes. More frequent repeated measurements and a denser leveling network could provide greater detail in the description of vertical deformations. However, general patterns exist for the majority of all cases that were considered. It is possible the general uplift of the Greater Caucasus Range [53] (Figure 5) was formed by more local extremes responsible for the generation of a specific earthquake. When generalizing the information displayed on a small-scale map, they turned out to be expressed in the form of a general regional uplift. In the scientific literature, there are cases when one general uplift consists of two local ones, for example, the Palmdale uplift [62] in Southern California or the Spitak uplift. The second local extremum of Spitak uplift is located near Lake Sevan [85]. There are known cases of migration of uplifts [62,65], the periodicity of their formation [62], and stress relaxation leading to the collapse of the uplift [62].
Interestingly, this collapse was recorded by measurements taken immediately before the Spitak earthquake in the fall of 1988. This situation does not contradict the mentioned scheme of Yu.A. Mescherikov [44], and the moment of “collapse” (change of uplift by subsidence) fits into this scheme as a short-term precursor of a strong earthquake.
We plotted strong earthquakes in the region with M > 5.9 (Table 1) on RVCM maps (Figure 5, Figure 6 and Figure 7) in such a way that the time of their occurrence followed one or another uplift of the Greater and Lesser Caucasus. We adhere to the assumption that high rates of recent movements in seismically active regions are characteristic of the interseismic phase of the seismic cycle. Such movements help relieve elastic pre-seismic stresses, while movements at low speeds indicate an increase in seismic hazard.
The spatial distribution of strong earthquakes fits into this concept. It is noteworthy that their epicenters, with rare exceptions, attract towards the boundaries of previous uplifts (Figure 5, Figure 6 and Figure 7).
Let us present periods of uplifts and subsequent strong earthquakes in Figure 9.
Note that the two earthquakes of 1991 fall within the interval of the second uplift of the Greater Caucasus. This ambiguity is associated with unclear time boundaries of the elevation intervals due to the non-simultaneity of the epochs of leveling during the first and second observation cycles.
The 1940 earthquake with M = 6 does not fall into the area of uplift but is located in the zone of weak subsidence in the area of the intermontane depression. This fact requires a special, more subtle study.
The situation presented in Figure 9 makes it possible to calculate statistical estimates. Thus, the average duration of periods of high probability of strong earthquakes in the Caucasus region after observed uplifts is 20 + 7 years. This is statistically consistent with the author’s conclusion [66] that earthquakes in the considered region occur on average 10 years after the uplift. The average frequency of earthquakes within the dangerous interval is one event in 6 years.

4. Conclusions

Collection, analysis, and generalization of published instrumental data on modern uplifts of the Earth’s crust in the Caucasus, in comparison with regional geophysical fields, tectonics, seismicity, and similar phenomena in other regions of the world, allowed us to draw the following principal conclusions.
  • Recent estimates of neotectonic uplifts of the Caucasus, geophysical models of sedimentary layer thickness, gravity anomalies, Moho depth, and geoid heights demonstrate clear mutual consistency. They are reflected in the relief and obviously do not contradict modern plate tectonic ideas of the region’s development;
  • The distribution of moderate and strong seismicity is also consistent with the nature of the relief, the positions of tectonic faults, and the geophysical fields of the region;
  • A review of studies of geodynamics and tectonics of the Caucasus based on recent instrumental observations of crustal movements and seismic activity indicates the inconsistency of modern tectonic concepts. There is no clear consensus in the authors’ conclusions regarding the mechanisms of mountain building;
  • The longest quasi-centurial history and spatial coverage of instrumental observations of recent movements of the Earth’s crust in the Caucasus has precise leveling at the territory of the region. Several cartographic models of the RVCM have been published. The accuracy of determining the velocities of vertical movements of the Earth’s crust was 0.2–2.6 mm/year;
  • Analysis of the world’s scientific publications on uplifts of the Earth’s crust indicates that these phenomena are not unique. Uplifts are characteristic of tectonic plate collision zones, including subduction zones. Their manifestation is natural in zones of volcanic activity as a sign of inflation of magma chambers. In some cases, uplifts are associated with seismic activity as precursors of events and/or post-seismic phenomena;
  • Over a century, the Caucasus region has been subject to rapid vertical movements of the Earth’s crust. Mountain structures experience uplifts at velocities of more than 1 cm per year, alternating with periods of movements of variable sign direction at low velocities. Intermontane depressions experience subsidence. The available results of determining vertical movements suggest that the mountain structures of the Caucasus are growing, continuing the tectonic development of the last geological period.
    The zones of recent uplifts are consistent with the zones of extremes of various regional geophysical fields: gravity anomalies, Mohorovicic surface, and others. This indicates the deep tectonic nature of the observed uplifts;
  • The uplifts of the Greater and Lesser Caucasus demonstrate the connection with strong earthquakes occurring mainly on the periphery of the areas of their high-velocity uplifts. Strong earthquakes occur during periods of completion of rapid vertical movements during the first decades after them, with an approximate frequency of one event every 6 years. Periods of quiet in the observed uplifts of the Caucasus allow us to consider them temporary precursors of a regional increase in seismic activity.
Precise leveling across the region provides important information for understanding geodynamic mechanisms and testing modern tectonic concepts. It would be very useful to carry out the next cycle of leveling in the region within the framework of international scientific cooperation. The densification of the regional network of continuous GNSS observations should also contribute to the solution of this important scientific problem.

Author Contributions

Conceptualization, V.I.K.; data curation, V.I.K., A.I.M., A.M.A. and I.V.L.; formal analysis, A.I.M., B.A.D. and B.V.D.; funding acquisition, A.D.G. and B.A.D.; investigation, V.I.K., A.D.G., A.I.M., B.A.D., V.N.T., B.V.D., A.M.A. and I.V.L.; methodology, V.I.K., A.I.M. and V.N.T.; project administration, A.D.G. and B.A.D.; resources, A.D.G. and B.A.D.; software, A.I.M.; supervision, V.I.K., A.D.G. and B.A.D.; validation, V.I.K., A.I.M., V.N.T., A.M.A. and I.V.L.; visualization, A.I.M., A.M.A. and I.V.L.; writing—original draft, V.I.K., A.D.G., A.I.M., B.A.D., V.N.T., B.V.D., A.M.A. and I.V.L.; writing—review and editing, V.I.K., A.D.G., A.I.M., B.A.D., V.N.T., B.V.D., A.M.A. and I.V.L. All authors have read and agreed to the published version of the manuscript.

Funding

The reported study was funded by the Russian Science Foundation, project number 23-17-00176, “System Seismic Hazard Assessment of the Central Part of the Greater Caucasus (Ossetian sector)”.

Data Availability Statement

Not applicable.

Acknowledgments

This work employed data provided by the Shared Research Facility «Analytical Geomagnetic Data Center» of the Geophysical Center of RAS (http://ckp.gcras.ru/, accessed on 1 November 2023).

Conflicts of Interest

The authors declare no conflicts of interest.

References

  1. Prawirodirdjo, L.; Bock, Y. Instantaneous global plate motion model from 12 years of continuous GPS observations. J. Geophys. Res. 2004, 109, B08405. [Google Scholar] [CrossRef]
  2. Graham, S.E.; Loveless, J.P.; Meade, B.J. Global plate motions and earthquake cycle effects. Geochem. Geophys. Geosyst. 2018, 19, 2032–2048. [Google Scholar] [CrossRef]
  3. Dzeboev, B.; Soloviev, A.; Dzeranov, B.; Karapetyan, J.; Sergeeva, N. Strong earthquake-prone areas recognition based on the algorithm with a single pure training class. II. Caucasus, M ≥ 6.0. Variable EPA method. Russ. J. Earth Sci. 2019, 19, ES6005. [Google Scholar] [CrossRef]
  4. Prilepin, M.T.; Baranova, S.M.; Guseva, T.V.; Mishin, A.V.; Rogozhin, E.A.; Rozenberg, N.K.; Skovorodkin, Y.P.; Balasanyan, S.; Nadariya, M.; Hamburger, M.; et al. The kinematic study of the Caucasus region using GPS techniques. Izv. Phys. Solid Earth 1997, 33, 486–493. [Google Scholar]
  5. McClusky, S.; Balassanian, S.; Barka, A.; Demir, C.; Ergintav, S.; Georgiev, I.; Gurkan, O.; Hamburger, M.; Hurst, K.; Kahle, H.; et al. Global Positioning System constraints on plate kinematics and dynamics in the eastern Mediterranean and Caucasus. J. Geophys. Res. 2000, 105, 5695–5719. [Google Scholar] [CrossRef]
  6. Reilinger, R.; McClusky, S.; Vernant, P.; Lawrence, S.; Ergintav, S.; Cakmak, R.; Ozener, H.; Kadirov, F.; Guliev, I.; Stepanyan, R.; et al. GPS constraints on continental deformation in the Africa-Arabia-Eurasia continental collision zone and implications for the dynamics of plate interactions. J. Geophys. Res. 2006, 111, B05411. [Google Scholar] [CrossRef]
  7. Olifirov, V.G.; Ipatov, A.V.; Kaidanovskiy, M.N.; Kolitsov, N.E.; Korkin, E.I.; Potapenko, A.S.; Ipatova, I.A. “Zelenchukskaya” radio astronomical observatory—Status 2000. In Astrometry, Geodynamics and Celestial Mechanics on the Threshold of the 21st Century; Institute of Applied Astronomy of Russian Academy of Sciences: Saint Petersburg, Russia, 2000; pp. 400–409. (In Russian) [Google Scholar]
  8. Milyukov, V.K.; Mironov, A.P.; Rogozhin, E.A.; Steblov, G.M. Velocities of contemporary movements of the Northern Caucasus estimated from GPS observations. Geotectonics 2015, 49, 210–218. [Google Scholar] [CrossRef]
  9. Philip, H.; Cisternas, A.; Gvishiani, A.; Gorshkov, A. The Caucasus: An actual example of the initial stages of continental collision. Tectonophysics 1989, 161, 1–12. [Google Scholar] [CrossRef]
  10. Tibaldi, A.; Tsereteli, N.; Varazanashvili, O.; Babayev, G.; Barth, A.; Mumladze, T.; Bonali, F.L.; Russo, E.; Kadirov, F.; Yetirmishli, G.; et al. Active stress field and fault kinematics of the Greater Caucasus. J. Asian Earth Sci. 2019, 188, 104108. [Google Scholar] [CrossRef]
  11. Ismail-Zadeh, A.; Adamia, S.; Chabukiani, A.; Chelidze, T.; Cloetingh, S.; Floyd, M.; Gorshkov, A.; Gvishiani, A.; Ismail-Zadeh, T.; Kaban, M.K.; et al. Geodynamics, seismicity, and seismic hazards of the Caucasus. Earth-Sci. Rev. 2020, 207, 103222. [Google Scholar] [CrossRef]
  12. Guseva, T.V.; Lukk, A.A.; Mishin, A.V.; Prilepin, M.T.; Shevchenko, V.I.; Yunga, S.L. Geodynamics of the Greater Caucasus: Evidence from geodetic measurements. Dokl. Earth Sci. 1998, 361, 850–854. [Google Scholar]
  13. Tan, O.; Taymaz, T. Active tectonics of the Caucasus: Earthquake source mechanisms and rupture histories obtained from inversion of teleseismic body waveforms. In Postcollisional Tectonics and Magmatism in the Mediterranean Region and Asia: Geological Society of America Special Paper 409; Dilek, Y., Pavlides, S., Eds.; GeoScienceWorld: McLean, VA, USA, 2006; pp. 531–578. [Google Scholar] [CrossRef]
  14. Kaban, M.; Gvishiani, A.; Sidorov, R.; Oshchenko, A.; Krasnoperov, R. Structure and Density of Sedimentary Basins in the Southern Part of the East-European Platform and Surrounding Area. Appl. Sci. 2021, 11, 512. [Google Scholar] [CrossRef]
  15. Förste, C.; Bruinsma, S.L.; Abrikosov, O.; Lemoine, J.-M.; Marty, J.C.; Flechtner, F.; Balmino, G.; Barthelmes, F.; Biancale, R. EIGEN-6C4 the Latest Combined Global Gravity Field Model Including GOCE Data Up to Degree and Order 2190 of GFZ Potsdam and GRGS Toulouse; GFZ Data Services: Potsdam, Germany, 2014. [Google Scholar]
  16. Tesauro, M.; Kaban, M.K.; Cloetingh, S. EuCRUST-07: A new reference model for the European crust. Geophys. Res. Lett. 2008, 35. [Google Scholar] [CrossRef]
  17. Kaban, M.K.; El Khrepy, S.; Al-Arifi, N.; Tesauro, M.; Stolk, W. Three dimensional density model of the upper mantle in the Middle East: Interaction of diverse tectonic processes. J. Geophys. Res. Solid Earth 2016, 121, 5349–5364. [Google Scholar] [CrossRef]
  18. Ershov, A.V.; Brunet, M.-F.; Korotaev, M.V.; Nikishin, A.M.; Bolotov, S.N. Late Cenozoic burial history and dynamics of the Northern Caucasus molasse basin: Implications for foreland basin modelling. Tectonophysics 1999, 313, 219–241. [Google Scholar] [CrossRef]
  19. Mosar, J.; Kangarli, T.; Bochud, M.; Glasmacher, U.A.; Rast, A.; Brunet, M.-F.; Sosson, M. Cenozoic-Recent tectonics and uplift in the Greater Caucasus: A perspective from Azerbaijan. Geol. Soc. 2010, 340, 261–280. [Google Scholar] [CrossRef]
  20. Milanovsky, E.E. Recent Tectonics of the Caucasus; Nedra: Moscow, Russia, 1968; 483p. (In Russian) [Google Scholar]
  21. Milanovsky, E.E.; Khain, V.E. Main features of the tectonic development of the Alpine Mediterranean-Indonesian belt. In Orogenic Belts; Nauka: Moscow, Russia, 1968. (In Russian) [Google Scholar]
  22. Shebalin, P.N.; Gvishiani, A.D.; Dzeboev, B.A.; Skorkina, A.A. Why Are New Approaches to Seismic Hazard Assessment Required? Dokl. Earth Sci. 2022, 507, 930–935. [Google Scholar] [CrossRef]
  23. Storchak, D.A.; Di Giacomo, D.; Bondár, I.; Engdahl, E.R.; Harris, J.; Lee, W.H.K.; Villaseñor, A.; Bormann, P. Public Release of the ISC-GEM Global Instrumental Earthquake Catalogue (1900–2009). Seismol. Res. Lett. 2013, 84, 810–815. [Google Scholar] [CrossRef]
  24. Storchak, D.A.; Di Giacomo, D.; Engdahl, E.R.; Harris, J.; Bondár, I.; Lee, W.H.K.; Bormann, P.; Villaseñor, A. The ISC-GEM Global Instrumental Earthquake Catalogue (1900–2009): Introduction. Phys. Earth Planet. Inter. 2015, 239, 48–63. [Google Scholar] [CrossRef]
  25. Di Giacomo, D.; Engdahl, E.R.; Storchak, D.A. The ISC-GEM Earthquake Catalogue (1904–2014): Status after the Extension Project. Earth Syst. Sci. Data 2018, 10, 1877–1899. [Google Scholar] [CrossRef]
  26. International Seismological Centre. ISC-GEM Earthquake Catalogue. 2023. Available online: http://www.isc.ac.uk/iscgem/download.php (accessed on 1 November 2023). [CrossRef]
  27. Mumladze, T.; Forte, A.M.; Cowgill, E.S.; Trexler, C.C.; Niemi, N.A.; Yıkılmaz, M.B.; Kellogg, L.H. Subducted, detached, and torn slabs beneath the Greater Caucasus. GeoResJ 2015, 5, 36–46. [Google Scholar] [CrossRef]
  28. Trifonov, V.G.; Sokolov, S.Y. Structure of the mantle and tectonic zoning of the central Alpine-Himalayan belt. Geodyn. Tectonophys. 2018, 9, 1127–1145. [Google Scholar] [CrossRef]
  29. Abrehdari, S.; Karapetyan, J.; Rahimi, H.; Geodakyan, E. The Caucasus territory hot-cold spots determination and description using 2D surface waves tomography. Russ. J. Earth Sci. 2022, 22, ES5004. [Google Scholar] [CrossRef]
  30. Ioganson, L.I. Generalizing tectonic hypotheses of V.V. Belousov. BMOIP 2012, 87, 80–84. (In Russian) [Google Scholar]
  31. Pavlenkova, N.I.; Ioganson, L.I. Geodynamic phenomenon of the Black Sea-Caucasus-Caspian region. Structure, material composition, properties, modern geodynamics and seismicity of platform territories and adjacent regions. In Proceedings of the XXII All-Russian Scientific-Practical Shukino Conference, Voronezh, Russia, 22–25 September 2020; pp. 264–269. (In Russian). [Google Scholar]
  32. Lukk, A.A.; Shevchenko, V.I. Seismicity, tectonics, and GPS geodynamics of the Caucasus. Izv. Phys. Solid Earth 2019, 55, 626–648. [Google Scholar] [CrossRef]
  33. Milyukov, V.K.; Mironov, A.P.; Ovsyuchenko, A.N.; Rogozhin, E.A.; Gorbatikov, A.V.; Drobyshev, V.N.; Khubaev, K.M.; Nikolaev, A.V. Velocities of Present-Day Horizontal Movements in the Central Sector of the Greater Caucasus according to GPS Observations and Their Relation to Tectonics and the Deep Structure of the Earth’s crust. Dokl. Earth Sci. 2018, 481, 879–882. [Google Scholar] [CrossRef]
  34. Belousov, V.V. Geotectonics; Springer: Berlin/Heidelberg, Germany, 2011; 330p. [Google Scholar]
  35. Rastsvetaev, L.M. Some features of the Late Alpine structure of the orogenic regions of the South of the USSR and tectonic stresses of recent times. In Newest Tectonics, Newest Sediments and Man; Moscow State University Publishing House: Moscow, Russia, 1973. (In Russian) [Google Scholar]
  36. Lukina, N.V. Some features of the neotectonic structure of the Greater Caucasus. Bull. Comm. Study Quat. Period 1983, 52, 29–41. (In Russian) [Google Scholar]
  37. Trifonov, V.G. The relationship between discontinuous and folded elements in the newest structure of the South of the USSR. In Internal Geodynamics; VSEGEI: Leningrad, Russia, 1972; Issue 2. (In Russian) [Google Scholar]
  38. Nikolaev, P.N. Methods of Tectonodynamic Analysis; Nikolaev, N.I., Ed.; Nedra: Moscow, Russia, 1992; 293p. [Google Scholar]
  39. Peive, A.V. Tectonics and magmatism. Izv. AN SSSR Seriya Geol. 1961, 3, 36–54. (In Russian) [Google Scholar]
  40. Mellors, R.J.; Jackson, J.; Myers, S.; Gök, R.; Priestley, K.; Yetirmishli, G.; Türkelli, N.; Godoladze, T. Deep Earthquakes beneath the Northern Caucasus: Evidence of Active or Recent Subduction in Western Asia. Bull. Seismol. Soc. Am. 2012, 102, 862–1288. [Google Scholar] [CrossRef]
  41. Gunnels, M.; Yetrimishli, G.; Kazimova, S.; Sandvol, E. Seismotectonic evidence for subduction beneath the Eastern Greater Caucasus. Geophys. J. Int. 2021, 224, 1825–1834. [Google Scholar] [CrossRef]
  42. Kangarli, T.N.; Kadirov, F.A.; Yetirmishli, G.J.; Aliyev, F.A.; Kazimova, S.E.; Aliyev, A.M.; Safarov, R.T.; Vahabov, U.G. Recent geodynamics, active faults and earthquake focal mechanisms of the zone of pseudosubduction interaction between the Northern and Southern Caucasus microplates in the southern slope of the Greater Caucasus (Azerbaijan). Geodyn. Tectonophys. 2018, 9, 1099–1126. [Google Scholar] [CrossRef]
  43. Ollier, C.D.; Pain, C.F. Neotectonic mountain uplift and geomorphology. Geomorfologiya. 2019, 4, 3–26. [Google Scholar] [CrossRef]
  44. Mescherikov, J.A. Recent crustal movements in seismic regions: Geodetic and geomorphic data. Tectonophysics 1968, 6, 29–39. [Google Scholar] [CrossRef]
  45. Kaftan, V.I.; Ostach, O.M. Vertical land deformation in Caucasus region. Earthq. Predict. Res. 1996, 5, 235–245. [Google Scholar]
  46. Instruction of Leveling of I, II, III and IV Orders. Federal Survey of Geodesy and Cartography of Russia; Kartgeocenter-Geodezizdat: Moscow, Russia, 2004; p. 244. (In Russian)
  47. Kuznetsov, Y.G. State leveling network (Main height reference frame). In Gravimetry and Geodesy; Scientific World: Moscow, Russia, 2010; pp. 287–299. (In Russian) [Google Scholar]
  48. Lilienberg, D.A.; Kaftan, V.I.; Kuznetsov, J.G.; Serebriakova, L.I. Cartographic models of recent tectonic movements’ variations for different epochs at the Caucasus and Transcaucasus. Geomorfologiya 1997, 4, 63–75. (In Russian) [Google Scholar]
  49. Lilienberg, D.A.; Yashchenko, V.R. Main trends in the geodynamics of mountain morphostructures of the Greater Caucasus according to new geodetic data. Geod. I Kartogr. 1991, 2, 21–28. (In Russian) [Google Scholar]
  50. Kaftan, V.I. Maps of recent crustal movements: Content and significance. Izv. Phys. Solid Earth 1996, 32, 42–53. [Google Scholar]
  51. Matskova, V.V. Map of Velocities of Recent Vertical Crustal Movements of Caucasus and SE near Azov Region, Recent Crustal Movements; Geophysical Committee of Academy of Sciences of USSR: Moscow, Russia, 1968; pp. 244–264. (In Russian) [Google Scholar]
  52. Loskutov, A.A.; Shoulmin, M.V.; Kaftan, V.I. Physical correlation of repeated geodetic measurements. J. Geodyn. 1988, 10, 139–146. [Google Scholar] [CrossRef]
  53. Map of Recent Vertical Crustal Movements of Eastern Europe; Scale 1/10,000,000, 1/2,500,000; Main Directorate of Geodesy and Cartography under the Council of Ministers of the USSR: Moscow, Russia, 1973.
  54. Boulanger, Y.; Entin, I.; Lilienberg, D.; Kashin, L.A. Summary map of the recent crustal movements for Eastern Europe. In Proceedings of the XV General Assembly of IUGG, Moscow, Russia, 2–14 August 1971; International Geophysical Committee of Academy of Science of USSR: Moscow, Russia, 1971. [Google Scholar]
  55. Meschersky, I.N.; Korokina, T.P. Some evidence of recent vertical movements of the Earth’s surface in the USSR. In Proceedings of the XVI-th General Assembly, IAG IUGG, Grenoble, France, 25 August—6 September 1975. [Google Scholar]
  56. Map of Recent Vertical Crustal Movements on the Territory of Bulgaria, Hungary, East Germany, Poland, Romania, USSR (European part), Czechoslovakia; Scale 1/2,500,000; Main Directorate of Geodesy and Cartography under the Council of Ministers of the USSR: Moscow, Russia, 1986.
  57. Map of Recent Vertical Movements for the Territory of the USSR; Main Directorate of Geodesy and Cartography under the Council of Ministers of the USSR: Moscow, Russia, 1989.
  58. Kaftan, V.I.; Kuznetsov, Y.G.; Serebryakova, L.I.; Vereshchetina, A.V. Map of velocities of recent vertical crustal movements in the Caspian region. In Proceedings of the 1st International Symposium on Recent Deformations, ISTANBUL-95, Istanbul, Turkey, 5–9 September 1995; Volume 2, pp. 825–831. [Google Scholar]
  59. Kuznetsov, Y.G.; Bebutova, V.K.; Kaftan, V.I.; Vereschetina, A.V.; Serebriakova, L.I. Map of Modern Vertical Movements of the Earth’s Surface of the Caspian Region; Central Scientific Research Institute of Geodesy, Aerial Survey and Cartography: Moscow, Russia, 1996. [Google Scholar]
  60. Kuznetsov, Y.G.; Kaftan, V.I.; Bebutova, V.K.; Serebriakova, L.I.; Vereschetina, A.V. Recent vertical movements of the Earth’s surface of Near Caspian region. Geod. I Kartogr. 1997, 9, 29–35. (In Russian) [Google Scholar]
  61. Mogi, K. Earthquake Prediction; Academic Press: Japan, Tokyo, 1985; 355p. [Google Scholar]
  62. Castle, R.O.; Simpson, R.W. An early-20th-century uplift in Southern California: Associations with seismicity. In Proceedings of the China-Unated States Symposium on Crustal Deformation and Earthquakes, Beijing, China, 29–31 October 1988; Seismological Press: Beijing, China, 1988; pp. 44–51. [Google Scholar]
  63. Plafker, G.; Ward, S.N. Backarc thrust faulting and tectonic uplift along the Caribbean Sea Coast during the April 22, 1991 Costa Rica earthquake. Tectonics 1992, 11, 709–718. [Google Scholar] [CrossRef]
  64. Plafker, G. Alaskan earthquake of 1964 and Chilean earthquake of 1960: Implications for arc tectonics. J. Geophys. Res. 1972, 77, 901–925. [Google Scholar] [CrossRef]
  65. Fujii, Y.; Xia, S. Estimation of distribution of the rates of vertical crustal movements in the Tokai District with the aid of least squares prediction. J. Phys. Earth. 1993, 41, 239–256. [Google Scholar] [CrossRef]
  66. Seno, T. Intermediate-term precursors of great subduction zone earthquakes: An application for predicting the Tokai earthquake. Earth Planets Space 2004, 56, 621–633. [Google Scholar] [CrossRef]
  67. El-Fiky, G.; Kato, T.; Fujii, Y. Distribution of vertical crustal movement rates in the Tohoku district, Japan, predicted by least-squares collocation. J. Geod. 1997, 71, 432–442. [Google Scholar] [CrossRef]
  68. Dragert, H.; Lisowski, M. Crustal Deformation Measurements on Vancouver Island, British Columbia: 1976 to 1988. In Global and Regional Geodynamics; Vyskocil, P., Reigber, C., Cross, P.A., Eds.; International Association of Geodesy Symposia; Springer: New York, NY, USA, 1990; Volume 101. [Google Scholar] [CrossRef]
  69. Castle, R.O.; Elliott, M.R.; Gilmore, T.D. An Early-20th-Century Uplift in Southern California; US Geological Survey Professional Paper 1362; U.S. Government Printing Office, United States: Washington, DC, USA; Geological Survey: Reston, VA, USA, 1987; 70p.
  70. Castle, R.O.; Elliott, M.R.; Church, J.P.; Wood, S.H. The Evolution of the Southern California Uplift, 1955 through 1976; US Geological Survey Professional Paper 1342; U.S. Government Printing Office: Washington, DC, USA; Geological Survey: Reston, VA, USA, 1984; 136p.
  71. Hammond, W.C.; Blewitt, G.; Kreemer, C. GPS Imaging of vertical land motion in California and Nevada: Implications for Sierra Nevada uplift. J. Geophys. Res. Solid Earth 2016, 121, 7681–7703. [Google Scholar] [CrossRef] [PubMed]
  72. Hammond, W.C.; Burgette, R.J.; Johnson, K.M.; Blewitt, G. Uplift of the Western Transverse Ranges and Ventura area of Southern California: A four-technique geodetic study combining GPS, InSAR, leveling, and tide gauges. J. Geophys. Res. Solid Earth 2018, 123, 836–858. [Google Scholar] [CrossRef]
  73. Wu, Y.; Han, J.; Yu, P. Features of crustal deformation field of long- and medium-term seismic risk area. J. Earthq. Predict. Res. 1996, 5, 277–285. [Google Scholar]
  74. Joó, I. The Map of Recent Vertical Movements in the CarpathoBalkan Region, Scale 1:1000 000 and Explanatory Description; Cartographia: Budapest, Hungary, 1985. [Google Scholar]
  75. Joó, I. On recent crustal movements in the Pannonian Basin. Acta Geod. Geophys. Mont. Hung. 1990, 25, 231–242. [Google Scholar]
  76. Joó, I.; Szőcs, H. The Connection of Recent Vertical Movements with Some Geological Characteristics Using Partial and Multiple Correlation Coefficients. In Geodesy and Physics of the Earth; Montag, H., Reigber, C., Eds.; International Association of Geodesy Symposia; Springer: Berlin/Heidelberg, Germany, 1993; Volume 112. [Google Scholar] [CrossRef]
  77. Del Soldato, M.; Confuorto, P.; Bianchini, S.; Sbarra, P.; Casagli, N. Review of Works Combining GNSS and InSAR in Europe. Remote Sens. 2021, 13, 1684. [Google Scholar] [CrossRef]
  78. Grandin, R.; Doin, M.-P.; Bollinger, L.; Pinel-Puysségur, B.; Ducret, G.; Jolivet, R.; Sapkota, S.N. Long-term growth of the Himalaya inferred from interseismic InSAR measurement. Geology 2012, 40, 1059–1062. [Google Scholar] [CrossRef]
  79. Yusiyanti, I.; Prajardi, T.W.K.; Saputri, Y.I.; Pratama, C. Vertical deformation model on postseismic phase using exponential and logarithmic function based on InSAR. Geod. Geodyn. 2023, 14, 392–400. [Google Scholar] [CrossRef]
  80. Ruch, J.; Walter, T.R. Relationship between the InSAR-measured uplift, the structural framework, and the present-day stress field at Lazufre volcanic area, central Andes. Tectonophysics 2010, 492, 133–140. [Google Scholar] [CrossRef]
  81. Kaftan, V. Anomalous land uplifts and seismicity in Caucasus. Ann. Geophys. 1996, 11 (Suppl. SI), 251. [Google Scholar]
  82. Kaftan, V.I.; Lilienberg, D.A. Recent Crustal Movements, in the National report to the International Association of Geodesy of the International Union of Geodesy and Geophysics 1995–1998. In Proceedings of the XXII General Assembly of IUGG, Birmingham, UK, 28–30 July 1999; pp. 27–33. [Google Scholar]
  83. Gurbanov, A.G.; Milyukov, V.K.; Gazeev, V.M.; Leksin, A.B.; Dokuchaev, A.Y.; Gurbanova, O.A. Estimation of the velocity vectors of modern horizontal and vertical displacements of lithospheric blocks in the territory of the Great Caucasus, according to GNSS data and their geodynamic interpretation. Vestn. Vladikavkaz Sci. Cent. 2023, 23, 49–61. (In Russian) [Google Scholar] [CrossRef]
  84. Guseva, T.V.; Krupennikova, I.S.; Mokrova, A.N.; Rozenberg, N.K.; Perederin, V.P. Recent deformations and seismicity at Northern Caucasus. In Proceedings of the XXII All-Russian Scientific-Practical Schukin Conference, Voronezh, Russia, 22–25 September 2020; pp. 115–119. (In Russian). [Google Scholar]
  85. Karapetyan, J.; Sargsyan, R.; Kazaryan, K.; Dzeranov, B.; Dzeboev, B.; Karapetyan, R. Current state of exploration and actual problems of tectonics, seismology and seismotectonics of Armenia. Russ. J. Earth Sci. 2020, 20, 3. [Google Scholar] [CrossRef]
Figure 1. Topography and main faults of the Caucasus region. Based on [13] with modification. 1—volcanos; 2—strike-slip fault and sense of motion; 3—thrust and dip direction; 4—Caucasus main trust; NEAF—Northeast Anatolian Fault; PSF—Pampak–Sevan Fault; GF—Garni Fault; TF—Tutak Fault; EAF—East Anatolian Fault; NAF—North Anatolian Fault; AS—Apsheron Sill; CMT—Caucasus main trust. 5—leveling route cross-section of Zelenchuk–Sukhumi.
Geosciences 14 00070 g001
Figure 2. Seismicity and movements of global lithosphere plates and individual blocks of the Caucasus crust. 1—directions of fault slips. 2—Bitlis–Zagros suture zone. 3—Caucasus main trust. Average rates and directions of movements are shown in mm/year according to [5].
Geosciences 14 00070 g002
Figure 3. Geophysical fields of the Caucasus region according to [14]. (a) Map of the sedimentary thickness; (b) depth to the Moho from the sea level; (c) height geoid anomalies derived from the EGM2008 model; (d) Bouguer gravity anomalies.
Geosciences 14 00070 g003
Figure 4. Map of vertical neotectonic movements during Late Miocene–Quaternary times, i.e., of the upper Sarmatian layer in the basin combined with estimates of uplift during this time in the orogenic areas by data [18,19].
Geosciences 14 00070 g004
Figure 5. The first uplift of the Greater Caucasus, according to data from [53], and subsequent strong earthquakes. A–A′—precision leveling profile of Zelenchuk–Sukhumi.
Geosciences 14 00070 g005
Figure 6. The uplift of the Lesser Caucasus, the period of calm in the rise of the Greater Caucasus according to [56], and subsequent earthquakes.
Geosciences 14 00070 g006
Figure 7. The second uplift of the Greater Caucasus, according to [58], and subsequent strong earthquakes.
Geosciences 14 00070 g007
Figure 8. Velocities of vertical movements along the Zelenchuk–Sukhumi leveling line. The thick brown line is the relief of the Earth’s surface. Red, blue, and green lines are graphs of changes in the velocities of vertical movements for different time intervals. Purple lines are projections of the main faults. The red star is the hypocenter of the 1963 Chkhalta earthquake.
Geosciences 14 00070 g008
Figure 9. Uplift of the Caucasus with strong earthquakes of M > 5.9. (a) The first uplift of the Greater Caucasus (the boundaries are shown in blue dotted lines) and subsequent earthquakes in its area; (b) uplift of the Lesser Caucasus (borders—purple dotted line) and subsequent Spitak earthquakes in 1988; (c) second uplift of the Greater Caucasus (borders—red dotted line) and subsequent strong earthquakes. Black vertical line—earthquake with M = 6, which does not fall into the area of the studied uplift.
Geosciences 14 00070 g009
Table 1. Strong earthquakes in the Caucasus region.
NoYearMonthDayTime, UTCLat.Long.Depth, kmMw
1.192022000:01:4941.92645.617155.97
2.192022011:44:4141.28845.632156.31
3.192421906:59:5639.20548.741356.01
4.19405722:23:4541.943.742156.02
5.196371618:27:2043.19841.564306.4
6.196642016:42:0641.70348.238206
7.197051409:20:2343.07847.13112.56.1
8.197051418:12:2743.19147.14156.7
9.197672820:17:4543.16645.66156.22
10.198812707:41:2740.89744.146106.75
11.198812707:45:4740.95344.214155.99
12.199142909:12:5042.38843.687176.96
13.199142918:30:4342.46143.837106.08
14.199161500:59:2242.37544.06106.25
15.1992102323:19:4742.57945.108156.4
16.19987914:19:2038.65348.578305.95
17.20099722:41:3842.59443.46619.75.98
Disclaimer/Publisher’s Note: The statements, opinions and data contained in all publications are solely those of the individual author(s) and contributor(s) and not of MDPI and/or the editor(s). MDPI and/or the editor(s) disclaim responsibility for any injury to people or property resulting from any ideas, methods, instructions or products referred to in the content.

