1. Introduction
The mountainous upstream reaches of the Kolyma River are characterized by diverse landscapes, reliefs, and climatic conditions, hence the dominant permafrost and hydrological processes. It is a remote and ecologically significant vast permafrost region which experiences strong impacts of climate warming. Over the past 50 years, mean annual air temperature in Northeastern Russia has increased on average by +2.2 °C [
1]. The warming trend observed in this region has led to changes in the thermal regime of permafrost, including thawing in some areas, primarily increasing the active layer thickness. These changes impact the stability of the periglacial landscape, altering frozen ground properties and potentially causing infrastructure damage [
2]. Additionally, shifts in the hydrological cycle [
1], such as changes in the timing and magnitude of river flow, as well as the dynamics and regime of groundwater [
3], can also result from the warming temperatures and improving hydraulic connectivity as the result of permafrost thaw. The region is rich in natural resources and important for the economic development of Russia [
4]; understanding environmental transformation in the context of climate change and anthropogenic impact is of paramount importance for sustainable resource management and the preservation of the delicate ecosystems in the study area.
One of the major obstacles for studying the physical mechanisms of heat and water fluxes in permafrost regions is the difficulty of obtaining the observation data in harsh climatic conditions. Active permafrost and hydrological studies of the region were conducted in the former Soviet period [
5,
6,
7,
8,
9]. Since the last research plot in this region (the Kolyma Water balance station, 1948–1997) has been halted [
10], no scientific data were available about environment characteristics of the area. The absence of monitoring and special observations data is aggravated with the scarcity of a regular observation network in those regions [
11]. The development of detailed complex stationary observations in small representative watersheds for studying environmental response to climate change have proved their effectivity in the Arctic region [
12,
13,
14,
15]. In Russia, an example of such a station with comprehensive observations of the state of permafrost could be the Chara research plot [
16]. The aim of this research is to study the current state of the natural environment in the mountainous permafrost zone of the upper reaches of the Kolyma River, as well as the mechanisms and factors of interactions between underground and surface water exchange processes and the hydrothermal regimes of permafrost in the context of environmental transformation due to climate change and anthropogenic impacts. To achieve this goal, a monitoring network, including meteorological, geocryological, hydrological, and hydrogeological gauges has been established in the mountainous part of the Kolyma River basin, following a watershed approach [
17]. Specialized research and surveys (geophysical, landscape studies, etc.) are also conducted. The research focuses on the Anmangynda River basin (376 km
2) due to the diversity of natural conditions and the representativeness of the catchment for the selected region and the availability of historical observation data from 1962 to 1990 [
18]. Despite the short length of presented data series, the obtained results are relevant and essential since there has not been any update on the environmental state of the region since the 1990s.
2. Study Area
The Kolyma Mountain Region occupies the eastern territories of Northeastern Siberia. It is situated in the upper reaches of the Kolyma River and its right tributaries. Administratively, it falls within the boundaries of the Magadan region of Russia. Its eastern border runs in proximity to mountain ranges, forming the watershed between the rivers flowing into the Arctic Ocean and the Pacific Ocean. The region consists of two major orographic units: the Upper Kolyma Highland and the Kolyma Uplands.
Geologically, the territory belongs to the Verkhoyano-Chukotka folded area which was formed in the Cimmerian era. The area is dominated by mesozoic sedimentary rocks. During the quarter era, the area experienced minor tectonic movements. The quaternary system is predominantly represented by alluvial, deluvial, and water-glacial deposits. The area is divided by numerous tectonic faults that may affect the groundwater regime.
The southern part of the region forms the Upper Kolyma Highland. To the west, it is bordered by the Tas-Kystabyt and Suntar-Khayata Ridges, while the northern boundaries adjoin the chains of the Chersky Range. The southern periphery of the Highland runs along the ranges forming the Okhotsk-Kolyma Watershed, including the Seimkan Mountains (1857 m), the Igandzha Massif (1777 m), and the Ol’skiye Stolovye Mountains (1662 m). To the east, it is limited by the Seimchan-Buyunda Depression. The average elevations of the Highland range from 1000 to 1200 m, with certain massifs rising above 2000 m. The highest point is the Snezhnaya Mount (2293 m) in the Bolshoy Angachak Massif. The ridges exhibit an alpine appearance with sharply defined relief forms.
The sparse larch forests are confined to the lower parts of mountain slopes and river valleys. Along the floodplains of major rivers, one can find fragrant poplar and willow stands. The upper limit of woody vegetation in the Kolyma River headwaters reaches 1200–1300 m asl, while on the Okhotsk-Kolyma watershed, it is found at 800–850 m asl, and in the far northern regions, it does not ascend above 300 m asl. The upper slopes of the mountains are occupied by dwarf cedar (Pinus pumila) bushes and tundra landscapes.
The climate of the region is subarctic continental. In the mountains, temperature inversions are observed in winter. The southeastern and eastern areas of the Kolyma River basin experience significant snowfall. The depth of the snow cover increases with altitude, ranging from 50–60 cm at 450 m asl to 100–110 cm at 1000 m asl. The annual precipitation ranges from 300 mm to 600–800 mm at the watersheds. Icing processes and the formation of giant spring aufeis are typical [
19].
The territory of the Upper Kolyma Highland is the most populated in the region. It is traversed by the Kolyma Highway and its branch, the Tenkinskaya Highway. This area is one of the most significant gold mining regions in Northeastern Siberia [
4].
The Anmangynda River Basin
The Anmangynda River basin belongs to the southern part of the Upper Kolyma Highland. The river originates from the northwestern flank of the Okhotsk-Kolyma watershed area. The length of the Anmangynda River is 44 km. In its upper reaches, it flows northward through a narrow valley and then turns northwest at the confluence with the Solontcovy Creek, expanding and branching into numerous watercourses (
Figure 1). The average width of the basin is about 13 km. The river joins the Detrin River (upper course of the Kolyma River) near the town of Ust-Omchug. In the area where it forms a giant aufeis field, its width reaches 2 km. The total area of the Anmangynda River watershed at the downstream end of the aufeis glade is 376 km
2.
The basin features a medium-mountainous, highly dissected relief. Absolute elevations range from 700 to 1850 m asl, with the watershed areas varying between 1500 and 1850 m asl, and the valley bottoms lying at 700 to 850 m asl. The highest point, Mount Aiman (1890 m), is located in the northeastern part, just beyond the watershed. Amidst the medium-mountainous terrain, the valley of the Olchan Creek stands out in the western part of the watershed, with lowered absolute elevations ranging from 700 to 1100 m asl. The tectonic faults shape the local relief. Approximately 15 km upstream from the confluence of the Olchan Creek with the Anmangynda River, a through valley can be observed, raised about 20 m relative to the riverbeds. This through valley follows a tectonic fault that crosses the entire basin [
19].
The river network is dense. The overall pattern of the hydrographic system most closely resembles a grid-like structure, which is a result of the complex processes of its formation due to multiple redistributions caused by recent tectonic movements and glacial processes [
20].
According to the Ust-Omchug weather station (w/s), the study area is characterized by severe winters and short summers with excessive moisture. The average air temperature in July and January is +14.6 and −33.4 °C, respectively (1967−2022). There are long and low-cloud winters (up to 7 months) with icy fogs. The absolute minimum reaches −58 °C, and the maximum reaches +28 °C. Snow cover is formed starting from the first days of October and ending in the late April. About 80% of snow falls before January. Aufeis has a significant effect on the microclimate. Air temperature in the area of aufeis field formation in the summer is lower by 2−3 °C compared to the weather station in Ust-Omchug. The beginning and end of summer is systematically accompanied by frosts, where the air temperature may drop to −10 °C. Precipitation falls unevenly, with the average monthly amount of precipitation in June, July and August being 49, 60 and 66 mm, respectively; the average annual precipitation is 341 mm (w/s Ust-Omchug).
The geological structure of the Anmangynda River basin includes sedimentary rocks of the Upper Triassic, Jurassic and Cretaceous, and a large number of discontinuous faults (through valleys). The main rocks composing this territory are limestone, sandstones and limestones, clay and sand-clay shales, siltstones, and sometimes tuffs. The area belongs to the zone of continuous permafrost, sometimes interrupted by talik zones. The thickness of permafrost reaches 200 m, deeper along watershed ridges and shallower in river valleys.
The vegetation is represented by tundra and forest-tundra species. The slopes of aufeis valleys are covered with a larch forest at moss-lichen litter, accompanied by dwarf cedar growth. Willows, dwarf birches, blueberry bushes, and moss litter grow at the aufeis glade.
The Anmangynda aufeis is located in the basin of the Anmangynda River close to within 155–159 km of the Tenka highway (Magadan region) and 30 km south-east from the town of Ust-Omchug (60°56′ N, 149°44′ E). The aufeis glade covers an area of 7.6 km
2 [
17]. In the 1970s, the aufeis reached an area of about 7 km
2 and a volume of over 11 million m
3 [
21].
In 1962, studies of the aufeis regime in the Anmangynda River basin were initiated to investigate the dynamics of icing processes. The research encompassed various aspects, such as determining the size and volume of aufeis, conducting mapping and documentation of aufeis formations, analyzing runoff formation processes, and investigating the impact of climatic factors on the aufeis regime. Furthermore, the study involved examining the hydrochemical composition of surface and aufeis flow, as well as exploring the mechanisms of aufeis formation [
22,
23].
Over the past 60 years, the maximum dimensions of the aufeis have decreased by 14.8% and 17.4% for area and volume, respectively. In 1963–1990, the aufeis area ranged from 4.3 to 6.8 km
2, while the volume varied from 5.3 to 11.7 million m
3. In 2000–2022, the aufeis area fluctuated between 3.5 and 5.4 km
2, and the calculated volume reached from 5.0 to 8.2 million m
3. Furthermore, the intra-year dynamics of the aufeis have also changed. Currently, the Anmangynda aufeis is entirely depleted by August–September, whereas previously a portion of the ice cover (approximately 4% of its maximum area) remained intact and contributed to the formation of aufeis in the following year. The aufeis ablation period has, on average, reduced by 34 days in comparison with the 1962–1990 period [
21].
The catchment of the Anmangynda River is representative of Northeast Russia, and the Anmangynda aufeis is the only research plot in the world with long-term observations, including the dynamics of area and volume of the aufeis field.
3. Materials and Methods
3.1. Ground Temperature and Dynamic of Ground Water Characteristics
In 2021, thermometric boreholes were drilled in the Anmangynda River basin without core sampling, reaching depths of 5, 13, and two at 15 m. The boreholes were equipped with plastic pipes with an internal diameter of 30 mm. Inside the pipes, the sensors were installed at various intervals: 0.1 m in the range up to 0.5 m, 0.25 m from 0.5 to 1.5 m, and from 1.5 to 5 or 15 m with 0.5 m spacing. An additional sensor was placed at a depth of 4.75 (14.75) m. The measurements are conducted every 4 h using automatic loggers (Impedans, Russia). The measurement accuracy is 0.1℃ in the temperature range from −3 °C to +3 °C, 0.2 °C in the ranges from −10 °C to −3 °C and from +3 °C to +10 °C, and 0.3 °C in the temperature range from −40 °C to −10 °C and from +10 °C to +85 °C. During the winter period, snow density measurements are conducted near the boreholes using a snow scale (snow weight gauge).
The thermometric boreholes are situated at an elevation ranging from 712 to 1027 m asl and are located in various landscape conditions, including tundra, larch sparse forest, aufeis field, and river floodplain (
Table 1,
Figure 2).
The “Sopka” borehole, with a depth of 15 m, is located in the upper reaches of the Anmangynda River basin at an elevation of 1027 m asl. The landscape is presented by a slightly inclined upland surface consisting of loose gravelly material, sporadically adorned with 5 cm thick lichen cover. Triassic sandy-clay shale formations underlay the surface.
The “Solontcovy” borehole is situated 50 m south of the Solontcovy Creek channel (a right tributary of the Anmangynda River) on a slightly inclined surface at an elevation of 803 m asl. The ground comprises coarse angular material with a sandy-silty filler. The landscape is characterized by a larch forest (up to 10 m height) with dwarf cedar, dwarf birch, and blueberry. The borehole exposed talik.
The “Aufeis” borehole is located at the aufeis glade, 500 m away from one of the main channels of the Anmangynda River. The vegetation consists of sparse blueberry and dwarf willow shrubs, as well as sporadic green moss cover. The alluvium comprises gravelly pebble deposits with a sandy-silty filler, whose thickness, according to geophysical investigations, can reach up to 12 m [
24,
25]. This borehole is of interest due to its location in the aufeis formation area, as it exposes a river talik.
Table 1.
The description of the boreholes.
Table 1.
The description of the boreholes.
| Borehole Title (Depth, m) | Elevation, m | Relief | Landscape and Vegetation [26] |
|---|
| Sopka (15) | 1027 | Slope | Mountain lichen and shrub stony tundra with occasional dwarf cedar bushes |
Solontcovy (5)
Solontcovy (8) 1 | 803 | Floodplain terrace | Floodplain of rivers and its tributaries with larch sparse forest with areas of Chozenia, poplar, or willow forests, and meadows |
Aufeis (13.1)
Upper Aufeis (8) 1
Lower Aufeis (8) 1 | 744 | Giant spring aufeis glade |
| GP2 (15) | 712 | Floodplain terrace of the Anmangynda River | Larch sparse forest with moist lichen-sphagnum, cloudberry-ledum-sedge dwarf birch bushes |
The “GP2” borehole is situated at the upper Neopleistocene terrace of the Anmangynda River, composed of silt with a subordinate amount of fine weakly rounded pebbles, underlain by sandy-clay shales. The elevation is 712 m. The vegetation comprises suppressed larch sparse forest with an understory consisting of dwarf birch, dwarf cedar, grassy vegetation with blueberries, sphagnum (up to 15 cm thickness), and lichens.
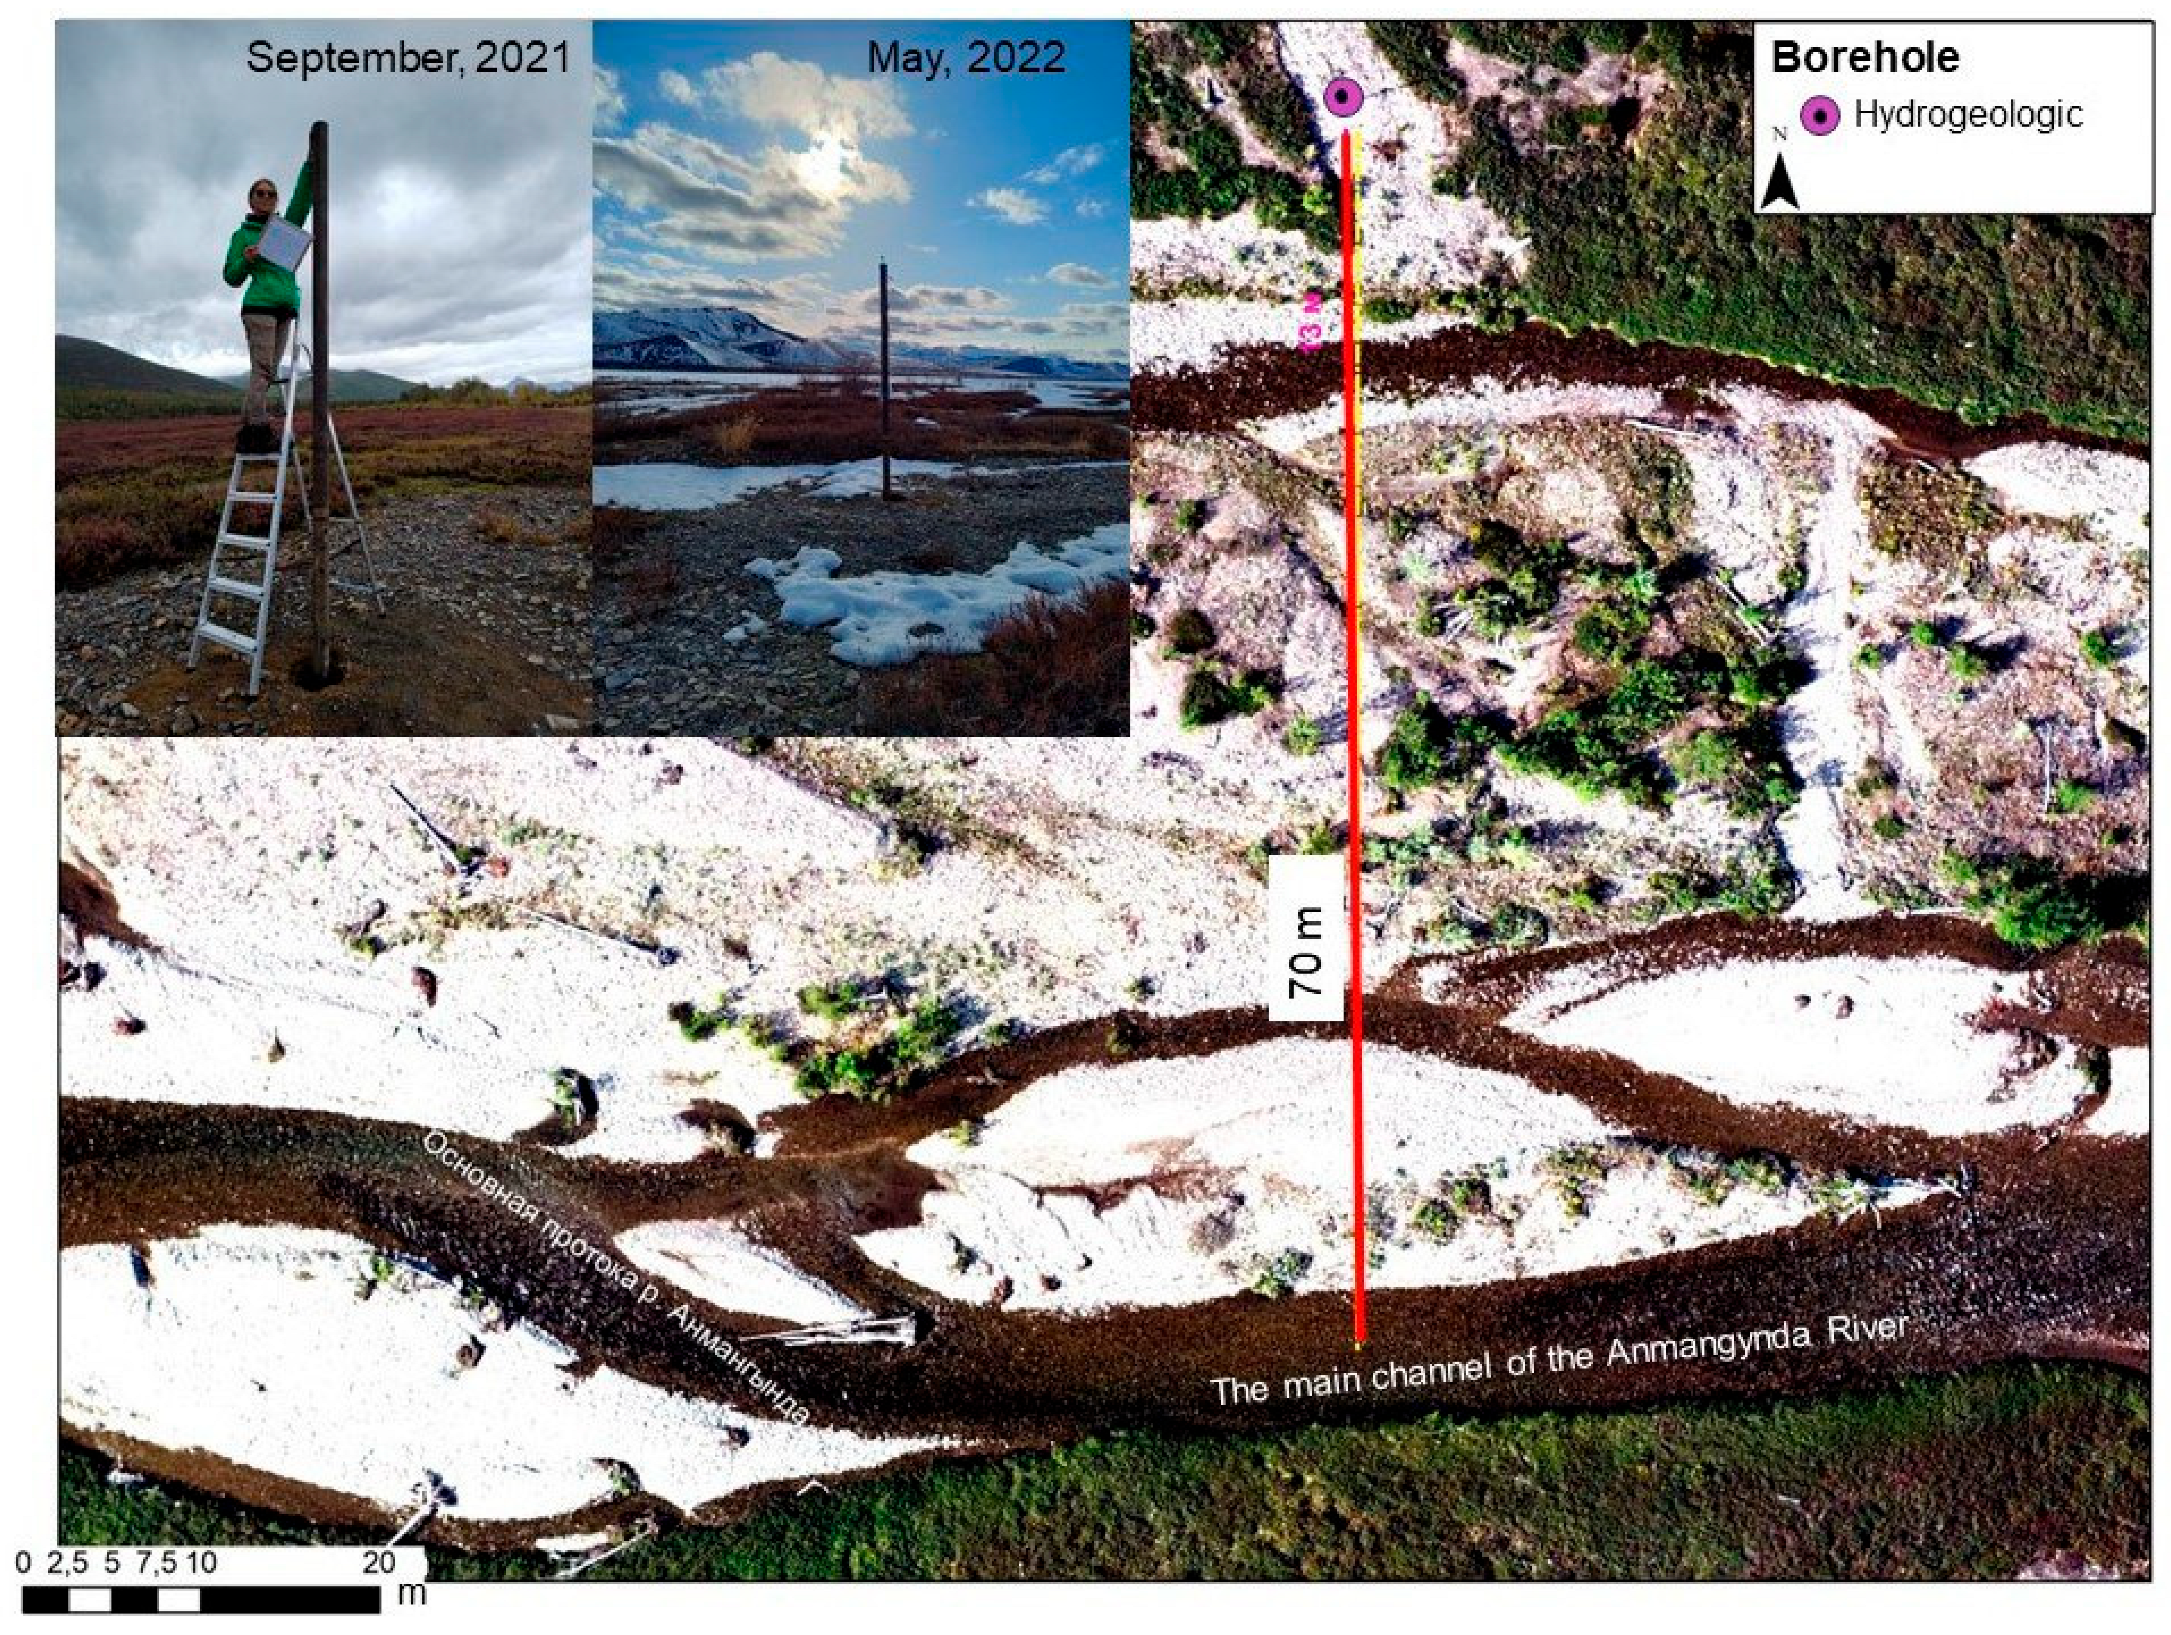
Three hydrogeological wells were drilled in the Anmangynda River basin to monitor groundwater levels. They were equipped with iron pipes with an outer diameter of 169 mm. Hobo sensors recording water level and temperature (the measurement accuracy is 12 mbar and 0.44 °C) were installed at the depths of 5.5, 5.15 and 6.65 m in the wells named “Upper Aufeis”, “Lower Aufeis”, and “Solontcovy”, respectively. Two of the boreholes are located within the aufeis field, while the third one is situated in the valley of the Solontcovy Creek next to the thermometric borehole (positioned above the area of aufeis formation).
3.2. Active Layer
In the Kolyma River basin and the Chukchi Peninsula, Circumpolar Active Layer Monitoring (CALM) [
27] sites have been operational since 1996 [
28,
29,
30]. However, these sites are located in the lowland tundra landscapes. In the mountainous upper reaches of the Kolyma River, such a monitoring point has been established for the first time. The setup of the CALM site followed the recommended guidelines [
31].
The site is located at the north-northeast oriented slope with a gradient of up to 5 degrees at the left bank of the Anmangynda River within a sparse larch forest on a moss-lichen litter with the undergrowth of dwarf birch and shrubs. The micro-relief is complicated by small hummocks. The description of the upper part of the profile down to a depth of 46 cm resulted from two test pits dug at a distance of 10 m from the site (
Table 2).
The plot has dimensions of 100 by 100 m; iron reinforcement was driven into the ground to a depth of up to 0.8 m to fix 121 benchmark points with a 10 m spacing. Measurements of the active layer thaw (ALT) depth were conducted twice a year in 2022 and 2023, using a probe with three repetitions at each benchmark. Additionally, daily snow depth was obtained from October to May 2023 using a camera trap and a snow stake, and in April 2023, snow depth measurements were conducted at each benchmark accompanied with snow water equivalent measurements next to a snow stake.
3.3. Meteorological Characteristics
Automatic portable meteorological stations KESTREL 5000 [
32] have been installed in the central part of the aufeis field since July 2020, and near the borehole “Solontcovy” since 2021. They operate year-round with hourly resolution and are equipped with air temperature, humidity, and atmospheric pressure sensors. Since October 2022, a Sokol m meteorological station [
33] with 30 min resolution has been operating in the central part of the aufeis field.
During warm period, automatic rain gauges Hobo Onset RG3 m [
34] equipped with air temperature sensors are used. They have been installed in the central part of the aufeis field (2020, 2021, 2022), in the upper part of the river watershed near the “Sopka” borehole (2022), and near the “GP2” borehole (2022). The air temperature is recorded with hourly resolution.
In the winter period, all thermometric boreholes are equipped with snow stakes, camera traps with daily snow height observations, and air temperature loggers.
Located 30 km away from the Anmangynda aufeis, the Ust-Omchug weather station (576 m) has been operating since 1967 [
35]. Meteorological parameters have been assessed for the period of 1967–2022.
3.4. Seasonal Frost Depth at Aufeis Glade
To assess the depth of frozen rocks at the aufeis glade, a ground penetrating radar (GPR) survey was conducted in April 2021 by an OKO-3 radar with a 250 MHz antenna. The survey consisted of 28 parallel profiles spaced at 200 m intervals. The total length of the profiles was 29.9 km. All GPR profiles were recorded with GPS tracking using Garmin or GNSS devices for topographic referencing. Data processing was carried out using the GeoScan32 software v. 2023.09.04.739.
4. Results and Interpretation
4.1. Meteorological Conditions of the Observation Period
As the distribution of temperatures in the ground is directly influenced by specific weather conditions of the past year, we provide information on weather conditions below.
2021–2022
From 1 October 2021 to 30 September 2022, the average annual air temperature, according to Ust-Omchug w/s, was −8.3 °C. The hydrological year in terms of temperature regime was 1.6 °C higher than the average for the period 1967–2022. The greatest temperature deviation occurred during the summer, with July 2022 being 4.3 °C warmer than usual.
Overall, the total precipitation for the year was 362 mm which is close to the mean annual value (341 mm), but the monthly values significantly varied from the norm. For instance, from October to December 2021, snow amounted to 106 mm, compared to the norm of 58 mm. In the same period of 2022, it was 68 mm. July 2022 was very dry with only 20 mm of precipitation, while the norm is 60 mm (
Table 3).
According to data from the Ust-Omchug w/s, the average snow depth in October 2021 was 14 cm, increasing to 25 cm in November, and reaching 30 cm in January, which is in line with the several centimeters variations above the climatic norm in the last 20 years. In April 2022, the average snow depth was 26 cm. We compared the data of the Ust-Omchug station and our own field observations in 2022. They showed that snow depth at the basin in January–March period is 1.5 times greater than according to the station data. The snow pillow installed at the Anmangynda aufeis area recorded the greatest snow depth of 58 cm in March 2022; the snow water equivalent (SWE) was 88 mm. At the end of April–beginning of May when the snow at the station completely melted, according to the data of the snow stake installed near the snow pillow, the snow depth was 50 cm (30 April 2022) and 29 cm (7 May 2022). The maximum SWE was 104 mm (3 May 2022).
2022–2023
In the period of 2022–2023, November and February were much colder than the norm by 2.6 and 3.3 °C, respectively. April and May were hotter than average in 2000−2022 by 2.9 and 0.8 °C, respectively. The amount of snow was below the norm (1967−2022) in October by 12 mm (46%). In November and December 2022, snow precipitation exceeded the norm by 9 and 12 mm (46 and 90%), respectively. At the same time, the winter season of 2021–2022 was snowier than winter 2022–2023, with total precipitation from November to April amounting to 107 and 99 mm, respectively. The largest difference between the two seasons were observed in January and April.
According to the Ust-Omchug w/s, a stable snow cover formed on October 5, the maximum snow depth was 32 cm (21 April 2023), and it completely collapsed on 1 May 2023. The transition of air temperature through 0 degrees towards positive values directly affects the change in the thickness of the snow cover. In the period from 1 December to 14 December 2022, a thaw was observed, due to which, from 30 November to 1 December, the snow height sharply decreased by 13 cm (from 24 to 11 cm). The average monthly thickness of the snow cover in winter 2022−2023 was 1–10 cm less than in the previous season, depending on the month.
The snow depth was observed daily at each borehole, CALM plot and meteorological station. It revealed a high variation in snow distribution between different parts of the basin (
Figure 3). In the upper reaches (Sopka, 1027 m), the precipitation amount exceeds values several times at the Ust-Omchug w/s, which is located at 576 m asl. The maximum snow depth was observed on 19 March and amounted to 91 cm. As of 31 March 2023, the snow density and the SWE reached 252 kg/m
3 and 257 mm. Snow density increased due to snow blow transport. Snow cover as of 23 May 2023 was still preserved (remote sensing data); the exact date of snow melt is unknown due to equipment failure. At the Solontsovy borehole, snow was preserved until 27 May. The snow depth was 4–21 cm less than in the upper reaches, but 10–36 cm more than in the valley of the Anmangynda River. In mid-February, the snow depth was 86 cm, after which it began to decrease. The density of snow in the upper 60 cm layer was 123 kg/m
3 (29, 23 March), while at Sopka it was 222 kg/m
3 (31, 23 March). The Solontsovy borehole is shaded by larch for most of the winter, which reduces the impact of solar radiation and wind. At the GP2 and Baza Camp locations, the maximum snow depth did not exceed 55 cm; at the Ust-Omchug w/s it was 32 cm. The snow cover at these locations completely collapsed with a difference of three days. At GP2, the snow density as of 29 March 2023 was 184 kg/m
3; the snow was loose and coarse-grained, and the SWE reached 90 mm. On the same day, the snow density and SWE were 178 kg/m
3 and 105 mm by the snow pillow data and 137 kg/m
3 and 67 mm by the Base Camp data (
Table 4).
4.2. Geocryological Characteristics
As of the present moment, the datasets of the ground temperature have been obtained for the period from 1 October 2021 to 30 May 2023. These data enable the assessment of geocryological characteristics, including the mean annual ground temperature (MAGT), the depth (ALT) and the rate of seasonal thawing/freezing, as well as the depth of zero annual amplitudes (DZAA) (
Table 5,
Figure 4).
The criterion for evaluating DZAA is the constancy of the mean monthly temperature with an error margin of (±0.3 °C). The depth of seasonal thawing ALT is determined based on the maximum thickness of the ground layer with positive temperatures; MALTT: the mean temperature of the active layer. The depth of seasonal freezing is estimated by the layer with negative temperatures at the end of the freezing period. MAGT corresponds to the temperature at the DZAA.
The Aufeis borehole is of particular interest due to its location in the area of the spring aufeis formation. The temperature regime of the aufeis glade is influenced by surface and underground flow, as well as the icing processes. The borehole penetrates a subsurface talik up to 8.5 m in depth. Discharging groundwater that contributes to aufeis formation has a temperature close to zero. Freezing starts in October, both from the ground surface and from the permafrost table, and it reaches a depth of 2.6 and 5.6 m, respectively, by November. A high permafrost temperature of −0.4 °C at a depth of 13 m is formed due to the warming influence of groundwater [
24]. According to the data, ground thawing began in June 2022 and in May 2023. In 2022, near the borehole, the ice thickness in March was about 70 cm, and completely collapsed on 31 May. In 2023, ice did not form in this location; on 31 March 2023, show depth and density was 42 cm and 267 kg/m
3, respectively (SWE 112 mm).
In the Solontcovy borehole (5 m deep), a talik zone is observed throughout the entire exposed depth. This could be attributed to the proximity of the Solontcovy Creek (150 m) and its confluence with the Anmangynda river within a radius of 1 km from the borehole. The minimum ground temperature at a depth of 5 m is reached in May (+0.8 °C). MAGT at the same depth is +1.5 °C. The freezing front forms from the ground surface in October, and the maximum ALT (2.6 m) of the seasonally frozen ground is reached in May.
The Sopka and GP2 boreholes show differences in their elevations (1027 m and 712 m, respectively) and terrain types, which explain the contrast in their geocryological characteristics. MAGT at Sopka and GP2 are −3.2 °C and −1.8 °C, respectively. However, at Sopka ALT is greater (1.3 m) compared to GP2 (0.9 m), despite the fact that thawing at GP2 starts a month earlier. The reason for such a difference is that at Sopka, which is presented by gravel, the moisture is low (about 4%), whereas the higher moisture (up to 35–45%) in the GP2 borehole, which is presented by pebbles with silty material, results in more heat being expended on the phase transition “water/ice”. The early onset of thawing at GP2 is related to the earlier transition of air temperature through 0 °C positive values due to lower elevation and because Sopka receives more snow due to higher elevation. In October 2022, snow depth at Sopka and GP2 was 26 and 13 cm, respectively. Maximum snow depth at Sopka and GP2 reached 91 cm (on 19 March 2023) and 55 cm (on 21 December 2022), respectively. As of 13 June 2023, the thaw depth was 70 cm at Sopka and 30 cm at GP2. The ALT difference is associated with climatic conditions (air temperature, precipitation) in the summer period, where the upper reaches receive up to twice as much precipitation. Additionally, the vegetation cover plays an important role. At Sopka it is sparse, whereas at GP2 there is moss with a height of 20 cm, which provides thermal insulation and a cooling effect. These factors collectively contribute to the variation in ALT between the two boreholes.
Analysis of active layer temperature data in GP2 and Sopka boreholes showed that the reaction of the ground temperature to changes in meteorological conditions is different. Thus, from October to April 2022/2023 at a depth of 0.2 m at the GP2 boreholele, the average monthly temperature on average decreased by 1 °C compared to the same season in 2021/2022. The changes at Sopka borehole were the opposite. In 2022/2023, at a depth of 0.2 m, the average monthly ground temperature was on average 0.7 °C higher than last year. In September 2023, the thawing depth increased by 0.3 and 0.1 m at GP2 (1.2 m) and Sopka (1.4 m), respectively, compared to the same period in 2022 (0.9 and 1.3 m). MAGT remained unchanged. The gradient of the ground average annual temperature in the upper layer at the Sopka and GP2 boreholes showed a different direction of heat exchange between the permafrost strata and the surface. In Sopka, the gradient is negative, which indicates a tendency of the ground to be warmed up from the surface, while the positive gradient in GP2, on the contrary, indicates heat loss from depth to the surface (
Table 5).
According to the measurements at the CALM site, in October 2022, the maximum active layer thickness (ALT) was 75 cm with an average value of 46 cm, while in August 2022, these values were 62 and 40 cm, respectively (
Table 6,
Figure 5). The average thawing rate was 0.7 cm per 10 days in this period. The snow depth on 2 October 2022 was less than 10 cm, it reached a maximum of 61 cm on 4 April 2023, and completely melted by 22 May 2023. On 1 April 2023, the snow depth at the CALM site varied from 45 to 94 cm. In 2023, measurements were conducted on 12 and 21 June, showing that ALT changed on average by 7 cm within 10 days, with a maximum change of 17 cm.
4.3. Aufies Glade Freezing Depth, 2021
In April 2021, a GPR survey was conducted at the aufeis glade [
25]. It was found that the average ice thickness at the beginning of April 2021 was 1.4 m, with the maximum thickness reaching 4.35 m. Areas with the greatest ice thickness are located near the discharge zones of groundwater. The uneven formation of the aufeis field and its complex mechanism of formation lead to the heterogeneous freezing of the ground. Within the aufeis field, an increased depth of seasonal freezing of up to 5–6 m was observed, resulting in the generation of excess water pressure in the near-surface subpermafrost taliks. There are also the areas with the merging type of permafrost. However, directly beneath the aufeis body, the thickness of the seasonal freezing layer in the alluvial deposits decreases to 1−2 m (
Figure 6). In the groundwater discharge zone beneath the ice, the depth of seasonal freezing sharply reduces to near-zero values. Overall, the data analysis indicates a dominant unimodal distribution of the depth of the seasonal freezing layer in the aufeis glade, with the mode being 4.5 m.
4.4. Groundwater
The data (groundwater level and temperature) of three groundwater wells were analyzed for the period of August 2021–October 2022. The results have shown the variety of groundwater regime conditions in the basin.
Groundwater depth in the “Upper Aufeis” borehole (5.15 m) (
Figure 7) during 2021/2022 averaged 2 m, varying from 0.7 to 3.5 m with the amplitude of fluctuations reaching 1.4 m. The water temperature during the winter period was 0.0 °C, reaching a maximum of +1.7 °C at the end of August, shortly after the flood, while the average annual temperature was +0.4 °C. Overall, the water level gradually declined until the beginning of March 2022, reaching a depth of 3.5 m, with a local maximum on 27 February at 2.82 m below the ground surface. Until 23 March, the water level steadily rose, reaching a depth of 1.74 m. Afterward, for two months, there were sharp fluctuations: active water discharge (on 29 March, 12 April, 10 May, and 21 May) followed by a gradual increase in water level. During the snowmelt period (from 21 May to 12 July), there was a smooth rise of the water level, occasionally interrupted by local fluctuations. The formation of aufeis near the well started in mid-December, while ice persisted next to the well until early July. After the influence of aufeis forming waters ceased in the vicinity of the well, the fluctuations of groundwater level became dependent on precipitation. For instance, due to flooding on 26 August 2022, the depth of groundwater increased to 0.9 m. After the flooding event, the water level in the well sharply decreased and continued to decline, with occasional increases caused by liquid precipitation (
Figure 8,
Table 7).
In the “Lower Aufeis” borehole (
Figure 9), where the ice was absent during the observation period, the amplitude of groundwater level fluctuations was only 0.4 m. On average, the water depth in this part of the aufeis glade was at 0.8 m, with minimum and maximum depths of 0.4 and 0.9 m, respectively. The close proximity of the water table to the surface is attributed to one of the Anmangynda River branches being located at a distance of 13 m from the well, and the main river at a distance of 70 m. The water temperature in the well gradually decreased from +3.9 °C in September 2021 to +0.3 °C on 8–29 June 2022, and then steadily increased again. As of 2 September, the temperature was +4.5 °C and remained stable until the 20th of September, after which it began to decrease again (
Figure 8,
Table 7).
The “Solontcovy” borehole (
Figure 1a) presents an example of natural water level fluctuations in the talik zone. According to the thermometric borehole, the upper boundary of the talik is located at a depth of 2.5 m, and its depth by calculations can reach more than 10 m. Since the beginning of the observations (September 2021), there was a decrease in the depth of the groundwater level throughout the winter period, which is associated with the winter freeze-up. With the onset of spring snowmelt and the spring flood, a sharp increase in the water level was observed, although its depth was more significant than in the area of the aufeis glade. On average, the depth of the groundwater level was 5.4 m, with a minimum depth of 2.9 m below ground during the spring flood period, and the annual amplitude of fluctuations was 1.8 m. Precipitation affects the water level changes in the summer period; for example, with a precipitation of 10 mm, the water level can rise by 3–5 cm. During the summer flood in August 2022, the water level rose by 80 cm but then rapidly dropped back to its previous value. The average annual temperature of the groundwater was +1.5 °C. The minimum value (+0.1 °C) was observed during the snowmelt period from 5 June to 9 June, and the maximum temperature of +3.3 °C occurred on the 3rd of September (
Figure 8,
Table 7).
5. Discussion
This study has elucidated several key geocryological conditions within a small mountain catchment area in the Upper Kolyma Highland, highlighting complex interaction between cryogenic processes and the environment. As shown by [
38] at the Wolf Creek basin, Canada and by [
39] at the Kuparuk River basin, Alaska, our findings also demonstrate a pronounced variability in geocryological characteristics, groundwater dynamics, and icing processes. The obtained patterns generally align with the limited existing historical literature on the region [
40,
41].
The uniqueness of the results is in the fact that we may continue the research which was conducted in the Anmangynda River basin in 1962–1990 [
21], while having the data series of similar research watersheds in the region, such as the Kolyma Water Balance Station (1948–1997) [
10] and the Suntar-Khayata basin [
42] available to us. As such, our results may contribute to the further refinement of the geocryological processes in the conditions of climate change, as this study has become the first to provide a complex scientific approach in the region since the 1990s.
As the dynamics of ground temperatures and the hydrogeological regime exhibit a close correlation with landscape and weather characteristics, based on our findings, it is possible to categorize the studied territory according to the direction of its transformation under the impact of climate change [
16,
43]. Consequently, it is imperative to conduct monitoring not only of ground temperatures but also comprehensive observations of geocryological processes, the intensity of hydrological phenomena, icing processes, and other specific components of the cryosphere [
17,
39,
44]. A comprehensive interpretation of the results is essential for predicting the development of natural processes and expanding our understanding of their mechanisms [
45,
46]. This is because one type of observation (for example, geothermal or hydrological monitoring) alone does not provide unequivocal conclusions regarding the direction and intensity of future cryosphere changes [
17,
47]. As such, different multidirectional reactions of ground temperature to local meteorological conditions were observed at two boreholes discussed in the results (Sopka and GP2); similar findings are presented for the East Siberian taiga region in [
48].
When compared to other mountain permafrost research catchments in the world, the Anmangynda catchment exhibits unique geocryological characteristics, attributable to the giant aufeis which is formed there [
18,
21]. The Kuparuk River Basin located at the North Slope of Alaska is also famous by its giant aufeis whose area may reach up to 8+ km
2, with an average value of about 5 km
2. This basin is similar to the Anmangynda River catchment by terms of subarctic climate and continuous permafrost; although it is located 8° further north, it exhibits a lower MAAT and shallower ALT. The Kuparuk River basin also experiences the climate change impact; from 1980 to 1990 there was an increase in air temperature by about 2 °C, after which this trend slowed down, and an increase in snow depth was also observed [
49]. These climate change conditions could contribute to permafrost temperatures rising by up to 1.5 °C at a depth of 20 m. Nevertheless, despite such climatic changes, the Kuparuk aufeis volume derived from SAR (1996–2005) [
50], although having varied significantly from 15 to 31 mln m
3, did not show any decreasing trends and the maximum area remained practically unchanged. The Kuparuk aufeis is perennial and in the period from 1997 to 2005 there was an increase in the area of its end-of-summer ice remains [
50]. In the opposite, the Anmangynda aufeis has been shown to decrease in its area and volume in the last two decades, migrating from perrenial to seasonal formation. Despite the apparent similarity of the basins, one may note a different reaction of geocryological conditions to the changing climate. Long-term complex observations in both catchments can become the basis for informed predictions of climate change.
By short-term data series, it is not possible to conclude on the response of permafrost to climate change, but the observable decreasing trend of the Anmangynda aufeis field, which is partly related to the increase in ground temperature [
18], evidences the transformation of the geocryological conditions. The research by [
51], which considers the development of the network of environmental observatories in Canada, highlights the opportunities that such a network can provide, including observe and understand processes, and development and test simulation models, providing data for remote sensing products validation. Furthermore, investigating the broader implications of climate change on the Kolyma River permafrost region similar to the evidence provided by [
52] for Western Siberia could provide additional insights into the consequences of permafrost thaw and its feedback mechanisms within the global climate system, for example [
53]. It can be completed in cooperation with other research groups in the region which have been for several decades working on similar studies [
54,
55,
56] or have just started to develop a regional monitoring network, such as the Eastern Siberia permafrost transect [
57].
Despite the novel insights provided by this study, it is not without its limitations. The spatial scope and the resolution of our observations were constrained by the challenging terrain and the remote location of the catchment area. Future studies could leverage advanced remote sensing technologies [
58,
59,
60,
61] and machine learning approaches in geocryology [
62,
63] to overcome these limitations, enabling a more detailed characterization of the geocryological conditions and their regionalization.
Monitoring efforts should also contribute to the development and simulations of the models of permafrost, hydrology and hydrogeology, such as presented by [
39,
42,
64,
65,
66,
67]. Additionally, comparative studies with other mountain catchments would enhance our understanding of geocryological processes at a broader scale [
68], contributing to the development of more resilient and sustainable land-use practices [
69,
70]. Permafrost research is inherently challenged by the availability and quality of data, particularly in remote or inaccessible areas. Limitations in the resolution, coverage, and accuracy of weather and climate data such as the distribution of temperature, precipitation, and snow cover in mountainous conditions [
10,
42,
44,
46] can introduce uncertainties into the study’s findings and model outputs. These data limitations can affect the robustness of the conclusions and the reliability of future projections. Addressing these limitations could include longitudinal and latitudinal studies across different permafrost regions [
71], improving data collection [
72] and modeling techniques [
73], and incorporating more comprehensive and varied climate change scenarios [
74].
6. Conclusions
This research presents unique data on the environmental conditions of a typical small mountain permafrost catchment at the Upper Kolyma Highland (Northeastern Asia) obtained in 2021–2023. The analysis of the data shows strong variation in natural characteristics within the limited area, which highlights the necessity for field data collection and monitoring in a vast permafrost region largely lacking such data.
MAGT, ALT and DZAA were obtained at four thermometric boreholes located in characteristic landscapes at elevations ranging from 712 to 1027 m asl. In 2021–2023, MAGT in different types of landscapes ranged from +1.5 to −3.2 °C, and ALT varied from 0.9 to 3.6 m. DZAA was observed at 11.5 and 13 m in two boreholes. In a borehole located in the talik zone, the depth of freezing was recorded up to 2.6 m. Additionally, the CALM plot was found, and the maximum ALT was observed in October 2022, reaching an average of 46 cm. There is an evident pattern in the changes in geocryological characteristics with elevation, which is significantly influenced by the factors such as snow accumulation, vegetation cover, and precipitation regime.
The study also provides valuable insights into groundwater dynamics in the region. The Anmangynda aufeis field, where the study was conducted, exhibits a complex permafrost regime influenced by groundwater flow and icing processes. Groundwater levels in the wells located at the aufeis glade show significant fluctuations, with depths ranging from 0.7 to 3.5 m in different seasons. These fluctuations are influenced by a combination of factors, including precipitation, snowmelt, and aufeis formation, highlighting the importance of studying aufeis fields for understanding the regulating capacity and regime of groundwater in the cryosphere.
The research also highlights climate variability in the region. Temperature data from Ust-Omchug w/s indicate fluctuations in both annual and seasonal temperatures. Notably, the summer of 2022 was significantly warmer than usual, emphasizing the sensitivity of the region to changing climate conditions. Precipitation patterns also exhibit variability, with some months receiving more or less precipitation than the long-term average. These climate variations can have direct implications for permafrost dynamics and hydrological processes in the region.
The findings of this research have implications for our understanding of permafrost, groundwater dynamics, and climate variability in the Kolyma Mountain Region. The presence of aufeis and its influence on groundwater levels highlights the need for further studies to assess the ecological significance of aufeis and its role in regulating local hydrology. Future research could focus on the long-term trends in permafrost dynamics and how they relate to climate change. Additionally, the impact of aufeis formation on local ecosystems, including vegetation and wildlife, warrants further investigation. Understanding the complex interactions between climate, permafrost, and hydrology in this region is crucial for addressing broader questions related to climate change, ecosystem resilience, and the sustainable management of natural resources in Northeastern Siberia. In summary, a multi-faceted approach, incorporating various environmental parameters and processes, is crucial for gaining a comprehensive understanding of the complex interactions occurring in the cryosphere and their response to changing climate conditions.


 ,
, 


