Article

Potential Health Risks from Uranium in Home Well Water: An Investigation by the Apsaalooke (Crow) Tribal Research Group

by
Margaret J. Eggers
1,*,
Anita L. Moore-Nall
2,5,
John T. Doyle
3,5,
Myra J. Lefthand
4,5,
Sara L. Young
5,6,
Ada L. Bends
3,5,
Crow Environmental Health Steering Committee
3 and
Anne K. Camper
1,7
1
Center for Biofilm Engineering, Montana State University, P.O. Box 173980, Bozeman, MT 59717, USA
2
Department of Earth Sciences, Montana State University, P.O. Box 173480, Bozeman, MT 59717, USA
3
Little Big Horn College, P.O. Box 370, Crow Agency, MT 59022, USA
4
Crow/Northern Cheyenne Hospital, P.O. Box 592, Crow Agency, MT 59022, USA
5
Crow Tribal Member(s)
6
Montana Infrastructure Network for Biomedical Research Excellence (INBRE) Program, Montana State University Bozeman, 1246 Harvard Avenue, Billings, MT 59102, USA
7
Department of Civil Engineering, Montana State University, P.O. Box 173980, Bozeman, MT 59717, USA
*
Author to whom correspondence should be addressed.
Geosciences 2015, 5(1), 67-94; https://doi.org/10.3390/geosciences5010067
Submission received: 28 December 2014 / Revised: 9 March 2015 / Accepted: 10 March 2015 / Published: 20 March 2015
(This article belongs to the Special Issue Medical Geology: Impacts of the Natural Environment on Public Health)

Abstract

:
Exposure to uranium can damage kidneys, increase long term risks of various cancers, and cause developmental and reproductive effects. Historically, home well water in Montana has not been tested for uranium. Data for the Crow Reservation from the United States Geological Survey (USGS) National Uranium Resource Evaluation (NURE) database showed that water from 34 of 189 wells tested had uranium over the Environmental Protection Agency (EPA) Maximum Contaminant Level (MCL) of 30 μg/L for drinking water. Therefore the Crow Water Quality Project included uranium in its tests of home well water. Volunteers had their well water tested and completed a survey about their well water use. More than 2/3 of the 97 wells sampled had detectable uranium; 6.3% exceeded the MCL of 30 μg/L. Wells downgradient from the uranium-bearing formations in the mountains were at highest risk. About half of all Crow families rely on home wells; 80% of these families consume their well water. An explanation of test results; associated health risks and water treatment options were provided to participating homeowners. The project is a community-based participatory research initiative of Little Big Horn College; the Crow Tribe; the Apsaalooke Water and Wastewater Authority; the local Indian Health Service Hospital and other local stakeholders; with support from academic partners at Montana State University (MSU) Bozeman.

Graphical Abstract

1. Introduction

Uranium contamination of groundwater is being increasingly recognized as a health threat to rural residents relying on home wells for their drinking water, not only in communities with a legacy of mining [1], but also where naturally occurring uranium is the source of contamination [2,3,4,5]. However, most of the key studies of health effects from drinking uranium contaminated water have been conducted in other countries [4,6,7,8]. In the United States, naturally occurring elevated uranium in groundwater has been identified as a widespread issue in Western states, as well as in scattered locations in Eastern states [2,9]. Native Americans in the Colorado Plateau area have been particularly impacted [10]. A recent comprehensive survey of well water contaminants conducted by the U.S. Geological Survey found that 1.7% of home wells tested nationwide exceeded the Environmental Protection Agency (EPA) Maximum Contaminant Level (MCL) for uranium contamination [11] and highlighted the need for data on well water consumption by rural residents. In this study, the Crow Tribal community in Montana recognized the potential for uranium contamination of their home wells, tested wells for inorganic and microbial contamination, simultaneously conducted surveys of well water use and treatment, assessed the risk of exposure to waterborne contaminants and conducted outreach to educate rural residents of the health risks of consuming contaminated well water.

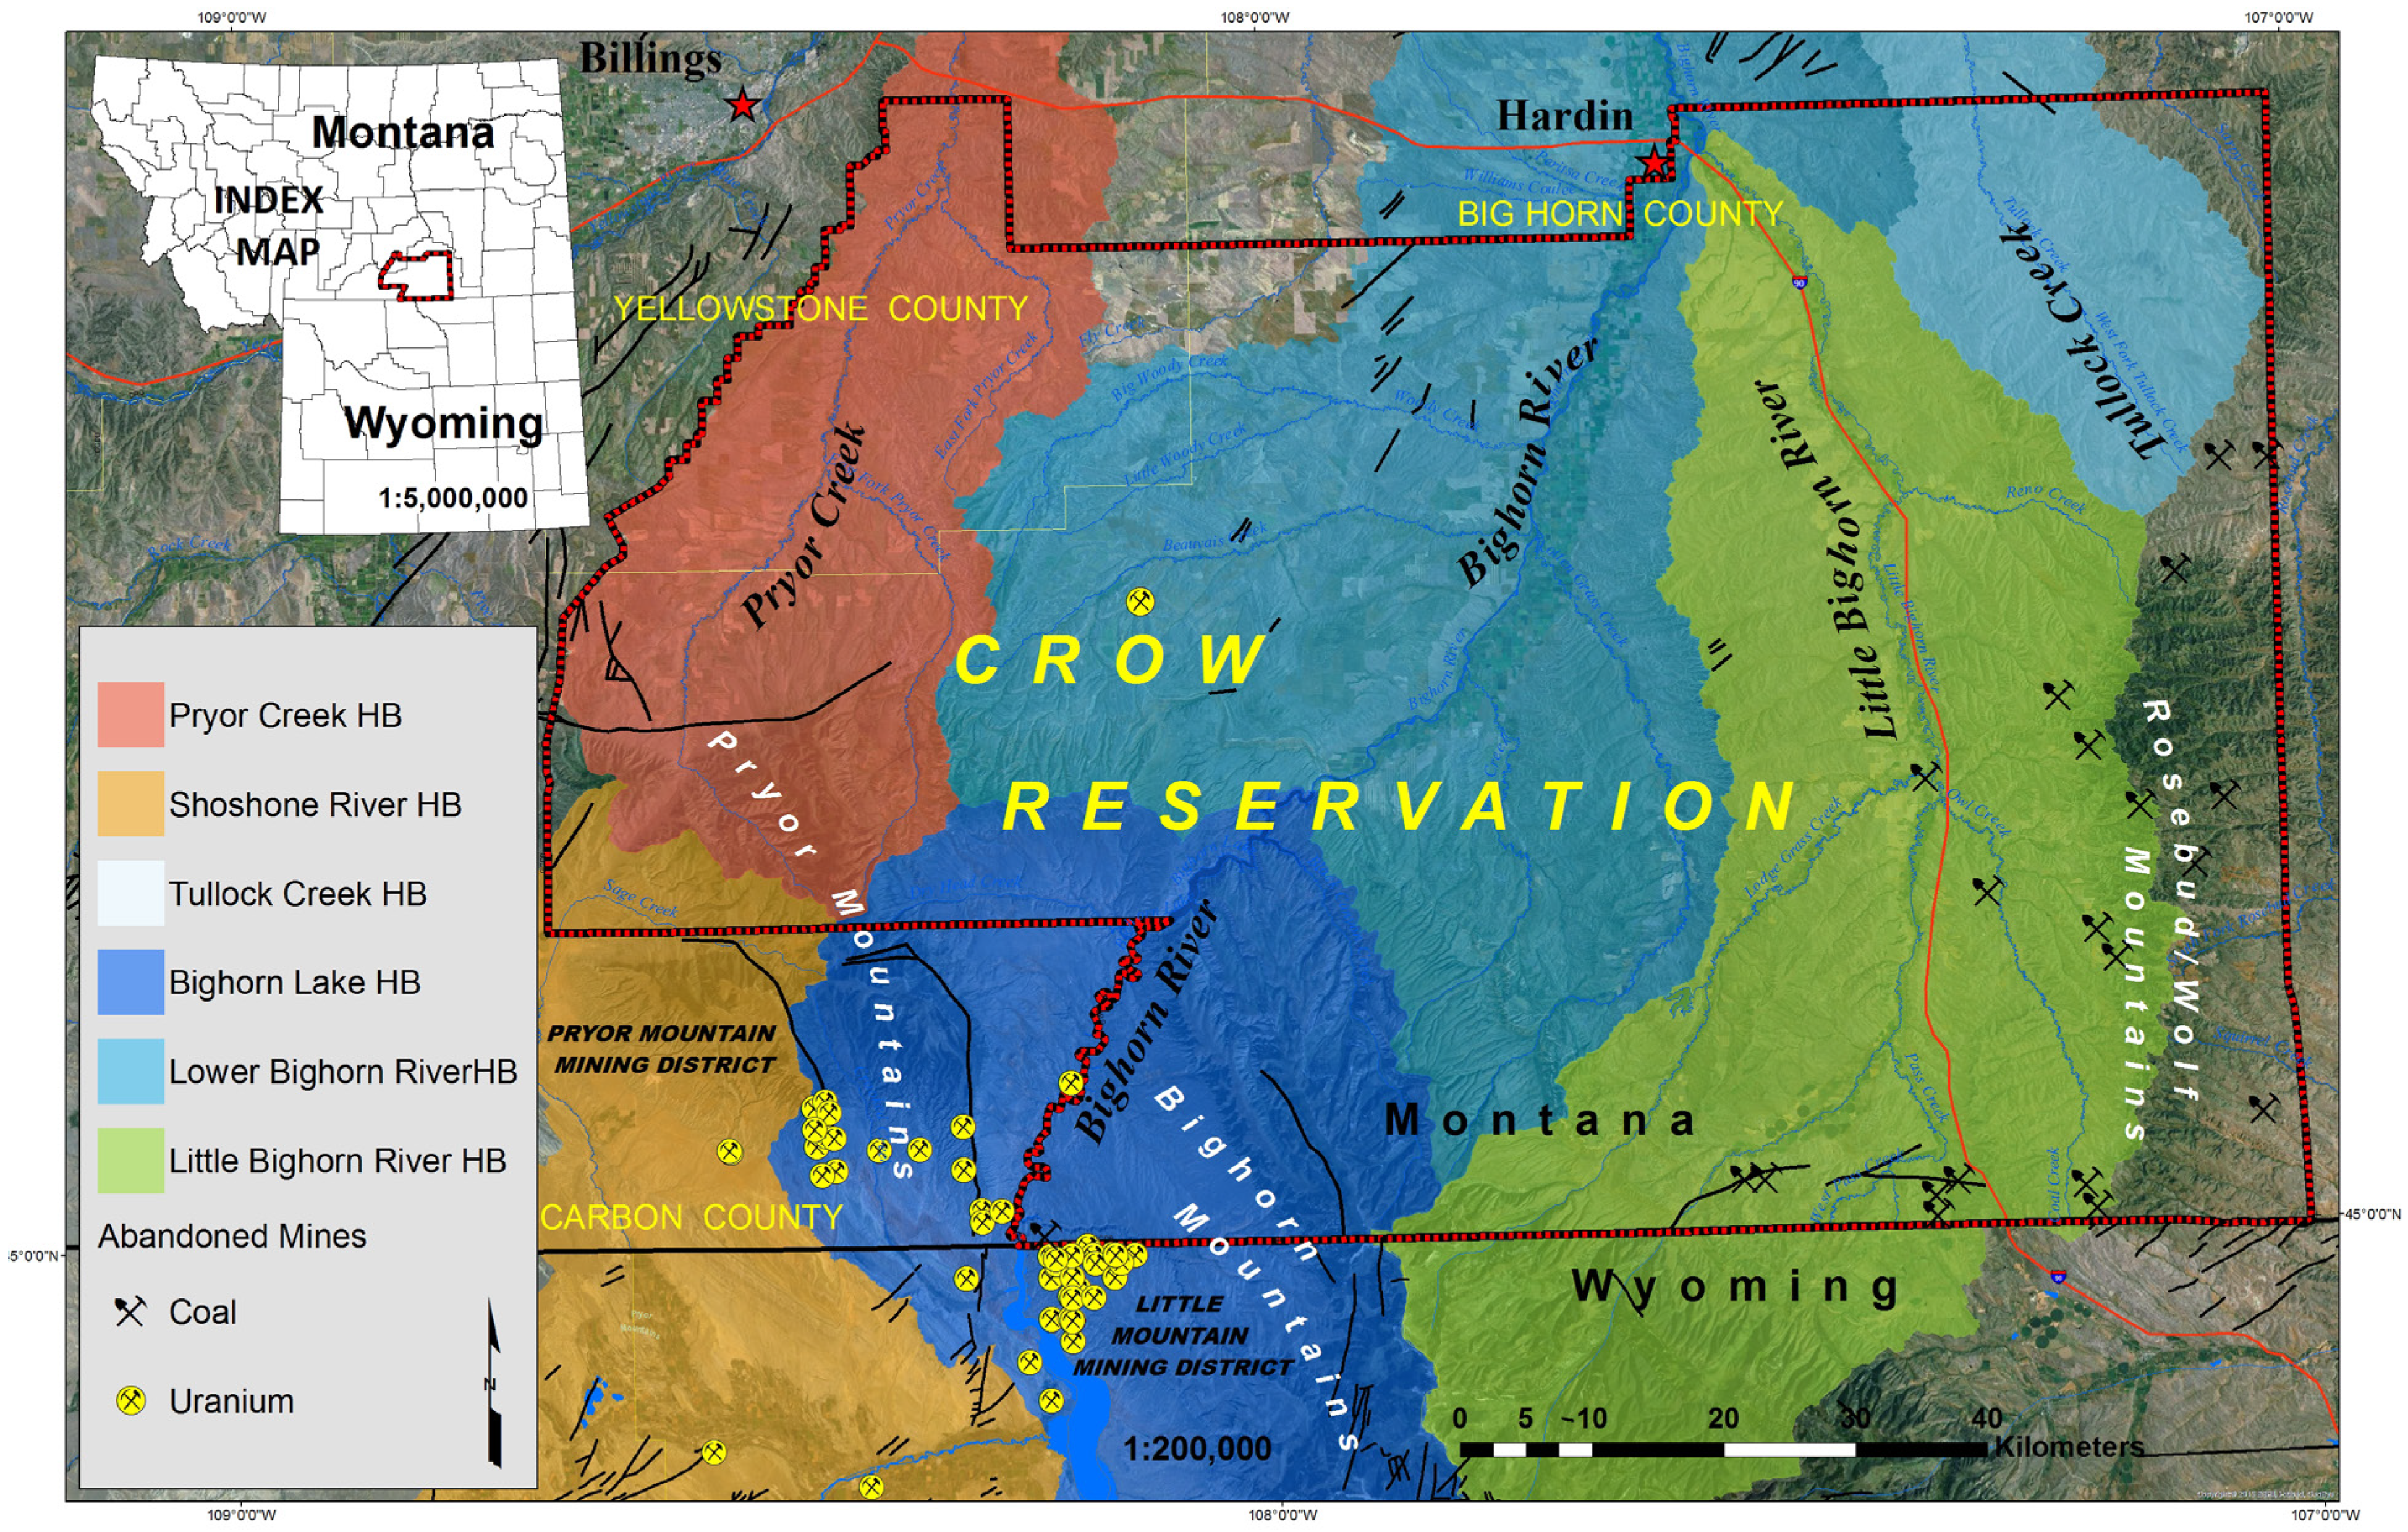
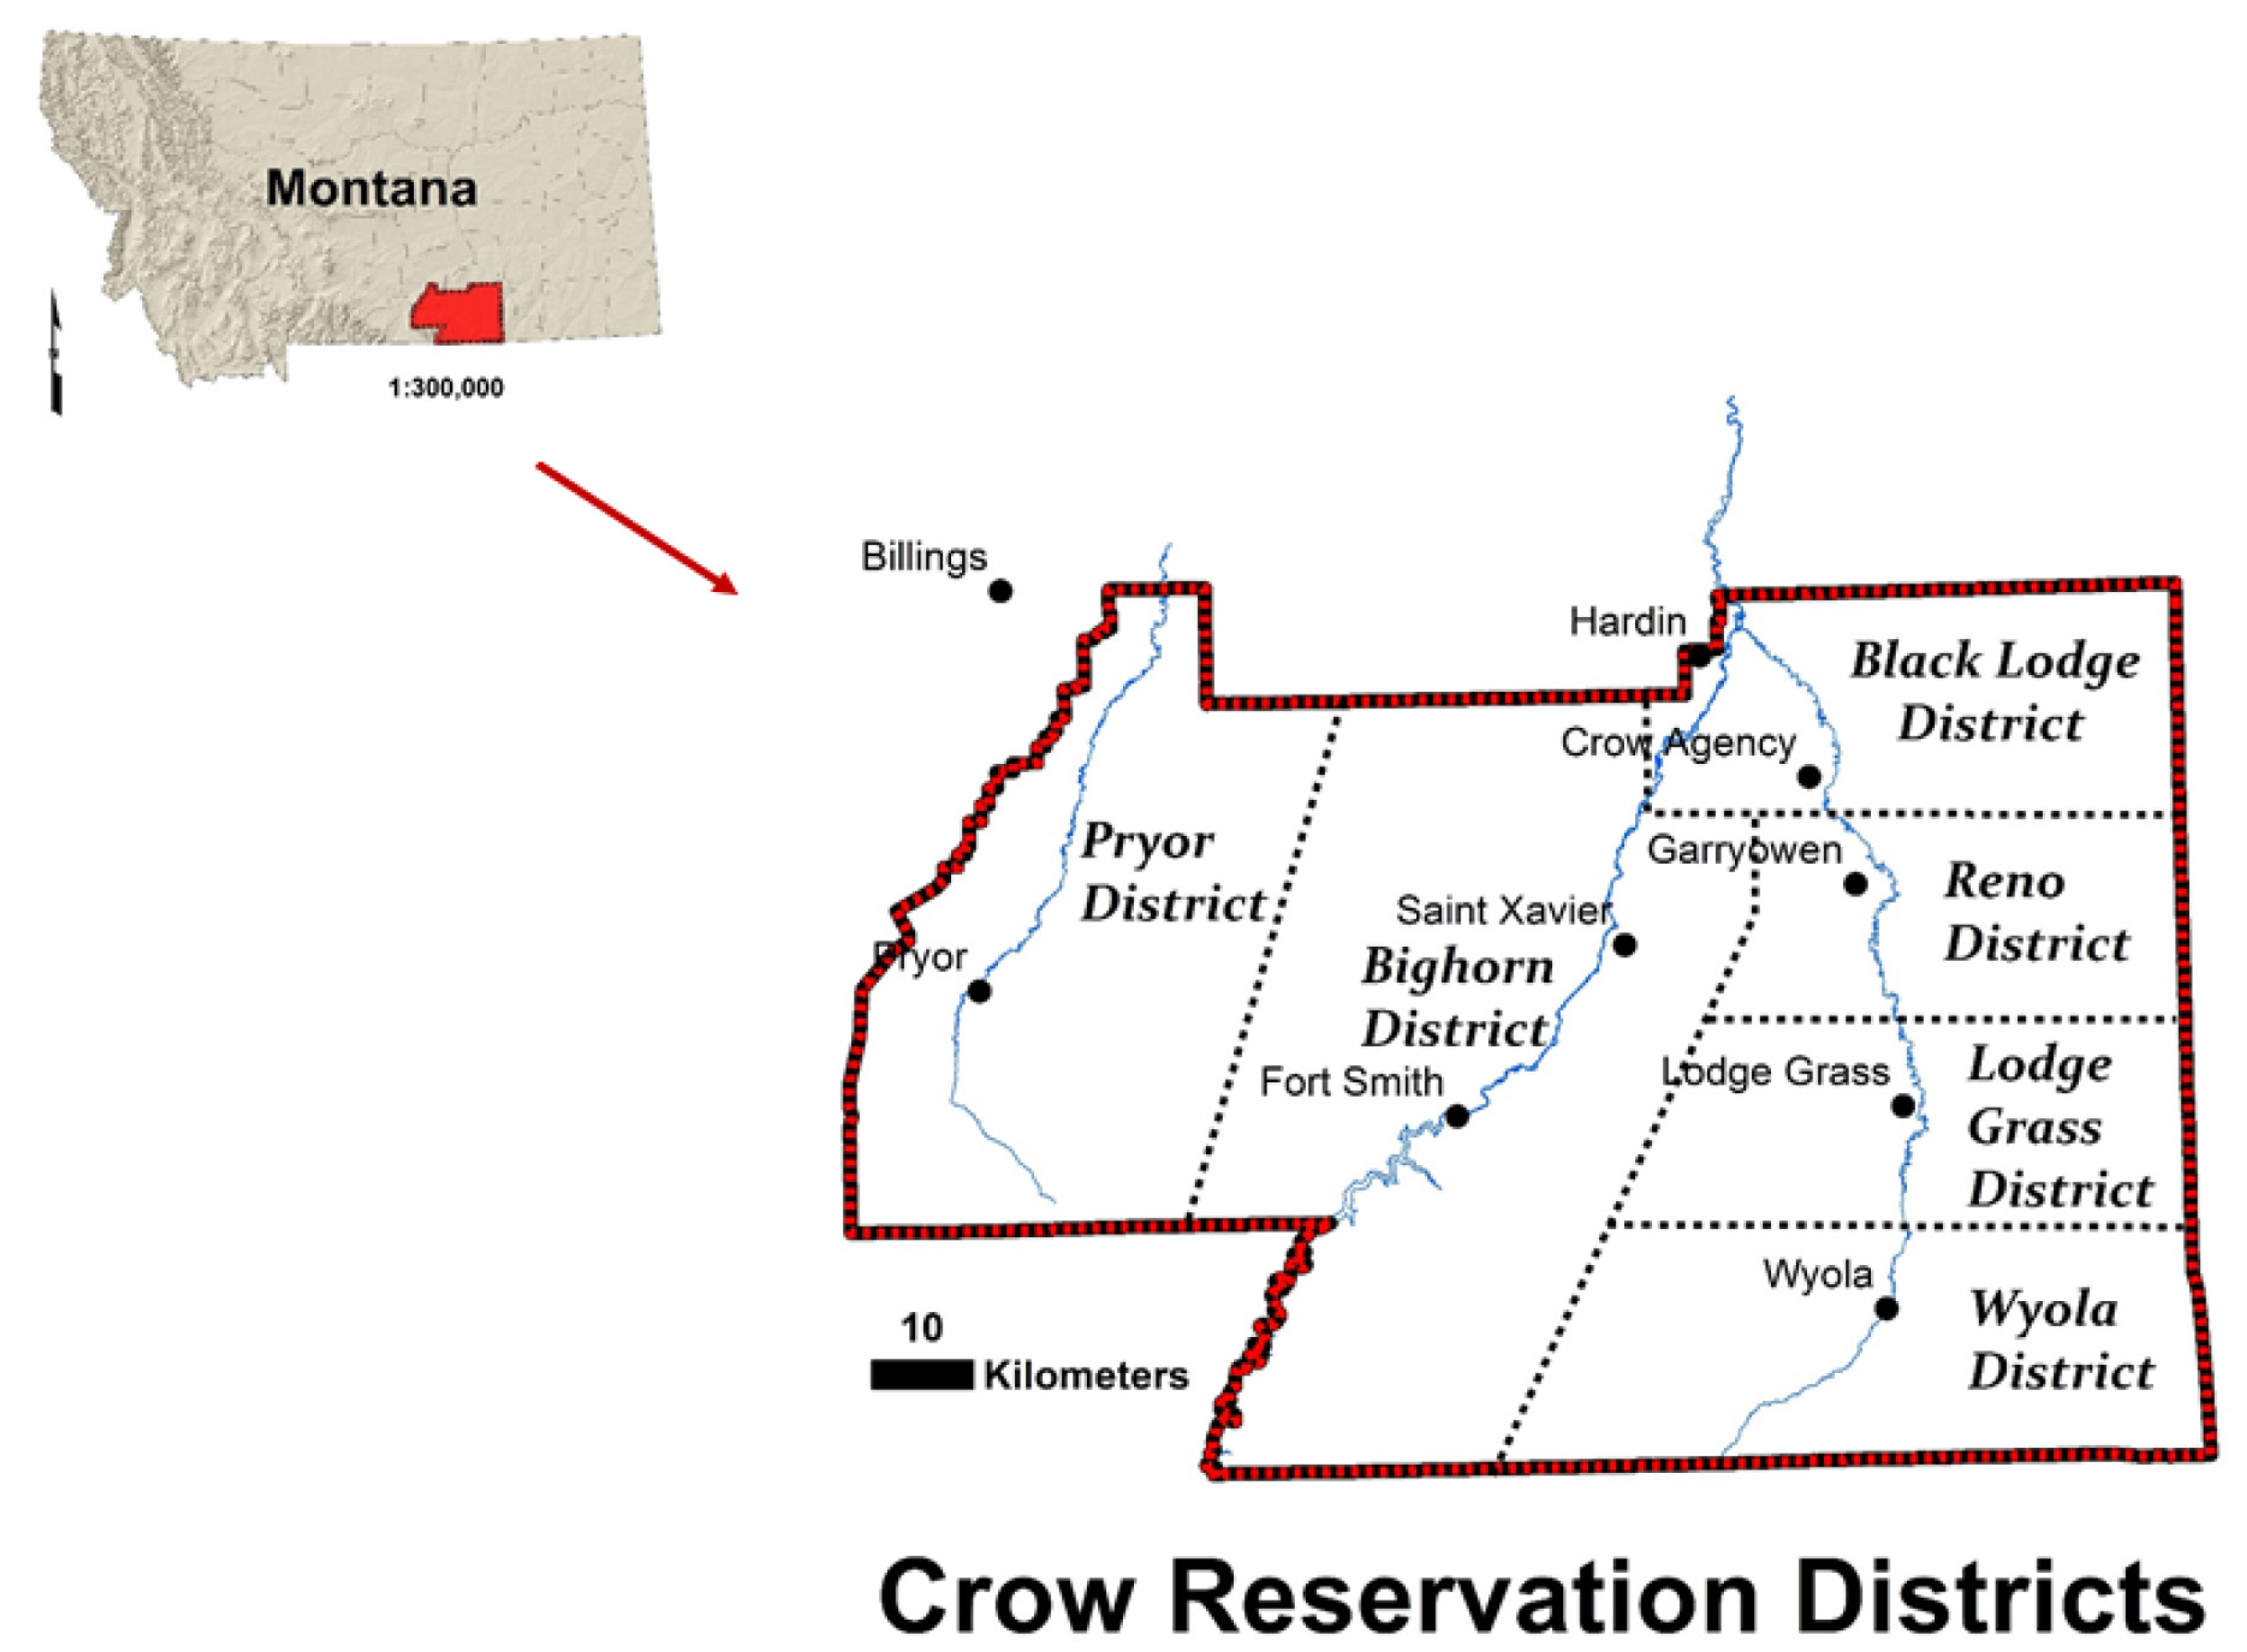
1.1. The Crow Reservation
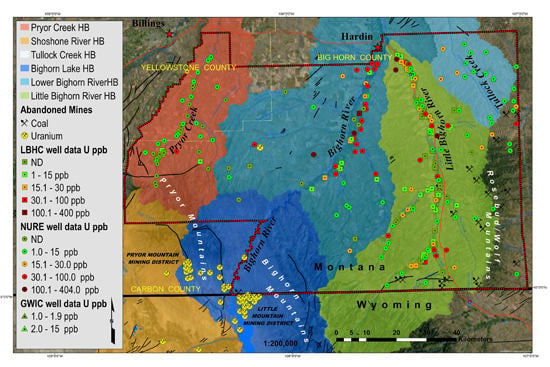
The Crow Reservation in south-central Montana is home to the Apsaálooke (Crow) people, and encompasses 2.3 million acres in the center of the Tribe’s original homelands. Of the Tribe’s approximate enrollment of 11,000 people, 7900 live on the Reservation [12]. The Reservation is rich in water resources, including the Little Bighorn River, Bighorn River, Pryor Creek and their tributaries, fed by the Wolf, Big Horn and Pryor Mountain ranges. The Apsaálooke people still maintain their language, ceremonial practices, and relationships to the rivers, springs and other natural resources. Water as a “giver of life,” an “essence of life,” has always been held in high respect by the Apsaálooke people and considered a source for health; water continues to be a sacred resource essential to many prayers, ceremonies and other traditional practices [13,14,15]. Water contamination—even well water contamination—has additional, unique impacts in Native American communities due to traditional values and practices [15]. Therefore, this project is a relevant case study for understanding health risks from water contamination in rural Native American communities.
Like many other tribes and minority communities, the Apsaálooke people also face health disparities and economic hardships which increase vulnerability to environmental contamination. Statistics for Big Horn County give some idea of the health status of the Reservation, as 64% of the county’s land base is within the Reservation’s boundaries and 66% of the county’s population is Native American [16]. In a comprehensive and thoroughly cited analysis of county health and socioeconomic status, the local Community Health Center describes the confluence of: (1) disparities in physical health; (2) disparities in mental health; (3) an ongoing cycle of poverty [17]; and (4) inadequate health care, as combining to contribute to health disparities [18]. These include an elevated infant mortality rate [19] cited in [18], a much higher age-adjusted death rate ([20,21], cited in [18]), and a twenty year lower life expectancy for Native Americans compared to Caucasian residents of the county [19] cited in [18].
One health statistic relevant to uranium contamination of well water is the high diabetes prevalence rate of 12.1% in Big Horn County, compared to 6.2% statewide. In a survey of 400 Crow Tribal members, diabetes was named as top local health disparity [22]. The impacts of this chronic disease on health are also elevated: the hospitalization rate for diabetes is 246.3 per 100,000, compared to 115.4 per 100,000 in Montana and 180.2 per 100,000 nationwide [23] cited in [18]. The death rate from diabetes is nearly twice the statewide rate (50.1 per 100,000 compared to 27.1 per 100,000 in Montana) and 143% of the national rate [24] cited in [18].
For rural Reservation residents, the challenge of obtaining safe, palatable drinking water is relatively new. Traditionally, people lived near rivers and springs, used this water for domestic purposes, knew they needed water to survive and kept these sources clean. Crow Elders reflect that there used to be a level of trust that the rivers and springs were clean. Until the 1960s, many families on the Crow Reservation hauled river water for home use, a practice most of the Tribal co-authors remember from their childhoods. At that time, agriculture was expanding and river water quality visibly deteriorating; wells and indoor plumbing finally became available and rural families switched to piped home well water. In many parts of the Reservation, this was a hardship, not a blessing: the groundwater tapped for home wells was high in total dissolved solids, including so much sulfate, iron and manganese that it was undrinkable [25]. Widespread high alkalinity and excessive hardness resulted in scaling that ruined pipes and hot water heaters. There was no community education on how to protect one’s well water or maintain and repair wells, plumbing and septic systems.
Today, about half of all local families rely on home well water [11]. In many parts of the Reservation, well water quality is poor, but is still used for drinking and/or cooking. Community members, increasingly concerned about potential health effects from their poor quality drinking water, partnered with Little Big Horn College and Montana State University Bozeman to tackle both well and river water contamination issues. Forming the Crow Environmental Health Steering Committee (CEHSC) in 2006, the partners initiated the Crow Water Quality Project and have been working together ever since to improve the health of Crow community members by assessing, communicating and mitigating the risks from local waterborne contaminants [13]. The CEHSC and their academic partners secured funding to assess waterborne contaminants through a free “full domestic analysis” of home well water to local residents who volunteered to participate. On learning from co-author geologist Moore-Nall that the United States Geological Survey (USGS) National Uranium Resource Evaluation (NURE) database showed 34 out of 189 wells tested had uranium concentrations exceeding the EPA MCL [26], and knowing about the old uranium mines in the Pryor and Bighorn Mountains adjacent to the reservation, the CEHSC added uranium to its home well water testing parameters.

1.2. Study Area

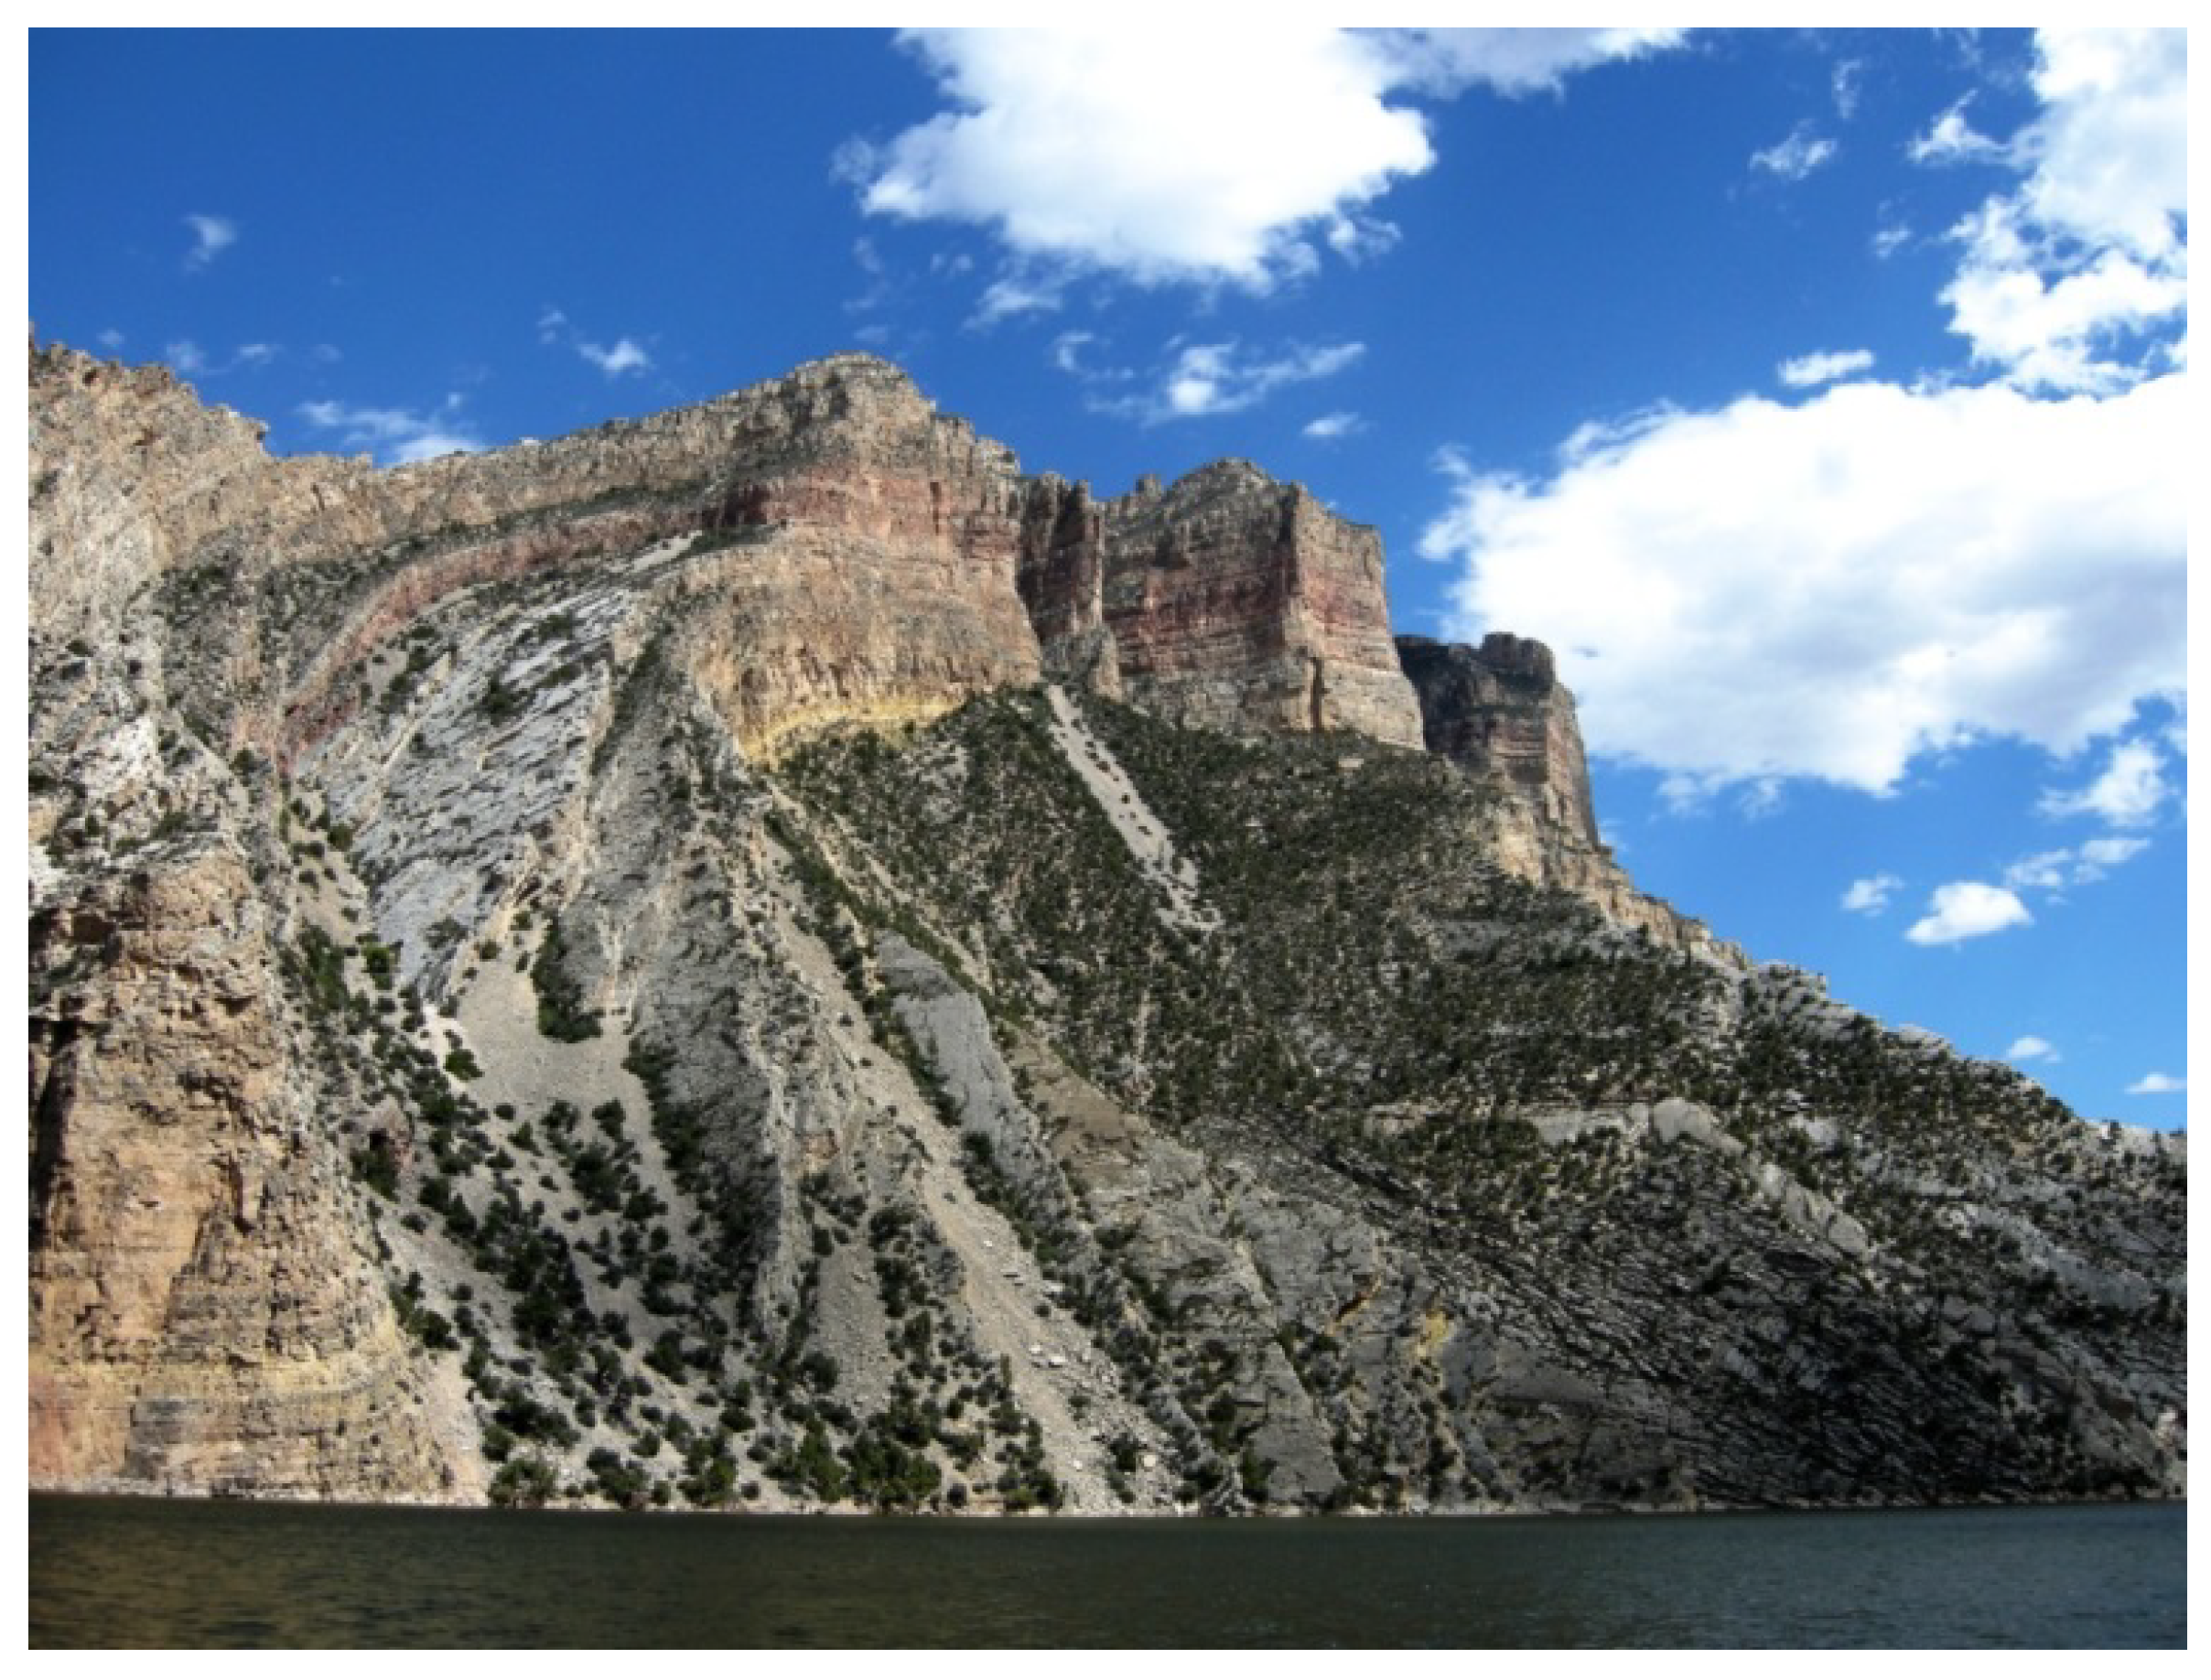
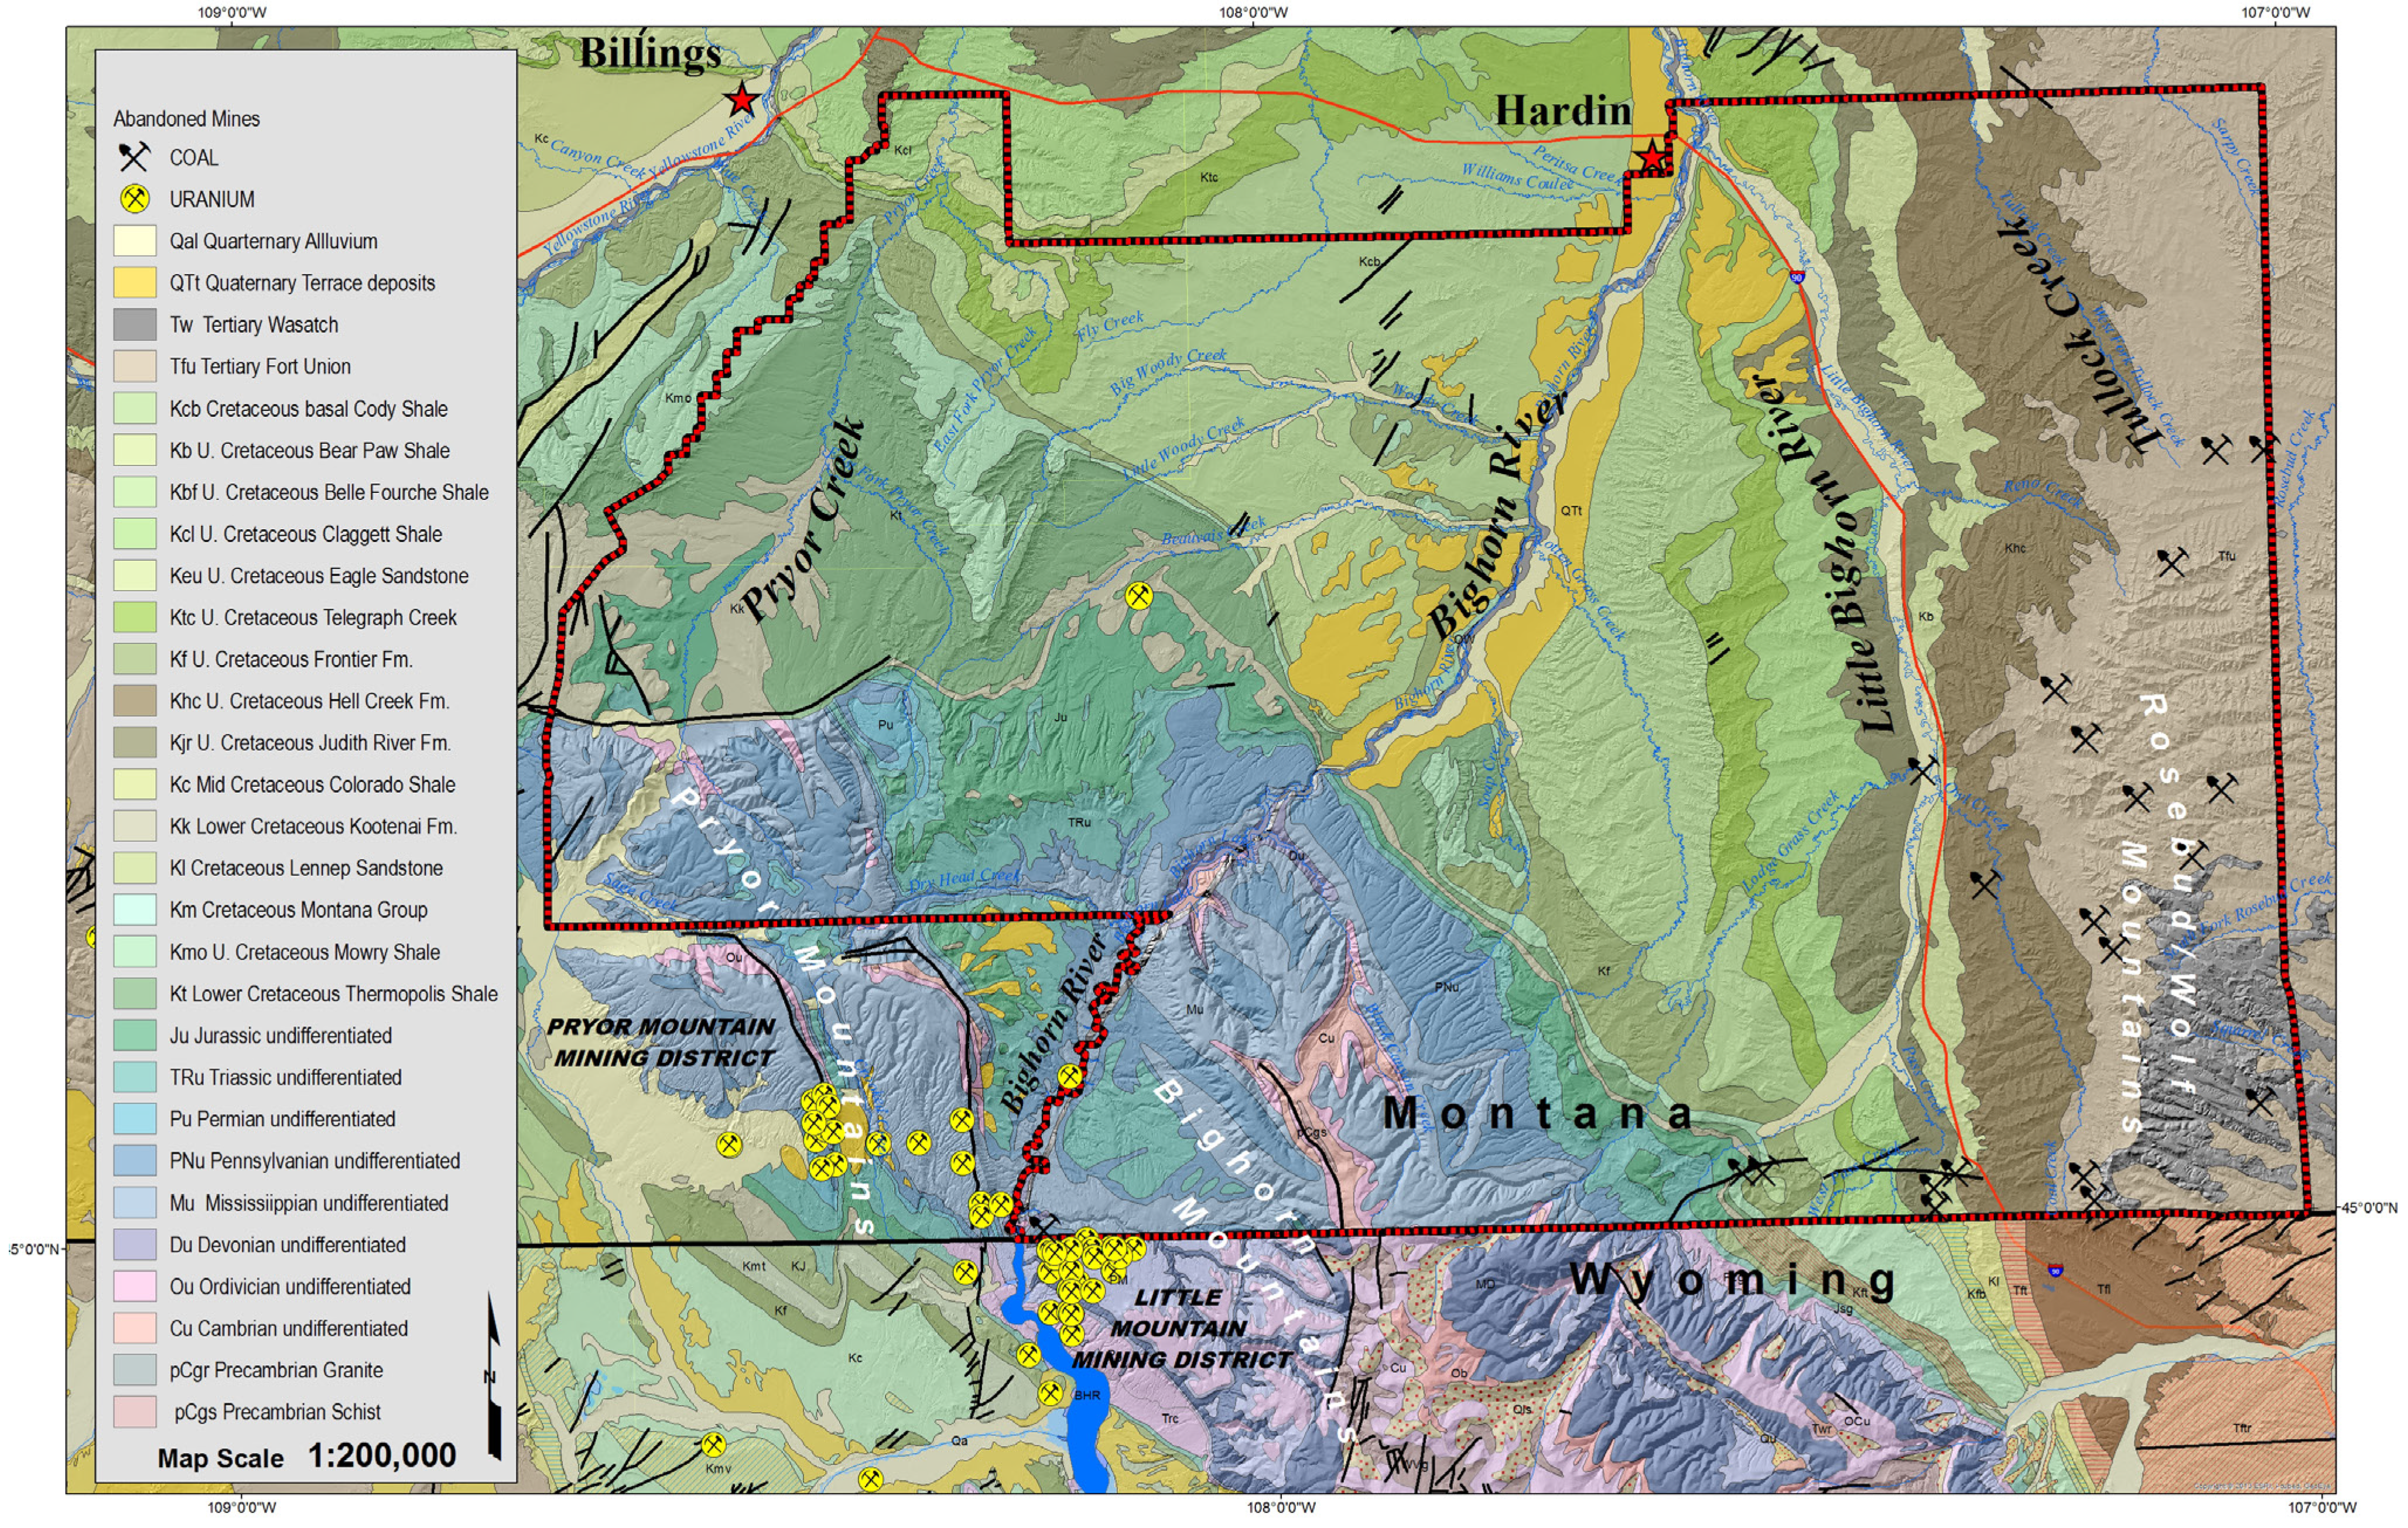
1.2.1. Physiography and Geology
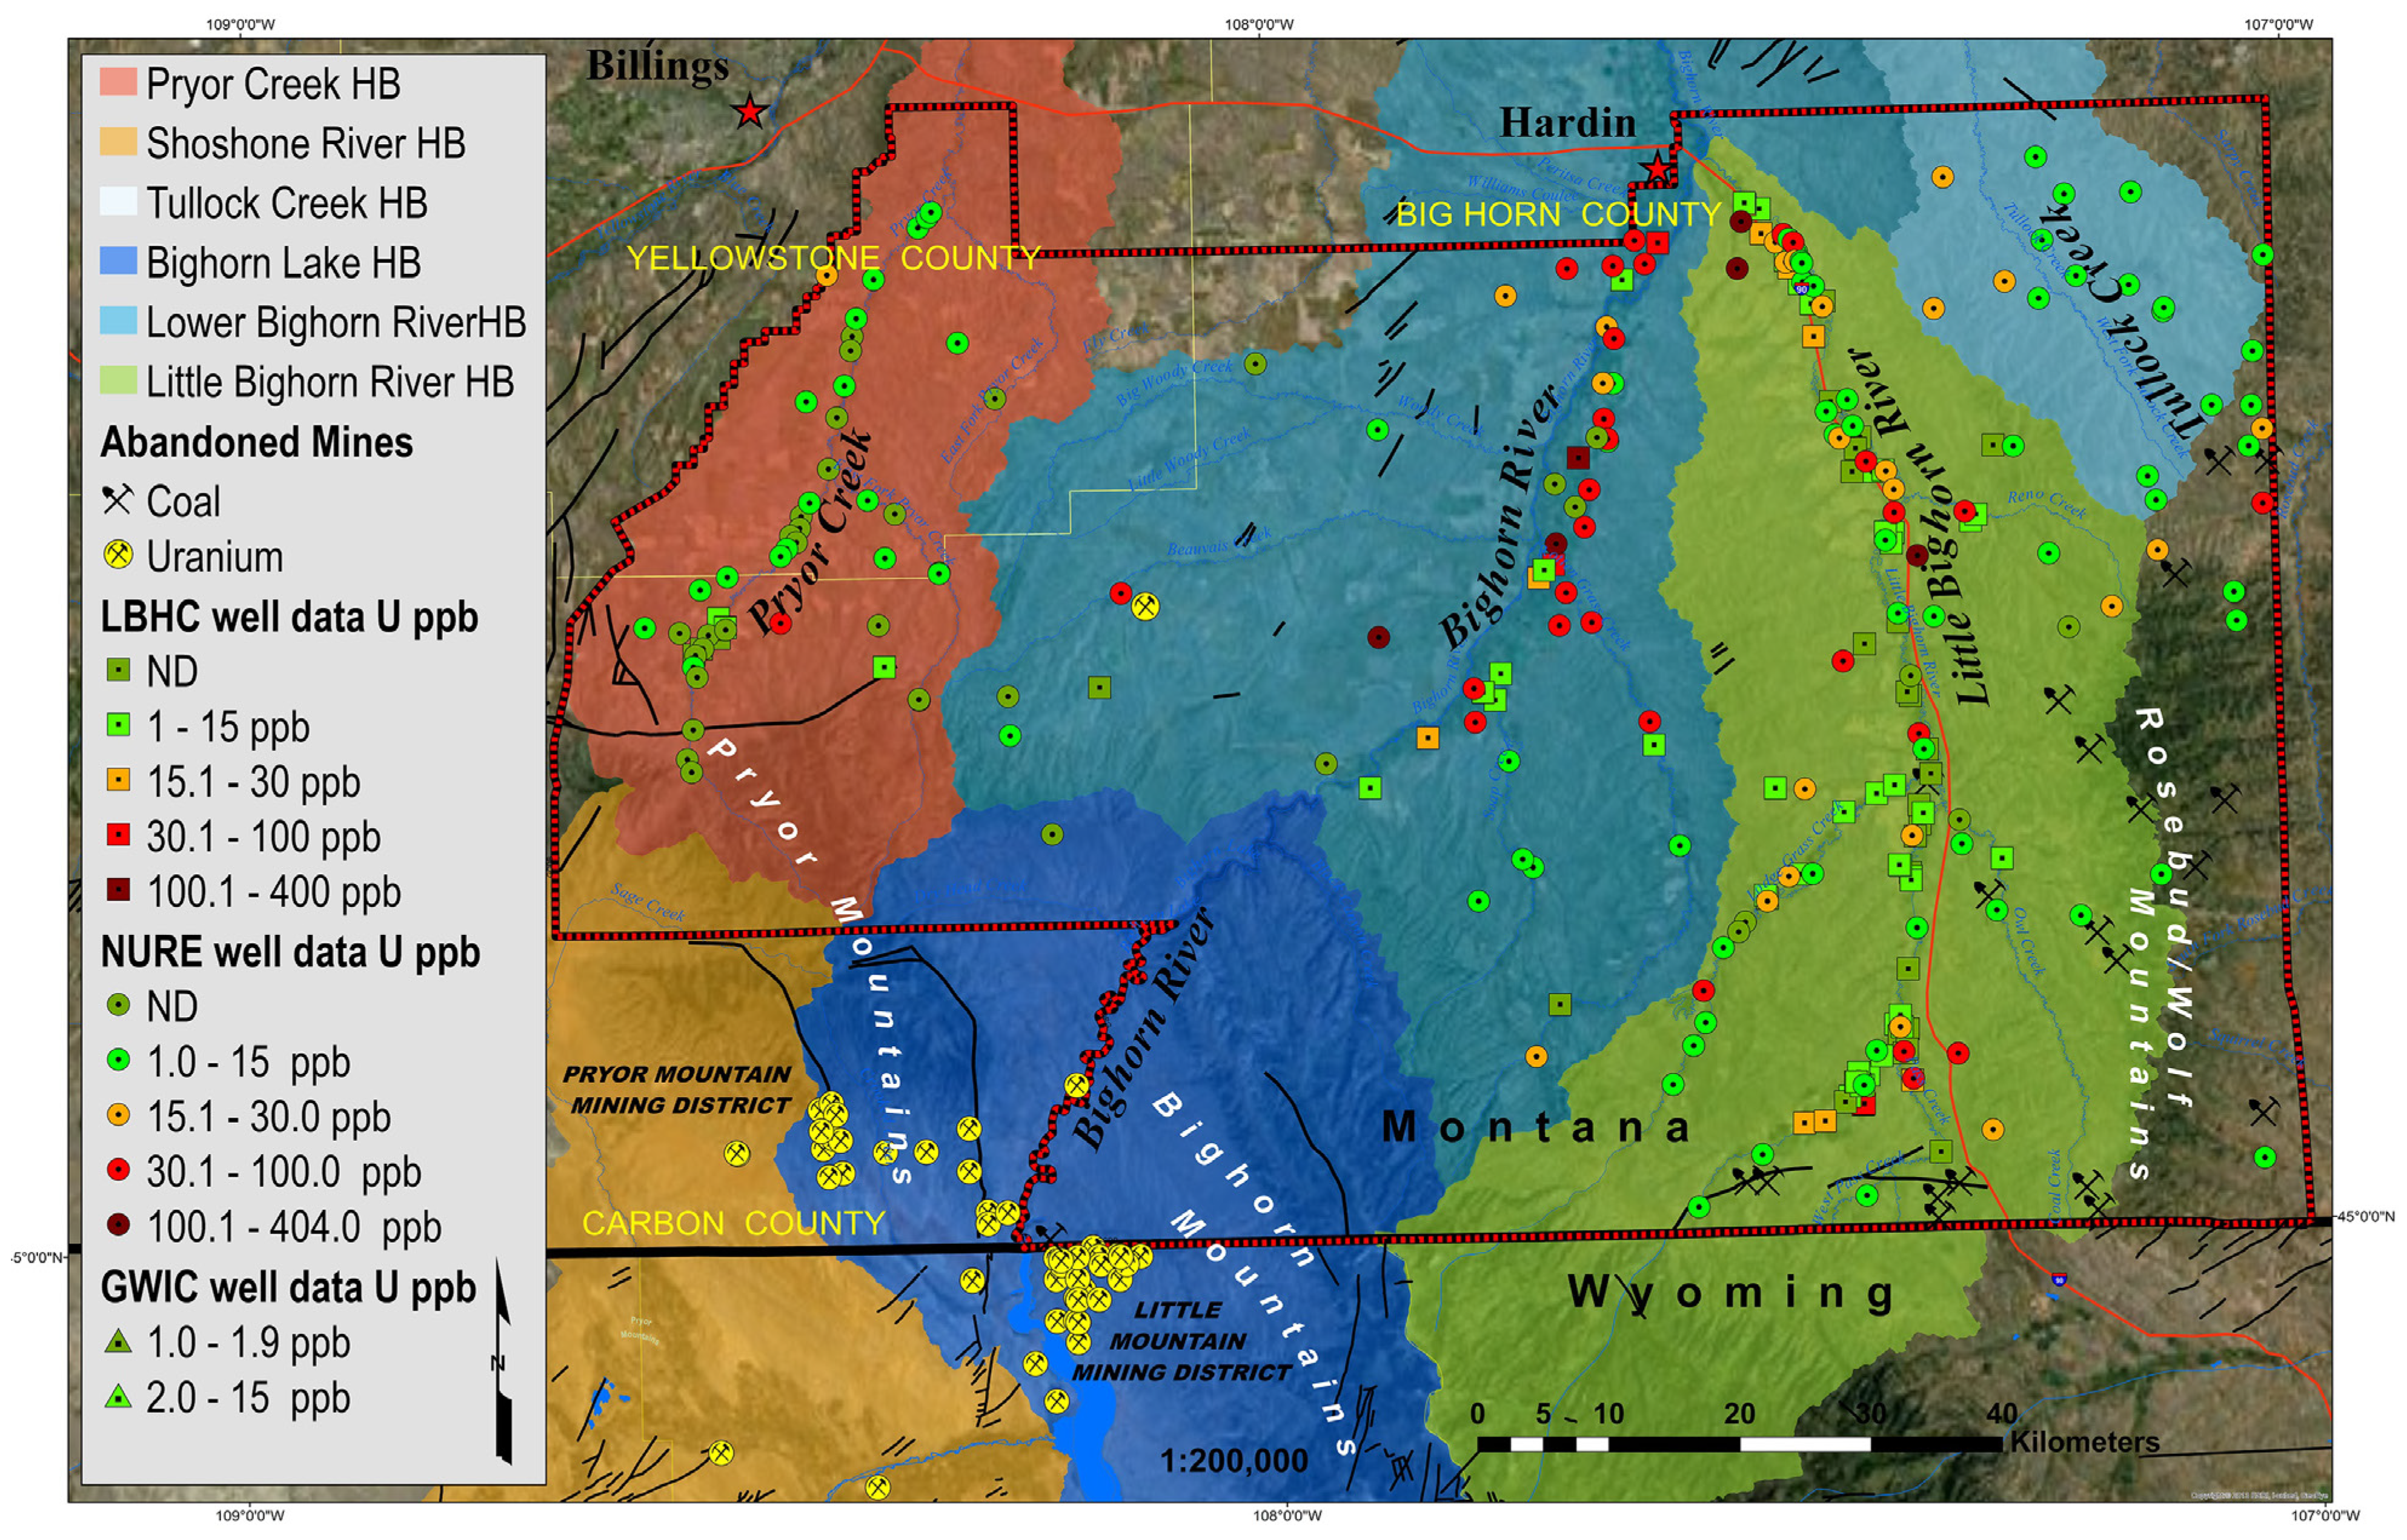
The Crow Indian Reservation (Figure 1) lies within the unglaciated portion of the Missouri Plateau, a subdivision of the Great Plains physiographic province [27]. The Missouri Plateau on the Crow Reservation is described as a mature landscape consisting of flat to rolling plains dissected by rivers with scattered isolated mountains [28]. Elevations range from about 2822 m (9257 feet) in the Bighorn Mountains to about 884 m (2900 feet) at the confluence of the Bighorn and Little Bighorn Rivers at Hardin. The towns of Billings and Hardin, Montana, are near the northern edge of the reservation, and the Montana-Wyoming border forms much of the southern edge. The reservation includes about 9324 km2 (3600 mi2) in the Big Horn and southeastern part of Yellowstone Counties, Montana [29]. The reservation is approximately 129 km (80 mi) wide and 85 km (53 mi) north to south.
Figure 1. Study area, showing the Crow Reservation (outlined by the red and black border). Hydrologic basins (HB) for the major drainages, mountain ranges and the location of the two abandoned uranium mining districts southwest of the reservation are shown. The Bighorn/Yellowstone County line is delineated in yellow.
Geosciences 05 00067 g001

1.2.2. Drainages

Three rivers create two major valleys and the natural divisions between the three mountainous areas of the reservation. On the northwest side of the reservation Pryor Creek is the main drainage which flows northwest through the Pryor mountains and then changes and flows to the northeast. The Bighorn River flows northeast from the southwestern edge of the reservation and defines the boundary between Carbon and Bighorn counties. The Little Bighorn River flows north across the reservation joining the Bighorn River at Hardin. All three drainages are tributary to the Yellowstone River [30]. The Tullock Creek drainage flows north joining the Bighorn. Drainage from the western half of the coal producing area on the reservation (Wolf/Rosebud mountainous area) flows into the Little Bighorn River. Drainage from the northeastern portion of the area is collected by the Rosebud Creek drainage system and flows east into the Tongue River [31]. The alluvial low lands located along the Bighorn River and Little Bighorn River are where uranium was found to exceed EPA’s MCL in some tested home wells.

1.2.3. Mountain Ranges

The mountain ranges on the Crow Reservation include the Bighorn and the Pryor Mountains which are an outlying portion of the Rocky Mountains, to the southwest, and the Wolf/Rosebud Mountains on the east. The northern end of the Bighorn range extends from north-central Wyoming into the southwestern corner of the reservation. The Dryhead-Garvin Basin, a flat floored syncline separates the northern Bighorn Mountains and the east side of the Pryors [32]. The northern portion of the Bighorn range ends in the canyon of the Bighorn River (Figure 2) just southeast of the Pryor Range. These ranges host two abandoned uranium mining districts [33,34,35,36] which border the reservation. These mining districts operated from about 1956 to the early 1980’s [34]. The east side of the reservation is flanked by the Wolf and Rosebud Mountains. A narrow divide that separates the Davis Creek and Rosebud Creek drainages, separates the Wolf Mountains from the Rosebud Mountains to the north. These mountains are highly dissected with numerous outcroppings of Eocene Wasatch Formation and Paleocene Fort Union Formation coal deposits [27].
Figure 2. Northern portion of the Bighorn Mountains and the Bighorn River.
Geosciences 05 00067 g002

1.2.4. Geologic Setting

The geologic setting of the Crow Reservation includes the west flank of the Powder River basin, a northwest-trending synclinal feature at least 400 km long and as much as 160 km wide in eastern Wyoming and southeastern Montana; the south flank of the Bull Creek syncline, a large east-trending fold in central Montana; and the northern parts of the Bighorn and Pryor uplifts [37]. These features, and many subsidiary folds and faults associated with them, were formed in early Tertiary time [38] and account for the distribution of rock units in the reservation.
The geologic formations exposed at the surface on the Crow Reservation range from Cambrian units in the Big Horn Canyon to the younger Tertiary units on the eastern flank of the reservation [38] (Figure 3). With the exception of small structural fluctuations, the beds gently dip easterly. In general, erosion has exposed each geologic formation at or near the surface in a series of stacked inclined formations progressing from older beds on the west to younger beds on east side of the reservation [27]. The youngest exposed rocks, exclusive of surficial stream terrace deposits and alluvium, are the Tertiary Wasatch and Fort Union Formations which lie east of the Little Bighorn River on the flank of the Powder River basin in the Wolf Mountains [31].
Figure 3. Geologic map of the reservation, showing locations of old uranium mines.
Geosciences 05 00067 g003

1.2.5. Description of the Uranium Mining Districts
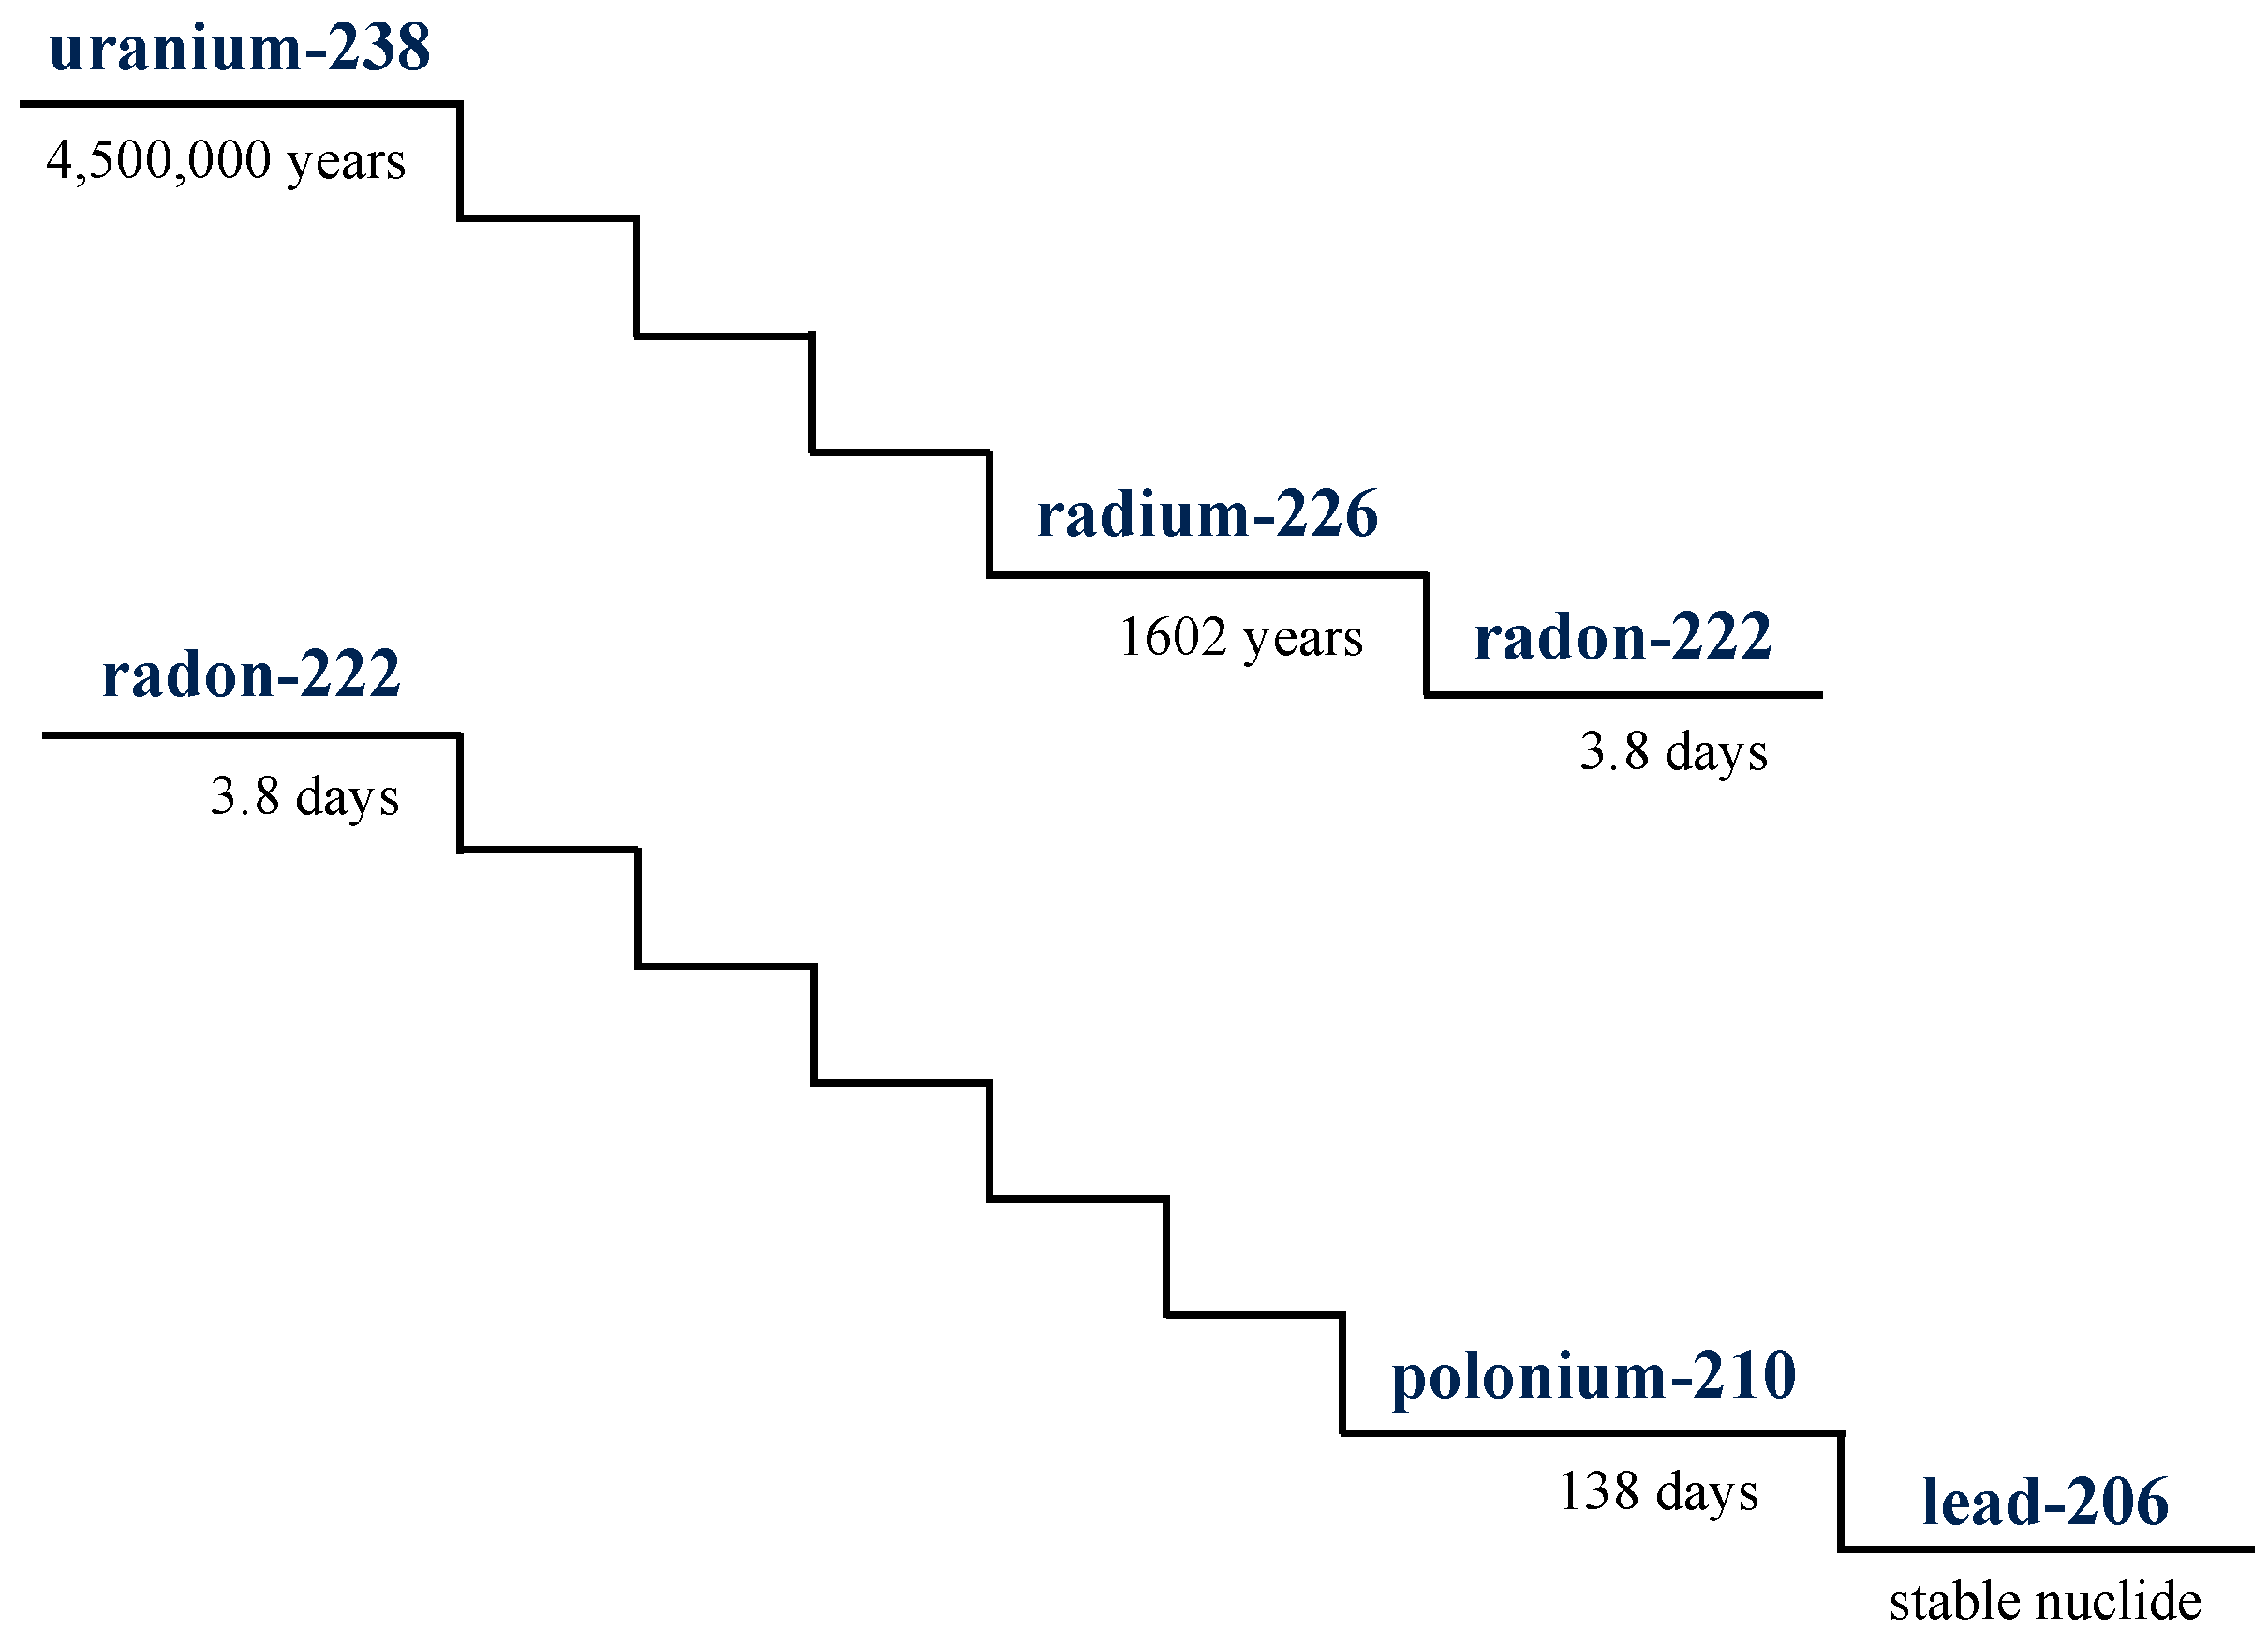
An area spanning from the Big Pryor Mountain Mining District, in Montana to the Little Mountain Mining District in Wyoming has been prospected for uranium and other radioactive minerals since 1956 [34,35,39]. The Mississippian Madison Limestone outcrops extensively throughout the area. A paleokarst horizon in the top 58–73 m is the main zone for mineralization [35] (p. 1). Relatively small, high-grade (median grades of 0.26% U3O8, 0.23% V2O5) deposits in Montana and Wyoming combined, produced 133,810 kg (295,000 lb) of triuranium octoxide (U3O8) and 106,594 kg (235,000 lb) of vanadium oxide (V2O5) during 1956–1964 [35] (p. 1). The Madison displays zones of extensive brecciation that are both discordant and concordant to bedding. The upper 60 m of the Madison Limestone are characterized by “solution cavities” along bedding planes, fractures and joints; angular limestone fragments of variable size (from several centimeters to a meter or more across) have filled the cavities, in addition to reddish clay silt from the overlying Amsden Formation and cryptocrystalline silica [34]. Uranium and vanadium minerals are also concentrated in the solution cavities and at the Madison-Amsden contact.
In addition to being stratigraphically localized, the uranium deposits in the area of Red Pryor Mountain show a structural relationship to a zone of fractures that trend N 65° W, on a trend that includes the East Pryor and Little Mountain group of mines [34] (p. 12); mineralization appears to be enhanced where northwest-striking fractures intersect the crest of a large south-plunging anticline [34]. Furthermore, the alignment of mines (Old Glory, Sandra, Lisbon, Dandy, and Swamp Frog) on the Red Pryor quadrangle is spatially coincident with a reverse fault in the basement that subtends the south-plunging anticline [36]. Deposits in the Little Mountain Mining district of Wyoming occur in the same stratigraphic units, within collapse breccia features and with the same ore minerals. Principal ore minerals are the calcium uranyl vanadates tyuyamunite and metatyuyamunite [34,35,38].

1.3. Uranium

Uranium is a very dense, radioactive metal. Of its three naturally occurring isotopes, U-238 is the most common, constituting more than 99% of natural uranium by mass. U4+ in uraninite and other minerals undergoes oxidative weathering, forming highly soluble U6+. In this oxidized form, it is easily transported in groundwater and is found in rivers and lakes [40]. As a radioactive element, U-238 has a decay chain which includes radium-226, the gas radon-222, polonium-210 and finally, the stable nuclide lead-206 (Figure 4).
Figure 4. Greatly simplified Uranium-238 decay series showing radioactive decay products discussed in this report (adapted from [41]).
Geosciences 05 00067 g004

1.3.1. Uranium and Human Health

Uranium, a radionuclide which emits primarily alpha particles, has a variety of associated health risks. Although most of the uranium and daughter products consumed in drinking and cooking water are eliminated by the body, small amounts are absorbed from the digestive tract and enter the bloodstream. Uranium in the bloodstream is filtered by and deposited in the kidneys, where it targets the proximal tubules [42]. Uranium exposure has been found to be positively associated with cytotoxicity biomarkers: increases in urinary albumin [8], glucose and calcium [2], β2-microglobulin and alkaline phosphatase [6]. Absorbed uranium not excreted via urine, accumulates primarily in the skeleton and kidney [4,43]. Exposure can increase cancer risk and lead to liver damage [44]. Additional documented health outcomes of concern include effects on the brain, diminished bone growth, DNA damage and developmental and reproductive effects [45,46]. The health risks from uranium in drinking water are greatest for infants and young children, who can suffer lasting damage from exposure at critical times in their growth [47]. Drinking and cooking with uranium contaminated water is the primary route of exposure to uranium in well water, as absorption through skin is minimal [48].

1.3.2. Uranium in Well Water

Historically, home well water in Montana has not been tested for uranium [48]. By 2009, more than 600 wells had been drilled by the Indian Health Service for Crow Tribal members on the Reservation, but uranium was almost never included in the analysis. When the Crow Water Quality Project began home well water testing, and even now, a “full domestic analysis” of home well water through Montana’s Well Educated Program at the nearest EPA certified laboratory does not include testing for uranium or any other radionuclide [49].
In 2009, the National Water Quality Assessment Program of the U.S. Geological Survey published the groundbreaking “Quality of Water from Domestic Wells in Principal Aquifers of the United States, 1991–2004”. Sampling of domestic wells in 30 of the 60 principal aquifers found that 1.7% of wells exceeded the Environmental Protection Agency’s Maximum Contaminant Limit (MCL) of 30 µg/L for uranium [11].
USGS National Uranium Resource Evaluation (NURE) collected well water data in 1976–1979 on the Crow Reservation. Almost all the samples were filtered, acidified then analyzed for uranium at the Department of Energy’s Los Alamos Scientific Laboratory in New Mexico, using fluorescence spectroscopy, methods LA6-FL, OR9-FL, with a detection limit of 0.5 µg/L. Well use was not recorded, except for six records which mention “livestock well.” Nearly all the samples list “agriculture” or “none” as potential contaminant sources. 34 of 189 of these tested wells, or 18%, had uranium over the EPA regulated limit of 30 μg/L for drinking water. Eighteen of these 34 wells were in the lower Bighorn hydrological basin (HB), 14 were in the Little Bighorn HB, and only one was in the Pryor HB [26].
More recently, testing by the USGS in southwestern Montana found that 14.1% of 128 wells exceeded the MCL for uranium, while 29% exceeded the drinking water standard for uranium, radon, radium 226, radium 228 and/or alpha or beta particles [50]. Although this sampling was done in counties some 240 km (150 mi) west of the Reservation, these data illustrate that sampling for uranium alone could substantially underestimate the health risks from radionuclides in well water as decay products of uranium can also be present.
The presence of uranium and/or other radionuclides in well water alone is not sufficient to determine whether health risks exist. As the USGS noted, “Improved information is needed on the number of people consuming water from domestic wells in specific regions and aquifers… Such information is essential for evaluating the potential human health implications and possible mitigation approaches.” [11].

2. Methods

This research addresses the limitations of previous well water quality studies by combining well water testing for uranium and other analytes, with homeowner surveys and secondary health and economic data. These methods have provided data on well water consumption, well and septic system maintenance practices and economic factors limiting well water treatment, which in conjunction with well water quality data, enable better assessment of health risks from well water contamination.

2.1. Community-Based Participatory Research

The collaboration follows the principles of community-based participatory research (CBPR), which has been defined as, “a partnership approach to research that equitably involves, for example, community members, organizational representatives, and researchers in all aspects of the research process and in which all partners contribute expertise and share decision making and ownership” [51]. The Crow Environmental Health Steering Committee (CEHSC) members, all of whom are Crow Tribal members, meet about ten times a year with academic partners who serve as non-voting Committee members. The CEHSC members guide, actively participate in and contribute vital local environmental, health, social and cultural expertise to the research. The local Project Coordinator, with various interning Little Big Horn College science majors and a Montana State University (MSU) graduate student, all Tribal members, conducted nearly all the well water sampling, survey work and follow-up visits with participating families. The data management and statistical analysis were conducted by a non-Tribal academic partner; the geology expertise was provided by a Crow graduate student at MSU, who also took the lead on the geographic information system (GIS) maps (ArcMap™ 10.2.1, ESRI ©, Redlands, CA, USA). CEHSC members and academic partners including Crow graduate students co-presented project results locally, regionally and nationally, and collaborated on this publication. Applying CBPR principles to risk assessment research as well as risk communication and risk mitigation is an effective way to reduce health disparities in Crow Reservation communities. This approach has been found to be effective in other Tribal communities addressing environmental health issues [15], as well as internationally with communities experiencing environmental health disparities [52].

2.2. Volunteer Recruitment and Participation

Based on USGS, U.S. census and project data, it is estimated that 970 Crow families in Big Horn County use home wells. The northwest corner of the Reservation is in Yellowstone County, constituting about 10% of the Reservation’s acreage; approximately 50 Crow families live in this region. Including both Counties, at least 1020 Crow families living on the Reservation rely on home wells for their domestic water supply.
In 2008 an Institutional Review Board approved a survey that covered treatment and uses of home well water; well water taste, color and odor; other sources of water for domestic, traditional and recreational uses; well and septic system knowledge and maintenance practices; potential sources of well water contamination and other factors. The survey drew from comprehensive environmental health surveys used in other studies [53,54] as well as on co-authors’ knowledge of local conditions and practices, and was edited by two Crow CEHSC members with graduate degrees in social science disciplines and lifetime knowledge of Crow Reservation communities.
Beginning in 2009, participants were recruited from throughout the Reservation. Random sampling was ruled out from the very beginning by the CEHSC as culturally inappropriate and hence ineffective. Flyers were posted in public locations, ads were placed in the local papers, staff set up tables at community health fairs and other events, and all involved recruited through word of mouth. Personal recruiting through friends, family and social networks proved to be by far the most effective strategy. The local project coordinator, a Tribal member, met each volunteer at their home, explained the project, answered questions and collected the water samples for microbial and chemical analyses. Participants chose either to complete the survey on their own, or completed it with the project coordinator. Each received a free comprehensive domestic analysis of their well water, a stipend and a follow up explanation of their well test results and treatment options. Recruitment was capped at 150 participants due to budget and time limitations and as this was a sufficient sample for analysis.

2.3. Sample Collection and Analysis

Water samples were collected from the home’s kitchen tap. In the rare cases where the homeowner had installed a water treatment device, untreated water was collected from another point in the plumbing system or not included in the analysis. Water temperature, conductivity and pH were measured on site. Samples were placed on ice and delivered in less than 24 hours (usually within the same day) to Energy Laboratories, an EPA certified lab in Billings, Montana for a full domestic analysis on each water sample that included physical properties (total dissolved solids (TDS), conductivity, corrosivity and pH); inorganics (alkalinity, bicarbonate, carbonate, chloride, sulfate, fluoride, nitrate + nitrite as N, hardness as CaCO3 and sodium absorption ratio (SAR)); and metals (aluminum, arsenic, cadmium, calcium, chromium, iron, lead, magnesium, manganese, potassium, sodium and zinc). Corrosivity, hardness and SAR were calculated, all other analyte values including TDS were measured.
After about 50 wells had been tested, geologist and Crow Tribal member Anita Moore-Nall suggested adding testing for total uranium, an element not part of the Montana Well Educated Program’s “full domestic analysis” [49]. Total dissolved uranium was included as an analyte in all subsequent wells tested, 97 in total, utilizing EPA Method E200.8 [55] per the recommendation of Energy Laboratories. The reporting limit for uranium with this method was 1 μg/L. (Energy Laboratories has been accredited by the National Environmental Laboratory Accreditation Program since 2001. Their quality assurance (QA) procedures, including how the Lab estimates method accuracy, are provided in their QA manual [56].
The decision was made not to return to homes previously sampled just to test for uranium, for several reasons. Most participants worked away from home during normal business hours, making sampling difficult; homes were as far as 120 km (75 mi) from our base of operation at Little Big Horn College, so each home visit was expensive. Given limited budget and staff time, the decision was made to limit uranium sampling to new participants, to maximize the number of families the project could serve.

2.4. Data Entry and Analysis

Mapping the spatial distribution of well water contaminants is vital for risk assessment, communication and mitigation. A GIS map was prepared to show both spatial patterns and the considerable variability in uranium contaminant levels even among neighboring wells. In the GIS a point and polygon overlay was used to look at well data and elements present in the wells and surface water samples and stream sediment samples from the National Uranium Resource Evaluation (NURE) Hydrogeochemical and Stream Sediment Reconnaissance (HSSR) Program’s data base for Montana and Wyoming [26]. Additional water quality data was obtained and added to the GIS from the Montana Bureau of Mines and Geology’s Ground Water Information Center (GWIC) [57], the Montana Natural Resources Information System [58], Natural Resource Conservation Service’s Data Gateway [59], the University of Wyoming’s Water Resources Data System [60], the Wyoming Geographic Information Center [61], USGS Water Quality Data for Wyoming [62] and the USGS National Geochemical Database Reformatted Data for Montana and Wyoming [63]. Data from all 97 wells tested for uranium by the Crow Water Quality Project was then entered into MS Excel™ and added to the GIS.
Well water contamination was also examined spatially using watershed boundaries, as each watershed has distinctive water contamination issues. The Reservation’s three main river valleys, from west to east, are Pryor Creek, the Bighorn River and the Little Bighorn River, all of which flow south to north, separated by mountain ranges (Figure 1). Crow settlements have traditionally been along the rivers and creeks, and that pattern continues today. Histograms of uranium concentrations in well water were plotted for each watershed, and the respective means and standard deviations were calculated, using Excel 2013.
As shown in Figure 5 (below), the traditional “Districts” of the Reservation correspond to watersheds, with the exception that the “Black Lodge District” encompasses portions of both the Bighorn and Little Bighorn River watersheds. Districts are well understood geographic, social and political regions of the Reservation, hence their utility for communicating risk.
Figure 5. Maps of the Crow Reservation, showing location within Montana and major rivers, towns and traditional districts of the Reservation.
Geosciences 05 00067 g005
Contaminant concentrations were log transformed to improve normality. Correlations between or among contaminants (e.g., uranium concentration and TDS) were analyzed using regression (for two contaminants) or multiple regression (for three or more contaminants), utilizing IBM SPSS™ Statistics 22 (IBM, Armonk, NY, USA). Surveys were completed by one hundred ninety-seven participants from 165 households. These data were entered into MS Access™ and subsequently analyzed using IBM SPSS™ Statistics 22. Comparisons of categorical variables were made using chi square (“cross-tabs” in SPSS). Comparisons of contaminant concentrations across categorical variables—such as uranium vs. water use group—were conducted with analysis of variance (ANOVA). When SPSS calculated that there was significantly unequal variance between contaminant concentration distributions, a non-parametric test (Dunnett T3) was used.

2.5. Risk Communication
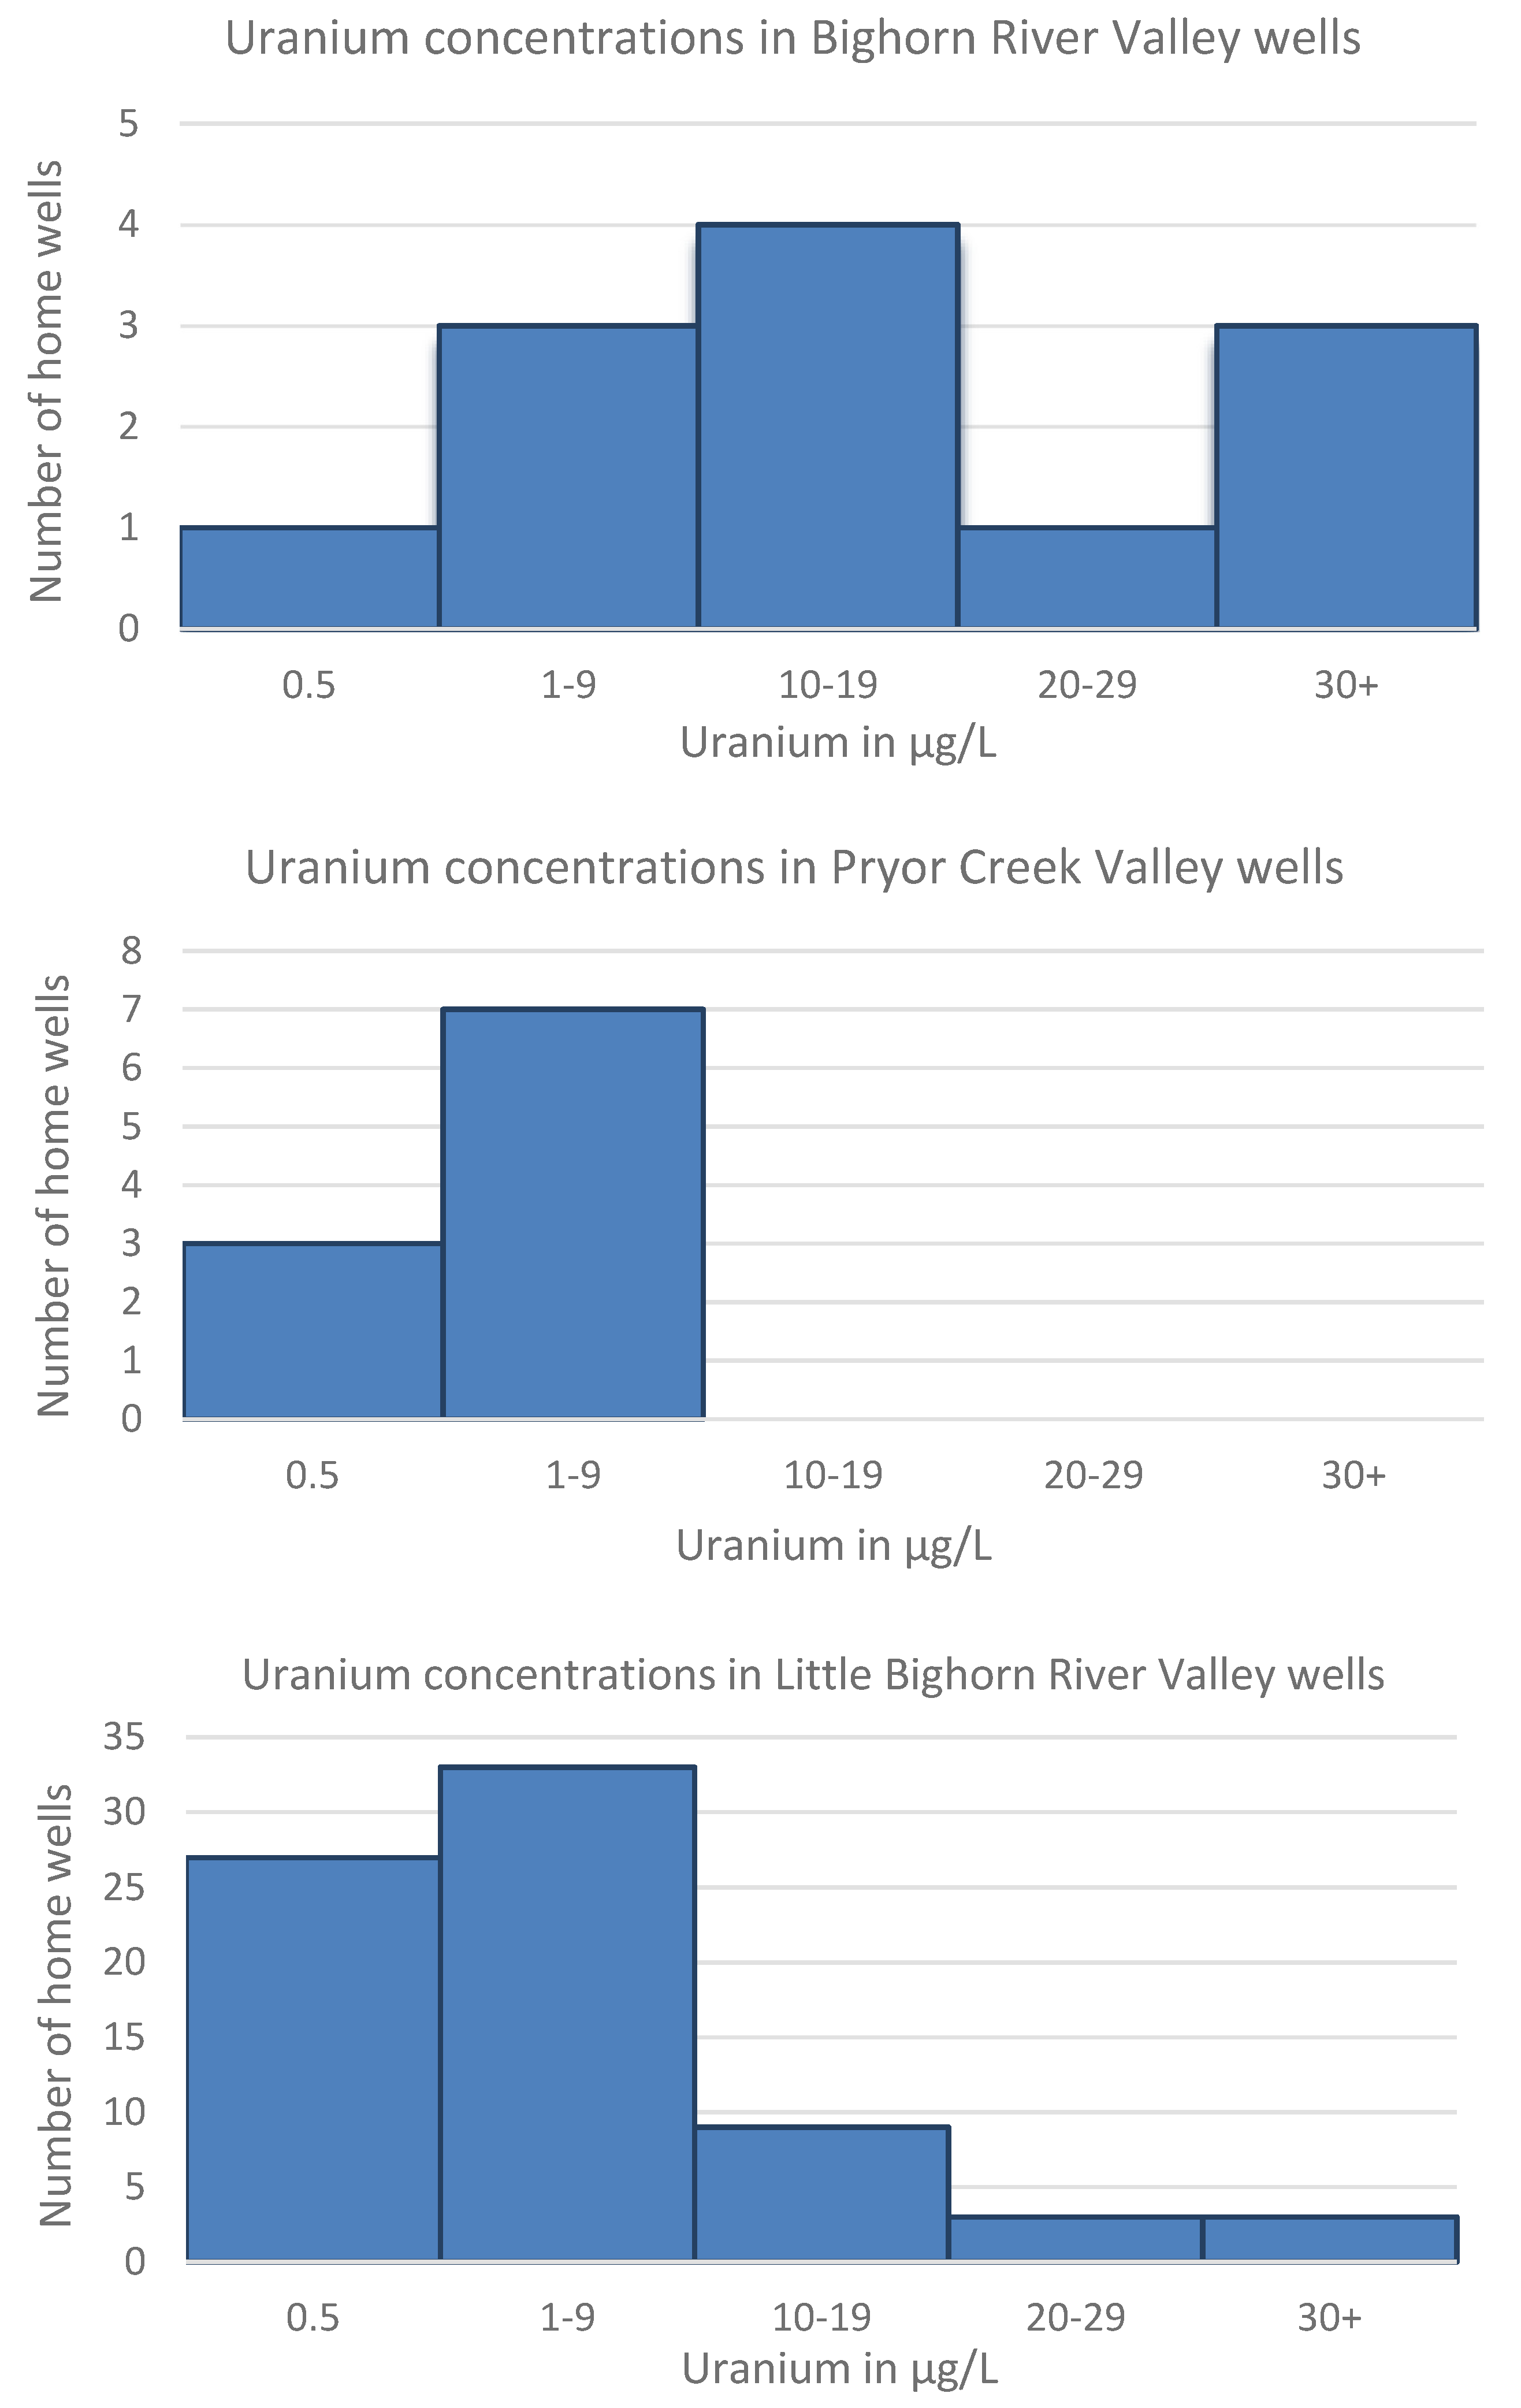
Methods included risk communication and risk mitigation in addition to risk assessment. Well owners received a spreadsheet comparing their well water contaminant concentrations, including uranium, with EPA’s primary and secondary standards, along with an individualized letter reviewing and explaining their well water test results. Follow up in person visits with as many well owners as could be reached were conducted in 2012–2013.
Ongoing project results, including the GIS maps of uranium and other well water contaminants, were discussed regularly at meetings of the CEHSC, and were presented to the Crow Tribe’s Water Resources staff, the Pryor 107 Elders Committee, Messengers for Health and to the community at large through at least one open house a year. Copies of GIS maps showing the spatial distribution of each contaminant were also provided to the Environmental Health Department of the local Indian Health Service Hospital, which contracts to drill wells for well owners. A poster displaying these maps and explaining the health risks was prepared and is being displayed at local health fairs and in the project office in Crow Agency.
Project data were provided to the Crow Tribe at the request of the Tribal Chairman, to the Crow Tribal Environmental Protection Department and to the Apsaalooke [Crow] Water and Wastewater Authority (AWWA). The AWWA subsequently was able to raise funds for and install a “water salesman,” an automated dispensing system in the main Reservation town of Crow Agency, which allows rural residents to purchase municipal water at a very low cost. Other mitigation options for well owners with unpalatable or unsafe well water have been and are being explored. An article summarizing final water quality test results by watershed, with specific recommendations for well water testing for those contaminants of most concern, was submitted to the Tribal newspaper.
Several two day professional development workshops on local water quality were held for local K—12 teachers in conjunction with Montana State University or Little Big Horn College educators. Presentations have also been given in school classrooms and at several local health fairs.

3. Results

Uranium was detected in 68% of the 97 wells tested by the Crow Water Quality Project, with concentration of at least 1 μg/L of uranium (the reporting limit), exceeding EPA’s Maximum Contaminant Level Goal (MCLG) for uranium of 0 μg/L [64] (Figure 6). The EPA sets the MCLG after reviewing studies of health effects, and describes the MCLG as “the maximum level of a contaminant in drinking water at which no known or anticipated adverse effect on the health of persons would occur, and which allows an adequate margin of safety. MCLGs are non-enforceable public health goals”. [64] Low levels of uranium in water sources are common, so the public health goal of 0 μg/L is not only non-enforceable but practically speaking, also non-attainable. However, it is important to note that there are known adverse health effects at uranium concentrations lower than the MCL, the municipal drinking water standard, which considers economics as well as health.
EPA’s MCL of 30 μg/L (ppb) was exceeded in 6.3% of wells. Other national and international standards for uranium in drinking water are stricter. In Canada, the “maximum acceptable concentration” is 20 μg/L [65], which was the standard initially proposed for the U.S. EPA, but rejected based on a cost-benefit analysis [45]. Some states, such as Vermont, have also opted for the more conservative standard of 20 μg/L [5]. 10.3% of wells tested on the Reservation by this Project exceeded this stricter standard.
Figure 6. Geographic information system (GIS) generated map showing hydrologic drainage basin units, old uranium mines (yellow dots) and well water data from the United States Geological Survey (USGS) National Uranium Resource Evaluation (NURE) Hydrogeochemical and Stream Sediment Reconnaissance (HSSR) data base; the Montana Bureau of Mines and Geology Ground Water Information Center (GWIC) data base and the Crow Water Quality Project data base.
Geosciences 05 00067 g006
Averaging well water uranium concentrations by river valley shows that residents in the Bighorn River Valley (n = 12) are most at risk for contaminated wells, with an average uranium concentration of 25 ± 29 μg/L (Figure 7). Uranium concentrations in Little Big Horn River valley home wells (n = 75) averaged 6 ± 9 μg/L; Pryor Creek home wells (n = 10) had the lowest uranium concentrations, averaging 3 ± 3 μg/L (Figure 7).
Given the considerable variability in uranium concentrations, how would a homeowner decide whether well water testing is worth the cost? Uranium in water is colorless, tasteless and odorless [66], so there are no sensory clues. High TDS, which imparts a taste that families can recognize, was found to be a potential indicator for the occurrence of uranium. pH, easily measured by Project staff, was also investigated as a potential indicator. Regression analysis found that TDS was significantly associated with uranium in the Bighorn River Valley (R2 = 0.828) and in Pryor (R2 = 0.719). In the Little Bighorn River valley, multiple regression analysis found that both TDS (p < 0.001) and pH (p < 0.001) were predictive of uranium (R2 = 0.446) [67].
Figure 7. Histograms of uranium concentrations in well water (in μg/L) by river valley, Crow Reservation. The reporting limit is 1.0 μg/L, hence 0.5 μg/L represents non-detection.
Geosciences 05 00067 g007
These results agree with an analysis of nationwide data, which found a correlation between uranium and oxic waters with a pH in the range of 6.5 to 8.5 as well as high carbonate levels. In these conditions, high uranium also corresponded with high TDS levels [68]. These correlations can be explained: in oxic conditions in shallow groundwater and surface water, uranium most commonly exists as U(VI) in the uranyl ion (UO22+); this ion typically complexes with the ligand carbonate (or phosphate), which greatly increases the solubility of uranium in water [69].
Similar pH, carbonate and TDS conditions were all found in the home wells tested on the Crow Reservation: (1) wells with elevated uranium were all in the pH range of 7.0 to 8.0, (2) bicarbonate levels were high in all three river valleys, ranging from a mean of 350 mg/L in Pryor to a mean of 495 mg/L in the Little Bighorn River Valley, and (3) high TDS was significantly correlated with high uranium concentrations in all three river valleys. Redox conditions are unknown, as neither oxidation reduction potential nor well depth was measured. However, most homeowners reported that their wells are in relatively shallow groundwater, due to the cost of drilling deeper wells; shallower groundwater is more likely to be oxic.
As the USGS acknowledged in its nationwide study, both well water quality data and well water consumption data are needed to assess the health risks from groundwater contamination [11]. Survey results (Table 1) document that 20% of well owners neither drink nor cook with their well water (Group I), 20% only consume their well water through cooking (Group II) and 60% of well owners both drink and cook with their well water (Group III). All well owners who participated in this study use their well water for bathing, washing dishes and cleaning their house, regardless of the water quality.
Families who drink and cook with their well water (Group III) have an average TDS level of 959 mg/L in their water—almost double the EPA’s secondary standard of 500 mg/L. Although their well water is thus on average considered “objectionable” for consumption [49], they have significantly better well water quality, based on TDS, than families who consume well water only through cooking (Group II, mean TDS 1970 mg/L, standard deviation (SD) of 1466 mg/L) (p = 0.002) or don’t consume it at all (Group I, mean TDS 2262 mg/L) (p = 0.001) (Table 1).
Table 1. Relationship of well water quality to consumption.
Well Water UseNumber of FamiliesDrink Well Water?Cook with Well Water?Mean and SD of TDS in mg/LMean and SD of [U] in μg/L*
Group I30NoNo2262 ± 172614 ± 15
Group II31NoYes1970 ± 146613 ± 23
Group III91YesYes959 ± 5784 ± 6
Note: * For families whose wells were tested for uranium: Group I, n = 21; Group 2, n = 21; Group 3, n = 52. Water use data lacking for three participating households.
This analysis shows that families whose well water is good enough to drink untreated (Group III) have significantly lower concentrations of total dissolved solids in their water, including generally low levels of uranium. Families who neither drink nor cook with their water (Group I) are not at risk of exposure to uranium, as absorption through skin is minimal [46]. Families who still cook with their well water, despite its unpleasant taste (Group II), are most at risk of consuming water with unsafe uranium concentrations. Families in both Groups II and III should also consider testing their home air for radon [70].
Despite the widespread poor quality of well water, very few families have home water treatment systems. Although 77% of all wells tested have unacceptably hard water (in excess of the EPA secondary standard), only 3.3% of families had installed a water softener. While 85% of all wells tested exceed the EPA secondary standard for TDS, only 4% of families had a reverse osmosis system. Despite the generally high levels of iron and of manganese, no participating family had an iron/manganese removal unit [67]. The hard water requires softening before treating it by reverse osmosis, and water softeners require purchasing treatment chemicals regularly. While the U.S. and the Montana per capita incomes for 2010 were $27,334 and $23,836 respectively, the per capita income for the four largest Crow Reservation communities a third or less of this, ranging from only $7,354 to $8,130 [17]. Crow Environmental Health Steering Committee (CEHSC) members explain that the cost of installing and maintaining treatment technology, including the monthly cost of chemicals, is simply prohibitive for most families. Most families with unpalatable well water cope by purchasing and hauling bottled water and/or filling gallon jugs at homes of friends and relatives. A few collect and use spring or river water.
As the two most populated local communities—Hardin and Crow Agency—use the Bighorn and Little Bighorn Rivers respectively for their municipal water supplies, water samples were collected monthly from both rivers over an eight month period, delivered to the EPA-certified lab in Billings and tested for the same parameters as well water, including uranium. The Big Horn River at Hardin averaged about 4 μg/L uranium, and the Little Big Horn River even less.

4. Discussion and Conclusions

4.1. Potential Sources of Uranium in Local Groundwater

Both project data and the NURE data indicate that uranium contamination of wells is most serious in the Bighorn River valley and also of concern in the Little Bighorn River valley, while only one well tested in the Pryor Creek valley (by NURE) exceeded 30 μg/L.
Mapping the uranium concentration in well water in relation to the geology of the Crow Reservation shows that the highest uranium values appear to be associated with Quaternary Terrace deposits in the lower Bighorn River Valley (Figure 6) [71]. These valley fill sediments could have eroded from the uranium bearing upland bedrock, as is the case elsewhere in Montana [46]. Other possible uranium sources may be from the Jurassic Morrison Formation or the Fort Union Formation. In 1952, the Atomic Energy Commission made an airborne radiometric survey over portions on the east flank of the Bighorn Mountains covering about 647 km2 (250 mi2), including part of the Crow Reservation [29]. The only anomaly found on the Crow Reservation by the aerial survey was in the Morrison Formation in Section 34, Township 4 South, Range 29 East, and Section 3, Township 5 South, Range 29 East [29]. Investigation on the ground revealed a very weak radioactive zone within the shales of the Morrison Formation. Radioactivity was also noted in dinosaur bone fragments embedded in a sandstone facies of the Morrison Formation; results from chemical assays on samples of bones showed the highest radioactivity indicated was 0.23 percent triuranium octoxide (U3O8, a form of yellowcake) [29]. Later a NURE investigation of the Billings Quadrangle was conducted from 1978–1981 [33]. Geologic units were investigated for favorable uranium deposits that could contain at least 100 tons of U3O8 in rocks with an average grade of not less than 100 parts per million (ppm) U3O8. A thin, radioactive, carbonaceous claystone bed from an outcrop of Fort Union was sampled and found to contain 50 ppm U3O8, and this was considered unfavorable for uraniferous lignite-type deposits [33]. These formations may be a source of naturally occurring uranium on the Crow Reservation.
Historic uranium and vanadium mining directly to the southwest of the Reservation, just outside of the Reservation boundary, might also be contributing to well water contamination down gradient in the Bighorn River Valley. The two abandoned mining districts in the Mississippian-aged Mission Canyon formation which hosts the mineralized uranium/vanadium deposits are represented as mining symbols in the southwest corner of the map (Figure 6).
Agricultural fertilizer is a third potential source of uranium in groundwater, as the radionuclide occurs in phosphate mined for fertilizer production [72]. Research in Germany has found that the uranium concentrations in groundwater below agricultural land are three to 17 times higher than under forested land [73] cited in [72]. Hence, extensive irrigated and dry land farming on the Reservation, particularly in the Bighorn River valley [74], could be contributing uranium from fertilizer to the groundwater.
In short, uranium contamination of home well water is likely to be coming from natural sources, and might be exacerbated by mining in the upper Bighorn River watershed and/or fertilization of agricultural lands in the Bighorn and Little Bighorn River valleys. Future research employing isotopic analysis of uranium in well water could help elucidate contamination source(s).

4.2. Sources of Uncertainty

The “snowball” sampling strategy for participation in this study—based on volunteers—could have biased results, as one might suspect that families with poor quality well water would have been more likely to volunteer to participate. However, comparing project data with the non-georeferenced Indian Health Service well water database showed that families with poor quality well water were underrepresented [67]. Perhaps families who neither drank nor cooked with their water had less reason to take the time to participate?
One might ask whether the subset of 97 families whose wells were tested from uranium differed from the overall sample of 151 families. There is no evidence to suggest a difference: the sampling strategy did not change after the project added uranium as an analyte, nor did the proportion of families in the three water use Groups (no consumption, cooking only, cooking and drinking) change at this point in the study (Table 1). Both the overall sample of 151 families and the subset of 97 families whose wells were tested for uranium are drawn primarily from the Little Big Horn River Valley, with lesser representation of the Bighorn River and Pryor Creek valleys; this accurately reflects the distribution of the Tribal population on the Reservation.
Well water was tested only for total dissolved uranium. It is possible that particle-bound uranium is also present in well water. If this is the case, a higher percentage of home wells might exceed the MCL, presenting a health risk to families consuming the water.
In the Little Big Horn River Valley, the presence of two aquifers—a shallower one with poor water quality and a deeper one with better water [75]—probably contributes to the variability in well water uranium concentrations. Many families participating in this study were unsure of the exact depth of their well, hence it was not possible to correlate uranium with well depth. Measuring well depth would improve the ability to predict uranium concentrations based on aquifer as well as to assess the impacts of land use practices on contamination of shallow groundwater.
Simply measuring uranium concentrations in home well water might underestimate the risks from exposure to radionuclides, as the USGS found in western Montana [50]. Elevated levels of uranium progeny such as radium and radon (along with uranium) have been found to occur in groundwater where there is uranium mineralization [76]. Higher concentrations of radium have been found to be associated with manganese or iron-rich anoxic groundwater [68]. Wells in both the Bighorn and Little Bighorn River valleys are relatively high in manganese, with average concentrations well exceeding EPA’s secondary standard of 0.05 mg/L [67]. Additionally, average iron concentrations in well water substantially exceeded the EPA secondary standard of 0.30 mg/L in every zip code in the Big Horn and Little Big Horn River valleys, with the exception of Fort Smith in the upper Big Horn River watershed. Hence, the conditions may exist for radium to also be found in higher concentrations in home well water.
Nationally, radon is also a relatively common well water contaminant: the USGS found 4.4% of home wells tested in 48 states exceeded the EPA’s proposed MCL of 4,000 pCi/L for radon, and 65% exceeded the alternate proposed MCL of 300 pCi/L [9]. Bighorn County is classified as “Zone 1” for the highest risk of radon in homes [77]. While testing well water for radon contamination might be advisable, it is expensive and radon released from soil into home air and inhaled is a more significant health risk (lung cancer) [78]. The limited radon data for Bighorn County shows that of homes tested, 34% had radon levels at or above 4 pCi/L, requiring mitigation [79]. Testing home air for radon is needed, but was deemed beyond the scope of this risk assessment.
In sum, although there are numerous sources of uncertainty, particularly with regards to whether other potential (radionuclides and pesticides) and known (inorganic and microbial [80,81]) contaminants are contributing to the health risks, the potential for error in this study is primarily in having underrepresented the health risks to families using wells.

4.3. Uranium Contamination of Home Well Water is a Priority Public Health Issue

Based on the following recognized criteria for prioritizing and addressing exposures to environmental chemical mixtures [82], contamination of home well water on the Crow Reservation should be addressed as a high priority public health issue:
(1)
Breadth of exposure. Roughly 50% of Crow families rely on home wells for their domestic water supply [11]; 80% of these families drink and/or cook with their well water. Uranium and possibly other radionuclides in well water are widespread in the Bighorn and Little Bighorn River valleys on the Reservation.
(2)
Nature of exposure. People consume well water daily for many years. Survey data document that people who drink their well water consume about eight cups per day [67]. Half of families whose well water is so high in TDS that it is unfit for drinking, nevertheless still use it for cooking.
(3)
Severity of effects. The nephrotoxic effects of uranium [83] are a particular concern given the high diabetes prevalence rate of 12.1% in Big Horn County, compared to 6.2% statewide, as well as the downstream effects of seriously elevated rates of hospitalization and death from diabetes [18]. While many factors, including physical activity level, diet, obesity, metabolic factors and possibly genetics increase risk of diabetes [84,85], exposure to the nephrotoxin lead is another known factor [84]. Decline in kidney function associated with blood lead and tibia lead levels is significantly more rapid in middle aged and older men with diabetes than in men without this disease [86]. Uranium, like lead, is nephrotoxic [83,87]. While the effects of uranium exposure on diabetic kidney disease incidence and progression is unknown, this possibility is of concern to the project team.
(4)
Interactions. Interactions as understood in an ecological framework include natural, built and sociopolitical factors [88], all of which contribute to local health impacts from water contamination. The interactive direct health effects of uranium with other potentially co-occurring inorganic, organic, radioactive, and/or microbial contaminants in well water are unknown. Community members burdened by existing health conditions are likely to be more vulnerable to the impacts of well water contamination. Any health effects from exposure to contaminated drinking water are likely to both contribute to and be exacerbated by the existing health disparities that underlie the twenty year difference in life expectancy between Native American and non-Native residents of Big Horn County [19] cited in [18].
Lack of environmental health literacy is also viewed by the CEHSC as contributing to health disparities. One Crow Elder compared the arrival of indoor plumbing in the 1960s with the earlier arrival of watermelons: not knowing how to prepare watermelons, people boiled them as they did squash. Indoor plumbing was equally unfamiliar as there was no community education on how to protect one’s well water or maintain and repair wells, plumbing and septic systems.
Inequity could arguably be considered a fifth criteria for recognizing an environmental exposure as a priority public health issue. Well owners nationwide lack the regulatory oversight that safeguards public health via enforcement of standards for municipal water quality. Uranium is an especially insidious well water contaminant as it cannot be detected by taste, smell or discoloration. In absence of any governmental regulation of or environmental health community education on well water quality, community members frequently stated, “Oh my well water tastes fine, it doesn’t need to be tested”. In Bighorn County, residents of the two most populous communities are provided with municipal water from surface water sources with lower average concentrations of uranium, as noted above. Hence local well owners are at higher risk of uranium exposure through their drinking water than residents of towns which use surface water sources for their supply.
Unsafe well water and the limited financial resources of most families also interact to increase exposures to contaminants. As noted above, some families cook with water which tastes so unpleasant they aren’t drinking it, as they can neither afford to install and maintain water treatment technology, nor purchase and haul sufficient bottled water for both drinking and cooking [89].

4.4. Future Research, Community Education and Risk Mitigation

The Crow Environmental Health Steering Committee and project staff continue to work on assessment, communication and mitigation of health risks from contaminated well water. A new EPA grant includes limited funding for additional home well water testing—free to community members. The project team has also applied for National Institutes of Health (NIH) funding to be able to offer free health screenings for adults with a history of consuming contaminated well water.
Mitigating contaminated well water is a complex challenge for which the CEHSC is seeking solutions. It will require additional resources to expand the project’s free well water testing, as well as increased community awareness of the risks, greater understanding of how to protect and maintain wells, plumbing and septic systems, and more affordable alternatives for homeowners with bad well water. Mitigating home well water with unsafe levels of inorganic contaminants such as uranium is challenging, as nearly all these wells have such hard water that both a water softener and a reverse osmosis unit would be required. Even if a grant for installing all this treatment equipment could be obtained, many families could not afford the monthly costs of chemicals and regular filter replacements.
A new collaboration led by a Crow Tribal member on MSU’s faculty, has been funded and is planning an environmental health literacy campaign with fourth graders, focused on surface and groundwater stewardship, and well and septic system care.
The project team is also working to understand how climate change impacts on water resources could affect health risks from waterborne contaminants [90]. Funding is being sought for additional home well water testing, including measurements of well depth, to allow for better spatial analysis of contaminant distributions and relationships to land uses, using a geographic information system (GIS). The CEHSC, including academic partners, continues to explore ways to improve community health by reducing exposures to waterborne contaminants, increasing access to safe drinking water and promoting environmental health literacy.

4.5. Conclusions

In conclusion, for families on the Crow Reservation who rely on home wells, exposure to uranium and potentially other waterborne contaminants may both contribute to and be exacerbated by existing health disparities. Limited financial resources restrict families’ options for either treating well water or purchasing and hauling sufficient safe water for consumption. Conducting such research and education as a true partnership between community and academic researchers will help to ensure that the science is sound, the community is increasingly empowered to address environmental health disparities, and that the work is effective in reducing health risks. In a state where home well water has not historically been tested for uranium and 88% of counties are at Level 1 risk for radon in homes, many rural and impoverished Montana families may be similarly at risk. Additional risk assessment research, risk communication and risk mitigation measures are warranted to ensure families have access to safe drinking water. Limited or lack of access to safe drinking water for these families likely contributes to existing health disparities and is a priority public health issue.

Acknowledgments

Current members of the Crow Environmental Health Steering Committee (CEHSC) are: John Doyle, Myra Lefthand, Sara Young, Ada Bends, Brandon Good Luck, Alma Knows His Gun McCormick and Robin Stewart. All are Crow Tribal members. They represent the Apsaalooke (Crow) Water and Wastewater Authority, Little Big Horn College (the local Tribal College), the Crow Tribal government, the Crow/Northern Cheyenne Indian Health Service Hospital, the Bureau of Indian Affairs, the local non-profit Messengers for Health, the Crow Legislature and education.
Funders: Center for Native Health Partnerships’ Grant #P20MD002317 from National Institute of Minority Health & Health Disparities; NIH Grant #P20 RR-16455-04 from the Infrastructure Network of Biomedical Research Excellence (INBRE) Program of National Institute of General Medical Science National Institutes of Health; Award #RD83370601-0 from the National Center for Environmental Research, Environmental Protection Agency; EPA STAR Fellowship Research Assistance Agreement #FP91674401. Alfred P. Sloan Graduate Scholarship Programs—Minority PhD Component/Sloan Indigenous Graduate Partnership; Montana State University—Dennis and Phyllis Washington Foundation Native American Graduate Fellow.
Note: The content is solely the responsibility of the authors; it has not been formally reviewed by any of the funders and does not necessarily represent the official views of the National Institutes of Health or of the Environmental Protection Agency. The EPA does not endorse any of the products mentioned.
Dr. Tim Ford, then Montana INBRE Principal Investigator and Microbiology Department Chair at Montana State University Bozeman (MSU), provided initial academic support from MSU and was instrumental in securing NIH and EPA funding for testing well water and conducting surveys. Advice on statistical analysis was provided by Dr. Al Parker (MSU). Dr. David Roberts (MSU) consulted on database management. Dr. Margaret Hiza (USGS; Crow) and Dr. Cliff Montagne (MSU) and their colleagues provided inspiring examples of community-based participatory research and were always available for consultation. Dr. David Yarlott, President of Little Big Horn College, has supported this project from its inception. This research would not have been possible without the contributions of previous CEHSC members and Project Coordinators Gail Whiteman, Crescentia Cummins and Tamra Old Coyote as well as more than a dozen student interns. We especially thank the more than 200 Crow community members who gave of their time and expertise as participants in this research project. Anonymous reviewers provided excellent suggestions for improving the article.

Author Contributions

Margaret Eggers: Has served as a non-voting CEHSC member since 2006, served as Project Leader including designing the research project in consultation with the CEHSC, local Project Coordinator and Dr. Camper, training local staff, overseeing fieldwork, preparing reports to homeowners, managing and analyzing the data, preparing GIS from project data and with the Project Coordinator communicating project results to community groups and local teachers; primary author on paper. Anita Moore-Nall: Researched federal and state data on local water quality; suggested project test wells for uranium; prepared GIS map incorporating federal, state and project data on well water quality; researched the area’s geology; wrote the geologic Study Area description for paper. John Doyle: Has served on the CEHSC since 2006; served as local Project Coordinator for the past two years, conducting home visits to explain well test results, discussing project results in community and with Tribal officers, and conducting outreach to local teachers and schoolchildren; contributes local expertise to research; as the Director of the Apsaalooke Water and Wastewater Authority, coordinates efforts between the CEHSC and the AWWA. Contributed to and reviewed drafts of the paper. Myra Lefthand: Has served on the CEHSC since 2006; reviewed and edited initial survey; contributed health education and cultural expertise to project; explained project results to community members; provided training for student interns, especially those conducting surveys; collaborates with the Executive Branch of the Crow Nation on water issues; reviewed drafts of the paper. Sara Young: Has served on the CEHSC since 2007; reviewed and edited the initial survey; recruited participants; coordinated this project with other related projects at MSU; reviewed drafts of the paper. Ada Bends: Has served on the CEHSC since 2008; as a Community Organizer for the Crow Reservation has recruited participants and organized community meetings for presentation of project results; contributed data from the 2010 health disparities survey she conducted; reviewed drafts of the paper. Anne Camper: Has participated in the CEHSC since 2008; oversaw research that provided testing for well and river water testing/survey collection; reviewed data analysis; contributed to the manuscript. CEHSC: All CEHSC co-authors and additional CEHSC members have guided and advised the project, contributed local environmental, health and cultural expertise, and co-presented on the research at conferences and workshops.

Conflicts of Interest

The authors declare no conflict of interest.

References and Notes

  1. DeLemos, J.L.; Burgge, D.; Cajero, M.; Downs, M.; Durant, J.L.; George, C.M.; Henio-Adeky, S.; Nez, T.; Manning, T.; Rock, T.; Seschillie, B.; Shuey, C.; Lewis, J. Development of risk maps to minimize uranium exposures in the Native Churchrock Mining District. Environ. Health 2009, 8, 29. [Google Scholar] [CrossRef] [PubMed]
  2. Arzuaga, X.; Rieth, S.H.; Bathija, A.; Cooper, G.S. Renal effects of exposure to natural and depleted uranium: A review of the epidemiologic and experimental data. J. Toxicol. Environ. Health B Crit. Rev. 2010, 13, 527–545. [Google Scholar] [CrossRef] [PubMed]
  3. Caldwell, R. Uranium and Other Radioactive Elements in Jefferson County Ground Water; U.S. Geological Survey: Helena, MT, USA, 2008. [Google Scholar]
  4. Kurttio, P.; Auvinen, A.; Salonen, L.; Saha, H.; Pekkanen, J.; Makelainen, I.; Vaisanen, S.B.; Penttila, I.M.; Komulainen, H. Renal Effects of Uranium in Drinking Water. Environ. Health Perspect. 2002, 110, 337–342. [Google Scholar] [CrossRef] [PubMed]
  5. Vermont Department of Health. Uranium. Available online: http://healthvermont.gov/enviro/rad/Uranium.aspx (accessed on 10 December 2014).
  6. Zamora, M.L.; Tracy, B.L.; Zielinski, J.M.; Meyerhof, D.P.; Moss, M.A. Chronic Ingestion of Uranium in Drinking Water: A Study of Kidney Bioeffects in Humans. Toxicol. Sci. 1998, 43, 68–77. [Google Scholar] [CrossRef] [PubMed]
  7. Selden, A.I.; Lundhom, C.; Edlund, B.; Hogdaul, C.; Ek, B-M.; Bergstrom, B.E.; Ohlson, C.-G. Nephrotoxicity of uranium in drinking water from private drilled wells. Environ. Res. 2009, 109, 486–494. [Google Scholar] [CrossRef] [PubMed]
  8. Mao, Y.; Desmeules, M.; Schaubel, D.; Berube, D.; Dyck, R.; Brule, D.; Thomas, B. Inorganic components of drinking water and microalbuminuria. Environ. Res. 1995, 71, 135–140. [Google Scholar] [CrossRef] [PubMed]
  9. Orloff, K.G.; Mistry, K.; Charp, P.; Metcalf, S.; Marino, R.; Shelly, T.; Melaro, E.; Donohoe, A.M.; Jones, R.L. Human exposure to uranium in groundwater. Environ. Res. 2004, 94, 319–326. [Google Scholar] [CrossRef] [PubMed]
  10. Moore-Nall, A. The legacy of uranium development on or near Indian reservations and health implications rekindling public awareness. Geosciences 2015, 5, 15–29. [Google Scholar] [CrossRef]
  11. DeSimone, L.A. Quality of Water from Domestic Wells in Principal Aquifers of the United States, 1991–2004; U.S. Geological Survey Scientific Investigations Report 2008-5227; U.S. Geological Survey: Reston, VA, USA, 2009. [Google Scholar]
  12. Montana Department of Public Health and Human Services. Big Horn County Health Profile. Available online: http://www.docstoc.com/docs/86526062/2006-Montana-County-Health-Profiles-Department-of-Public-Health (accessed on 3 December 2014).
  13. Cummins, C.; Doyle, J.T.; Kindness, L.; Lefthand, M.J.; Bear Don’t Walk, U.J.; Bends, A.; Broadaway, S.C.; Camper, A.K.; Fitch, R.; Ford, T.E.; et al. Community-Based Participatory Research in Indian Country: Improving Health Through Water Quality Research and Awareness. Fam. Community Health 2010, 33, 166–174. [Google Scholar] [CrossRef] [PubMed]
  14. Lefthand, M.J.; Eggers, M.J.; Old Coyote, T.J.; Doyle, J.T.; Kindness, L.; Bear Don’t Walk, U.J.; Young, S.L.; Bends, A.L.; Good Luck, B.; Stewart, R.; et al. Holistic community based risk assessment of exposure to contaminants via water sources. In Proceedings of the American Public Health Association Conference, San Francisco, CA, USA, 10 October 2012.
  15. U.S. Environmental Protection Agency. A Decade of Tribal Environmental Research: Results and Impacts from EPA’s Extramural Grants and Fellowship Programs. In Tribal Environmental Health Research Program; NCER, ORD, EPA: Washington, DC, USA, 2014. Available online: http://epa.gov/ncer/tribalresearch/news/results-impacts-010714.pdf (accessed on 12 February 2014). [Google Scholar]
  16. U.S. Census Bureau. DP-1-Geography-Big Horn County, Montana: Profile of General Population and Housing Characteristics: 2010. Available online: http://factfinder2.census.gov/ (accessed on 25 November 2013).
  17. U.S. Census Bureau. Montana locations by per capita income. Available online: http://en.wikipedia.org/wiki/Montana_locations_by_per_capita_income (accessed on 2 April 2014).
  18. Mark, D.; Byron, R. Bighorn Valley Health Center Program Narrative; Bighorn Valley Health Center (BVHC): Hardin, MT, USA, 2010; unpublished. [Google Scholar]
  19. United States Census. 2000. Available online: http://www.census.gov/main/www/cen2000.html (accessed on 11 January 2010).
  20. The Centers for Disease Control and Prevention (CDC), National Center for Health Statistics, Division of Vital Statistics, National Vital Statistics Report Volume 58, Number 19, May 2010, Table 29. Available online: http://www.cdc.gov/nchs/data/nvsr/nvsr58/nvsr58_19.pdf (accessed on 7 June 2010).
  21. Montana Department of Public Health and Human Services. 2004–2008 Statistics.
  22. Bends, A.L. Health Disparities on the Crow Reservation; Center for Native Health Partnerships, Montana State University: Bozeman, MT, USA, 2010; unpublished data. [Google Scholar]
  23. Montana Hospital Association. Age-adjusted rates calculated based on the primary diagnosis by the Montana Hospital Discharge Data System, based on data provided by the Montana Hospital Association, Population denominators: NCHS bridged race estimates of the resident population of Montana for 1 July 2000–1 July 2008 (Vintage 2008).
  24. National Vital Statistics System, Center for Disease Control and Prevention, U.S.: Death certificate Montana resident data from 2004–2008.
  25. Eggers, M.J.; Lefthand, M.J.; Young, S.L.; Doyle, J.T.; Plenty Hoops, A. When It Comes to Water, We Are All Close Neighbors. EPA Blog It All Starts With Science. Available online: http://blog.epa.gov/science/2013/06/when-it-comes-to-water-we-are-all-close-neighbors/ (accessed on 30 June 2013).
  26. National Uranium Resource Evaluation (NURE) Hydrogeochemical and Stream Sediment Reconnaissance (HSSR) Program’s data base for Montana and Wyoming. Available online: http://tin.er.usgs.gov/nure/water/ (accessed on 18 February 2013).
  27. Bureau of Land Management Montana State Office. Crow Indian Tribe: Geology and Minerals Resources Report; BLM: Billings, MT, USA, 2002; pp. 67–73. Available online: http://www.blm.gov/style/medialib/blm/mt/field_offices/miles_city/og_ eis/crow.Par.79832.File.dat/minerals.pdf (accessed on 10 December 2014).
  28. Perry, E.S. Montana in the Geological Past. Montana Bulletin 26; Montana Bureau of Mines and Geology: Montana Tech of the University of Montana, Butte, MT, USA, 1962. [Google Scholar]
  29. Mapel, W.J.; Roby, R.N.; Sarnecki, J.C.; Sokaski, M.; Bohor, B.F.; McIntyre, G. Status of Mineral Resource Information for the Crow Indian Reservation, Montana. Available online: https://www1.eere.energy.gov/tribalenergy/guide/pdfs/crow_7.pdf (accessed on 10 December 2014).
  30. Lopez, D.A. Geologic Map of the Bridger 30' × 60' Quadrangle, Montana: Montana Bureau of Mines and Geology Geologic Map 58, 2000, Scale 1:100,000; Montana Bureau of Mines and Geology: Montana Tech of the University of Montana, Butte, MT, USA, 2000. [Google Scholar]
  31. BLM. Crow Natural, Socio-Economic and Cultural Resources Assessment and Conditions Report, Hydrology; BLM: Billings, MT, USA, 2002; pp. 74–84. Available online: http://www.blm.gov/style/medialib/blm/mt/field_offices/miles_city/og_eis/crow.Par.48024.File.dat/hydrology.pdf (accessed on 10 December 2014).
  32. Stewart, J.C. Geology of the Dryhead-Garvin Basin, Bighorn and Carbon Counties, Montana: Map G-2; Montana Bureau of Mines and Geology Special Publication 17; Montana Bureau of Mines and Geology: Montana Tech of the University of Montana, Butte, MT, USA, 1958. [Google Scholar]
  33. Warchola, R.J.; Stockton, T.J. National Uranium Resource Evaluation, Billings Quadrangle, Montana. PGJ/F-015(82); Morris & Warchola, Inc., Bendix Field Engineering Corporation, U.S. Department of Energy: Grand Junction, CO, USA, 1982. [Google Scholar]
  34. Patterson, C.G.; Toth, M.I.; Kulik, D.M.; Esparza, L.E.; Schmauch, S.W.; Benham, J.R. Mineral Resources of the Pryor Mountain, Burnt Timber Canyon, and Big Horn Tack-On Wilderness Study Areas, Carbon County, Montana and Big Horn County, Wyoming; U.S. Geological Survey Bulletin 1723; U.S. Geological Survey: Denver, CO, USA, 1988; pp. 1–15. [Google Scholar]
  35. Van Gosen, B.S.; Wilson, A.B.; Hammarstrom, J.M. Mineral Resource Assessment of the Custer National Forest in the Pryor Mountains, Carbon County, South-Central Montana; U.S. Geological Survey Open-File Report 96-256; U.S. Geological Survey: Denver, CO, USA, 1996. [Google Scholar]
  36. Blackstone, D.L., Jr. Preliminary Geologic Map of the Red Pryor Mountain 7.5’ Quadrangle, Carbon County, Montana: Montana Bureau of Mines and Geology Open File Report 68, 1:24,000; Montana Bureau of Mines and Geology: Montana Tech of the University of Montana, Butte, MT, USA, 1974. [Google Scholar]
  37. Klauk, E. Impacts of Resource Development on Native American Lands, Geology and Physiography of the Crow Reservation. Available online: http://serc.carleton.edu/research_education/nativelands/crow/geology.html (accessed on 10 December 2014).
  38. Richards, P.W. Geology of the Bighorn Canyon-Hardin Area, Montana and Wyoming; U.S. Geological Survey Bulletin 1026; U.S. Geological Survey: Helena, MT, USA, 1955; pp. 1–93. Available online: http://pubs.er.usgs.gov/publication/b1026 (accessed on 10 December 2014).
  39. Hauptman, C.M. Uranium in the Pryor Mountain area of southern Montana and northern Wyoming. Uranium Mod. Min. 1956, 3, 14–21. [Google Scholar]
  40. Florentine, C.; Krause, T.; Eggers, M.J. Biogeochemical Cycling of Uranium. In Presented at Montana State University, Bozeman, MT, USA, April 2013.
  41. U.S. Environmental Protection Agency. Radiation Protection: Decay Chains: Uranium-238 Decay Chain. Available online: http://www.epa.gov/radiation/understand/chain.html#u_decay (accessed on 3 August 2013).
  42. World Health Organization. Uranium in drinking water: Background document for development of WHO Guidelines for drinking-water quality. Available online: http://www.who.int/water_sanitation_health/dwq/chemicals/en/uranium.pdf (accessed on 25 September 2012).
  43. Wrenn, M.E.; Durbin, P.W.; Lipsztein, H.B.; Rundo, J.; Still, E.T.; Willis, D.L. Metabolism of ingested U and Ra. Health Phys. 1985, 48, 601–633. [Google Scholar] [CrossRef] [PubMed]
  44. U.S. Environmental Protection Agency. Uranium. Available online: http://www.epa.gov/radiation/radionauclides/uranium.html (accessed on 25 September 2012).
  45. Brugge, D.; de Lemos, J.L.; Oldmixon, B. Exposure pathways and health effects associated with chemical and radiological toxicity of natural uranium: A review. Rev. Environ. Health 2005, 20, 177–193. [Google Scholar] [CrossRef] [PubMed]
  46. Brugge, D.; Buchner, V. Health effects of uranium: New research findings. Rev. Environ. Health 2011, 26, 231–249. [Google Scholar] [PubMed]
  47. Georgia Department of Human Resources. Radium and Uranium in Public Drinking Water Systems. Available online: http://www.gaepd.org/Documents/radwater.html (accessed on 2 August 2013).
  48. Montana Department of Environmental Quality (MTDEQ). Uranium in Drinking Water. Available online: http://deq.mt.gov/wqinfo/swp/Guidance.mcpx (accessed on 6 August 2013).
  49. Montana State University Well Educated Program. Well Educated Parameter List. Available online: http://waterquality.montana.edu/docs/WELL_EDUCATED/ParameterPackageList2014.pdf (accessed on 23 December 2014).
  50. Caldwell, R. Technical Announcement. USGS Samples for Radioactive Constituents in Groundwater of Southwestern Montana. Available online: http://mt.water.usgs.gov/ (accessed on 7 August 2013).
  51. Minkler, M.; Wallerstein, N. Community-Based Participatory Research for Health; Jossey-Bass: San Francisco, CA, USA, 2008. [Google Scholar]
  52. Collman, G.W. Community-based approaches to environmental health research around the globe. Rev. Environ. Health 2014, 29, 125–128. [Google Scholar] [CrossRef] [PubMed]
  53. Riederer, A.M.; Thompson, K.M.; Fuentes, J.M.; Ford, T.E. Body weight and water ingestion estimates for women in two communities in the Philippines: The importance of collecting site-specific data. Int. J. Hyg. Environ. Health 2006, 209, 69–80. [Google Scholar] [CrossRef] [PubMed]
  54. Butterfield, P.G.; Hill, W.; Postma, J.; Butterfield, P.W.; Odom-Maryon, T. Effectiveness of a household environmental health intervention delivered by rural public health nurses. Am. J. Public Health 2011, 101, S262–S270. [Google Scholar] [CrossRef] [PubMed]
  55. Creed, J.T.; Brockhoff, C.A.; Martin, T.D. Method 200.8. Determination of Trace Elements in Waters and Wastes by Inductively Coupled Plasma-Mass Spectrometry, Revision 5.4., EMCC Version; U.S. Environmental Protection Agency: Cincinnati, OH, USA. Available online: http://water.epa.gov/scitech/methods/cwa/bioindicators/upload/2007_07_10_methods_method_200_8.pdf (accessed on 5 March 2015).
  56. Energy Laboratories. Certifications/quality control. Available online: http://www.energylab.com/why-us/certifications-quality-control/ (accessed on 5 March 2015).
  57. Montana Bureau of Mines and Geology’s Ground Water Information Center. Available online: http://mbmggwic.mtech.edu/ (accessed on 4 February 2013).
  58. Montana Natural Resources Information System. Available online: http://nris.mt.gov (accessed on 4 February 2013).
  59. Natural Resource Conservation Service’s Data Gateway. Available online: http://datagateway.nrcs.usda.gov/ (accessed on 4 February 2013).
  60. University of Wyoming’s Water Resources Data System. Available online: http://www.wrds.uwyo.edu/ (accessed on 4 February 2013).
  61. Wyoming Geographic Information Center. Available online: http://wygl.wygisc.org/wygeolib (accessed on 4 February 2013).
  62. USGS. Water Quality Data for Wyoming. Available online: http://waterdata.usgs.gov/wy/nwis/qw (accessed on 4 February 2013).
  63. Little Big Horn College Library. Map of the Crow Reservation. Available online: http://lib.lbhc.edu (accessed on 2 August 2013).
  64. U.S. Environmental Protection Agency. Regulating Public Water Systems and Contaminants under the Safe Drinking Water Act. What are the drinking water standards? Available online: http://water.epa.gov/lawsregs/rulesregs/regulatingcontaminants/basicinformation.cfm#What%20are%20drinking%20water%20standards? (accessed on 5 March 2015).
  65. Health Canada. Water talk—Uranium in drinking water. Available online: http://www.hc-sc.gc.ca/ewh-semt/pubs/water-eau/uranium-eng.php/ (accessed on 25 September 2012).
  66. Arnold, C. Once upon a mine: The legacy of uranium on the Navajo Nation. Environ. Health Perspect. 2014, 122, A44–A49. [Google Scholar] [CrossRef] [PubMed]
  67. Eggers, M.J. Community Based Risk Assessment of Exposure to Waterborne Contaminants on the Crow Reservation, Montana. Ph.D. Thesis, Montana State University, Bozeman, MT, USA, May 2014. [Google Scholar]
  68. Szabo, Z. Geochemistry as a critical factor in defining radionuclide occurrence in water from principal drinking-water aquifers of the United States. In Proceedings of the 5th International Conference on Medical Geology, Arlington, VA, USA, 27 August 2013.
  69. Farrell, J.; Bostick, W.D.; Jarabek, R.J.; Fiedor, J.N. Uranium removal from ground water using zero valent iron media. Groundwater 1999, 37, 618–624. [Google Scholar] [CrossRef]
  70. Schiller, R.; Radon Program Contact, U.S. Environmental Protection Agency, Region 8, Denver, CO, USA. Personal communication, 2013.
  71. Moore-Nall, A.; Eggers, M.J.; Camper, A.K.; Lageson, D. Elevated Uranium and Lead in Wells on the Crow Reservation, Big Horn County—A Potential Problem. In Presented at the Earth Science Colloquium, Bozeman, MT, USA, 12–13 April 2013.
  72. Schnug, E.; Lottermoser, B.G. Fertilizer-deirved uranium and its threat to human health. Environ. Sci. Technol. 2013, 47, 2433–2434. [Google Scholar] [CrossRef] [PubMed]
  73. Schnug, E. Uran in Phosphor-Dungemitteln und dessen Verbleib in der Umwelt. Strahlentelex 2012, 26, 3–10. (In German) [Google Scholar]
  74. Montana Department of Revenue. 2013 Agricultural Land Classification and fallow adjustment zones. Available online: https://revenue.mt.gov/Portals/9/committees/Ag_LandValuation/map_summer_fallow_adj_zones.jpg (accessed on 6 March 2015).
  75. Tuck, L. Ground-Water Resources along the Little Bighorn River, Crow Indian Reservation, Montana; Water-Resources Investigations Report 03-4052; U.S. Department of the Interior and the U.S. Geological Survey: Helena, MT, USA, 2003. [Google Scholar]
  76. Pelizza, M. Uranium and uranium progeny in groundwater associated with uranium ore bearing formations. In Proceedings of the 5th International Conference on Medical Geology, Arlington, VA, USA, 27 August 2013.
  77. U.S. Environmental Protection Agency. Montana—EPA Map of Radon Zones. Available online: http://www.epa.gov/radon/pdfs/statemaps/montana.pdf (accessed on 6 August 2013).
  78. U.S. Environmental Protection Agency. Radiation Protection: Radon. Available online: http://www.epa.gov/radiation/radionuclides/radon.html (accessed on 6 August 2013).
  79. Montana Department of Environmental Quality. Big Horn County Radon Information. Available online: http://county-radon.info/MT/Big_Horn.html (accessed on 6 August 2013).
  80. Richards, C.; Broadaway, S.; Eggers, M.J.; Doyle, J.T.; Pyle, B.H.; Camper, A.K.; Ford, T.E. Detection of Pathogenic and Non-pathogenic Bacteria in Drinking Water and Associated Biofilms on the Crow Reservation, Montana, USA. Microb. Ecol. 2015. accepted for publication. [Google Scholar]
  81. Hamner, S.; Broadaway, S.C.; Berg, E.; Stettner, S.; Pyle, B.H.; Big Man, N.; Old Elk, J.; Eggers, M.J.; Doyle, J.; Kindness, L.; et al. Detection and source tracking of Escherichia coli, harboring intimin and Shiga toxin genes, isolated from the Little Bighorn River, Montana. Int. J. Environ. Health Res. 2014, 24, 341–362. [Google Scholar]
  82. Sexton, K.; Hattis, D. Assessing cumulative health risks from exposure to environmental mixtures—Three fundamental questions. Environ. Health Perspect. 2007, 115, 825–832. [Google Scholar] [CrossRef] [PubMed]
  83. Agency for Toxic Substances and Disease Registry, U.S. Department of Health and Human Services. Toxicological Profile for Uranium; ATSDR: Atlanta, GA, USA, 2013. [Google Scholar]
  84. Young, T.K. Diabetes mellitus among Native Americans in Canada and the United States: An epidemiological review. Am. J. Hum. Biol. 1993, 5, 399–413. [Google Scholar] [CrossRef]
  85. Sullivan, P.W.; Wyatt, H.R.; Morrato, E.H.; Hill, J.O.; Ghushchyan, V. Obesity, inactivity, and the prevalence of diabetes and diabetes-related cardiovascular comorbidities in the U.S., 2000–2002. Diabetes Care. 2005, 8, 1599–1603. [Google Scholar] [CrossRef]
  86. Tsaih, S.-W.; Korrick, S.; Schwartz, J.; Amarasiriwardena, C.; Aro, A.; Sparrow, D.; Hu, H. Lead, Diabetes, Hypertension, and Renal Function: The Normative Aging Study. Environ. Health Perspect. 2004, 112, 1178–1182. [Google Scholar] [CrossRef] [PubMed]
  87. Agency for Toxic Substances and Disease Registry, U.S. Department of Health and Human Services. Toxicological Profile for Lead; ATSDR: Atlanta, GA, USA, 2007. [Google Scholar]
  88. Balazs, C.L.; Ray, I. The drinking water disparities framework: On the origins and persistence of inequities in exposure. Am. J. Public Health 2014, 104, 603–611. [Google Scholar] [CrossRef] [PubMed]
  89. Lefthand, M.J.; Eggers, M.J.; Crow Environmental Health Steering Committee; Camper, A.K. Community-Based Cumulative Risk Assessment of Well Water Contamination: A Tribal Environmental Health Disparity. In Presented at the NIH Native American Research Centers for Health’s Tribal Environmental Health Summit, Pablo, MT, USA, 24 June 2014.
  90. Doyle, J.T.; Redsteer, M.H.; Eggers, M.J. Exploring effects of climate change on Northern Plains American Indian health. Clim. Chang. 2013, 120, 643–655. [Google Scholar] [CrossRef]

