Article

Evaluation of VIIRS Land Surface Temperature Using CREST-SAFE Air, Snow Surface, and Soil Temperature Data

1
National Oceanic and Atmospheric Administration-Cooperative Remote Sensing Science and Technology (NOAA-CREST) Center, The City College of New York, New York, NY 10031, USA
2
NOAA-Satellite Applications and Research (STAR), 5830 University Research Court, College Park, MD 20740, USA
*
Author to whom correspondence should be addressed.
Geosciences 2015, 5(4), 334-360; https://doi.org/10.3390/geosciences5040334
Submission received: 21 August 2015 / Revised: 27 November 2015 / Accepted: 10 December 2015 / Published: 15 December 2015
(This article belongs to the Special Issue Advances in Remote Sensing and GIS for Geomorphological Mapping)

Abstract

:
In this study, the Visible Infrared Imager Radiometer Suite (VIIRS) Land Surface Temperature (LST) Environmental Data Record (EDR) was evaluated against snow surface (T-skin) and near-surface air temperature (T-air) ground observations recorded at the Cooperative Remote Sensing Science and Technology Center—Snow Analysis and Field Experiment (CREST-SAFE), located in Caribou, ME, USA during the winters of 2013 and 2014. The satellite LST corroboration of snow-covered areas is imperative because high-latitude regions are often physically inaccessible and there is a need to complement the data from the existing meteorological station networks. T-skin is not a standard meteorological parameter commonly observed at synoptic stations. Common practice is to measure surface infrared emission from the land surface at research stations across the world that allow for estimating ground-observed LST. Accurate T-skin observations are critical for estimating latent and sensible heat fluxes over snow-covered areas because the incoming and outgoing radiation fluxes from the snow mass and T-air make the snow surface temperature different from the average snowpack temperature. Precise characterization of the LST using satellite observations is an important issue because several climate and hydrological models use T-skin as input. Results indicate that T-air correlates better than T-skin with VIIRS LST data and that the accuracy of nighttime LST retrievals is considerably better than that of daytime. Based on these results, empirical relationships to estimate T-air and T-skin for clear-sky conditions from remotely-sensed (RS) LST were derived. Additionally, an empirical formula to correct cloud-contaminated RS LST was developed.

Graphical Abstract

1. Introduction

Snow is a key component of the Earth’s energy balance, climate, environment, and a major source of freshwater in many regions [1,2]. Seasonal and perennial snow cover affect up to 50% of the Northern Hemisphere landmass, which accounts for vast regions of the Earth that influence climate, culture, and commerce in significant ways [3,4]. More importantly, snow cover plays a critical role in regional to global scale hydrological modeling because rain-on-snow with warm air temperatures (T-air) accelerates rapid snow-melt, which is responsible for the majority of the spring floods that damage property and affect human lives [5]. Furthermore, the snow cover surface temperature is critical in estimating latent and sensible heat fluxes over snow covered areas because incoming and outgoing radiation fluxes from the snow mass and T-air make the snow surface temperature (T-skin) different from the average snowpack temperature [6]. Consequently, several climate and hydrological models use T-skin as input. Hence, adequate knowledge of the snow surface and snowpack temperatures can lead to better water resources management.
Land Surface Temperature (LST) is a key parameter for hydrological, meteorological, climatological and environmental studies because it combines the results of all surface–atmosphere interactions and energy fluxes between the atmosphere and the surface [7]. Knowledge of the LST provides information on the temporal and spatial variations of the surface equilibrium state [8]. However, given the complexity of surface temperature over land, in situ ground measurements cannot practically provide values over wide areas. Currently, satellite remote sensing (RS) is generally the adopted method for LST retrievals over large areas with minimal aid from very few ground stations that retrieve it implicitly through surface infrared emission [9].
Although the need for monitoring snow temperatures is commonly known, the lack of ground measurements does not allow for these tasks. Unfortunately, ground stations in Arctic and sub-Arctic regions are scattered, poorly distributed geographically, and mostly located along coastal areas unreachable by road [10]. As a result, scientists and researchers are often obliged to compare RS LST with T-air because the latter resembles bare land surface temperature [11]. Normally, LST satellite readings are compared accurately to T-air because algorithms have been developed assuming LST as a reasonable estimate of the near-surface air temperature [12,13,14]. However, this perception might not be valid for high-latitude regions covered in snow. Hence, it would be unsafe to predict/forecast the occurrence of avalanches or spring floods when the snow is melting if the RS LST deviates largely from the actual snow surface temperature. While the idea of complementing data from ground stations over snow-covered regions with satellite RS data is certainly practical and appealing, remotely-sensed LST readings need to be cross-checked with in situ observations.
The Visible Infrared Imager Radiometer Suite (VIIRS) is a scanning radiometer onboard the Suomi National Polar-Orbiting Partnership (S-NPP) satellite that collects visible and infrared imagery and radiometric measurements of the land, atmosphere, cryosphere, and oceans. The VIIRS LST product provides radiometric LST values over land and larger inland waters in swath format. Two methods are commonly applied to validate the LST products generated from remote sensing data: the temperature-based method (T-based) and the radiance-based method (R-based). The T-based method involves direct comparison with ground measurements performed at the thermally-homogenous sites concurrent with the satellite overpass. The R-based method does not require ground-measured LST values but does require atmospheric temperature and water vapor profiles and the surface emissivity over the validation site at the time of satellite overpass [7]. This investigation was driven by the few existing studies in snow-covered regions using the T-based method to validate the relationship between in situ T-skin and NOAA’s (National Oceanic and Atmospheric Administration) VIIRS LST products. Most studies have estimated RS LST accuracy over snow free land by comparing it with T-air because of its high resemblance to bare land surface temperature and the lack of snow surface temperature measurements at synoptic ground stations around the world [7,14]. More specifically, these studies have focused on using the T-based method at barren surface sites where LST validation activities have been relatively rare. This study aims to check whether RS LST fares better with T-skin (rather than T-air) whenever snow cover is present using temperature observations from CREST-SAFE. Additionally, it will provide knowledge of the temperature difference between T-air and T-skin with respect to cloudiness and wind speed throughout the winter.
CREST-SAFE has a distinct advantage over other weather synoptic stations because it provides in situ T-skin and soil surface temperature (T-soil) observations in addition to in situ T-air at a 2 m height (commonly provided by most weather stations). Much like LST, snow surface temperature is not a standard meteorological parameter typically observed at synoptic stations. An infrared radiometer directed at the snow surface is used at CREST-SAFE for this purpose. Soil temperature is another parameter not commonly measured at these ground stations. Rigid sheath thermocouples are used to measure the soil temperature at different depths at CREST-SAFE. Additionally, the near-surface air temperature is observed at a 2 m height using a temperature/relative humidity probe at the field experiment station.
In this study, RS VIIRS Environmental Data Record (EDR) LSTs were compared with in situ T-air and T-skin data from the CREST-SAFE station for two winter cycles (2013 and 2014). Reasons for discrepancy or agreement between in situ observations and RS readings will be explained studying the daily time series as well as the diurnal cycle for specific days. Empirical relationships that relate T-air and T-skin with VIIRS LST under clear-sky conditions were derived and presented. An empirical relationship to correct LST for cloud contamination was developed as well.

2. Data

2.1. VIIRS Instrument Onboard S-NPP Satellite

The VIIRS instrument on board the S-NPP spacecraft was launched in October 2011. VIIRS is a cross-track scanning radiometer sensor that measures reflected and emitted radiation from the Earth-atmosphere system in 22 spectral bands, spanning from 412 nm to 12,050 nm. It has a wide swath (~3000 km) that allows it to fully sample the Earth every day [15,16].
VIIRS provides a majority of NOAA CLASS’s (Comprehensive Large Data Array Stewardship System) EDRs. The VIIRS LST EDR provides the skin temperature of the uppermost layer of the land surface (and larger inland waters) in swath format [17]. The VIIRS LST product was acquired over the evaluation site (CREST-SAFE) with its corresponding moderate-band terrain-corrected geolocation Sensor Data Records (SDR) (GMTCO) at 750 m resolution.
The VIIRS LST data for this study was retrieved by the Split Window (SW) algorithm which applies data from the VIIRS M15 and M16 bands centered at wavelengths of 10.8 μm and 12.0 μm, respectively [18]. The algorithm is described as follows:
LSTi = c0(i) + c1(i)T11 + c2(i)(T11 − T12) + c3(i)(sec θ – 1) + c4(i)(T11 − T12)2
where i is the index of 17 International Geosphere-Biosphere Program (IGBP) surface types; cj(i) are the algorithm regression coefficients in which j represents the term’s sequential position in the equation; T11 and T12 are the brightness temperatures of M15 and M16 VIIRS bands, respectively; θ is the satellite zenith angle.
The VIIRS LST daytime and nighttime pixels with the closest proximity to CREST-SAFE’s location at Caribou, Maine (46°52'59"N, 68°01'07"W) were extracted from these files. Additionally, the satellite overpass time, sensor view zenith angle, and VIIRS Quality Flag (QF) were also extracted. According to the QF information, only high/good quality data of the VIIRS LST product were used for evaluation. Then, the VIIRS LSTs were matched with the ground-measured temperatures according to the satellite observation time. The satellite observation time was derived by linearly interpolating the start and end times of the VIIRS product swath. Suomi NPP ascends (descends) over Caribou around 1:00–3:00 a.m. (1:00–3:00 p.m.) LT.
The LST data are recorded twice (daytime and nighttime views) daily and downloadable as HDF5 files. VIIRS LST data were compared with the ground-observed (CREST-SAFE) T-air, T-soil, and T-skin. The specific (five in 2013 and four in 2014) cases when the RS minus in situ absolute differences were larger than 10 °C were treated as outliers and excluded from the analysis. These nine cases happened in the month of April for both years, when T-air rises considerably and the depth of the snowpack is commonly between 2–5 cm; leading to possible errors in T-skin readings because the snow surface is quite close to the soil surface and further from the 2 m height at which T-air is observed. These nine cases happened in the month of April for both years, when T-air rose considerably (up to 20 ºC), and the depth of the snowpack was commonly between 2–5 cm. However, the CREST-SAFE time series (Section 3.1) for both years show that April temperatures never rose to 20 ºC on a regular basis. This lead to considering the nine observations as possible erroneous measurements by the instrument (discussed in Section 2.2). Furthermore, chances are that the target circle observed by the instrument (see Section 2.2) measuring T-skin was a combination of snowless soil and snow-covered soil due to snow melting after mid-April. Uncharacteristically high T-air will make the RS minus in situ absolute difference unreasonably high, whilst a combination of snow-covered and snowless soil will yield erroneous T-skin measurements that can impact the RS minus in situ absolute difference. Nonetheless, it should also be mentioned that these large absolute differences can be attributed to emissivity biases due to the impacts on VIIRS LST by the changes in the radiative transfer properties of the surface when the snow is melting, since in April the snowpack can have a wet snow layer at the surface during daytime that changes the emissivity of the snow surface, thus, affecting the thermal infrared (TIR) Brightness Temperature (TB) which is used to retrieve VIIRS LST, although the VIIRS M15 and M16 bands centered at 10.8 μm and 12.0 μm should minimize the effects of water bands [19,20].
Additionally, all valid points were also examined manually to exclude cloud contaminated pixels with unreasonably low LST values. The lengths of the time series used for the VIIRS LST and CREST-SAFE temperature matches were from 1 January to 30 April for the year 2013 and from 22 February to 30 April for 2014.

2.2. CREST-SAFE

CREST-SAFE is a ground station located within the premises (Figure 1) of the National Weather Service (NWS) office in Caribou, ME, USA (46°52'59"N, 68°01'07"W, 190 m elevation) that has been operational since January 2011. In this long term experiment, dual-polarized microwave (10, 19, 37, and 89 GHz) observations are accompanied by detailed synchronous meteorological observations. The objective of this field experiment/ground station is to improve the understanding of the effect of varying snow characteristics (i.e., grain size, density, temperature) under various meteorological conditions on snow microwave emission to improve snow cover properties’ retrievals from satellite observations [6].
Caribou has a humid continental climate that offers fitting conditions for snow studies. The cold season has an average daily high temperature below 0 °C and lasts from mid-December to early March. Snow cover commonly withstands from mid-November to early April. Regular seasonal snowfall is approximately 116 inches (2.9 m). The record snowfall is 197.8 inches (5.02 m) and it happened in the winter of 2007–2008.
An Apogee Infrared Radiometer Model SI-111 looking downward (0º) to clipped vegetation at a mounting height of approximately 2 m from the ground surface, with a spectral range of 8–14 µm and a field-of-view that is the half-angle of the apex of the cone formed by the target (cone base) and the infrared radiometer detector (cone apex), is used at CREST-SAFE to measure T-skin and soil surface temperature (during the snowless season). The half-angle for the SI-111 model is 22.0º, meaning that the diameter of the target circle is approximately 1.7 m. The target is a circle from which 98 percent of the radiation viewed by the infrared radiometer detector is emitted. The SI-111 calibration provides a measurement uncertainty of ± 0.2 ºC from −30 to +65 ºC when the sensor body temperature is within 20 ºC of the target. The process is automated at a 3 min sampling interval.
Figure 1. CREST-SAFE location.
Geosciences 05 00334 g001
The near-surface air temperature is measured directly at a 2 m height from the ground by a Vaisala HMT330 Temperature/Relative Humidity probe through an automated process; at a 3 min sampling interval to an accuracy of 0.2 °C.
Wind speed and direction is measured at approximately 2 m from the soil surface using an RM Young Heavy Duty Wind Monitor-HD-Alpine-Model 05108-45 with a wind speed range from 0–100 m/s and an azimuth of 360°. Wind speed accuracy is ± 0.3 m/s or 1% of reading and wind direction ± 3°. The process is automated at a 3-min sampling interval.
Sky cover (cloudiness) hourly data were obtained from the NWS website. These measurements were observed and collected by the Automated Surface Observing System (ASOS) station in the Caribou local airport close (90 m) to the NWS Caribou offices and CREST-SAFE (130 m). ASOS is an array of instruments for observing temperature, precipitation, wind, sky cover, visibility, and pressure. It was developed as a joint effort between the NWS, Federal Aviation Administration (FAA), and Department of Defense (DOD). ASOS serves as the USA’s primary surface observing system and takes meteorological readings every minute, 24 h a day at almost 1000 locations. ASOS employs a laser beam ceilometer to determine sky conditions. The system reports cloud layers up to an altitude of 12,000 feet. The ceilometer transmits approximately 9240 pulses skyward in 12 s. ASOS then assigns the returned signals, Cloud Base Hits (CHIs), to one of 252 50-foot interval bins. After the 12 s, ASOS produces a profile of the back-scattered signal to help determine if the returned signals were from cloud bases.
ASOS processes the sensor signals into 30 s samples of cloud “hits”. Each minute the algorithm processes 30 min of the 30 s data samples to create values for sky coverage (percentage) and cloud height for the observation. By processing 30 min of data, the observation becomes more representative of an area 3–5 miles around the sensor site.

3. Results and Discussion

3.1. Time Series and Multiple Linear Regression Analyses of CREST-SAFE Data

T-skin, T-soil, and T-air hourly data from the CREST-SAFE station were averaged daily for the two years (2013 and 2014) to study their behavior throughout the winter months (Figure 2). VIIRS LSTs (daytime and nighttime overpasses) were included in the figure as well. However, it should be noted that the T-skin and T-air values used in Section 3.2 for the in situ temperature vs. RS LST comparisons were not daily averages. Instead, these were collocated and matched temporally with the satellite overpass over Caribou. Additionally, average hourly cloudiness data acquired from the NWS website were averaged daily and included as a bar graph in the same figure.
Figure 2. Daily T-skin, T-soil, T-air (at 2 m from soil surface), cloudiness, and VIIRS LST (daytime and nighttime overpasses) for the winters of 2013 and 2014.
Geosciences 05 00334 g002
The analysis indicates that T-air is warmer than T-skin throughout all winter months. However, the magnitude of the T-air minus T-skin difference (T-diff) is in the order of 1–3 °C between the months of December and February and increases to 5–8 °C at the beginning of March. Both temperatures display the same trends (peaks and valleys) because T-air affects T-skin directly, even though the latter’s fluctuations are not as drastic [21]. The record shows that the winter of 2013 was the coldest of the two (hourly lows of −26 °C and −36 °C in late January for T-air and T-skin, respectively). Nevertheless, it cannot be ruled out that it is possible for T-air to be colder than T-skin at particular hours throughout a winter day (Section 3.3). T-soil does not fluctuate as radically (mainly remains around 0 °C) as T-skin and T-air throughout all winter months nor does it follow the same behavioral pattern. This makes sense since the soil surface is constantly covered by various snow layers isothermal at 0 °C, unlike the snow layers at the surface of the snowpack. The reason for all temperatures sharing the same behavior after mid-April in 2013 is due to the fact that a very thin snow layer (approximately 1 cm) remained and the Apogee Infrared Radiometer might have been reading the thermal energy produced by the soil directly instead of the snow surface’s thermal energy. However, for winter 2014, the snowpack depth was still 10cm in mid-April and remained until 22 April 2014. The highest accumulated daily snowpack depths were 25 cm and 45 cm for 2013 (late February) and 2014 (mid-March), respectively. VIIRS LST readings deviate significantly from T-skin, T-soil, and T-air daily averages. Particularly for the nighttime overpasses, corroborating the importance of temporal matching.
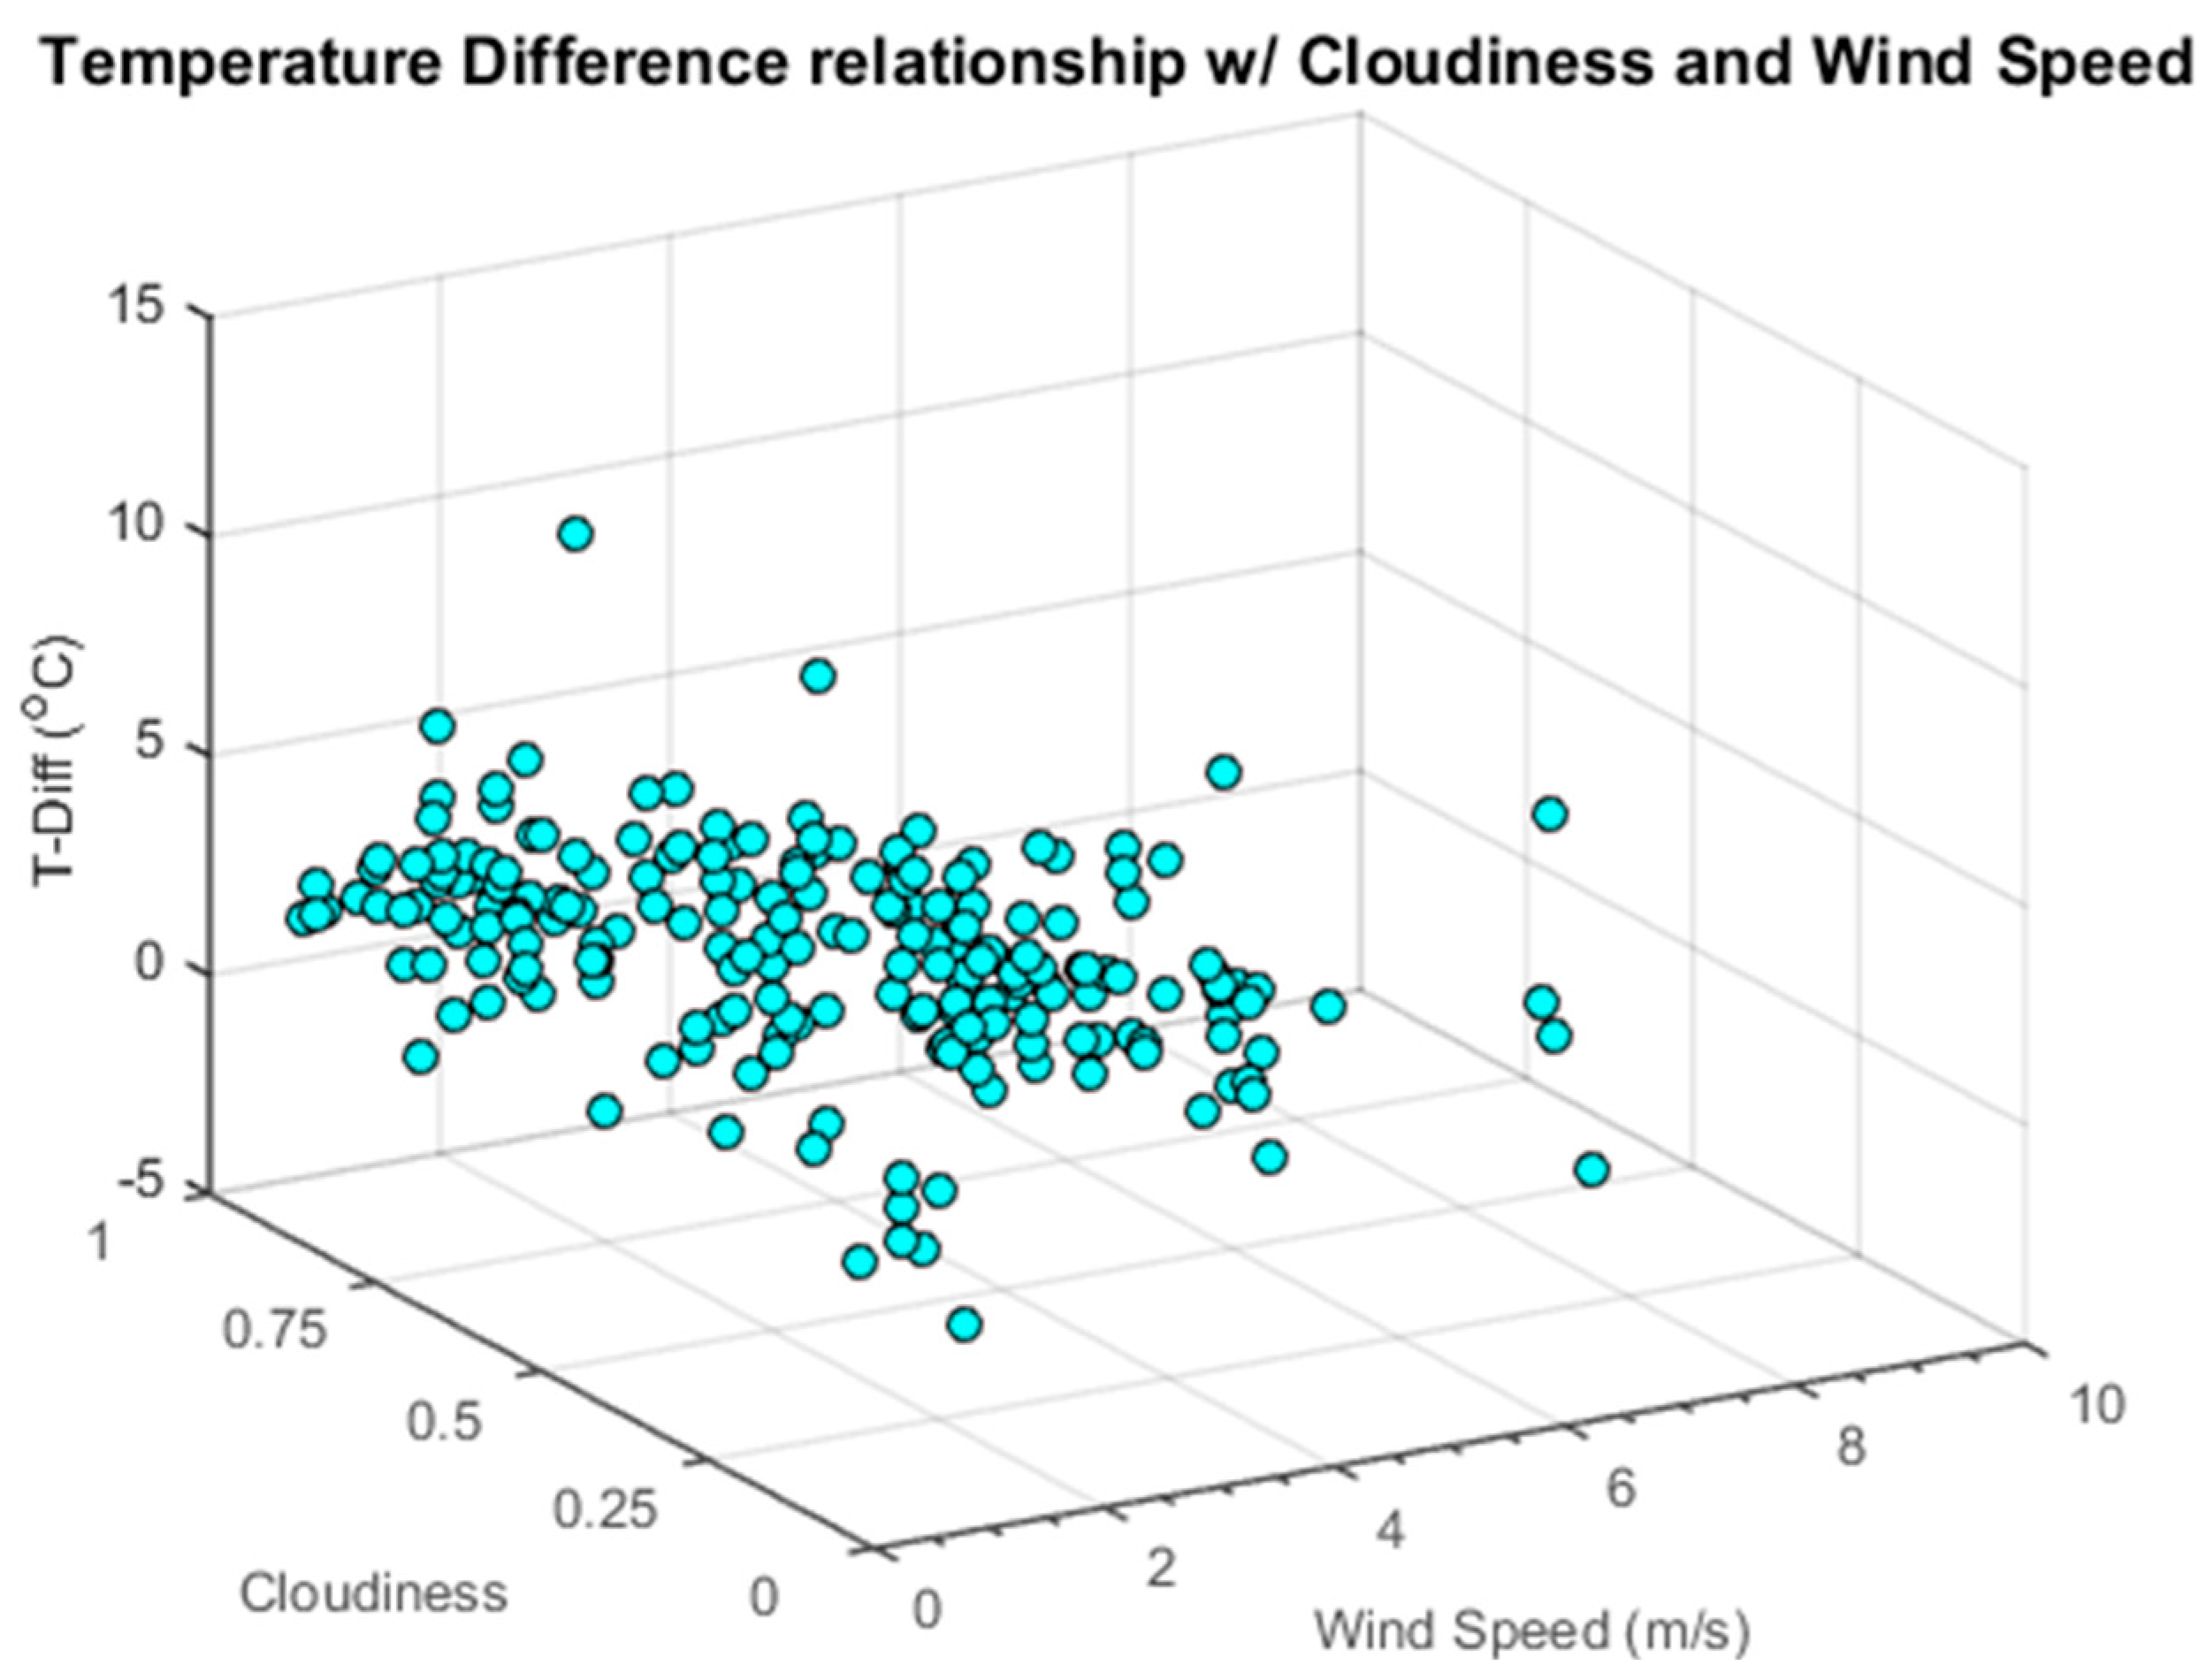
Figure 3 illustrates the relationship between cloud cover, wind speed, and T-diff with a 3D scatterplot. A multiple linear regression analysis with linear coefficients was performed using cloud cover and wind speed as independent variables (inputs) and T-diff as the dependent variable (output). The results are illustrated in Table 1 (coefficient estimate, Standard Error (SE) of the coefficient, t-value, and p-value). The coefficient estimates for cloudiness (−3.5653) and wind speed (−0.18729) show that both parameters affect T-diff inversely, and that cloudiness has more effect on T-diff. The coefficient estimate results indicate that a 10% (0.35653) change in sky cover will have close to twice the impact of a 1 m/s (0.18729) change in wind speed on T-diff. The fact that T-diff is lower when there are more clouds could indicate that T-skin is less heated by the radiative effect of the sun which, in turn, will make the snow surface temperature try to reach equilibrium with T-air directly (especially with the wind blowing), thus reducing T-diff. Furthermore, higher wind speeds will “renew” the snow surface by blowing away the snow layer at the top of the snowpack and replacing it with new snow whose temperature is closer to T-air. This phenomenon tends to make T-skin closer to T-air, decreasing T-diff as well. Lower SE values for wind speed (0.075) rather than cloudiness (0.34936) are indicative of the regression’s capability of estimating the former with much better accuracy. This also demonstrates the unpredictability of cloudiness when compared to wind speed. These uncertainties can perhaps be attributed to instrument errors due to the fact that the ASOS algorithm can misinterpret sky cover with false cloud “hits” by the backscattered signals since the ceilometer pulses are sent kilometers away skyward and will be affected by atmospheric effects, airplanes, and any living object flying over the instrument. P-values lower than 0.05 for cloudiness and wind speed indicate that there is a 95% probability that both have significant effect on T-diff. The P-values close to zero for cloudiness confirm that it affects T-diff more than wind speed, as was stated by the coefficient estimates. However, the p-value of 0.013 for wind speed indicates that wind speed does have an effect on T-diff, albeit not as drastic as the effect of sky cover. An RSME value of 1.70 °C shows that there is close to 20% error in the model’s T-diff estimation, since it varied commonly from 0–10 °C for 2013 and 2014 at CREST-SAFE. While an R2 linear correlation coefficient value of 0.37 indicates that the relationship between these three variables is non-linear and suggestive that other parameters (e.g., snowpack temperature) might be affecting T-diff as well.
Figure 3. Average daily cloudiness, wind speed and T-diff relationship at CREST-SAFE for winters 2013 and 2014.
Geosciences 05 00334 g003
Table 1. Cloudiness, wind speed, and T-diff multiple linear regression analyses results for CREST-SAFE data for the winter of 2013 and 2014.
Multiple Linear Regression Analysis Results
--CoefficientSEtStatpValue
Intercept5.69150.262721.6651.3889 × 10−54
Cloudiness−3.56530.34936−10.2055.5022 × 10−20
Wind Speed−0.187290.075131−2.49280.013477

3.2. Satellite RS LST vs. In Situ T-skin and T-air

CREST-SAFE in situ T-skin and T-air (abscissas) vs. VIIRS LST (ordinates) daytime and nighttime scatterplots (Figure 4) were created to obtain the R and R2 linear correlation coefficient values (Table 2) as well as the Mean Absolute Difference (MAD) and biases for both years.
Table 2. R2 correlation coefficient values between VIIRS LST, T-skin, and T-air at CREST-SAFE for winters 2013 and 2014 daytime and nighttime views.
T.2013 Daytime2013 Nighttime2014 Daytime2014 Nighttime
RR2MAD (°C)Bias (°C)RR2MAD (°C)Bias (°C)RR2MAD (°C)Bias (°C)RR2MAD (°C)Bias (°C)
Air0.710.516.6−5.760.870.766.6−6.660.800.646.4−6.110.950.907.1−7.07
Skin0.820.675.0−4.350.810.664.0−2.700.620.384.6−2.680.930.862.6−1.31
T.: Temperature.
R and R2 linear correlation coefficient values between VIIRS LST and in situ T-air daytime data vary from 0.71–0.80 and 0.51–0.64, respectively. R and R2 correlation values for daytime VIIRS LST and in situ T-skin range from 0.62–0.82 and 0.38–0.67. These correlation values drop drastically for T-soil and vary from 0.26–0.57 and 0.07–0.32. Nighttime R and R2 linear correlation coefficient values are generally higher for all temperatures (T-skin and T-air) with few exceptions. This is mostly because the atmospheric water vapor is less and LST behaves almost homogeneously at night. Therefore, the ground temperature measurements during nighttime are more representative of the LST at the satellite pixel scale than those during daytime [7]. For T-air, the correlation values fluctuate between 0.87–0.95 and 0.76–0.90, respectively. The correlations values range from 0.81–0.93 and 0.66–0.86 for T-skin. Results indicate that a higher correlation exists between T-air and the RS LST. VIIRS LST readings have a lower correlation with the T-skin values observed at CREST-SAFE. However, it should be noted that these values improved from one winter (2013) to the next (2014) for T-air and T-skin. This might be indicative of the continuous and ongoing improvements done to the VIIRS LST product. T-soil does not change much over time (remains around 0ºC), making it almost constant and naturally very different from RS LST, T-air, and T-skin. MAD daytime T-air values vary barely, ranging from 6.4–6.6 °C. Daytime MAD values for T-skin range from 4.6–5.0 °C. Nighttime MAD values for T-air and T-skin vary from 6.6–7.1 °C and 2.6–4.0 °C, respectively. VIIRS daytime biases vary from −6.11 °C to −5.76 °C and −4.35 °C to −2.68 °C for T-air and T-skin, respectively. Nighttime biases vary from −7.07 °C to −6.66 °C and −2.70 °C to −1.31 °C for T-air and T-skin, respectively. We can say that the evaluation results for nighttime are better than those during daytime, especially in terms of R and R2 values and, to some extent, MAD, and biases. The cold biases for all temperatures and satellite overpasses indicate that the VIIRS LST algorithm underestimates the LST for snow-covered surfaces.
Figure 4. CREST-SAFE in situ T-skin and T-air correlation with satellite VIIRS LST daytime and nighttime data for winters 2013 and 2014.
Geosciences 05 00334 g004
While simpler to explain why the RS vs. in situ correlations are higher during nighttime, the reason for discrepancies between T-air and T-skin are less trivial. Foremost, as it was previously stated in Section 3.1, cloud cover and wind speed play an important role in the behavioral patterns of T-air and T-skin. Generally, if there is no (or weak) advection and no clouds, T-diff is mostly driven by the radiative cooling of the land surface because the radiative heating by the sun is quite small compared to it. On the other hand, the presence of clouds provides a substantial downward thermal flux that heats the surface and, to a lesser extent, the air; therefore reducing T-diff [22,23]. This accounts partially for in situ T-skin having lower correlation values with VIIRS LST, because changes in T-skin happen at a slower pace (unlike bare soil) than they do for T-air.
Another remark is that the low correlation values between VIIRS LST and in situ T-skin can be attributed to the fact that VIIRS characterizes the brightness temperature of the vegetation (whose temperature is closer to T-air) that is abundant in the vicinity of the field experiment, as seen by a 750 m block around the site—not to be confused with the satellite swath—in Figure 5 (approximately 45% grassland, 35% residential homes, 15% paved roads, 5% forest cover). Satellite radiometry is applied to large areas (750 m in this study) which often consist of various land and vegetation types. A low spatial resolution will undoubtedly include some vegetation (forest cover) in the region and divert the RS LST from its true point value. Moreover, meteorological conditions for snow accumulation and melt on forest floors differ from those in clearings because of the influence of the canopy [24]. Additionally, snow becomes patchy while melting, giving a heterogeneous surface with large contrasts in characteristics such as albedo (i.e., reflectance, TB) [25]. Hence, the combination of above freezing temperatures during daytime with below freezing temperatures at night cause multiple freezing and melting events within the snowpack during the melting period (late winter). Daytime solar radiation causes snowmelt in the uppermost layer that produces higher water content in the superior layers of the snow pack. These events cause a large diurnal variation in the RS TB that is difficult to reproduce using satellite retrievals [26]. When comparing satellite RS and in situ point-wise data, the primary issue is whether the surface properties at the site are representative for land surface properties within the instrument Field Of View (FOV). The temperature of vegetation canopy is usually closer to the T-air than to the land surface temperature. Therefore, for forested areas covered with snow in winter, the VIIRS LST is better correlated with T-air [27,28].
Furthermore, when discussing the radiative properties of the snow surface, while not uniform, the IR emissivity of snow is understood enough to compensate for its effects in the remote sensing of T-skin. At near-normal viewing angles, the RS TB can be as much as 1.5 ºC lower than the thermodynamic temperature at wavelengths around 13 µm [29]. At the shorter IR wavelength window (3.5–4 µm), uncertainty in emissivity does not translate into uncertainty in temperature because of the nonlinear nature of Planck’s function, but at longer wavelengths it does. Fortunately, the highest and unreliable uncertainties in emissivity are beyond the 10.5–12.5 µm atmospheric window that the VIIRS LST SW algorithm uses for retrievals. However, studies indicate that snow grains are independent scatterers, and that emissivity decreases with grain size and the presence of liquid water in the snow [30,31]. Nonetheless, T-skin measurements have been used in few climate or hydrologic studies. Results have shown that the differences between RS LST and T-skin have not been due to emissivity as much as: orographic effects, topography, topographic shadowing, and snow deposition [32,33,34,35].
Figure 5. CREST-SAFE land cover 750-m block.
Geosciences 05 00334 g005
For this particular reason, two additional pixels (one bare land, one forest cover/vegetation) were considered in this study to check whether the T-air and T-skin data observed at CREST-SAFE is representative of other areas that surround the site in Caribou with different land cover. Figure 6 illustrates a 750-m block of bare land 1 km away from CREST-SAFE, Figure 7 displays the CREST-SAFE in situ T-skin and T-air vs. VIIRS LST daytime and nighttime for the bare land pixel scatterplots, and Table 3 contains the R and R2 linear correlation coefficient values, MADs, and biases for the scatterplots for both years.
Table 3. R and R2 correlation coefficient values, MAD, and biases between VIIRS LST daytime and nighttime views for the bare land pixel, T-skin, and T-air at CREST-SAFE for winters 2013 and 2014.
T.2013 Daytime2013 Nighttime2014 Daytime2014 Nighttime
RR2MAD (°C)Bias (°C)RR2MAD (°C)Bias (°C)RR2MAD (°C)Bias (°C)RR2MAD (°C)Bias (°C)
Air0.620.387.31−6.450.840.707.16−7.160.860.746.00−5.700.960.916.75−6.75
Skin0.700.505.73−4.980.770.604.50−3.150.870.754.37−2.160.950.902.17−0.58
T.: Temperature.
Figure 6. 750 m block of bare land 1km away from CREST-SAFE.
Geosciences 05 00334 g006
Figure 7. CREST-SAFE in situ T-skin and T-air vs. satellite VIIRS LST daytime and nighttime data for the bare land pixel scatterplots for winters 2013 and 2014.
Geosciences 05 00334 g007
R and R2 linear correlation coefficient values between VIIRS LST for the bare land pixel and in situ T-air daytime data vary from 0.62–0.86 and 0.38–0.74, respectively. R and R2 correlation values for daytime VIIRS LST and in situ T-skin range from 0.70–0.87 and 0.50–0.75.R and R2 nighttime correlation values for T-air fluctuate between 0.84–0.96 and 0.70–0.91, respectively. These correlations values range from 0.77–0.95 and 0.60–0.90 for T-skin. MAD daytime T-air values vary from 6.0–7.31 °C. Daytime MAD values for T-skin range from 4.37–5.73 °C. Nighttime MAD values for T-air and T-skin vary from 6.75–7.16 °C and 2.17–4.50 °C, respectively. VIIRS daytime biases vary from −6.45 °C to −5.70 °C and −4.98 °C to −2.16 °C for T-air and T-skin, respectively. Nighttime biases vary from −7.16 °C to −6.75 °C and −3.15 °C to −0.58 °C for T-air and T-skin, respectively. When comparing these values with those obtained by matching CREST-SAFE in situ vs. VIIRS LST from the CREST-SAFE pixel, it can be seen that the two pixels display very similar results, regardless of the differences in land cover.
In Figure 8, a 750 m block of land covered by forest and vegetation 2 km away from CREST-SAFE is illustrated. There are VIIRS LST satellite pixels in Caribou that have 100% forest cover but these are more than 10km away from the site, which would render the CREST-SAFE in situ temperatures useless for a comparison. Figure 9 displays the CREST-SAFE in situ T-skin and T-air vs. VIIRS LST daytime and nighttime for forest/vegetation covered pixel scatterplots, and Table 4 shows the R and R2 linear correlation coefficient values, MADs, and biases for the scatterplots for both years.
Figure 8. 750 m block of land covered by forest and vegetation 2 km away from CREST-SAFE.
Geosciences 05 00334 g008
R and R2 linear correlation coefficient values between VIIRS LST for forest/vegetation covered pixel and in situ T-air daytime data vary from 0.67–0.89 and 0.45–0.80, respectively. R and R2 correlation values for daytime VIIRS LST and in situ T-skin range from 0.74–0.91 and 0.55–0.82. R and R2 nighttime correlation values for T-air fluctuate between 0.86–0.96 and 0.74–0.91, respectively. These correlations values range from 0.80–0.93 and 0.64–0.87 for T-skin. MAD daytime T-air values vary from 5.00–7.22 °C. Daytime MAD values for T-skin range from 3.36–5.30 °C. Nighttime MAD values for T-air and T-skin vary from 6.46–6.99 °C and 2.34–4.50 °C, respectively. VIIRS daytime biases vary from −6.53 °C to −4.62°C and −4.74 °C to −0.91 °C for T-air and T-skin, respectively. Nighttime biases vary from −6.99 °C to −6.46 °C and −3.13 °C to −0.57 °C for T-air and T-skin, respectively.
Table 4. R and R2 correlation coefficient values, MAD, and biases between VIIRS LST daytime and nighttime views for the forest/vegetation covered pixel and T-skin and T-air at CREST-SAFE for winters 2013 and 2014.
T.2013 Daytime2013 Nighttime2014 Daytime2014 Nighttime
RR2MAD (°C)Bias (°C)RR2MAD (°C)Bias (°C)RR2MAD (°C)Bias (°C)RR2MAD (°C)Bias (°C)
Air0.670.457.22−6.530.860.746.99−6.990.890.805.00−4.620.960.916.46−6.46
Skin0.740.555.30−4.740.800.644.50−3.130.910.823.36−0.910.930.872.34−0.57
T.: Temperature.
Figure 9. CREST-SAFE in situ T-skin and T-air vs. satellite VIIRS LST daytime and nighttime data for the forest/vegetation covered pixel scatterplots for winters 2013 and 2014.
Geosciences 05 00334 g009
The similar linear correlation coefficients, MADs, and biases displayed by three pixels with evident different land covers lead to the notion that the CREST-SAFE T-air and T-skin might be representative of the county of Caribou, ME. However, when compared to the CREST-SAFE pixel, the bare land pixel showed small improvement in VIIRS LST’s estimation of T-skin and T-air. There was also some improvement in VIIRS LST’s estimation of the in situ observations when comparing the forest/vegetation covered pixel with the CREST-SAFE pixel, although it was not as effective as the RS LST estimations for the bare land pixel. The small improvement shown by the bare land and forest/vegetation covered pixels was expected due to the surface homogeneity in the bare land and forest/vegetation covered pixels, when compared to the CREST-SAFE pixel. However, it is not significant enough to establish that VIIRS LST is affected by land cover in the region under study. Instead, it can be established that the differences between RS LST and in situ observations are due to the unpredictability in both the physical and radiative properties of the snow and its surface, as stated previously, sky cover, and wind speed. These findings lead to the proposition of empirical formulas (Section 3.4) to derive T-skin and T-air from RS LST to improve the understanding of VIIRS LSTs.

3.3. CREST-SAFE Diurnal Cycle Analysis

CREST-SAFE hourly data from eight days of winter 2013 were selected (Figure 10a–d and Figure 11a–d) to study T-diff throughout the diurnal cycle and further examine the consistency between in situ T-skin and VIIRS LST. Hourly wind speed and cloud coverage were taken into account to try to explain these disparities.
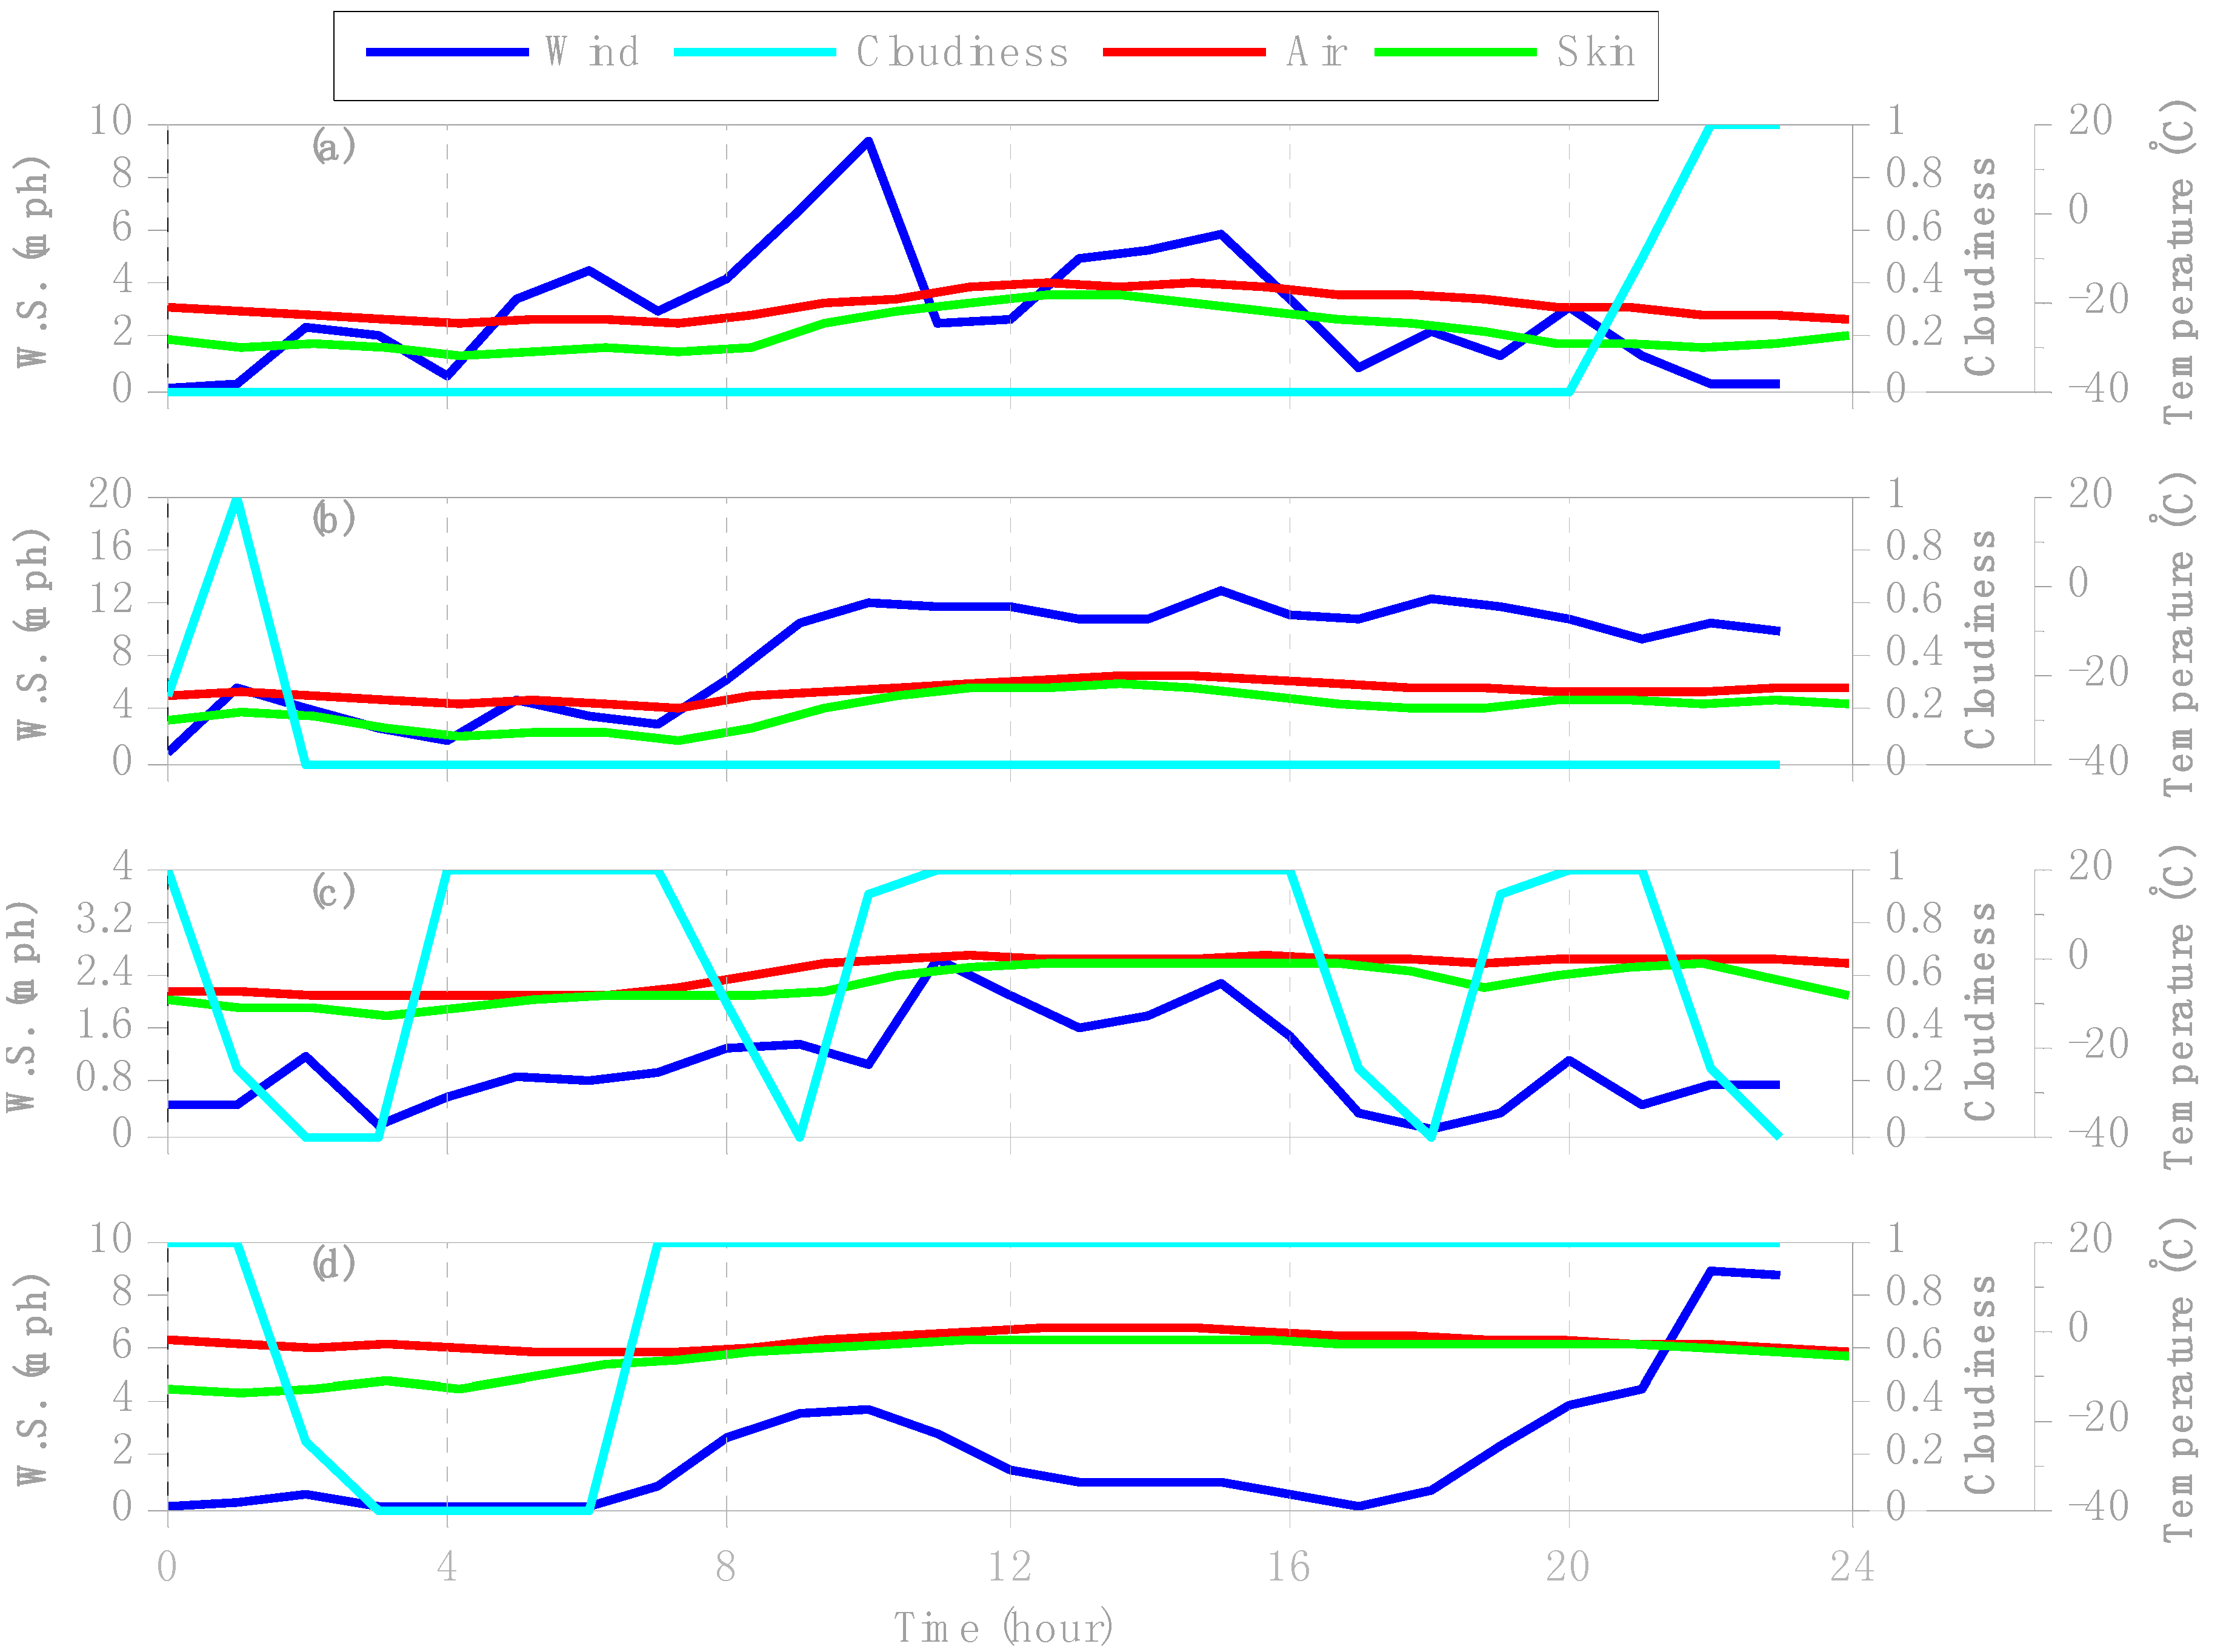
Figure 10. Snow surface and near-surface air temperature hourly values at the CREST-SAFE station in Caribou, ME for the days of 22–23 January (a,b) and 15–16 February (c,d) of winter 2013.
Geosciences 05 00334 g010
Figure 11. Snow surface and near-surface air temperature hourly values at the CREST-SAFE station in Caribou, ME for the days of 15–16 March (a,b) and 9–10 April (c,d) of winter 2013.
Geosciences 05 00334 g011
Figure 10 illustrates the coldest days of January (lowest temperature values recorded for the whole winter) and two days of mid-February to examine early winter. The lowest recorded temperature (−36 °C) happened on 23 January under non-cloudy conditions with a low daily average wind speed of 5.15 ft/s. January and February temperatures peaked sometime between 12:00–2:00 p.m. LT and showcased the largest T-diff from 2:00–6:00 a.m. LT and 3:00–7:00 p.m. LT, respectively. Since S-NPP’s ascension/descend over Caribou, ME happens sometime within these particular hours (1:00–3:00 p.m./a.m. LT), it seems rational to partially attribute the difference in correlation coefficient values between VIIRS LST vs. T-skin and VIIRS LST vs. T-air to this issue. Furthermore, T-air exhibits less fluctuation throughout a winter day, making it more accurate to estimate RS LST using it as input rather than T-skin [36].
In contrast, T-skin is affected because the seasonal snowpack grows in layered structure, causing heterogeneity, with each layer having different physical and mechanical characteristics. Then, the snowpack gets stratified because of successive snow events throughout the winter season. Hence, each snow event encounters a different set of meteorological parameters at the time of its occurrence and afterward. The snow continuously interacts with the environment and exchanges energy with the atmosphere above it and the ground below. These energy exchange processes set up the temperature distribution within the snowpack, which in turn is responsible for its metamorphic changes with time [37,38]. Moreover, Figure 10a shows that under low wind speed and non-cloudy conditions, T-diff is large. Mostly leading to the understanding that the low VIIRS LST and T-skin correlation values can be credited in some measure not only to the clouds’ downward thermal flux but to wind speed, as well. This can be seen in Figure 10b, revealing that a day with high wind speed conditions and close to no cloud coverage can have a small T-diff. It can also be inferred from Figure 10c,d that the T-diff is smaller for a cloudy day, even under low wind speed conditions.
In Figure 11, late winter behavior was studied analyzing two days of mid-March and two days of early April. Figure 11a,b display the first time T-skin is similar to T-air under both cloudy and non-cloudy conditions. The daily temperature peak moves to sometime between 2:00–3:00 p.m. LT (still within S-NPP’s ascension/descend over the area). The two days of early April were selected because these were the last days when the National Environmental Satellite, Data, and Information Service (NESDIS) recorded cloud cover data for Caribou, ME. Data from early April (Figure 11c,d) showcase the first time when T-skin is higher than T-air around 11:00 a.m.–1:00 p.m. LT. Hourly temperatures rise by approximately 10 °C when compared to mid-March, the peak is less significant, and moves closer to 3 p.m. LT. T-skin and T-air values are almost similar throughout a whole day. The diurnal cycle clearly explains why VIIRS LST data will be higher correlated with the months of March and April for T-skin and T-air CREST-SAFE data. The opposite can be said for the cold winter months of January and February. This also clarifies why RS LST vs. in situ correlations are higher for winter 2014, since the CREST-SAFE 2014 data was recorded from late February onwards. CREST-SAFE 2013 data started logging from 1 January 2013. Lastly, CREST-SAFE hourly data indicates that both wind speed and cloud cover affect T-air and T-skin throughout the diurnal cycle.

3.4. Derivation of Empirical Formulas to Obtain In Situ T-Skin (under Dry and Wet Snow Conditions) from RS LST

This section proposes derived empirical formulas to estimate T-skin using VIIRS LST retrievals under clear-sky conditions. In order to derive these empirical formulas, CREST-SAFE in situ T-skin observations were sub-divided into two different groups. The recorded in situ temperatures that happened during daytime are to be considered wet snow observations due to possible snow melting at the top layer of the snowpack with the incoming solar radiation, changing the dielectric properties of the snow, and affecting its emissivity and the VIIRS radiative transfer signal. Inversely, T-skin measurements logged during nighttime were regarded as dry snow due to snow refreezing in the evening creating a more homogeneous snow surface. All the observations used to develop the formulas were under clear-sky conditions. Figure 12 illustrates the validation data used to derive T-skin using RS LST under wet snow conditions (daytime) based on the linear regression model (Equation (2)) that was created, and the 95% upper and lower Confidence Intervals (CIs) for said model. The Sum of Square Errors (SSE) and degrees of freedom are 1455.3 °C2 and 87, respectively. All but two observations are within the 95% confidence intervals. More importantly, R2, Adjusted R2, and RMSE are 0.783, 0.781, and 4.09 °C, respectively. All metrics indicating that the numerical predictions by the model are satisfactory.
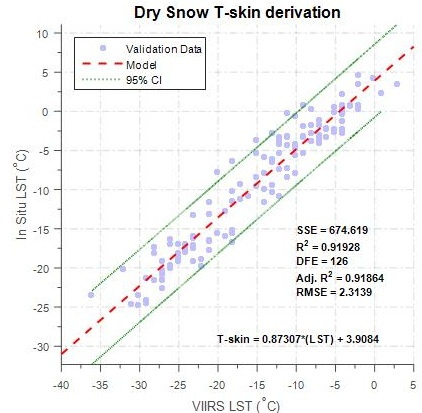
Figure 13 displays the validation data used to derive T-skin using RS LST under dry snow conditions (nighttime) based on the linear regression model (Equation (3)) that was created, and the 95% upper and lower confidence intervals (CIs) for the model. The Sum of Square Errors (SSE) and degrees of freedom are 674.62 °C2 and 126, respectively. All but four observations are within the 95% confidence intervals. Furthermore, R2, Adjusted R2, and RMSE are 0.919, 0.918, and 2.31 °C, respectively. As expected, all metrics indicate that the numerical predictions by the model are highly satisfactory. Additionally, when compared to the wet snow model, it is confirmed that VIIRS makes better LST estimates during nighttime.
Tskin-wet = 0.928 × LST + 1.232 (Wet snow)
Tskin-dry = 0.873 × LST + 3.908 (Dry snow)
In light of the good accuracy provided by the linear regression models, the idea of producing an additional formula to correct RS LST with sky cover was developed. The developmental details are presented in Section 3.5.
Figure 12. T-skin derived empirical formula based on linear regression model between clear-sky VIIRS LST daytime (wet snow) views with respective in situ temperatures at CREST-SAFE.
Geosciences 05 00334 g012
Figure 13. T-skin derived empirical formula based on linear regression model between clear-sky VIIRS LST nighttime (dry snow) views with respective in situ temperatures at CREST-SAFE.
Geosciences 05 00334 g013

3.5. Derivation of Empirical Formula to correct RS LST using Cloud Cover to Obtain In Situ LST

The good accuracy for numerical predictions provided by the linear regression models in Section 3.4 led to the idea of using the developed empirical formulas inversely by utilizing the in situ T-skin from CREST-SAFE to obtain what were named in situ wet and dry snow LSTs, and compare them with the actual VIIRS LSTs via a relation with cloudiness. These wet and dry snow LSTs would ideally be the RS LST (daytime and nighttime, respectively) under clear-sky conditions, since the empirical formulas were created using clear-sky observations only. Figure 14 illustrates the VIIRS LST daytime and nighttime retrievals, the derived wet and dry snow LSTs, and the cloud cover in the background. The wet and dry snow LSTs were created using T-skin observations that matched temporally with all VIIRS LST (cloud-contaminated and clear-sky).
Figure 14. VIIRS LST daytime and nighttime views and inversely retrieved LSTs (wet and dry snow conditions) using the empirical formulas derived from the linear regression models in Section 3.4. Sky cover in the background.
Geosciences 05 00334 g014
A multiple linear regression analysis with linear correlation coefficients was used to correlate derived in situ LSTs (output) with RS LST and cloudiness as predictor variables. It should be mentioned that other correlation coefficient combinations were used, but few showed improvements in the model and these were minimal. Figure 15 illustrates a three-dimensional scatterplot with its representative multiple linear regression model (Equation (4)) in mesh-grid form. DFE, R2, Adjusted R2, and RMSE are 163, 0.547, 0.538, and 7.128 °C, respectively. Metrics indicate that the linear regression model can estimate in situ LST with reasonable accuracy. However, it is clear that cloudiness variability affects the predictions considerably. Table 5 shows the multiple linear regression results.
LSTIn situ = 0.54 × (LSTSatellite) + 7.13 × (Cloudiness) − 9.40
Table 5. Multiple linear regression model results for in situ LST estimation using RS LST and cloudiness as predictor variables.
Multiple Linear Regression Analysis Results
--CoefficientSEtStatpValue
Intercept−9.39821.2799−7.34279.4521 × 10−12
RS LST0.53761.59784.46011.5197 × 10−5
Cloudiness7.12660.06658.07371.4251 × 10−13
Figure 15. Three-dimensional scatterplot of in situ LST, VIIRS LST, and cloudiness with linear regression model in mesh-grid form to estimate in situ LST with RS LST and cloudiness as predictor variables.
Geosciences 05 00334 g015
The coefficient estimates for RS LST (0.5376) and cloudiness (7.1266) highlight again how RS LST underestimates in situ LST for the region under study. The coefficient estimate results indicate that a 30% change in sky cover will result in a 2 °C change between in situ LST and RS LST. Low SE values are indicative of the regression’s capability of estimating both input variables with reasonable accuracy. Lower p-values for cloudiness indicate that there is a 95% probability that it has significant effect on estimating in situ LST using RS LST. The RSME value of 7.13 °C shows that there is error in the model’s in situ estimation due to cloud variability. Lastly, it should be noted that these proposed equations might not apply elsewhere, but are a step in the right direction for the improvement of VIIRS LST retrievals. If anything, these equations still provide user-friendly, preliminary means to estimate T-skin using RS LST retrievals, as well as an empirical formula to correct the RS LST for cloud contamination.

4. Conclusions

In this study, the efficacy of estimating LST for snow-covered regions using the VIIRS LST EDR product from the VIIRS sensor aboard satellite Suomi NPP by comparing it with T-skin, T-soil, and T-air observations from the CREST-SAFE ground station located in Caribou, ME for the winters of 2013 and 2014 was assessed. Quantifying the accuracy of different LST products will both improve their effectiveness and help improve the LST retrieval algorithms, particularly over snow-covered regions due to synoptic station scarcity. LST is a key parameter for hydrological, meteorological, climatological, and environmental studies and is determined by the land surface energy balance. It may relate to the uppermost vegetation canopy, be a mixture of canopy and ground surface temperatures, or a mixture of canopy and snow-covered surface temperatures, depending on the region under observation. The latter produces drastic changes in the LST behavior due to the snowpack changes over time throughout winter.
The results indicate that the current VIIRS LST product does not yield acceptable accuracy for daytime observations for the region studied with average daytime biases of −5.9 °C and −6.8 °C for T-air and T-skin, respectively. However, it does yield better results for nighttime observations with average nighttime biases of −3.5 °C and −2.0 °C for T-air and T-skin, respectively. MAD daytime and nighttime values vary from 6.5 °C to 6.8 °C and 4.8 °C to 2.8 °C, for T-air and T-skin, respectively. The accuracy for nighttime observations is better than that of daytime. This was demonstrated not only by the biases and MAD values but, also by high R and R2 correlation values ranging from 0.81–0.95 and 0.66–0.90 between T-air and T-skin. All temperatures exhibited cold biases, indicative of VIIRS LST product underestimation of the LST at the site. Additionally, T-soil constancy under snowy conditions makes it very different from RS LST, T-air and T-skin. It should also be noted that, compared to the VIIRS LST product accuracy presented in this study, the biases shown in previous VIIRS LST studies over barren surfaces not covered in snow are smaller [7,14]. This comparison indicates that the constant changes (and heterogeneity) of the snow conditions affect the LST readings.
Additional results by the daily time series, multiple regression analysis, and diurnal cycle revealed that near-surface air temperature is commonly higher than snow surface temperature and soil temperature on a daily average basis at CREST-SAFE and that a lack of cloud cover results in: lower T-skin and higher T-diff. Moreover, T-diff is inversely proportional to cloud cover and wind speed. These two parameters (and T-air) alter the snowpack properties constantly. Furthermore, the particular daytime satellite overpass of Suomi-NPP over Caribou is around 1:00–3:00 p.m. LT and, as shown in the diurnal cycle analysis, this is when T-air and T-skin exhibit as much as a 5° difference in particular days. This temperature difference is not as high for bare ground surfaces. Hence, the reason for T-air being used as an accurate surface temperature approximation for bare surfaces not covered in snow. This demonstrates that considering VIIRS LST readings in snow-covered regions accurate might not be appropriate because T-air and T-skin are quite different. Whereas, when there is no snow, T-soil and T-air are similar, as shown by previous studies. Satellite overpass time is also important because if the satellite observation happens at the time when T-diff is high, T-skin will deviate significantly from VIIRS LST (since it is derived from T-air). It seems safer to only use the VIIRS LST nighttime observations to estimate T-skin in snow-covered regions because T-diff is smaller during nighttime generally. Naturally, there will always be exceptions due to cloud cover and wind speed conditions, as demonstrated by this study. It was also shown that T-air and T-skin are equal and should be treated as such. VIIRS LST will correlate better with the T-air from barren surfaces with no snow because T-soil will be almost equal to T-air.
While it is very difficult to validate LST larger pixel scales because of the large spatial variation in LSTs (especially during the daytime), it is also very difficult to find suitable homogeneous sites for comparison. Nonetheless, it is still important to quantify the accuracy of different LST products at different surface types, such as snow-covered surfaces. Though it is certain that one point temperature measurements may not be enough for LST comparison at a 750 m spatial resolution, the lack of synoptic stations that have the instrumentation to monitor T-skin make this study necessary and its findings useful for future work. Satellite radiometry is applied to vast heterogeneous spaces composed of numerous land and vegetation types that might affect the RS LST observations under snowy conditions. Hence, the surface properties at the region of study have to be as representative as possible of the land surface properties within the instrument’s FOV. This is an important matter because spring flood and avalanche warnings might be developed using RS LST readings. In this study, two other pixels (bare land and forest/vegetation covered) 1–2 km away from CREST-SAFE were considered to investigate if land cover affected VIIRS LST around the site. The results showed that the VIIRS LST from these two pixels correlate with CREST-SAFE in situ T-air and T-skin very similarly (despite the land cover differences) to the actual VIIRS LST from the CREST-SAFE pixel. Hence, one could say that VIIRS LST nighttime readings can be considered as T-skin for the small county of Caribou, ME. It should be stated that this might not be the case in another region of study and that the previous statement might not apply elsewhere. Nonetheless, empirical formulas to derive T-skin and T-air from RS LST were proposed as preliminary means for other researchers to use and improve upon in future studies. Furthermore, an empirical equation to correct cloud-contaminated RS LST to estimate the true LST was presented as well.
Additional insight might be drawn by only doing this same study for the spring months of March and April when snow cover is still present but T-skin and T-air are relatively similar to each other. Furthermore, the study can be refocused by examining the change of VIIRS LST with the fraction of forest within the sensor FOV. If the portion of forest cover within certain small area varies but T-skin and T-air do not, then a relatively smooth change of VIIRS LST with forest fraction can be obtained. While there may be no fully forested or fully non-forested pixels, maybe supplementary LST estimates can be extrapolated to estimate LST to 0 and 100% forest fraction if there were relatively large ranges of forest fractions for which we have LST estimates. Maybe then these values can be compared with the T-skin observed at the ground station. Inversely, it can be examined whether the LST values extrapolated to 100% forest fraction will better correlate with in situ T-air. Lastly, it would be ideal to have analogous ground measurements over other regions with comparable snow conditions and land cover to be able to relate with this study.

Acknowledgments

This study is supported and monitored by the National Oceanic and Atmospheric Administration (NOAA) Cooperative Remote Sensing Science and Technology Center (NOAA-CREST). NOAA CREST–Cooperative Agreement No. NA11SEC4810004. Its contents are solely the responsibility of the award recipient and do not necessarily represent the official views of the U.S. Department of Commerce National Atmospheric Administration.

Author Contributions

Carlos L. Pérez Díaz was responsible for data processing and analysis, writing the manuscript, and communicating with the journal. Tarendra Lakhankar, Peter Romanov, and Reza Khanbilvardi, were responsible for structuring the manuscript, supervising the analysis, and providing feedback on the discussion of the results. Yunyue Yu was responsible for providing the Suomi NPP VIIRS LST EDR data used in this study.

Conflicts of Interest

The authors declare no conflict of interest.

References

  1. Brown, R.D.; Robinson, D.A. Northern Hemisphere spring snow cover variability and change over 1922–2010 including an assessment of uncertainty. Cryosphere 2011, 5, 219–229. [Google Scholar] [CrossRef]
  2. Frei, A.; Tedesco, M.; Lee, S.; Foster, J.; Hall, D.K.; Kelly, R.; Robinson, D.A. A review of global satellite-derived snow products. Adv. Space Res. 2012, 50, 1007–1029. [Google Scholar] [CrossRef]
  3. Tang, Q.; Gao, H.; Lu, H.; Lettenmaier, D.P. Remote sensing: Hydrology. Prog. Phys. Geogr. 2009, 33, 490–509. [Google Scholar] [CrossRef]
  4. Dominé, F.; Shepson, P.B. Air-Snow Interactions and Atmospheric Chemistry. Science 2002, 297, 1506–1510. [Google Scholar] [CrossRef]
  5. Chen, C.; Lakhankar, T.; Romanov, P.; Helfrich, S.; Powell, A.; Khanbilvardi, R. Validation of NOAA-interactive multisensor snow and Ice Mapping System (IMS) by comparison with ground-based measurements over Continental United States. Remote Sens. 2012, 4, 1134–1145. [Google Scholar] [CrossRef]
  6. Lakhankar, T.Y.; Muñoz, J.; Romanov, P.; Powell, A.M.; Krakauer, N.Y.; Rossow, W.B.; Khanbilvardi, R. CREST-snow field experiment: Analysis of snowpack properties using multi-frequency microwave remote sensing data. Hydrol. Earth Syst. Sci. Discuss. 2013, 17, 783–793. [Google Scholar] [CrossRef]
  7. Li, H.; Sun, D.; Yu, Y.; Wang, H.; Liu, Y.; Liu, Q.; Du, Y.; Wang, H.; Cao, B. Evaluation of the VIIRS and MODIS LST products in an arid area of Northwest China. Remote Sens. Environ. 2014, 142, 111–121. [Google Scholar] [CrossRef]
  8. Li, Z.-L.; Tang, B.-H.; Wu, H.; Ren, H.; Yan, G.; Wan, Z.; Trigo, I.F.; Sobrino, J.A. Satellite-derived land surface temperature: Current status and perspectives. Remote Sens. Environ. 2013, 131, 14–37. [Google Scholar] [CrossRef]
  9. Xia, L.; Mao, K.B.; Ma, Y.; Zhao, F.; Jiang, L.P.; Shen, X.Y.; Qin, Z.H. An algorithm for retrieving land surface temperatures using VIIRS data in combination with multi-sensors. Sensors 2014, 14, 21385–21408. [Google Scholar] [CrossRef]
  10. Hachem, S.; Duguay, C.R.; Allard, M. Comparison of MODIS-derived land surface temperatures with ground surface and air temperature measurements in continuous permafrost terrain. Cryosphere 2012, 6, 51–69. [Google Scholar] [CrossRef] [Green Version]
  11. Wan, Z.; Zhang, Y.; Zhang, Q.; Li, Z.-L. Quality assessment and validation of the MODIS global land surface temperature. Int. J. Remote Sens. 2004, 25, 261–274. [Google Scholar] [CrossRef]
  12. Benali, A.; Carvalho, A.C.; Nunes, J.P.; Carvalhais, N.; Santos, A. Estimating air surface temperature in portugal using MODIS LST data. Remote Sens. Environ. 2012, 124, 108–121. [Google Scholar] [CrossRef]
  13. Fu, G.; Shen, Z.; Zhang, X.; Shi, P.; Zhang, Y.; Wu, J. Estimating air temperature of an Alpine Meadow on the Northern Tibetan Plateau using MODIS land surface temperature. Acta Ecologica Sinica 2011, 31, 8–13. [Google Scholar] [CrossRef]
  14. Vancutsem, C.; Ceccato, P.; Dinku, T.; Connor, S.J. Evaluation of MODIS land surface temperature data to estimate air temperature in different ecosystems over Africa. Remote Sens. Environ. 2010, 114, 449–465. [Google Scholar] [CrossRef]
  15. Guillevic, P.C.; Privette, J.L.; Coudert, B.; Palecki, M.A.; Demarty, J.; Ottlé, C.; Augustine, J.A. Land surface temperature product validation using NOAA’s surface climate observation networks-scaling methodology for the Visible Infrared Imager Radiometer Suite (VIIRS). Remote Sens. Environ. 2012, 124, 282–298. [Google Scholar]
  16. Jackson, J.M.; Liu, H.; Laszlo, I.; Kondragunta, S.; Remer, L.A.; Huang, J.; Huang, H.C. Suomi-NPP VIIRS aerosol algorithms and data products. J. Geophys. Res. Atmos. 2013, 118, 12673–12689. [Google Scholar] [CrossRef]
  17. Schueler, C.; Clement, J.E.; Darnton, L.; DeLuccia, F.; Scalione, T.; Swenson, H. VIIRS sensor performance. In Proceedings of the Thirteenth International TOVS Study Conference, Sainte-Adèle, QC, Canada, 29 October–4 November 2003.
  18. Sun, D.; Pinker, R.T. Estimation of land surface temperature from a Geostationary Operational Environmental Satellite (GOES-8). J. Geophys. Res.: Atoms. 2003, 108. [Google Scholar] [CrossRef]
  19. Jensen, J.R. Remote Sensing of the Environment: An Earth Resource Perspective, 2nd ed.; Pearson Prentice Hall: Upper Saddle River, NJ, USA, 2007. [Google Scholar]
  20. Schultz, G.A. Remote Sensing in Hydrology and Water Management; Springer: Berlin, Germany, 2000. [Google Scholar]
  21. Justice, C.O.; Román, M.O.; Csiszar, I.; Vermote, E.F.; Wolfe, R.E.; Hook, S.J.; Friedl, M.; Wang, Z.; Schaaf, C.B.; Miura, T.; et al. Land and cryosphere products from Suomi NPP VIIRS: Overview and status. J. Geophys. Res.: Atmos. 2013, 118, 9753–9765. [Google Scholar] [CrossRef]
  22. Walsh, J.E.; Jasperson, W.H.; Ross, B. Influences of snow cover and soil moisture on monthly air temperature. Mon. Weather Rev. 1985, 113, 756–768. [Google Scholar] [CrossRef]
  23. Holtslag, A.A.M.; De Bruin, H.A.R. Applied modeling of the nighttime surface energy balance over land. J. Appl. Meteorol. 1988, 27, 689–704. [Google Scholar] [CrossRef]
  24. Platt, C.M.R.; Prata, A.J. Nocturnal effects in the retrieval of land surface temperatures from satellite measurements. Remote Sens. Environ. 1993, 45, 127–136. [Google Scholar] [CrossRef]
  25. Gelfan, A.N.; Pomeroy, J.W.; Kuchment, L.S. Modeling forest cover influences on snow accumulation, sublimation, and melt. J. Hydrometeorol. 2004, 5, 785–803. [Google Scholar] [CrossRef]
  26. Pomeroy, J.; Essery, R.; Toth, B. Implications of spatial distributions of snow mass and melt rate for snow-cover depletion: Observations in a subarctic mountain catchment. Ann. Glaciol. 2004, 38, 195–201. [Google Scholar] [CrossRef]
  27. Rosenfeld, S.; Grody, N. Anomalous microwave spectra of snow cover observed from special sensor microwave/imager measurements. J. Geophys. Res.: Atoms. 2000, 105, 14913–14925. [Google Scholar] [CrossRef]
  28. Yang, W.; Tan, B.; Huang, D.; Rautiainen, M.; Shabanov, N.V.; Wang, Y.; Privette, J.L.; Huemmrich, K.F.; Fensholt, R.; Sandholt, I.; et al. MODIS leaf area index products: From validation to algorithm improvement. IEEE Trans. Geosci. Remote Sens. 2006, 44, 1885–1896. [Google Scholar] [CrossRef]
  29. Dozier, J.; Painter, T.H. Multispectral and hyperspectral remote sensing of alpine snow properties. Annu. Rev. Earth Planet. Sci. 2004, 32, 465–494. [Google Scholar] [CrossRef]
  30. Dozier, J.; Warren, S.G. Effect of viewing angle on the infrared brightness temperature of snow. Water Resour. Res. 1982, 18, 1424–1434. [Google Scholar] [CrossRef]
  31. Salisbury, J.W.; D’Aria, D.M.; Wald, A. Measurements of thermal infrared spectral reflectance of frost, snow, and ice. J. Geophys. Res. 1994, 99, 24235–24240. [Google Scholar] [CrossRef]
  32. Stroeve, J.; Steffen, K. Variability of AVHRR-derived clear-sky surface temperature over the Greenland ice sheet. J. Appl. Meteorol. 1998, 37, 23–31. [Google Scholar] [CrossRef]
  33. King, M.D.; Platnick, S.; Yang, P.; Arnold, G.T.; Gray, M.A.; Riedi, J.C.; Ackerman, S.A.; Liou, K.N. Remote sensing of liquid water and ice cloud optical thickness and effective radius in the arctic: Application of airborne multispectral MAS data. J. Atmos. Ocean. Technol. 2004, 21, 857–875. [Google Scholar] [CrossRef]
  34. Fily, M.; Dedieu, J.P.; Durand, Y. Comparison between the results of a snow metamorphism model and remote sensing derived snow parameters in the Alps. Remote Sens. Environ. 1999, 68, 254–263. [Google Scholar] [CrossRef]
  35. Marks, D.; Winstral, A.; Seyfried, M. Simulation of terrain and forest shelter effects on patterns of snow deposition, snowmelt and runoff over a semi-arid mountain catchment. Hydrol. Process. 2002, 16, 3605–3626. [Google Scholar] [CrossRef]
  36. Dong, J.; Peters-Lidard, C. On the relationship between temperature and MODIS snow cover retrieval errors in the Western US. IEEE J. Sel. Top. Appl. Earth Obs. Remote Sens. 2010, 3, 132–140. [Google Scholar] [CrossRef]
  37. Prihodko, L. Estimation of air temperature from remotely sensed surface observations. Remote Sens. Environ. 1997, 60, 335–346. [Google Scholar] [CrossRef]
  38. Datt, P.; Srivastava, P.K.; Negi, P.S.; Satyawali, P.K. Surface energy balance of seasonal snow cover for snow-melt estimation in N-W Himalaya. J. Earth Syst. Sci. 2008, 117, 567–573. [Google Scholar] [CrossRef]

