
Origin of Petrified Wood Color


1
Geology Department, Western Washington University, Bellingham, WA 98225, USA
2
Department of Geological Sciences, 1272 University of Oregon, Eugene, OR 97403, USA
*
Author to whom correspondence should be addressed.
Geosciences 2016, 6(2), 25; https://doi.org/10.3390/geosciences6020025
Submission received: 16 March 2016
/
Revised: 26 April 2016
/
Accepted: 3 May 2016
/
Published: 9 May 2016
Abstract
:Fossil forests have world-wide distribution, commonly preserving mineralized wood that displays vivid hues and complex color patterns. However, the origin of petrified color has received little scientific attention. Color of silicified wood may be influenced by the presence of relict organic matter, but the most significant contribution comes from trace metals. This study reports quantitative analysis of trace metals in 35 silicified wood samples, determined using LA-ICP-MS spectrometry. The most important of these metals is Fe, which can produce a rainbow of hues depending on its abundance and oxidation state. Cr is the dominant colorant for bright green fossil wood from Arizona, USA and Zimbabwe, Africa. Complex color patterns result from the progressive nature of the fossilization process, which causes wood to have varying degrees of permeability during successive episodes of permineralization. These processes include simple diffusion, chromatographic separation, infiltration of groundwater along fractures and void spaces, and oxidation/reduction.
1. Introduction
In a modern tree, the color is due to the presence of lignin and other organic constituents. When wood is mineralized, cellular features may be preserved in great detail, but the original wood color is lost. For woods that are mineralized with iron pyrite, iron oxide, or copper minerals, the color of the fossil wood is determined by the mineral color. More often, wood is mineralized with silica. For these specimens, the origin of color involves two phenomena: trace metals that play a role in controlling color of silicified wood, and physical and chemical factors that cause these hues to sometimes be distributed in complex patterns.
This study reports on samples of silicified wood that span a broad color spectrum, ranging from vivid primary colors to shades of white, brown, and black. Samples include specimens from two localities that are well-known for producing bright colored specimens: multicolored “rainbow wood” from the Triassic Chinle Formation from two localities in Arizona, USA, and red and green wood from the Eocene Clarno Formation at Hampton Butte, Oregon, USA. Other specimens came from Nevada and Oregon, USA, and Zimbabwe and Madagascar, Africa.
2. Metallic Elements as a Cause of Mineral Color
Although wood can be mineralized with calcium carbonate, calcium phosphate, iron oxide, and other non-silicate minerals, silica is by far the most common agent for wood petrifaction, Silicified wood can be mineralized with opal, chalcedony, or microcrystalline quartz. In pure form, these SiO2 polymorphs are colorless, but in nature they may occur in a wide range of colors. Crystal lattice defects produce transparent gray “smoky” quartz, and opaque “milky” quartz may be caused by an abundance of microscopic fluid inclusions. Optical effects produce the iridescent “fire” in precious opal, where the orderly arrangement of silica microspheres causes reflected visible light to be divided into spectral colors.
Trace amounts of transition metals are the most common source of color in quartz family minerals [1], and colored gems [2,3,4,5,6,7,8]. Elements with atomic no. 21–29 (Sc, Ti, V, Cr, Mn, Fe, Co, Ni, Co) have partially filled d-orbitals. Electrons transitioning between d-orbital positions absorb energy in the visible spectrum, and minerals containing even trace amounts of these elements may have bright color. These colors are related to concentration and oxidation state. In the absence of trace element pigments, quartz may appear white because of microscopic fluid inclusions; silicified wood may be opaque white because of light scattering caused by the relict fibrous wood structure. When trace elements are present, intensity of the color is controlled by the amount of colorant that is added to the white base color. In the case of red-hued hematite, colors may range from pale pink to vivid red, depending on the hematite concentration. Similarly, goethite may produce tints that range from pale yellow to dark yellowish brown. If two or more pigment compounds are presented, a complex range of colors may result. This phenomenon may explain the subtle color gradations that may occur within fossil wood samples from a single locality and variations that occur within a single specimen.
3. Previous Work
In the absence of analytical studies, speculations regarding silicified wood color have commonly involved unsupported and often conflicting claims [9,10]. A detailed study reported elemental data from black, red, and beige zones in a single specimen from Petrified Forest National Park, Arizona, USA [11]. Daniels and Dayvault [12] provide a lengthy but rather speculative discussion of trace elements as a cause of silicified wood color. The only data cited for their interpretations are unpublished results from qualitative trace element studies performed on 10 samples at Argonne National Laboratory, Chicago, IL, USA. Thus, the present study is an important contribution because it is the first time precise quantitative analyses of a broad spectrum of trace elements have been performed on a wide variety of silicified wood specimens.
4. Methods
Fossil wood samples were mounted with epoxy cement on glass microscope slides, and reduced to approximately 200 micrometer thickness using Wards Ingram petrographic machines. Specimen surfaces were polished on lapidary wheels using silicon carbide abrasives. Trace element concentrations were determined for 35 specimens (Appendix). Specimens contained chalcedony/microcrystalline quartz as the only discernable mineral, except for specimens from Nye County, Nevada, USA, which are permineralized with common opal (opal-CT). Mineralogy was determined by X-ray diffraction patterns of packed powders with a Rigaku Geigerflex diffractometer using Ni-filtered Cu Kα radiation.
The following elements ( mass numbers) were analyzed for each sample using an Agilent 7500ce ICP-MS spectrometer with New Wave UP213 Laser ablation system at the Western Washington University Advanced Materials Science and Engineering Center: Ti(49), V(51), Cr(53), Mn(55), Fe(56), Co(59), Ni(60), Cu(63), U(238). Beam diameter was 55 micrometers, with laser output set at 70% of full power. These operating conditions were selected to yield precise laser tracks, as confirmed by microscopy using a Tescan Vega scanning electron microscope and a Wilde model 420 optical microscope (Figure 1). Six 2 mm long parallel lines were laser-etched on the sample surface. For each laser line, data were collected as 15 replicate measurements for each element. Data were averaged, applying background corrections based on data from blank samples. PPM concentrations were calculated using U.S. National Institute of Standards and Technology glass reference samples NIST 610, NIST 612, and NIST 614 for calibration. Results were plotted using Microsoft Excel. Specimens are archived at the Western Washington University Geology Department.
Colors of geological materials are commonly described using the Munsell color space system, using Munsell Soil Color Charts M50215B (Munsell Color, Baltimore, MD, USA) and Geological Society of America Rock-Color Chart (Boulder, CO, USA). These charts lack sufficient range to describe bright-colored petrified wood. For this study, colors of polished specimens are described in the appendix using the Pantone color matching system (www.Pantone.com). Reference colors can be viewed online at http://rgb.to/pantone.
5. Results
LA-ICP-MS analyses reveal that a broad spectrum of colors can be produced by only a few trace elements. Iron, in various oxidation states and levels of abundance, accounts for most of these hues. Chromium is the dominant trace element in some bright green specimens.
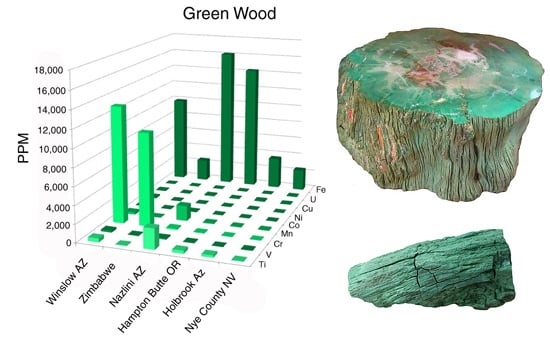
5.1. Green Wood
Green silicified wood has commonly been assumed to be tinted with chromium, but elemental analyses of samples from five locations (Figure 2) show that this trace metal is a dominant colorant only in some bright green specimens. Dark green fossil woods are colored by iron, which may be present in amounts up to several weight %. These results are consistent with previous qualitative evidence [12]. Pale green opalized wood from Nye County, Nevada, USA, contains Fe as the major trace metal, but at concentrations much lower than dark green specimens (Figure 3).
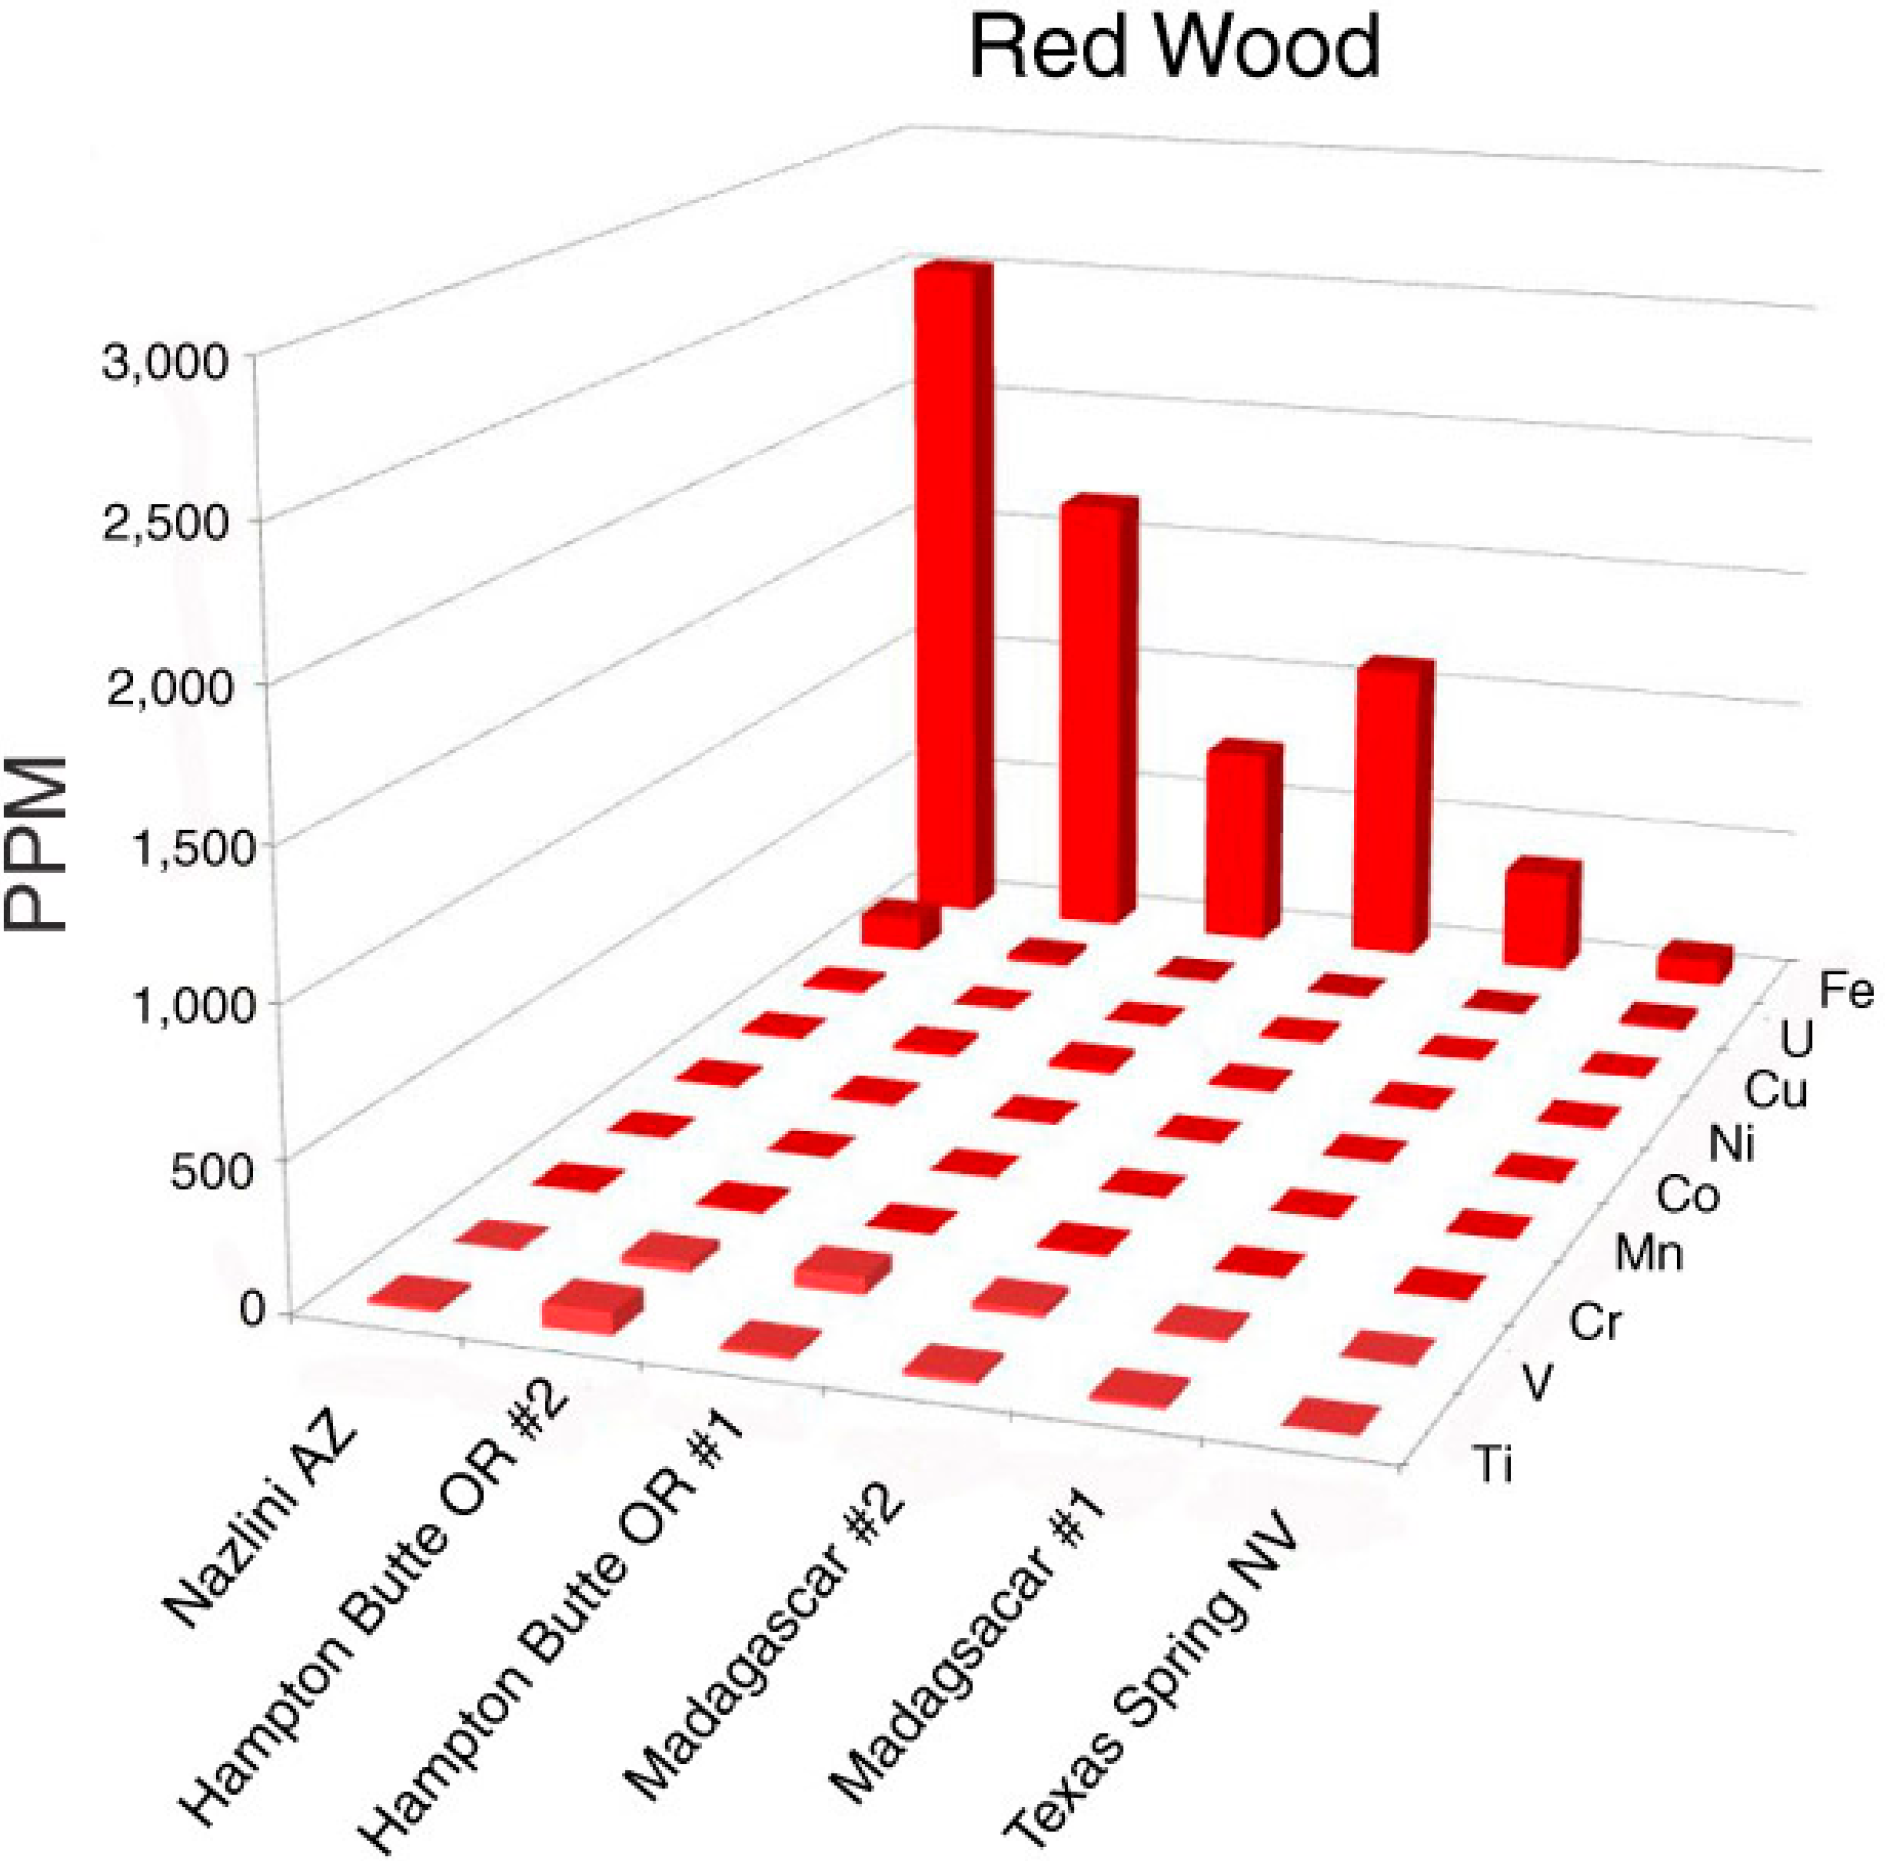
5.2. Red Wood
Oxidized iron is the important colorant in red silicified wood (Figure 4 and Figure 5). Dark red color is associated with high Fe levels; much lower Fe occurs in a light red sample from Texas Spring, Nevada, USA. The specimen from Nazlini Canyon, Arizona, USA, contains 15 ppm uranium, but this element is probably not significant as a colorant; relatively high U levels occur in specimens that have a variety of colors (Appendix).
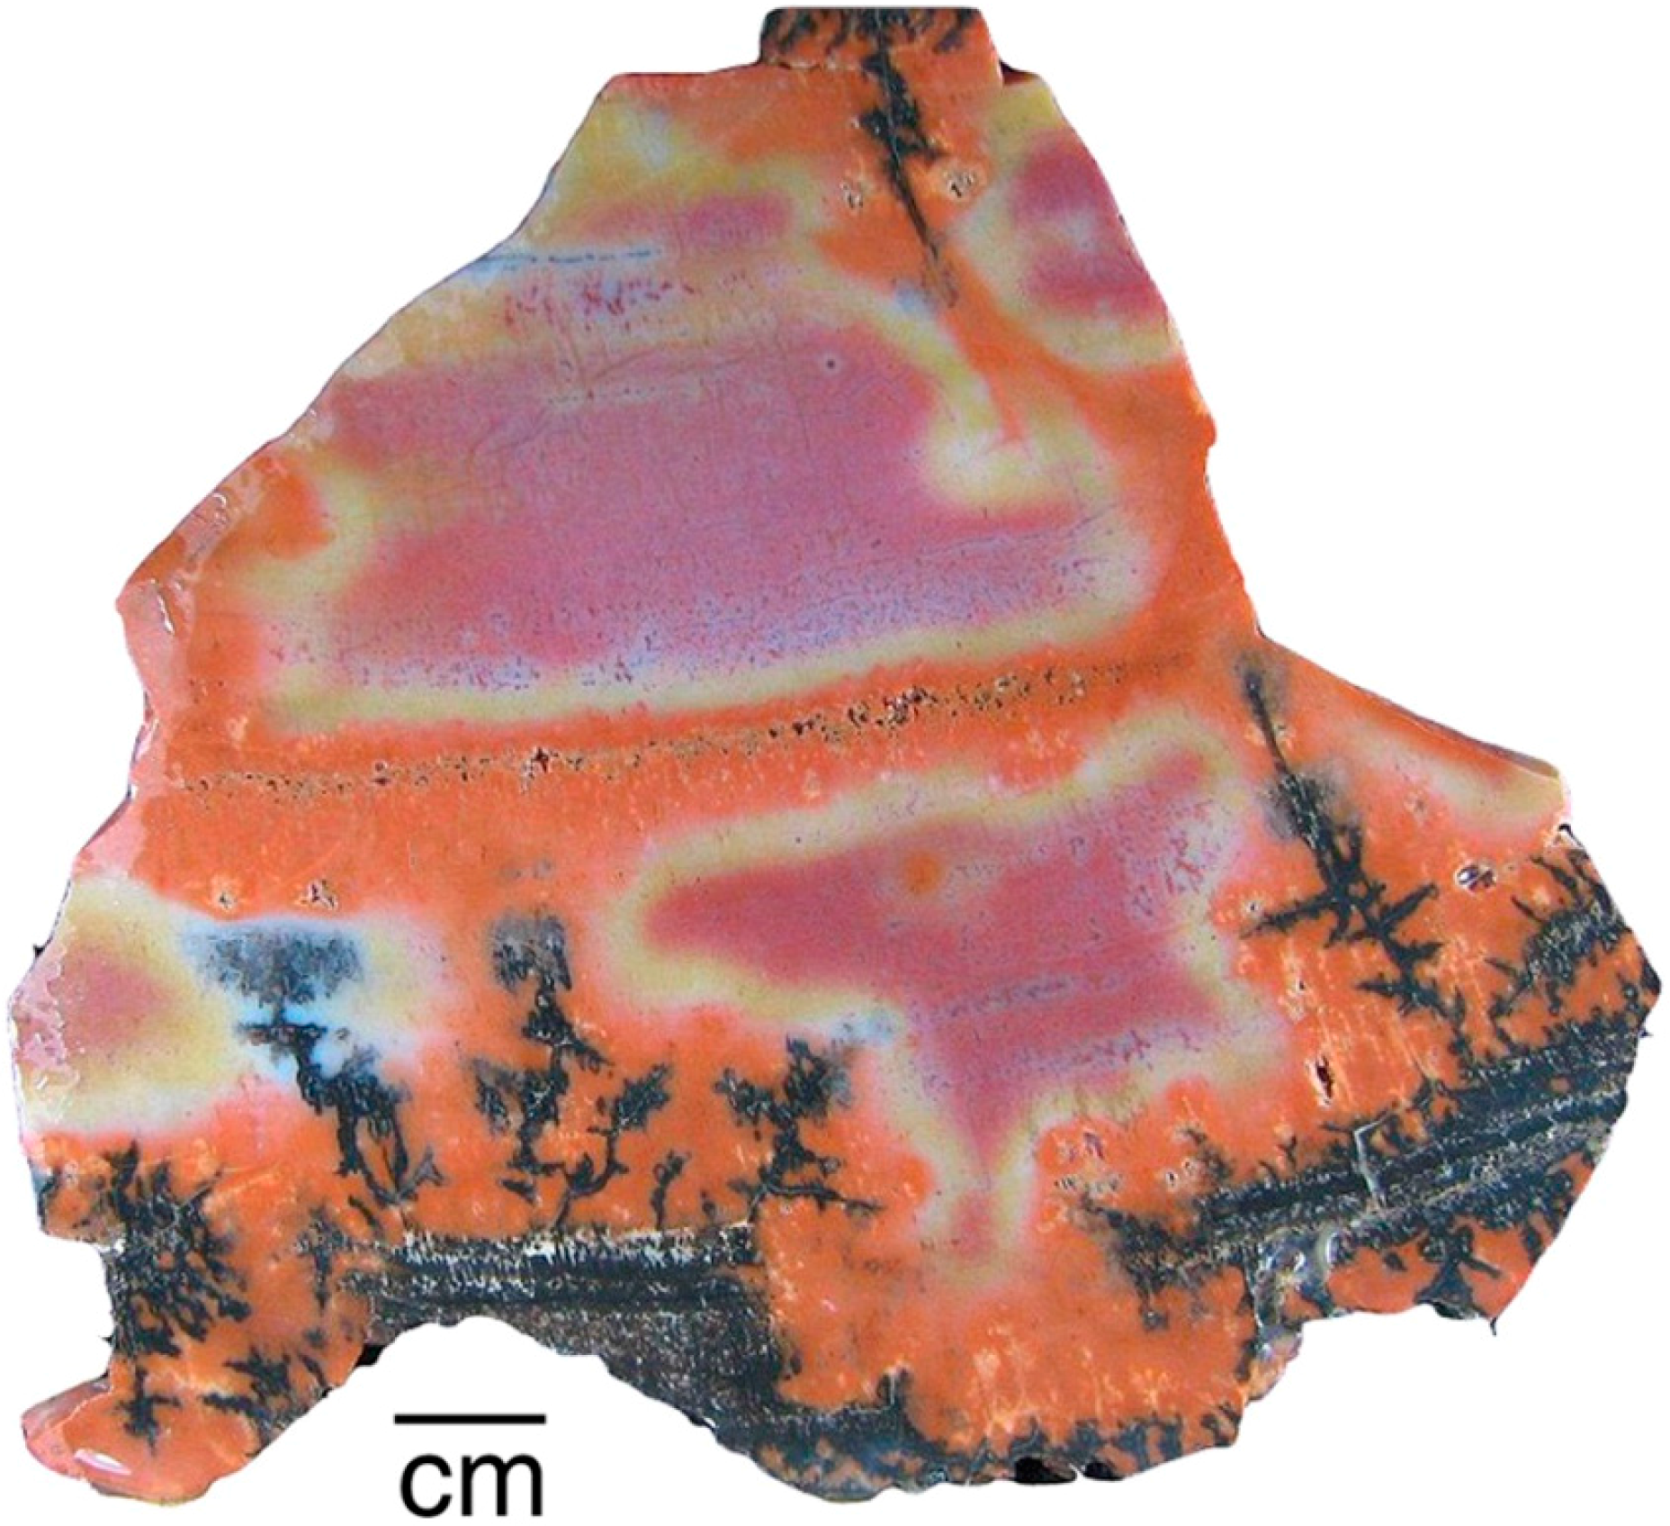
5.3. Rainbow Colors
Petrified Forest National Park, Arizona, USA, is famous for the abundance of “rainbow wood” [13], where even a small specimen may contain a broad range of colors. This study determined trace element compositions from two locations in the Triassic Chinle Formation. Holbrook specimens are correlative to the fossil forests within the nearby park; Nazlini Canyon specimens are from a more distant location, located approximately 100 km northeast of Petrified Forest National Park. The stratigraphic relationship is uncertain; Nazlini Canyon specimens are characterized by pastel colors, compared to the bright hues typical of specimens from the park area (Figure 6).
In this study, trace metals were measured for six color zones within a single specimen, guaranteeing that the various colors are not related to differing age or conditions of deposition or diagenesis. Several additional specimens were analyzed. Analyses of Nazlini Canyon wood were made on individual samples, each having a particular color (Appendix).
For Holbrook and Nazlini Canyon specimens, the various hues are all associated with the presence of iron. At both locations, bright red samples contain slight Mn elevations (120 ppm for Nazlini wood and 67 ppm for Holbrook wood). Bright red wood colors also occur in samples that have low Mn values (Figure 5, Appendix) suggesting this element is not an essential colorant. For both Arizona locations, “rainbow” colors are related to Fe concentrations, which progressively decrease in intensity from bright to pale (Figure 7). These results are consistent with data from Sigleo [11], who measured trace elements in black, red, and beige zones in a single specimen, finding Fe to be the primary colorant, with the intensity of color proportional to the abundance of that element.
5.4. Black, White, Clear
It is not surprising that nearly colorless silicified wood specimens contain very low concentrations of trace elements (Figure 8). Two samples of black silicified wood, from Holbrook, Arizona, USA, and Nye County, Nevada, USA, were likewise found to contain low trace element levels. Opaque white specimens showed variations in composition, ranging from 1683 ppm Fe to 200 ppm or less in six other specimens. Black wood results from a variety of causes. Some Chinle formation specimens, particularly those from Nazlini Canyon, Arizona, USA, have thin external coatings of “desert varnish,” Mn/Fe-enriched coating formed on rock surfaces that have had prolonged surface exposure. The black zone may extend shallow distances along fractures in silicified wood (Figure 9). The common assumption that the black color is caused by elevated levels of Mn or Fe is not valid for samples in this study. For mineralized wood, black color is rarely related to prehistoric burning, in contrast to the widespread abundance of unmineralized charcoal in the fossil record, which provides clear evidence of ancient forest fires [14]. One cause of black color in silicified wood may simply be the low reflectance of translucent chalcedony.
5.5. Brown
Large variations in trace element abundances were observed for brown-hued silicified wood (Figure 10). These fossil wood samples contain Fe as a dominant trace element, but at levels that seldom exceed a few hundred ppm. The intensity of brown color does not necessarily correspond to the Fe concentration. For example, dark brown wood from Hampton Butte, OR, USA, and medium brown woods from Texas Spring, NV, USA, and Madagascar, Africa all contain low abundances for all measured trace elements. A possible explanation is that brown colors may sometimes be caused by relict organic matter rather than trace element colorants. More research is needed to explain the apparently diverse origin of tan and brown colors.
6. Discussion
An important result of this study is the discovery that a variety of colors in silicified wood can be produced by Fe in varying abundances and oxidation states. Cr is important only for a few bright green wood colors. This observation will hopefully reduce the misconceptions that have resulted from using trace element colors in gemstones as an analog for wood petrifaction. The differences in the origin of color in silicified wood and non-silicate minerals probably stems from the differing lattice structures. The possibility of incorporation of a trace element within a lattice depends not only on the presence of the element during paragenesis, but on its compatibility with the molecular architecture of the host mineral. For example, Ti may be readily incorporated into iron-bearing minerals because of the similarity in atomic radii and valence between Fe and Ti. Also, mineral color may be related to the proximity of neighboring atoms, which affects possibilities for electron charge transfer. In copper minerals, Cu bonded to oxygen in malachite (Cu2CO3(OH)2) and azurite (Cu3(CO3)2(OH)2) produces green and blue colors, respectively. These colors are very different from those of minerals where Cu is associated with sulfur, as in opaque metallic lusters typical of chalcocite (Cu2S), and bornite (Cu5FeS4). Similar color variations occur at trace levels, as evidenced by beryl (Be3Al2Si16O8), where color changes from red (ruby) to green (emerald) as the concentration of Cr increases as a substitute for Al in the Al2O3 lattice framework [15].
Possibilities for ionic substitutions as a source of color are very limited in silicified wood because the lattice structure of quartz is well-defined, compared to silicate minerals families that are characterized by variable structure (e.g., clays, zeolites, garnet, amphibole, pyroxenes, etc.). Because of the differences in ionic radii between atoms of given transition metal and silicon, metallic substitutions distort the quartz crystal lattice; the concentration of trace elements necessary to produce vivid colors in microcrystalline SiO2 grains would produce unacceptably large kinetic stresses. When an element is present at a concentration sufficient to generate pigmentation, it is likely present as a separate cryptocrystalline solid phase intermixed with the SiO2. Colored areas in specimens used for this study seldom contain pigment grains that are detectable by optical microscopy, but there are exceptions (Figure 11 and Figure 12).
Iron Oxides
LA-ICPMS analysis revealed iron to be the dominant element responsible for silicified wood color, with the exception of the bright green specimens that contain high levels of chromium. The wide range of colors that can be produced by small amounts of iron can be explained by the diversity of naturally-occurring iron oxides and hydroxides (Table 1 [16,17]).
The ability of iron oxides to determine silicified wood color is related to tinting strength and hiding power (opacity). Tinting strength refers to the ability of the pigment to impart color to material; all iron oxides have high tinting strength, but some minerals have higher tinting strength than others. For example, the pigmenting power of hematite is far greater than that of goethite [18]. For iron oxides, substitution for some Fe by another element may affect the color. For goethite, substitution of small amounts of Mn produces an olive brown to blackish color, while V substitution causes a greenish hue. Mn-substituted hematite is blackish [18].
As noted previously, particle size can influence color. Goethite and akaganéite crystals of 0.1–1 μm diameter are yellow, but larger particles are more brown [15]. Aqueous suspensions of hematite particles with diameters <0.1 μm were orange, red in the range of 0.1–0.5 μm, and purple for particles >1.5 μm [18]. Particle shape also influences color, e.g., acicular hematite has a more yellowish hue than more symmetric particles [19]. Violet color may result when red hematite nanoparticles are present in bluish translucent chalcedony [12].
Colors observed in silicified wood containing Fe as the major colorant element are consistent with evidence for soil color. Secondary iron oxides are the most important pigment for low-organic content soil [20]. Soils containing only goethite are yellowish brown. Presence of hematite may mask color contribution from goethite, yielding reddish color. For 33 Brazilian soils, intensity of red color was linear in relation to hematite content [20].
As noted in Table 1, colors of iron oxides and hydroxides are typically shades of yellow, brown, red, or black, but green iron compounds are known. These compounds are commonly referred to as “green rust”, following the 1935 discovery of a green corrosion product of metallic iron [21]. Subsequently, green rust minerals were identified in natural occurrences, beginning with the discovery of fougèrite in forest soil [22], mӧssbauerite [23], and trébeurdenite [24], both from intertidal mud. Investigations of these green rusts are proceeding rapidly, as evidenced by a 2015 special volume [21], but their range of occurrences in natural environments remains enigmatic. High iron concentrations in some green silicified samples suggest the possible presence of these minerals.
Although Fe is likely present in fossil wood in the form of ferruginous minerals, the amounts are too low to be detected by X-ray diffraction for the samples used in this study. However, the range of colors in the minerals listed in Table 1 is consistent with the observation that multi-colored silicified wood commonly contains Fe as the predominant trace element.
7. Geologic Source of Colorant Elements
What is the origin of colorant phases found in silicified wood? Colorants present in fossil wood have mostly been introduced during fossilization, based on the very low trace element concentrations typical of the original tissue [25]. Two sources are likely: elements derived from matrix enclosing the buried wood, and elements transported from a more distant source by groundwater. Some, perhaps many, deposits involve both phenomena. It is probably not a coincidence that the brightest-colored wood specimens in this study came from two locations where wood was preserved in weathered volcaniclastic formations noted for vivid strata. In the case of the Triassic Chinle Formation, the elemental composition of sediment inclosing silicified wood contains several percent iron, and elevated Mn levels [11]. The color of the fossil wood is not always correlative with the color of the host strata (Figure 13), suggesting that groundwater was sometimes important for the transport of dissolved elements.
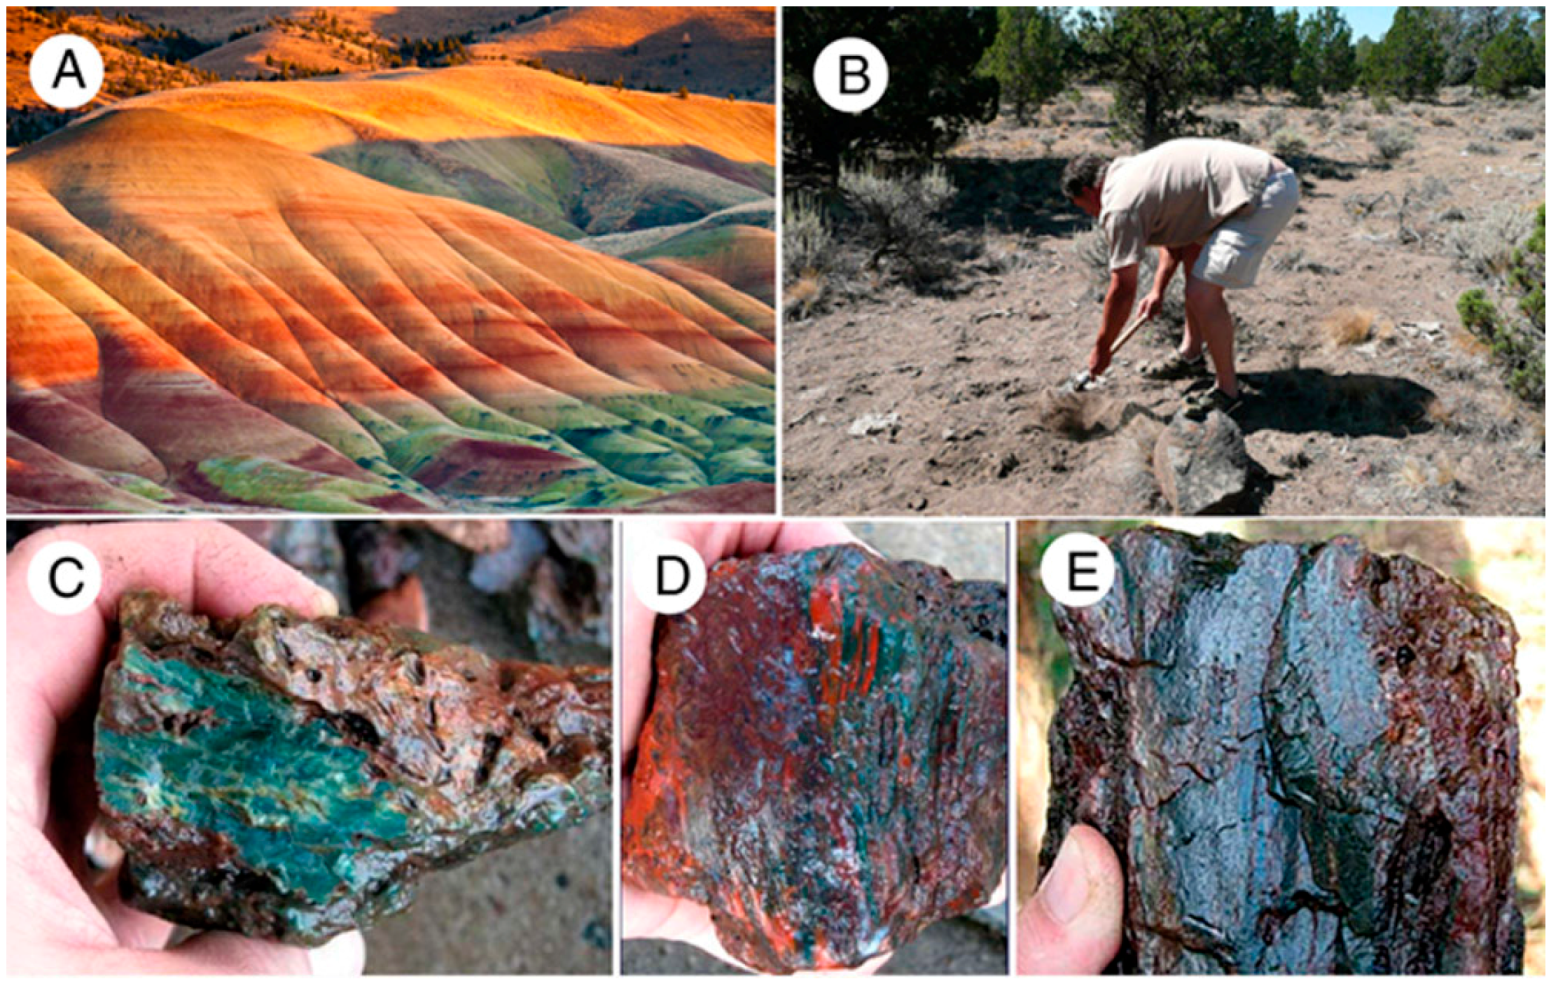
Silicified wood is common in Eocene Clarno Formation beds at Hampton Butte, Deschutes County, OR, USA. At the Painted Hills type locality at John Day Fossil Beds National Monument, Clarno strata are composed of weathered volcaniclastic strata similar to the Arizona Chinle Formation (Figure 14). At Hampton Butte, specimens were collected from excavations in pale-colored soil; the original color of the host sediment is unknown.
8. Origin of Color Patterns
The chemical composition of fossil wood can be determined with a high degree of accuracy, but the interpretation of the way in which elemental variations produce color patterns is more subjective. If wood had a homogeneous structure and permineralization occurred in a single step, and if no remobilization of elemental consituents occurred during diagenesis, silicified wood would be expected to have a uniform color. Instead, fossil wood commonly has color patterns that are highly variable in hue and complex in geometry. The development of complex color patterns begins with infiltration of mineral-laden groundwater, followed by some or all of the following effects.
8.1. Groundwater Penetration along Natural Cellular Pathways
Fluid transport in plants stems is highly directional, a phenomenon that persists long after death. Groundwater percolating through porous tissue follows elongated trachieds that are connected laterally by circular apertures (pits), and along larger conductive vessels in angiosperm woods. This permeability commonly causes petrifaction colors to be aligned with the wood grain (Figure 15).
An important aspect of stepwise mineralization is that differential permeability may persist in partially mineralized wood. One example is during incipient stages of silicification, when cell walls incorporate silica, but lumen remain open. In this situation, the permeability of groundwater resembles the direction of fluid transport in the orignal wood (Figure 16). The primary permeability is lengthwise, but because adjacent tracheids are connected by intervessel pits, fluids may also diffuse radially. If these pits remain open during early petrifaction, or if tracheid walls become fractured, mineral-bearing groundwater may migrate laterally. Because of their larger diameter, conductive vessels in angiosperm wood may remain open after tracheids have become mineralized; subsequent precipitation episodes may cause these vessels to be mineralized with silica of a different color.
8.2. Multiple Episodes of Permineralization
Complex color patterns commonly result when wood becomes mineralized in a series of discrete episodes. Silicification does not always follow a single pathway [26]. The first step typically involves precipitation of amorphous silica on cell walls, a process of “organic templating” caused by the molecular affinity of cellulose and lignin for silica [27]. Later steps include filling of intracellular spaces, cell lumina, and conductive vessels (Figure 17). If these steps in the permineralization process occur in discrete episodes, the concentration of elements in groundwater may change, along with pH, eH, and temperature. These variations may cause various anatomical features to be permineralized in different colors.
8.3. Diffusion
Percolation of groundwater in ancient wood affects color in several ways. In wood that retains permeability, transport of colorants may involve longtitudinal and radial diffusion. Unlike the initial directional infiltration described above, these diffusion zones may cause more generalized color patterns (Figure 18).
8.4. Bleaching
Previously-precipitated compounds may be dissolved during subsequent episodes of groundwater infiltration, producing a local lightening of color. External surfaces may simply be bleached as a result of removal of colorants, but in interior regions dissolved colorants may be reprecipitated to create a darkened halo bordering the bleached area (Figure 19).
8.5. Chromatography
Color variations created by remobilization of colorants suggests the possibility that trace elements can be segregated by a process of natural chromatography, where soluble components separate into discrete zones as they travel through porous substrate. Two laboratory applications of chromatography may be relevant. Paper chromatography uses a sheet of filter paper as the stationary phase, akin to the porous cellulose/lignin structure of unmineralized wood. Thin-layer chromatography employs a glass plate coated with inert powder (commonly silica gel), similar to the porous nature of wood that is in early stages of silicification. In both types of chromatography, the separation of constituent compounds is controlled by differences in polarity between the individual compounds, the solvent that transports them, and the porous solid. In natural environments, the solvent is water, a strongly polar material. In paper chromatography, polar molecules bind to the polar cellulose fibers of the absorbant paper. In thin-layer chromatography, silica gel is likewise a polar substance, producing similar separation patterns. Chromatographic separation has not previously been suggested as a cause of silicified wood color patterns, but the processes appears to be common (Figure 20).
8.6. Internal Voids and Open Fractures
Petrifaction commonly begins with precipitation of silica in small spaces: cell wall interstices, followed by tracheid lumina and intercellular spaces [26]. Larger openings (e.g., vessels), and voids left by decay or fracturing may remain open long after the wood has reached a stage of initial silicification. These openings may allow later episodes of groundwater infiltration, when changes in trace element abundance or changes in pH/eH/temperature influence coloration (Figure 21).
In later stages of petrifaction, widespead silicification may greatly limit permeability. This permineralization increases the brittleness of the fossilized wood; stresses may result in fracture zones that may provide conduits for fluid. Groundwater penetrating along these fractures can produced localized bleaching, precipitation, or chromatographic redistribution. These processes may produce a heterogeneous distribution within a single specimen (Figure 22).
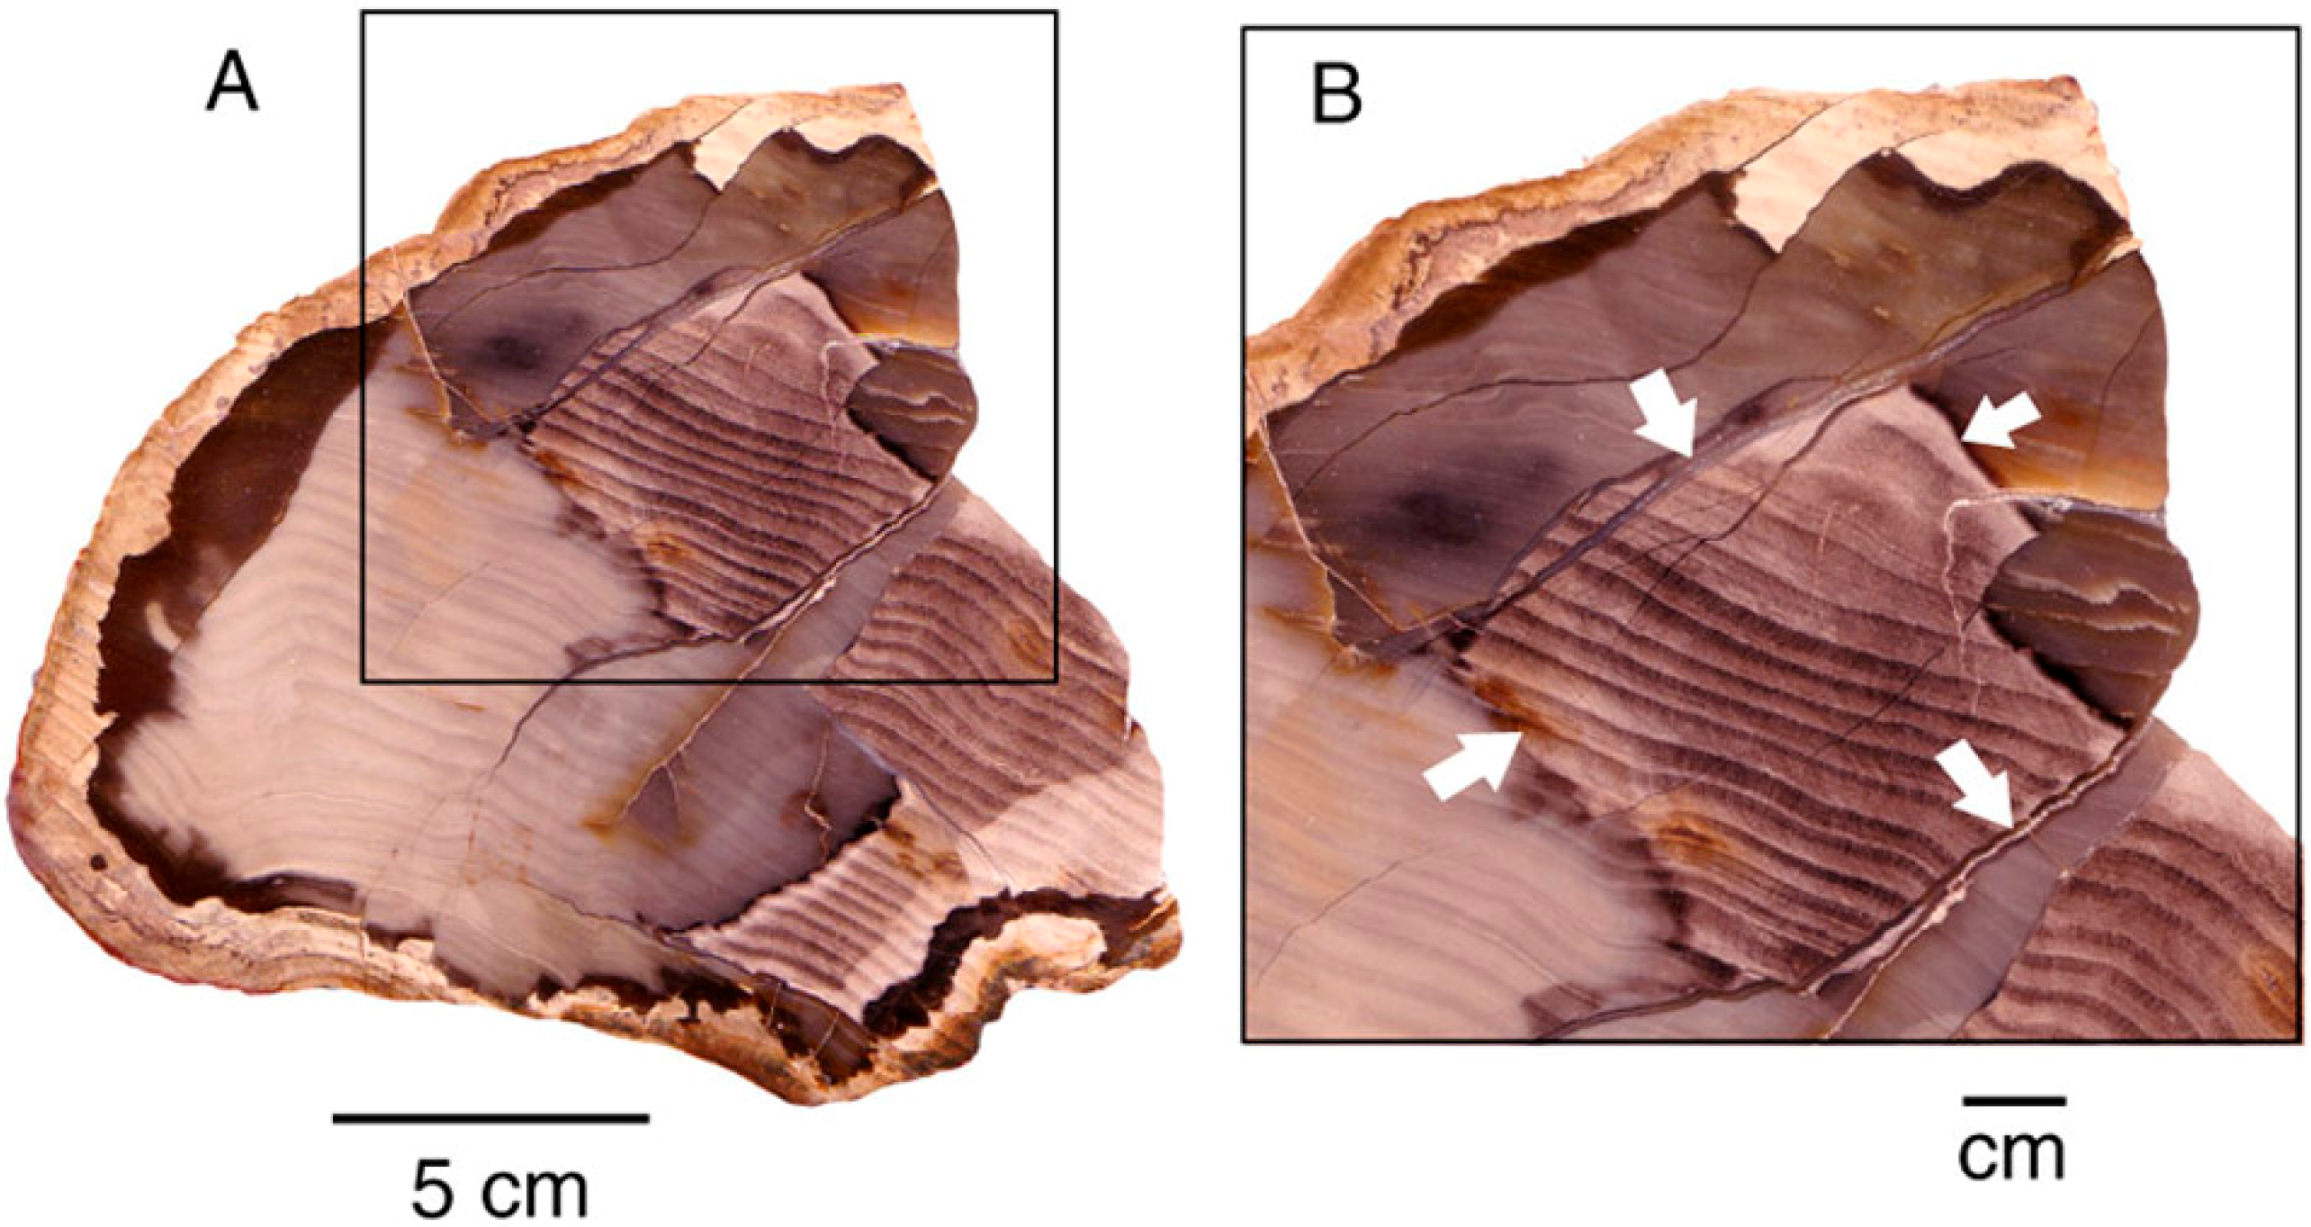
If fractures become filled with silica, wood color may become compartmentalized, where certain regions are no longer subject to infiltration by groundwater, even though the material within these zones retains permeability (Figure 23).
8.7. Oxidation/Reduction
In the above examples, percolation of groundwater through permeable wood produced color changes by local precipitation or dissolution of mineral pigments. However, color changes may be caused by changes in redox conditions. In this case, the concentration of mineral pigments may remain constant, but changes in their oxidation states may cause color change. This color change is evident in specimens from Hampton Butte, Oregon, USA. Despite a long history of avocational collecting, the locality has not been studied in detail. Silicified logs show evidence of decay prior to fossilization; permineralized tissues commonly are highly brecciated, showing multiple episodes of silica deposition. Specimens may be light brown, dark green, or bright red, with void spaces filled with white quartz or chalcedony. Variations in structure and coloration are evidence of a complex diagenetic history, but green is the most common color for Hampton Butte speciemns. Specimens may show abrupt color transitions or complex variegations (Figure 24). LA-ICP-MS analyses show that Fe is the dominant trace element in both red and green phases, suggesting that the color variations result from localized oxidation /reduction effects.
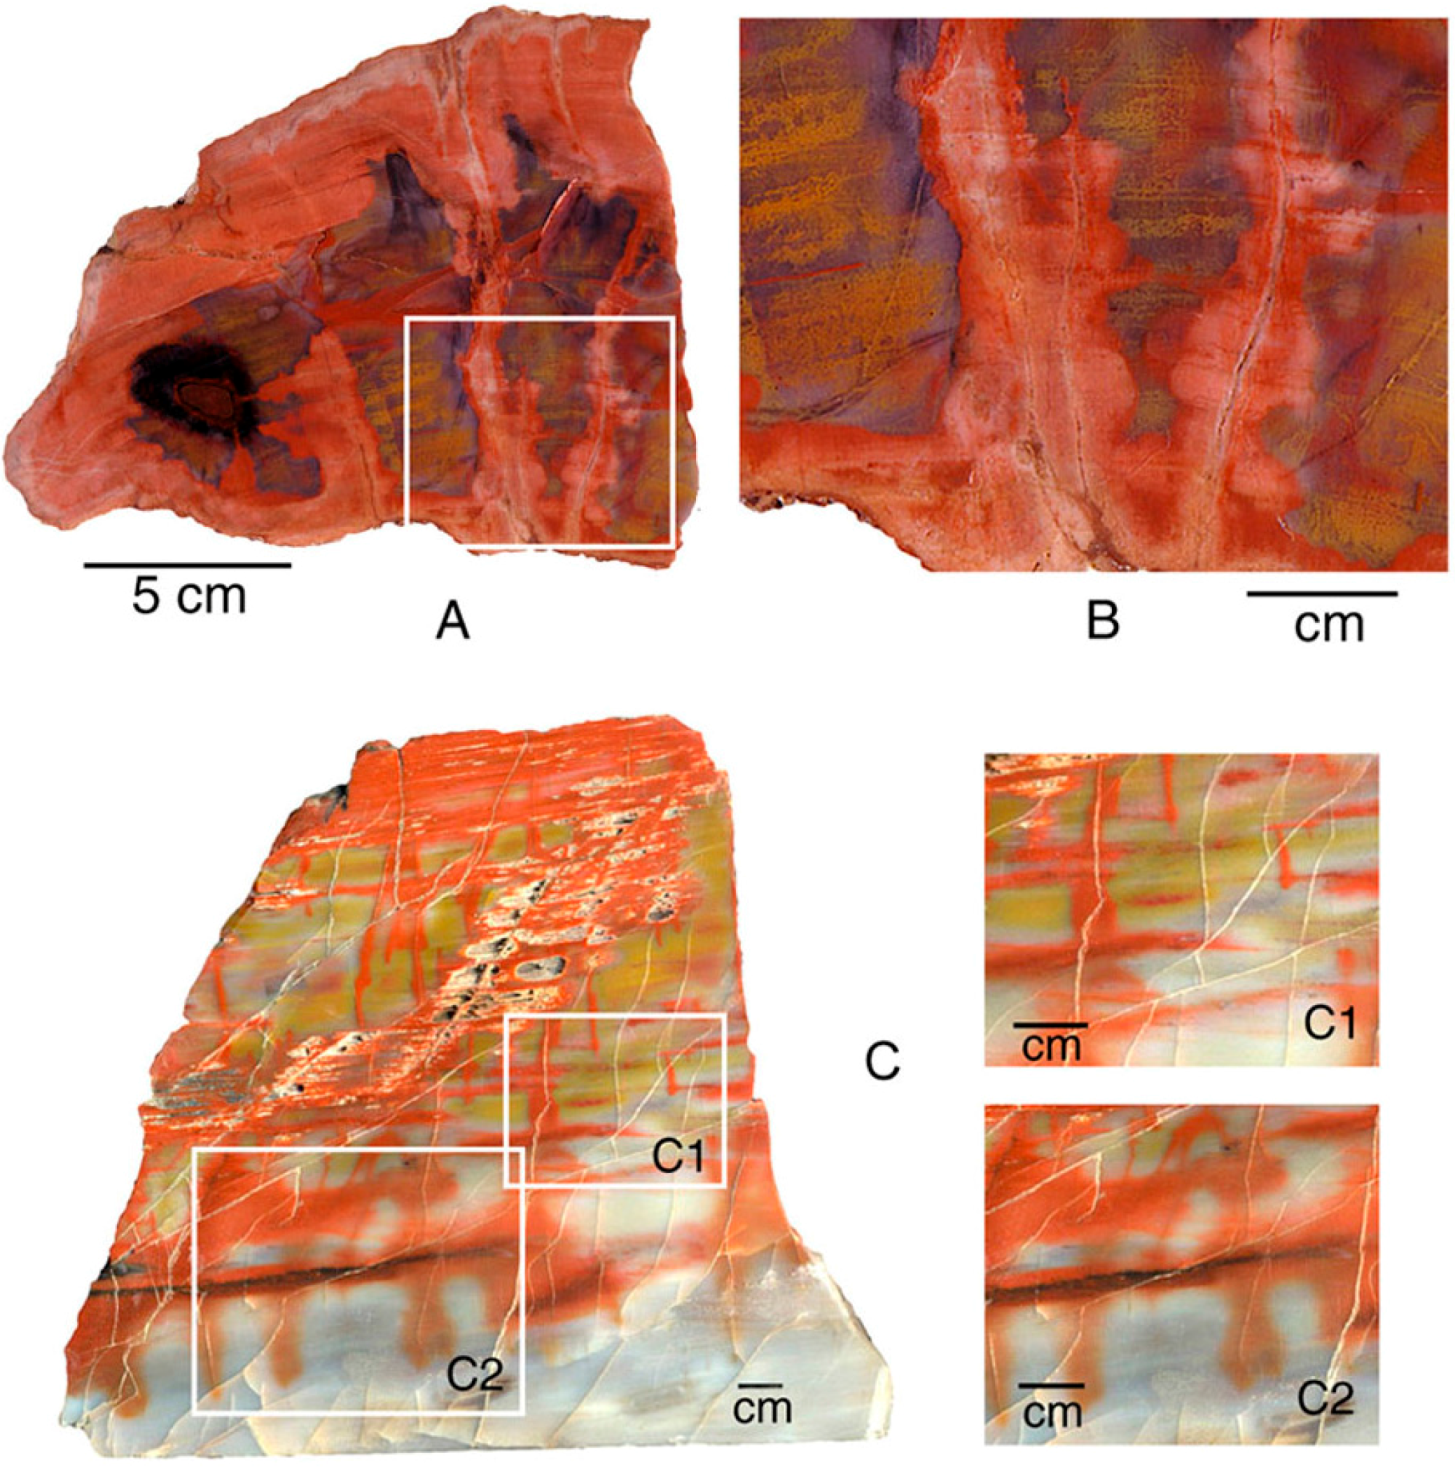
A different type of oxidation occurs in Triassic wood from the Chinle Formation in Arizona, USA. Specimens, including intact logs and small wood fragments, commonly show red exterior zones indicative of the presence of iron oxides. This red coloration commonly extends into the interior regions along fractures. This phenomenon is evidence that the red iron infiltration occurred late in the diagenetic history, when the wood had been permineralized to a state of brittleness. However, the “fuzzy” color patterns bordering the fractures indicates that the wood still retained some degree of permeability (Figure 22 and Figure 23). Figure 25 shows an Oregon specimen where iron-bearing solutions absorbed along wood grain show three color zones. LA-ICP-MS analyses show that Chinle Formation color variations are caused by the abundance of Fe, with the exception of bright green wood colored by Cr. Color variations are presumably caused by differences in concentration and oxidation state of Fe, but the Arizona wood color patterns show considerably more gradation than specimens from Hampton Butte, Oregon, USA. Perhaps these color transitions originated in early stages of permineralization, when precipitation, remobilization, and oxidation/reduction effects occurred at a time when the wood retained a degree of longitudinal permeability (Figure 26 and Figure 27).
8.8. Relict Organic Matter
The amount of original organic matter that remains after permineralization is variable, but generally rather small [28]. However, at some localities, relict organic constituents may be a major cause of silicified wood color. Most commonly, the original consituents of wood, primarily lignin and hemicellulose, have been altered to carbonaceous degradation products, producing dark brown hues (Figure 28). These compounds can be detected in several simple ways. One method is to heat the powdered fossil wood under aerobic conditions at 450 °C for a few hours. Combustion of organic matter causes the color of the powder to lighten to tan or white. In woods silicified with quartz or chalcedony, the percentage of original wood that remained after fossilization can be quantitatively estimated [28]. Soaking the specimen in 8% sodium hypochlorate solution for a few hours also causes bleaching The presence of organic matter can also be evaluated using X-ray fluorescence spectrometry in combination with scanning electron microscopy (SEM/EDS), based on the magnitude of the carbon X-ray peak.
9. Conclusions
LA-ICP-MS analyses of trace elements shows that most pastel and bright colors are caused by Fe in varying abundances and oxidation states. Iron is likely present as nanoparticle-sized ferruginous minerals. Dark green colors may result from ferrous iron minerals, but bright green hues correlate with elevated levels of chromium. Relict organic matter may influence silicified wood color, particularly in brown specimens.
The distribution of colorants within a single specimen may be caused by a variety of factors, which sometimes combine to produce patterns of great complexity (Figure 29). Because wood commonly becomes mineralized in a series of steps, changes in groundwater geochemistry may cause varying colors to be precipitated during successive episodes of mineralization. During early stages, wood may retain directional permeabilty because of cellular architecture. Later, penetration of groundwater along fractures or other open spaces may cause additional colors to appear. Neither the geologic age of the specimens or their taxonomy appear to be important for determining petrifaction colors. More important are the availability of dissolved trace metals in percolating groundwater and a mineralization sequence that proceeds in sucessive stages.
This report is based on analysis and observation from fossil wood specimens that span a wide range of ages and geographic occurrences, but these specimens provide only a miniscule representation of fossil forests that occur throughout the world. Our data and interpretations will hopefully provide a starting point for research by other investigators. Possibilities for future research include quantitative chemical analyses of specimens from other localities and interpretation of the origin of color patterns. Colorant dispersal mechanisms proposed in this report could also be investigated under experimental conditions in the laboratory.
Acknowledgments
Western Washington University Advanced Materials Science and Engineering Center lab managers Polly Berseth and Kyle Mikkelsen provided technical assistance and access to the LA-ICP-MS laboratory. Specimens were provided for study by Richard Dayvault, Richard Rantz, and Jim Mills. Leah Boam polished many samples. Jim Mills and Mike Viney provided helpful comments on an early draft. This paper is dedicated to the memory of Richard Dayvault (1948-2015), a geochemist and petrified wood expert who for many years generously shared his wealth of knowledge with avocational collectors and professional geoscientists.
Author Contributions
Both authors participated in experimental design, data acquisition and interpretation, and preparation of the manuscript.
Conflicts of Interest
The authors declare no conflict of interest.
Appendix

| Location | Age | Color | Pantone Color # | Ti | V | Cr | Mn | Fe | Co | Ni | Cu | U | |
|---|---|---|---|---|---|---|---|---|---|---|---|---|---|
| Green Wood | |||||||||||||
| Zimbabwe | Triassic | Light green | 7494C | 57 | 51 | 10,400 | 37 | 2465 | 12 | 28 | 34 | 1 | |
| Winslow AZ 1 | Triassic | Light green | 625C | 12 | 140 | 9600 | 38 | 293 | 9 | 8 | 7 | 3 | |
| Winslow AZ 2 | Triassic | Light green | 624C | 427 | 209 | 13,000 | 263 | 9900 | 80 | 176 | 69 | 2 | |
| Nye Co. NV | Miocene | Light green | 7494C | 41 | 41 | 6 | 33 | 2413 | 0.2 | 2 | 52 | 51 | |
| Holbrook AZ | Triassic | Dark green | 5545C | 244 | 24 | 10 | 46 | 3570 | 3 | 16 | 105 | 0.1 | |
| Nazlini AZ | Triassic | Dark green | 5535C | 2280 | 122 | 142 | 1690 | 16,100 | 49 | 30 | 102 | 9 | |
| Hampton Butte OR | Miocene | Dark green | 560c | 141 | 2 | 7 | 30 | 300 | 1 | 11 | 59 | 0.3 | |
| Hampton Butte OR | Miocene | Dark green | 555c | 326 | 46 | 31 | 87 | 14,280 | 5 | 21 | 33 | 0.2 | |
| Winslow AZ | Triassic | Dark green | 560C | 28 | 63 | 9030 | 16 | 974 | 10 | 39 | 29 | 2 | |
| Red Wood | |||||||||||||
| Holbrook AZ | Triassic | Red | 491C | 10 | 3 | 4 | 67 | 2030 | 0.1 | 7 | 15 | 8 | |
| Holbrook AZ | Triassc | Red | 483C | 37 | 5 | 1 | 47 | 1430 | 0.3 | 7 | 32 | - | |
| Nazlini AZ | Triassic | Red | 491C | 16 | 2 | 5 | 120 | 2520 | 0.3 | 8 | 11 | 15 | |
| Hampton Butte OR | Miocene | Red | 499C | 16 | 57 | 2 | 7 | 723 | 1 | 6 | 24 | 3 | |
| Texas Spring NV | Miocene | Red | 484C | 4 | 4 | 4 | 18 | 92 | 0.1 | 4 | 7 | 4 | |
| Madagascar | Jurassic | Brownish red | 484C | ||||||||||
| Rainbow Colors | |||||||||||||
| Nazlini AZ | Triassic | Orange | 131C | 9 | 1 | 1 | 40 | 1035 | 0.2 | 2 | 6 | 6 | |
| Nazlini AZ | Triassic | Yellow | 127C | 3 | 1 | 4 | 22 | 248 | 1 | 5 | 10 | 1 | |
| Holbrook AZ | Triassic | Yellow | 128C | 26 | 3 | 1 | 18 | 510 | 0.2 | 6 | 37 | - | |
| Holbrook AZ | Triassic | Light purple | 505C | 19 | 2 | 0.3 | 14 | 413 | 0.1 | 4 | 14 | - | |
| Holbrook AZ | Triassic | Dark purple | 5205C | 18 | 3 | 5 | 33 | 750 | 0.4 | 18 | 37 | - | |
| Nazlini AZ | Triassic | Orange | 1385C | 9 | 1 | 1 | 40 | 1035 | 0.2 | 2 | 6 | 6 | |
| Nazlini AZ | Triassic | Yellow | 1215C | 3 | 1 | 4 | 22 | 248 | 1 | 5 | 10 | 1 | |
| Nazlini AZ | Triassic | Pale pink | 217C | 2 | 1 | 3 | 9 | 495 | 0.0 | 4 | 5 | 0.0 | |
| White, Clear | |||||||||||||
| Nazlini AZ | Triassic | Clear | 1C | 8 | 1 | 1 | 3 | 35 | 0.1 | 3 | 5 | 8 | |
| Holbrook AZ | Triassic | Clear | 1C | ||||||||||
| Nye Co. NV | Miocene | Clear | 1C | 18 | 2 | 1 | 0 | 0 | 0 | 5 | 28 | - | |
| Holbrook AZ | Triassic | Clear | 1C | 8 | 1 | 1 | 3 | 35 | 0.1 | 3 | 5 | 0.0 | |
| Nye Co. NV | Miocene | White | 1C | 20 | 4 | 7 | 20 | 171 | 0.2 | 5 | 13 | 5 | |
| Texas Spring NV | Miocene | White | 7499C | 18 | 3 | 2 | 0 | 21 | 0 | 14 | 26 | - | |
| Holbrook Az | Triassic | Pinkish white | 5175C | 22 | 2 | 2 | 12 | 265 | 0.2 | 8 | 36 | 14 | |
| Brown, Black: | |||||||||||||
| Hampton Butte OR | Miocene | Medium brown | 463C | 2330 | 65 | 33 | 72 | 9046 | 5 | 23 | 36 | 1 | |
| Nye Co. NV | Miocene | Medium brown | 463C | ||||||||||
| Nye Co. NV | Miocene | Black | 447C | 28 | 8 | 3 | 9 | 250 | 0.3 | 5 | 16 | 3 | |
| Holbrook AZ | Triassic | Black stripe | 6C | 3 | 9 | 23 | 15 | 126 | 0.1 | 6 | 10 | 6 | |
| Nye Co. NV | Miocene | Gold | 19 | 2 | 3 | 0 | 342 | 0 | 9 | 13 | - | ||
| Texas Spring NV | Miocene | Dark brown | 7519C | 6 | 7 | 2 | 2 | 43 | 0.1 | 8 | 11 | 5 | |
| Nye Co NV | Miocene | Dark brown | 356 | 847 | 167 | 9 | 5870 | 6 | 8 | 24 | |||
| Goose Creek NV | Miocene | Medium Brown | 464C | 5 | 1 | 4 | 14 | 133 | 0.1 | 9 | 18 | 11 | |
| Goose Creek NV | Miocene | Tan | 466C | 23 | 2 | 8 | 23 | 225 | 0.4 | 22 | 48 | 1 | |
| Hampton Butte OR | Miocene | Golden brown | 463C | 16 | 57 | 2 | 7 | 723 | 1 | 6 | 24 | 3 | |
References
- Rossman, G.R. The colored varieties of the silica minerals. In Reviews in Mineralogy; Haney, P.J., Ed.; Mineralogical Society of America: Washington, DC, USA, 1994; pp. 433–468. [Google Scholar]
- Fritsch, E.; Rossman, G.R. An update on color in gems, part 1: Introduction and colors caused by dispersed metal ions. Gems Gemol. 1987, 23, 126–139. [Google Scholar] [CrossRef]
- Fritsch, E.; Rossman, G.R. An update on color in gems, part 2: Colors caused by charge transfers and color centers. Gems Gemol. 1988, 24, 3–15. [Google Scholar] [CrossRef]
- Fritsch, E.; Rossman, G.R. An update on color in gems, part 3: Colors caused by physical optics. Gems Gemol. 1988, 24, 81–103. [Google Scholar] [CrossRef]
- Fritsch, E.; Rossman, G.R. L’origine de la couleur dans les gemmes: 1ère partie. Rev. Gemmol. 1999, 137, 10–16. [Google Scholar]
- Fritsch, E.; Rossman, G.R. L’origine de la couleur dans les gemmes: 2ème partie. Rev. Gemmol. 1999, 138–139, 55–61. [Google Scholar]
- Loeffler, B.M.; Burns, R.G. Shedding light in the color of gems and minerals. Am. Sci. 1976, 54, 636–647. [Google Scholar]
- Rapp, G. Color of Minerals, ESCP Pamphlet Series PS-6; Houghton Mifflin Co.: Boston, MA, USA, 1971. [Google Scholar]
- Petrified wood color and petrification. Available online: http://scienceviews.com/parks/woodcolors.html (accessed on 5 May 2016).
- Petrified wood color. Available online: http://www.rockhounds.org/petrified-wood-colors/ (accessed on 5 May 2016).
- Sigleo, A.C. Geochemistry of silicified wood and associated sediments, Petrified Forest National Park, Arizona. Chem. Geol. 1979, 26, 151–163. [Google Scholar] [CrossRef]
- Daniels, F.J.; Dayvault, R.D. Ancient Forests. A Closer Look at Petrified Wood; Western Colorado Publishing Company: Grand Junction, CO, USA, 2006. [Google Scholar]
- Ash, S. Petrified Forest, a Story in Stone; Petrified Forest Museum Association: Petrified Forest, AZ, USA, 2005. [Google Scholar]
- Scott, A.C. Charcoal recognition, taphonomy, and uses in paleoenvironmental analysis. Palaeogeogr. Palaeoclimatol. Palaeecol. 2010, 291, 11–39. [Google Scholar] [CrossRef]
- Nassau, K. The origin of color in minerals. Am. Mineral. 1978, 63, 219–229. [Google Scholar]
- Cornell, R.M.; Schwertmann, U. The Iron Oxides: Structure, Reactions, Occurrences, and Uses; VCH Verlag GmbH & Co.: Weinheim, Germany, 1996. [Google Scholar]
- Barrón, V.; Torrent, J. Iron, manganese, and aluminum oxides and hydroxides. In EMU Notes in Mineralogy, vol. 14, Environmental Mineralogy II; Vaughan, D.J., Wogelius, R.A., Eds.; European Mineralogical Union: London, UK, 2013; pp. 297–336. [Google Scholar]
- Kerker, M.; Scheiner, P.; Cooke, D.D.; Kratohvil, J.P. Absorbance index and color of colloidal hematite. J. Colloid Interface Sci. 1979, 71, 176–187. [Google Scholar] [CrossRef]
- Hund, F. Inorganic pigments: Basis for colored, uncolored and transparent properties. Angew. Chem. Int. Ed. Eng. 1981, 20, 723–730. [Google Scholar] [CrossRef]
- Torrent, J.; Schwertmann, U.; Fechter, H.; Alferez, F. Quantitative relationship between soil color and hematite content. Soil Sci. 1983, 136, 354–358. [Google Scholar] [CrossRef]
- Ruby, C. Green rust and related iron containing compounds: Structure, redox properties and environmental applications: Part 1. Curr. Inorg. Chem. 2015, 5, 152–155. [Google Scholar] [CrossRef]
- Troulard, F.; Génin, J.M.R.; Abdelmoula, M.; Bourrié, G.; Humbert, B.; Herbillon, A. Identification of a green rust mineral in a reductomorphic soil by Mossbaur and Raman spectroscopies. Geochim. Cosmochim. Acta 1997, 61, 1107–1111. [Google Scholar] [CrossRef]
- Génin, J.-M.R.; Mills, S.J.; Christy, A.G.; Guérin, O.; Herbillon, A.J.; Kuzmann, E.; Ona-Nguema, G.; Ruby, C.; Upadhyay, C. Mössbauerite, Fe3+6O4(OH)8(CO3)·3H2O, the fully oxidized ‘green rust’ mineral from Mont Saint-Michel Bay, France. Mineral. Mag. 2014, 78, 447–465. [Google Scholar]
- Mills, S.J.; Christy, A.G.; Genin, J.-M.R.; Kameda, T.; Colombo, F. Nomenclature of the hydrotalcite supergroup: Natural layered double hydroxides. Mineral. Mag. 2012, 76, 1289–1336. [Google Scholar] [CrossRef]
- Young, H.E.; Gunn, V.P. Chemical elements in complete mature trees of seven species in Maine. TAPPI 1976, 49, 190–197. [Google Scholar]
- Mustoe, G.E. Late tertiary petrified wood from Nevada, USA: Evidence for multiple silicification pathways. Geosciences 2015, 5, 286–309. [Google Scholar] [CrossRef]
- Leo, R.F.; Barghoorn, E.S. Silicification of wood. Harv. Univ. Mus. Leafl. 1976, 25, 1–47. [Google Scholar]
- Mustoe, G.E. Density and loss on ignition as indicators of the fossilization of silicified wood. IAWA J. 2016, 37, 98–111. [Google Scholar] [CrossRef]
Figure 1.
Samples for elemental analyses were prepared as microscope slides that contain several polished specimens. Laser tracks are visible in reflected light (upper right) and SEM photomicrographs (lower right).
Figure 1.
Samples for elemental analyses were prepared as microscope slides that contain several polished specimens. Laser tracks are visible in reflected light (upper right) and SEM photomicrographs (lower right).

Figure 2.
Green silicified wood. (A) Zimbabwe, Africa; (B) Hampton Butte, Deschutes County, Oregon, USA; (C) Nazlini Canyon, Apache County, Arizona, USA; (D) Winslow, Navajo County, Arizona, USA; (E) Nye County, Nevada, USA.
Figure 2.
Green silicified wood. (A) Zimbabwe, Africa; (B) Hampton Butte, Deschutes County, Oregon, USA; (C) Nazlini Canyon, Apache County, Arizona, USA; (D) Winslow, Navajo County, Arizona, USA; (E) Nye County, Nevada, USA.

Figure 3.
Trace element levels in green silicified wood.

Figure 4.
(A) Triassic Chinle Formation, Nazlini Canyon, Apache County, Arizona, USA; (B) Triassic, Madagascar, Africa; (C) Triassic Chinle Formation, Holbrook, Navajo County, Arizona, USA.
Figure 4.
(A) Triassic Chinle Formation, Nazlini Canyon, Apache County, Arizona, USA; (B) Triassic, Madagascar, Africa; (C) Triassic Chinle Formation, Holbrook, Navajo County, Arizona, USA.

Figure 5.
Trace element levels in red silicified wood.

Figure 6.
Silicified wood from Triassic Chinle Formation: (A) Holbrook, Navajo County, Arizona, USA. Squares show color zones analyzed for trace elements; (B,C) Nazlini Canyon, Apache County, Arizona, USA.
Figure 6.
Silicified wood from Triassic Chinle Formation: (A) Holbrook, Navajo County, Arizona, USA. Squares show color zones analyzed for trace elements; (B,C) Nazlini Canyon, Apache County, Arizona, USA.

Figure 7.
Trace elements in “rainbow wood” from Triassic Chinle Formation, Holbrook, Arizona, USA. Note that compared to other histograms in this paper, X and Y axis labels are reversed to more clearly show the relation of wood color to Fe concentration.
Figure 7.
Trace elements in “rainbow wood” from Triassic Chinle Formation, Holbrook, Arizona, USA. Note that compared to other histograms in this paper, X and Y axis labels are reversed to more clearly show the relation of wood color to Fe concentration.

Figure 8.
Trace elements in black, white, and clear silicified wood.

Figure 9.
Black “desert varnish” penetrating fractures, Holbrook, Arizona, USA.

Figure 10.
Trace element levels in brown silicified wood. Light brown bars represent tan wood, other bars represent darker shades of brown.
Figure 10.
Trace element levels in brown silicified wood. Light brown bars represent tan wood, other bars represent darker shades of brown.

Figure 11.
(A) Silicified Triassic wood from Madagascar owes its red color to discrete Fe-rich zones present within the permineralized tissue; (B) Uniform red color in Triassic “Araucarioxylon” wood from Holbrook, Arizona. USA, showing two adjacent tracheids, with well-preserved bordered pits.
Figure 11.
(A) Silicified Triassic wood from Madagascar owes its red color to discrete Fe-rich zones present within the permineralized tissue; (B) Uniform red color in Triassic “Araucarioxylon” wood from Holbrook, Arizona. USA, showing two adjacent tracheids, with well-preserved bordered pits.

Figure 12.
Miocene wood from Grassy Mountain, Lane County, Oregon, USA. The light-colored chalcedony has orange zones caused when iron minerals were later deposited within open pores and fractures. (A), Transverse vew showing annual rings, with ferrugionous zones concentrated near exterior surface and along radial fractues; (B), Close-up view showing vessels containing iron oxides.

Figure 13.
Triassic Chinle Formation, Petrified Forest National Park, Arizona, USA. (A) “Painted Desert” shows beds of weathered volcaniclastic sediment that range from bland to very colorful. Fe is the predominate source of color [9]; (B) Bright-colored slicified logs weathered from pale-colored strata; (C) Logs weathered from reddish beds; (D) Wood containing variegated yellow and red colors preserved in volcaniclastic matrix that contains yellow and red color patches.

Figure 14.
(A) Eocene Clarno Formation Painted Hills locality; (B) Collecting wood from soil at Hampton Butte, Oregon, USA; (C–E) Freshly-excavated specimens. Dark green is the predominate color, while red zones appear to result from oxidation.
Figure 14.
(A) Eocene Clarno Formation Painted Hills locality; (B) Collecting wood from soil at Hampton Butte, Oregon, USA; (C–E) Freshly-excavated specimens. Dark green is the predominate color, while red zones appear to result from oxidation.

Figure 15.
Scanning electron microscope image of modern conifer wood cut in transverse section, showing rectangular tracheids connected to one another along their radial walls by circular pits.
Figure 15.
Scanning electron microscope image of modern conifer wood cut in transverse section, showing rectangular tracheids connected to one another along their radial walls by circular pits.

Figure 16.
Permineralization commonly proceeds according to the permeability variations, causing color patterns to reflect the tree’s original anatomy. (A) Miocene wood from Saddle Mountain, Grant County, Washington, USA; (B) Miocene wood from Hubbard Basin, Elko County, NV, USA.
Figure 16.
Permineralization commonly proceeds according to the permeability variations, causing color patterns to reflect the tree’s original anatomy. (A) Miocene wood from Saddle Mountain, Grant County, Washington, USA; (B) Miocene wood from Hubbard Basin, Elko County, NV, USA.
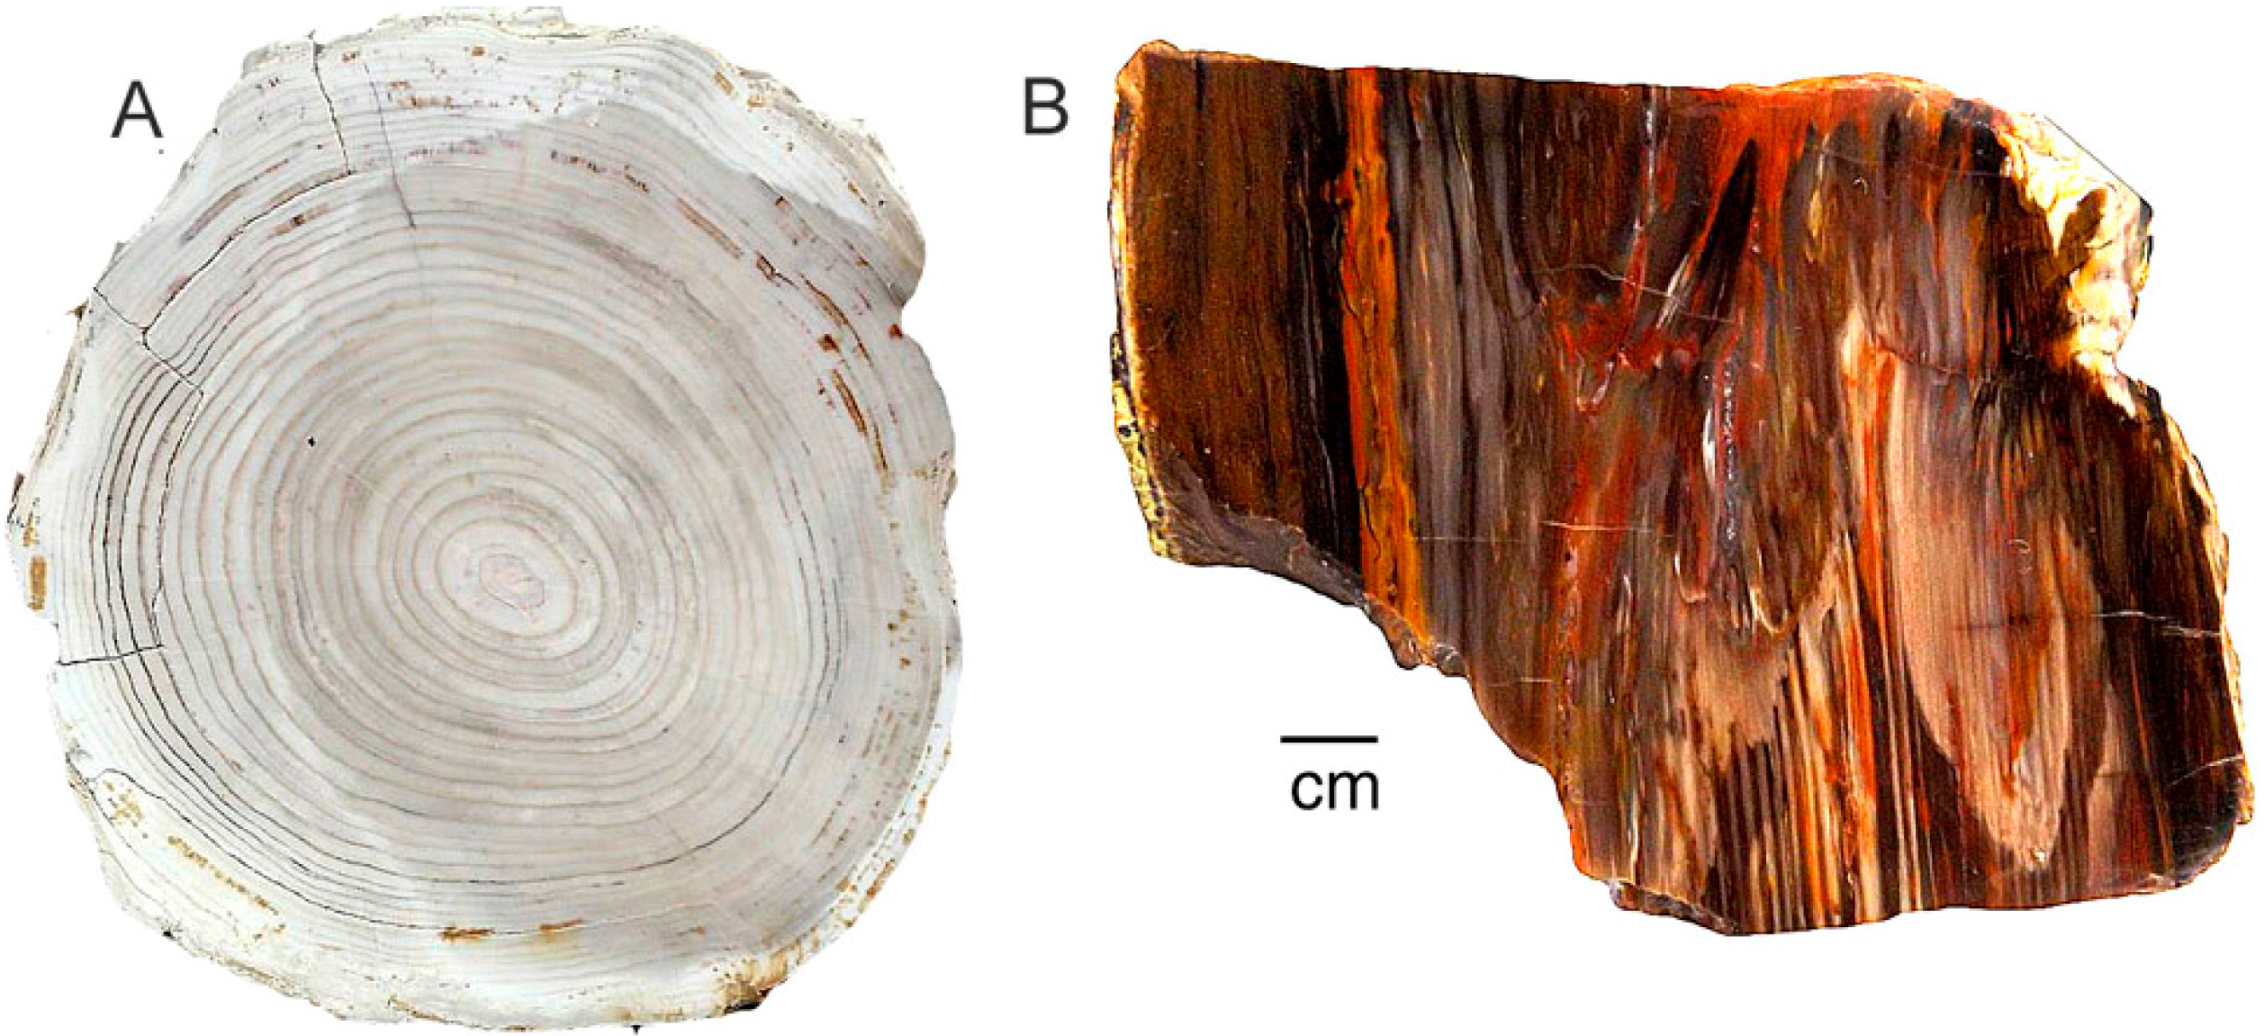
Figure 17.
Wood may retain directional permeability during early stages of permineralization, as evidenced by Miocene opalized wood from Nevada, USA. (A,B) Transverse views of wood from Virgin Valley, Humbold County, showing tracheids with open lumina; (C) Conifer wood from Lyon County, oblique view of a tracheid showing mineralized cell walls with well-preserved pits and empty lume; (D) Transverese view of Virgin Valley wood showing mineralized tracheids, with non-mineralized intercellular spaces.

Figure 18.
Diffusion of mineral-bearing groundwater along wood grain may cause color patterns. (A,B) Miocene conifer wood, Saddle Mountain, Grant County, Washington, USA; (C) Miocene Prunus wood, McDermitt, Malhuer County, OR, USA.
Figure 18.
Diffusion of mineral-bearing groundwater along wood grain may cause color patterns. (A,B) Miocene conifer wood, Saddle Mountain, Grant County, Washington, USA; (C) Miocene Prunus wood, McDermitt, Malhuer County, OR, USA.
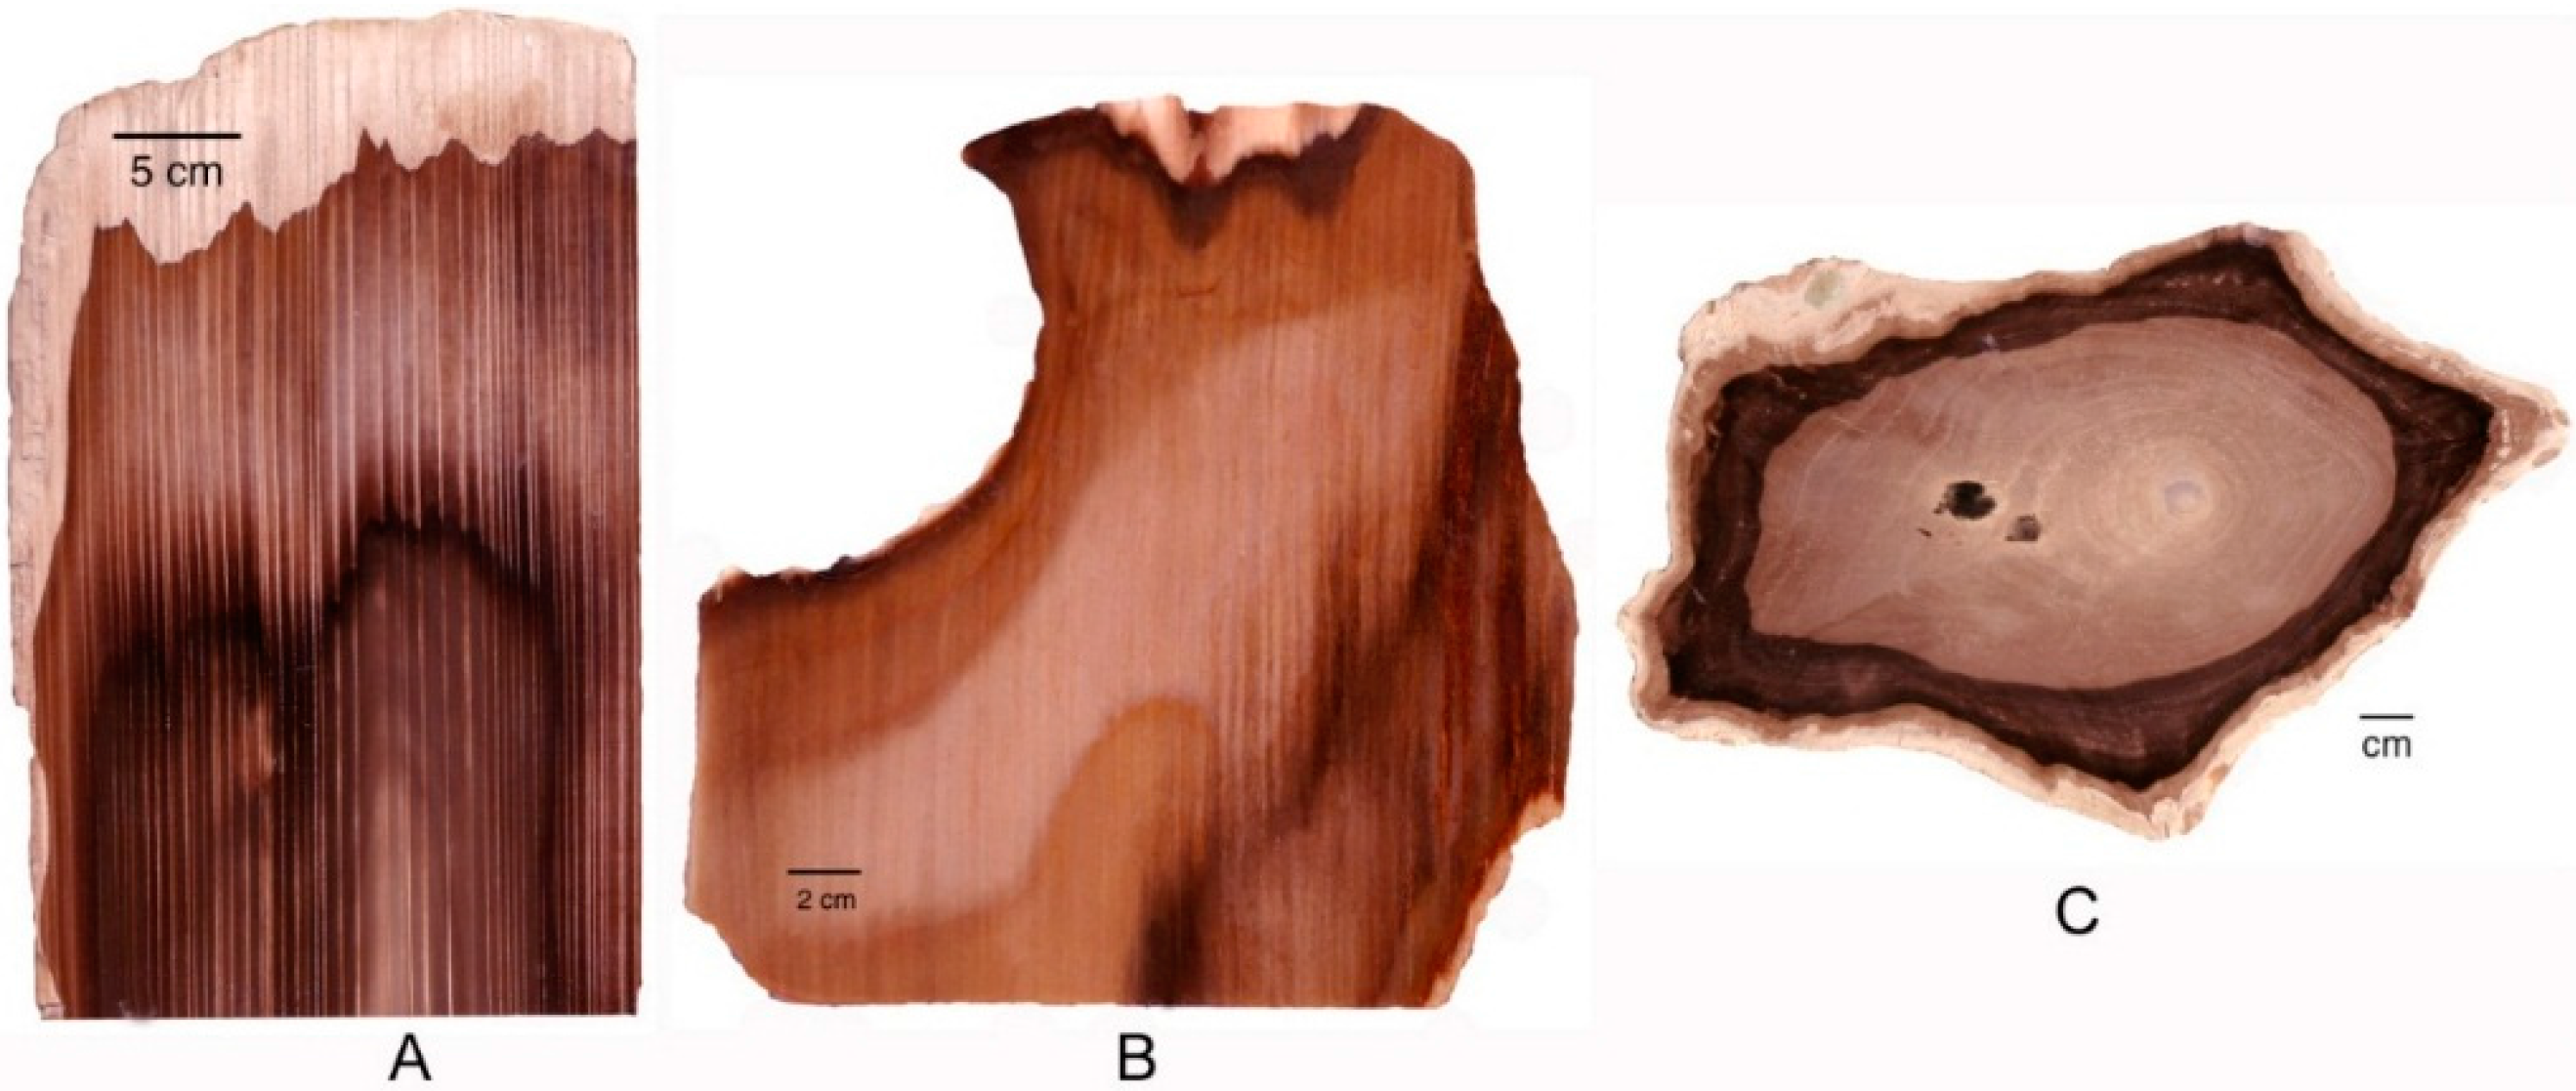
Figure 19.
Miocene wood from McDermitt, Malheur County, Oregon, USA, showing bleached zones following fractures and voids caused by wood rot. (A), Longitudinal view; (B), Transverse view.
Figure 19.
Miocene wood from McDermitt, Malheur County, Oregon, USA, showing bleached zones following fractures and voids caused by wood rot. (A), Longitudinal view; (B), Transverse view.

Figure 20.
When trace elements are mobilized and infiltration of groundwater, development of bands may result from a process of chromatographic separation. Samples of Miocene wood from Cherry Creek, White Pine County, NV, USA. (A,B), Longitudinal views; (C) Transverse view , with close-up image (D).

Figure 21.
Red patterns in Miocene wood from Hubbard Basin, Elko County, Nevada, USA, follow open voids created by decay and along fractures; (A) Transverse view, with close-up image (B).
Figure 21.
Red patterns in Miocene wood from Hubbard Basin, Elko County, Nevada, USA, follow open voids created by decay and along fractures; (A) Transverse view, with close-up image (B).

Figure 22.
Red zones follow fractures in Triassic wood from the Chinle Formation, Holbrook, Navajo County, Arizona, USA. (A, B), Transverse views showing coloration following radial fractures; (C), Coloration following radial fractures and extending along interfaces between adjacent annual rings.
Figure 22.
Red zones follow fractures in Triassic wood from the Chinle Formation, Holbrook, Navajo County, Arizona, USA. (A, B), Transverse views showing coloration following radial fractures; (C), Coloration following radial fractures and extending along interfaces between adjacent annual rings.

Figure 23.
(A), Geometric color patterns caused when areas of Miocene wood have been isolated by chalcedony-filled fractures); (B) Close-up view of distinct color boundaries controlled by silicified fractures, marked with arrows. Specimen from Rogers Mountain, Lynn County, Oregon, USA.
Figure 23.
(A), Geometric color patterns caused when areas of Miocene wood have been isolated by chalcedony-filled fractures); (B) Close-up view of distinct color boundaries controlled by silicified fractures, marked with arrows. Specimen from Rogers Mountain, Lynn County, Oregon, USA.

Figure 24.
Eocene wood from Hampton Butte, Deschutes County, Oregon, USA, commonly contains green/red patterns caused by localized oxidation/reduction of Fe. (A, Light colored zones are chalcedony deposited during a late stage of mineralization; (B–D), Red and green zones have well-defined contacts; (E) variegated pattern comprised of green wood, red oxidation, and translucent chalcedony; (F), Red and green zones show complex intermixing.

Figure 25.
Iron-bearing solutions infiltrating along fibers in Miocene wood from central Oregon, USA, show a redox gradient that produces well-defined color zones.
Figure 25.
Iron-bearing solutions infiltrating along fibers in Miocene wood from central Oregon, USA, show a redox gradient that produces well-defined color zones.

Figure 26.
Triassic “Araucarioxylon” wood from Chinle Formation, Holbrook, Navajo County, Arizona, USA. Red oxidized exterior, showing internal infiltration along perimeter fractures.
Figure 26.
Triassic “Araucarioxylon” wood from Chinle Formation, Holbrook, Navajo County, Arizona, USA. Red oxidized exterior, showing internal infiltration along perimeter fractures.

Figure 27.
Longitudinal view of Araucarioxylon wood from Holbrook, Arizona, USA, showing diffuse color transformations developed along wood grain directions.
Figure 27.
Longitudinal view of Araucarioxylon wood from Holbrook, Arizona, USA, showing diffuse color transformations developed along wood grain directions.

Figure 28.
Eocene Sequoiaoxylon wood from Tom Miner Basin, Gallatin County, Montana, USA. Wood fragmented by fungal rot (brown rot) prior to fossilization is dark because of relict carbon. Chalcedony filling voids is white or gray.
Figure 28.
Eocene Sequoiaoxylon wood from Tom Miner Basin, Gallatin County, Montana, USA. Wood fragmented by fungal rot (brown rot) prior to fossilization is dark because of relict carbon. Chalcedony filling voids is white or gray.

Figure 29.
Triassic conifer wood from Madagascar. Factors that produced complex coloration include infiltration of silica along wood grain, red/green oxidation/reduction, entry of groundwater along fractures and rot pockets, and bleaching of exterior surfaces.
Figure 29.
Triassic conifer wood from Madagascar. Factors that produced complex coloration include infiltration of silica along wood grain, red/green oxidation/reduction, entry of groundwater along fractures and rot pockets, and bleaching of exterior surfaces.

| Mineral | Formula | Xl System | Color |
|---|---|---|---|
| Iron oxides: | |||
| Magnetite | Fe2+Fe3+2O4 | Isometric | Black |
| Wüstite | FeO | Isometric | Grayish white to yellow or brown |
| Hematite | α-Fe2O3 | Hexagonal | Earthy variety: dull red to bright red |
| Maghemite | γ-Fe2O3 | Isometric | brown |
| Akageneite | Fe3+O(OH,Cl) | Monoclinic | Yellow brown, reddish brown |
| Iron hydroxides: | |||
| Bernalite | Fe(OH)3 | Isometric | Green |
| Oxide/hydroxides: | |||
| Goethite | α-FeO(OH) | Orthorhombic | Yellowish to reddish to dark brown |
| Limonite | FeO(OH)·nH2O | Amorphous | Yellow to brown |
| Lepidocrocite | γ-FeO(OH)3 | Orthorhombic | Red to reddish brown |
| Feroxyhyte | ɗ-FeO(OH) | Hexagonal | Brown, yellowish brown |
| Ferrihydrite | (Fe3+)2O3·0.5H2O | Hexagonal | Dark brown, yellowish brown |
| Fougèrite | Fe42+Fe23+(OH)32(CO3)·3H2O | Hexagonal | Gray-green |
| Mӧssbauerite | Fe3+6O4(OH)8(CO3)·3H2O | Hexagonal | Blue-green |
| Trébeurdenite | Fe22+Fe43+(OH)10CO3·3H2O | Hexagonal | Gray-green |
| Schwertmannite | Fe8O8(OH)6(SO)·nH2O | Tetragonal | Orange |
© 2016 by the authors; licensee MDPI, Basel, Switzerland. This article is an open access article distributed under the terms and conditions of the Creative Commons Attribution (CC-BY) license (http://creativecommons.org/licenses/by/4.0/).
Share and Cite
MDPI and ACS Style
Mustoe, G.; Acosta, M. Origin of Petrified Wood Color. Geosciences 2016, 6, 25. https://doi.org/10.3390/geosciences6020025
AMA Style
Mustoe G, Acosta M. Origin of Petrified Wood Color. Geosciences. 2016; 6(2):25. https://doi.org/10.3390/geosciences6020025
Chicago/Turabian StyleMustoe, George, and Marisa Acosta. 2016. "Origin of Petrified Wood Color" Geosciences 6, no. 2: 25. https://doi.org/10.3390/geosciences6020025
Note that from the first issue of 2016, this journal uses article numbers instead of page numbers. See further details here.