
Multimethod Approach to the Study of Recent Volcanic Ashes from Tengger Volcanic Complex, Eastern Java, Indonesia

 ,
,  ,
,
Abstract
1. Introduction
2. Materials and Methods
3. Results and Discussion
4. Conclusions
Acknowledgments
Author Contributions
Conflicts of Interest
References
- PVMBG. Data Dasar Gunungapi Indonesia. Available online: http://www.vsi.esdm.go.id/index.php/gunungapi/data-dasar-gunungapi/532-g-bromo (accessed on 21 August 2015).
- Zaennudin, A. The Stratigraphy and Nature of the Stratocone of Mt. Cemara Lawang in the Bromo–Tengger Caldera, East Java, Indonesia. Master’s Thesis, Victoria University of Wellington, Wellington, New Zealand, 1990. [Google Scholar]
- Van Gerven, M.; Pichler, H. Some aspects of the volcanology and geochemistry of the Tengger Caldera, Java, Indonesia: Eruption of a K-rich tholeiitic series. J. Southeast Asian Earth Sci. 1995, 11, 125–133. [Google Scholar] [CrossRef]
- Gottschämmer, E.; Surono, I. Locating tremor and shock sources recorded at Bromo Volcano. J. Volcanol. Geotherm. Res. 2000, 101, 199–209. [Google Scholar] [CrossRef]
- Abidin, H.Z.; Andreas, H.; Gamal, M.; Hendrasto, M.; Suganda, O.K.; Purbawinata, M.A.; Meilano, I.; Kimata, F. The deformation of Bromo volcano (Indonesia) as detected by GPS surveys method. J. Glob. Position. Syst. 2005, 3, 16–24. [Google Scholar] [CrossRef]
- Kumalasari, R.; Srigutomo, W. Location and pressures change prediction of Bromo volcano magma chamber using inversion scheme. J. Phys. Conf. Ser. 2016, 739. [Google Scholar] [CrossRef]
- Bani, P.; Hendrasto, M.; Gunawan, H.; Primulyana, S. Sulfur dioxide emissions from Papandayan and Bromo, two Indonesian volcanoes. Nat. Hazards Earth Syst. Sci. 2013, 13, 2399–2407. [Google Scholar] [CrossRef]
- Aiuppa, A.; Bani, P.; Moussallam, Y.; Di Napoli, R.; Allard, P.; Gunawan, H.; Hendrasto, M.; Tamburello, G. First determination of magma derived gas emissions from Bromo volcano, eastern Java (Indonesia). J. Volcanol. Geotherm. Res. 2015, 304, 206–213. [Google Scholar] [CrossRef]
- Bachri, S.; Stötter, J.; Monreal, M.; Sartohadi, J. The calamity of eruptions, or an eruption of benefits? Mt. Bromo human–volcano system a case study of an open-risk perception. Nat. Hazards Earth Syst. Sci. 2015, 15, 277–290. [Google Scholar] [CrossRef]
- Cicchino, A.M.P.; Zanella, E.; DeAstis, G.; Lanza, R.; Lucchi, F.; Tranne, C.A.; Airoldi, G.; Mana, S. Rock magnetism and compositional investigation of Brown Tuffs deposits at Lipari and Vulcan (Aeolian Islands—Italy). J. Volcanol. Geotherm. Res. 2011, 208, 23–38. [Google Scholar] [CrossRef]
- Oda, H.; Miyagi, I.; Kawai, K.; Suganuma, Y.; Funaki, M.; Imae, N.; Mikouchi, T.; Matsuzaki, T.; Yamamoto, Y. Volcanic ash in bare ice south of Sør Rondane Mountains, Antarctica: Geochemistry, rock magnetism and nondestructive magnetic detection with SQUID gradiometer. Earth Planet Space 2016, 68, 39. [Google Scholar] [CrossRef]
- Pawse, A.; Beske-Diehl, S.; Marshall, S.A. Use of magnetic hysteresis properties and electron spin resonance spectroscopy for the identification of volcanic ash: A preliminary study. Geophys. J. Int. 1998, 132, 712–720. [Google Scholar] [CrossRef]
- Bigazzi, G.; Bonadonna, F.P.; Centamore, E.; Leone, G.; Mozzi, M.; Nisio, S.; Zanchetta, G. New radiometric dating of volcanic ash layers in Periadriatic foredeep basin system, Italy. Palaeogeogr. Palaeoclimatol. Palaeoecol. 2000, 155, 327–340. [Google Scholar] [CrossRef]
- Xia, D.; Chun, X.; Bloemendal, J.; Chiverrell, R.C.; Chen, F. Use of magnetic signatures to correlate tephra layers in Holocene loessial soil properties from a small region, SE Iceland. Environ. Geol. 2007, 51, 1425–1437. [Google Scholar] [CrossRef]
- Hong, H.; Fang, Q.; Wang, C.; Churchman, G.J.; Zhao, L.; Gong, N.; Yin, K. Clay mineralogy of altered tephra beds and facies correlation between the Permian-Triassic boundary stratigraphic sets, Guizhou, South China. Appl. Clay Sci. 2017, 143, 10–21. [Google Scholar] [CrossRef]
- Tamuntuan, G.; Bijaksana, S.; King, J.; Russel, J.; Fauzi, U.; Maryunani, K.; Aufa, N.; Safiuddin, L.O. Variation of magnetic properties in sediments from Lake Towuti, Indonesia, and its paleoclimatic significance. Palaeogeogr. Palaeoclimatol. Palaeoecol. 2015, 420, 163–172. [Google Scholar] [CrossRef]
- Till, J.L.; Jackson, M.J.; Rosenbaum, J.G.; Solheid, P. Magnetic properties in ash flow tufa with continuous grain size variation: A natural reference for magnetic particle granulometry. Geochem. Geophys. Geosyst. 2011, 12, 1–10. [Google Scholar] [CrossRef]
- Damby, D.E.; Horwell, C.J.; Baxter, P.J.; Delmelle, P.; Donaldson, K.; Dunster, C.; Fubini, B.; Murphy, F.A.; Nattrass, C.; Sweeney, S.; et al. The respiratory health hazard of tephra from the 2010 Centennial eruption of Merapi with implication for occupational mining of deposits. J. Volcanol. Geotherm. Res. 2013, 261, 376–387. [Google Scholar] [CrossRef]
- Lane, C.S.; Chorm, B.T.; Johnson, T.C. Ash from the Toba super eruption in Lake Malawi shows no volcanic winter in East Africa at 75 ka. Proc. Natl. Acad. Sci. USA 2013, 110, 8025–8029. [Google Scholar] [CrossRef] [PubMed]
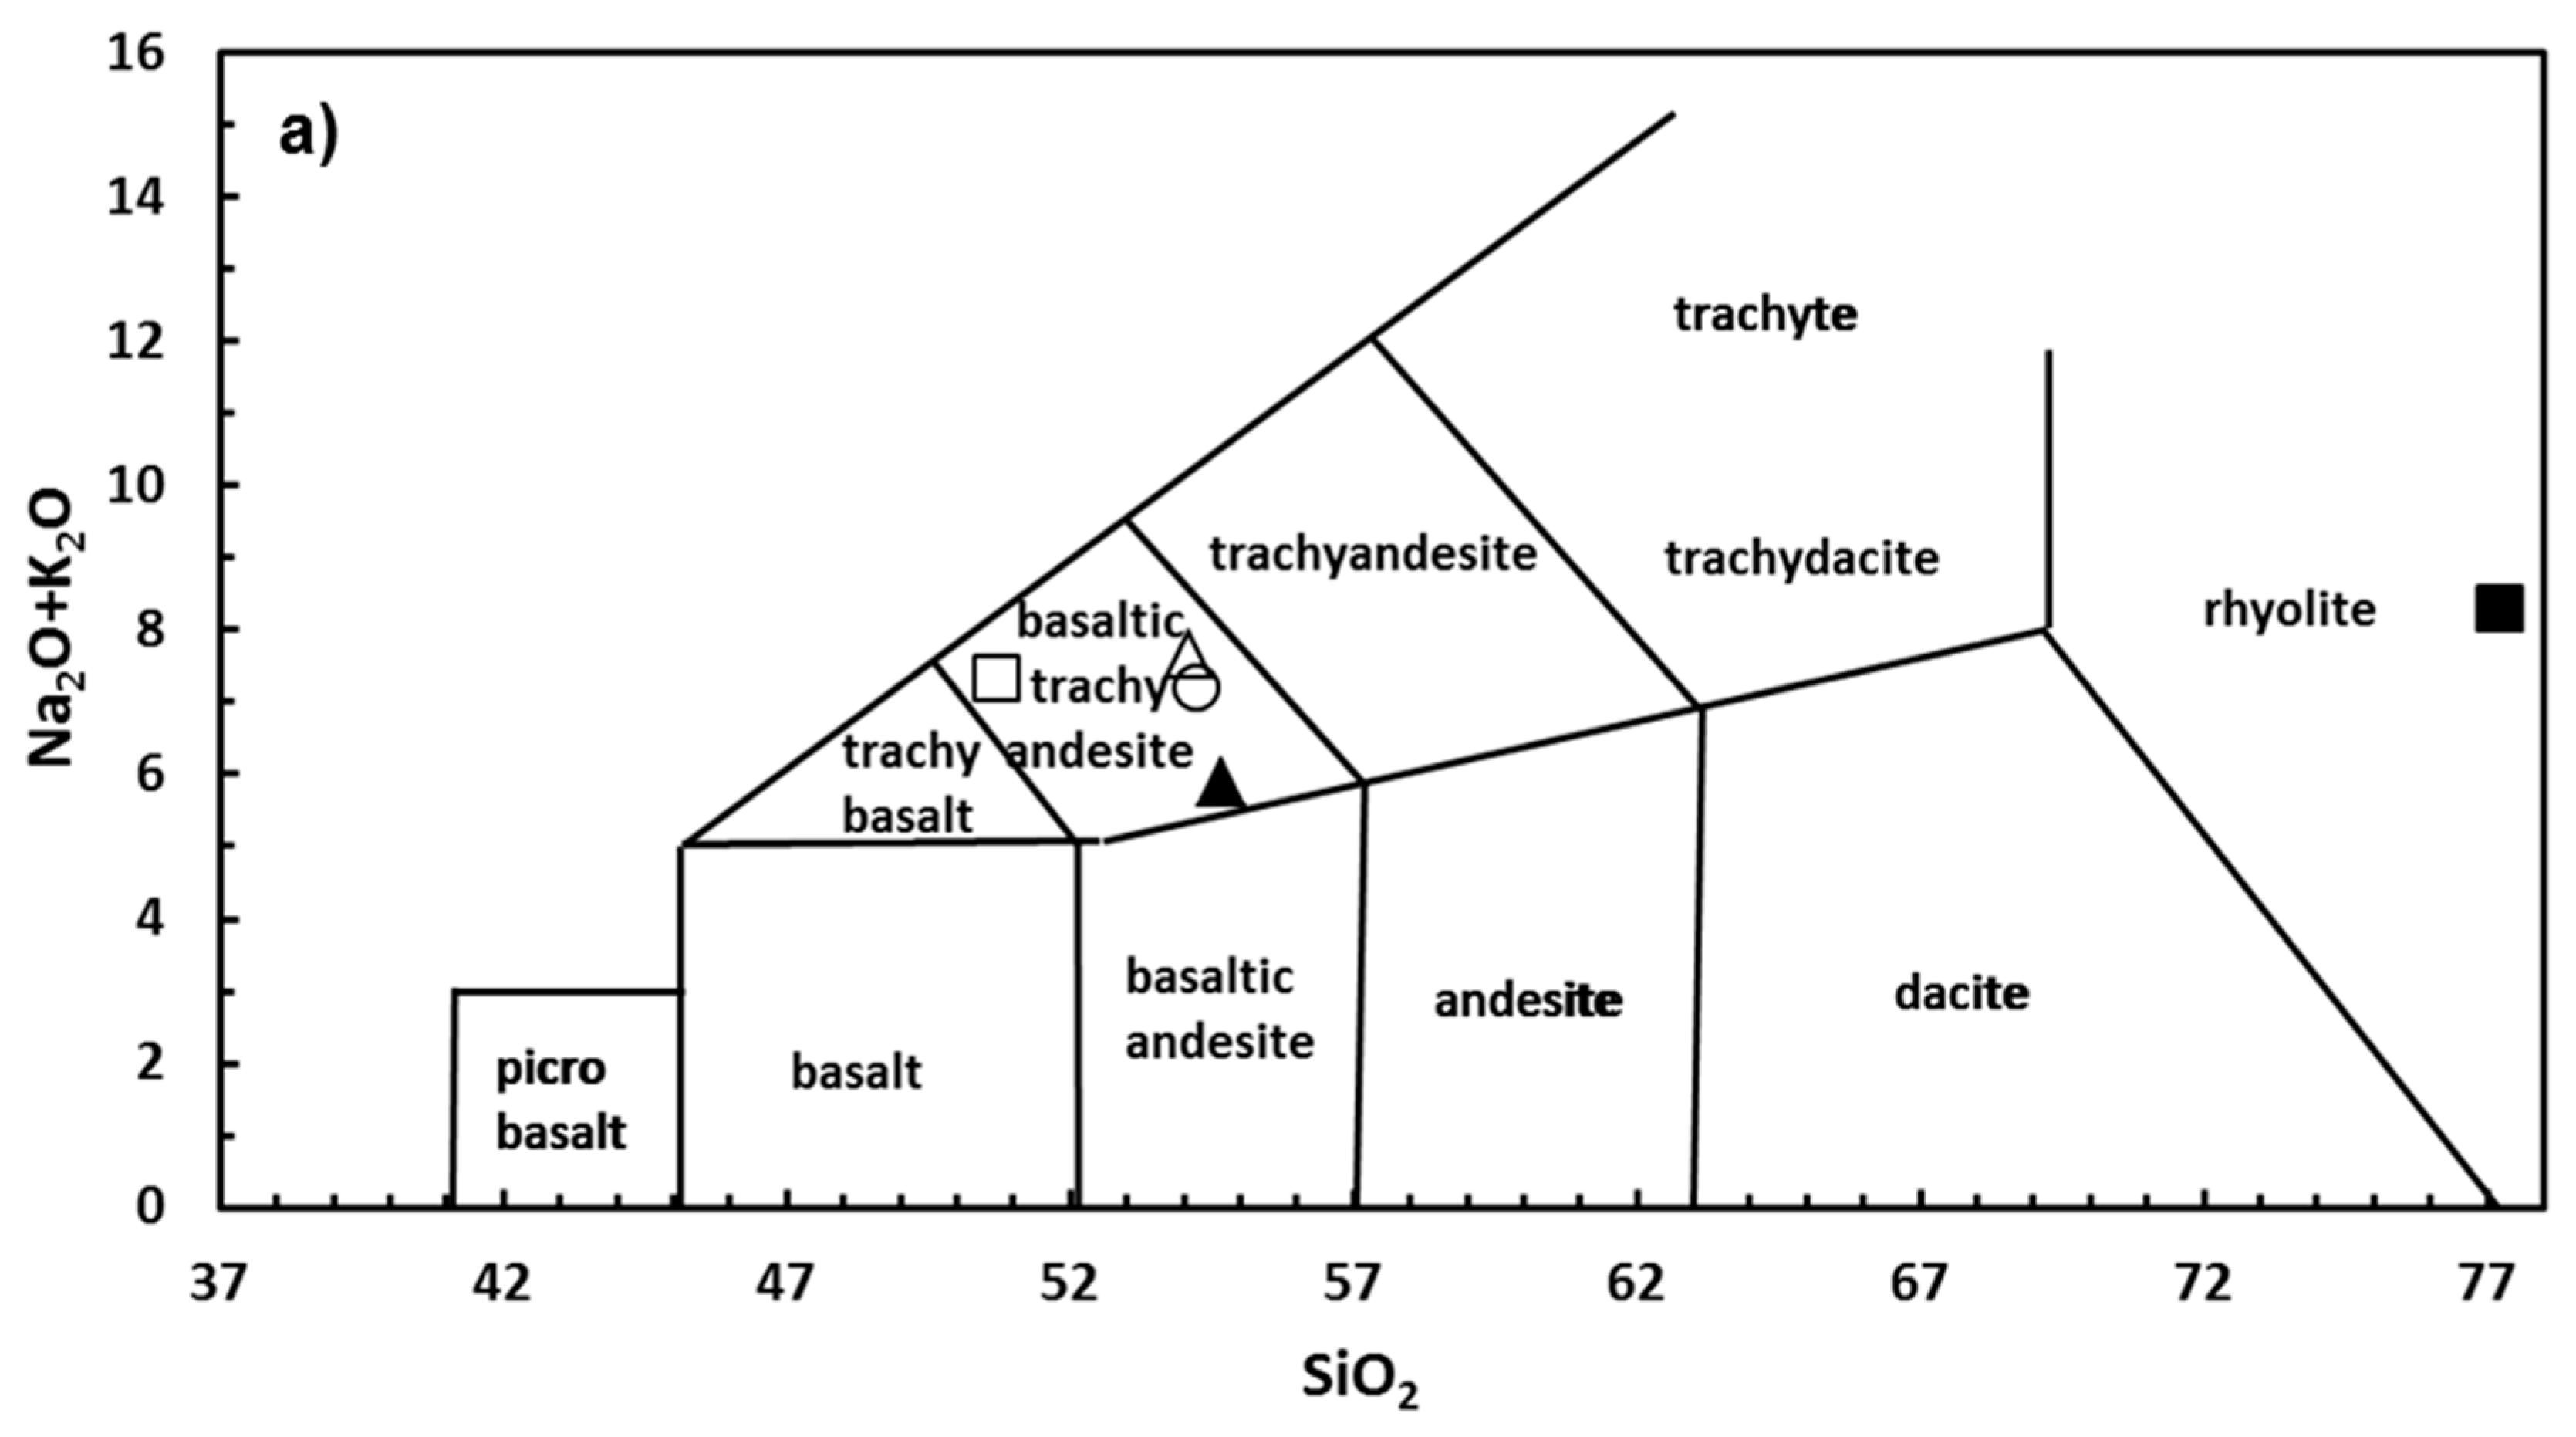
- Le Bas, M.J.; Le Maitre, R.W.; Streckeisen, A.; Zanettin, B. A chemical classification of volcanic rocks based on the total alkali-silica diagram. J. Petrol. 1986, 27, 745–750. [Google Scholar] [CrossRef]
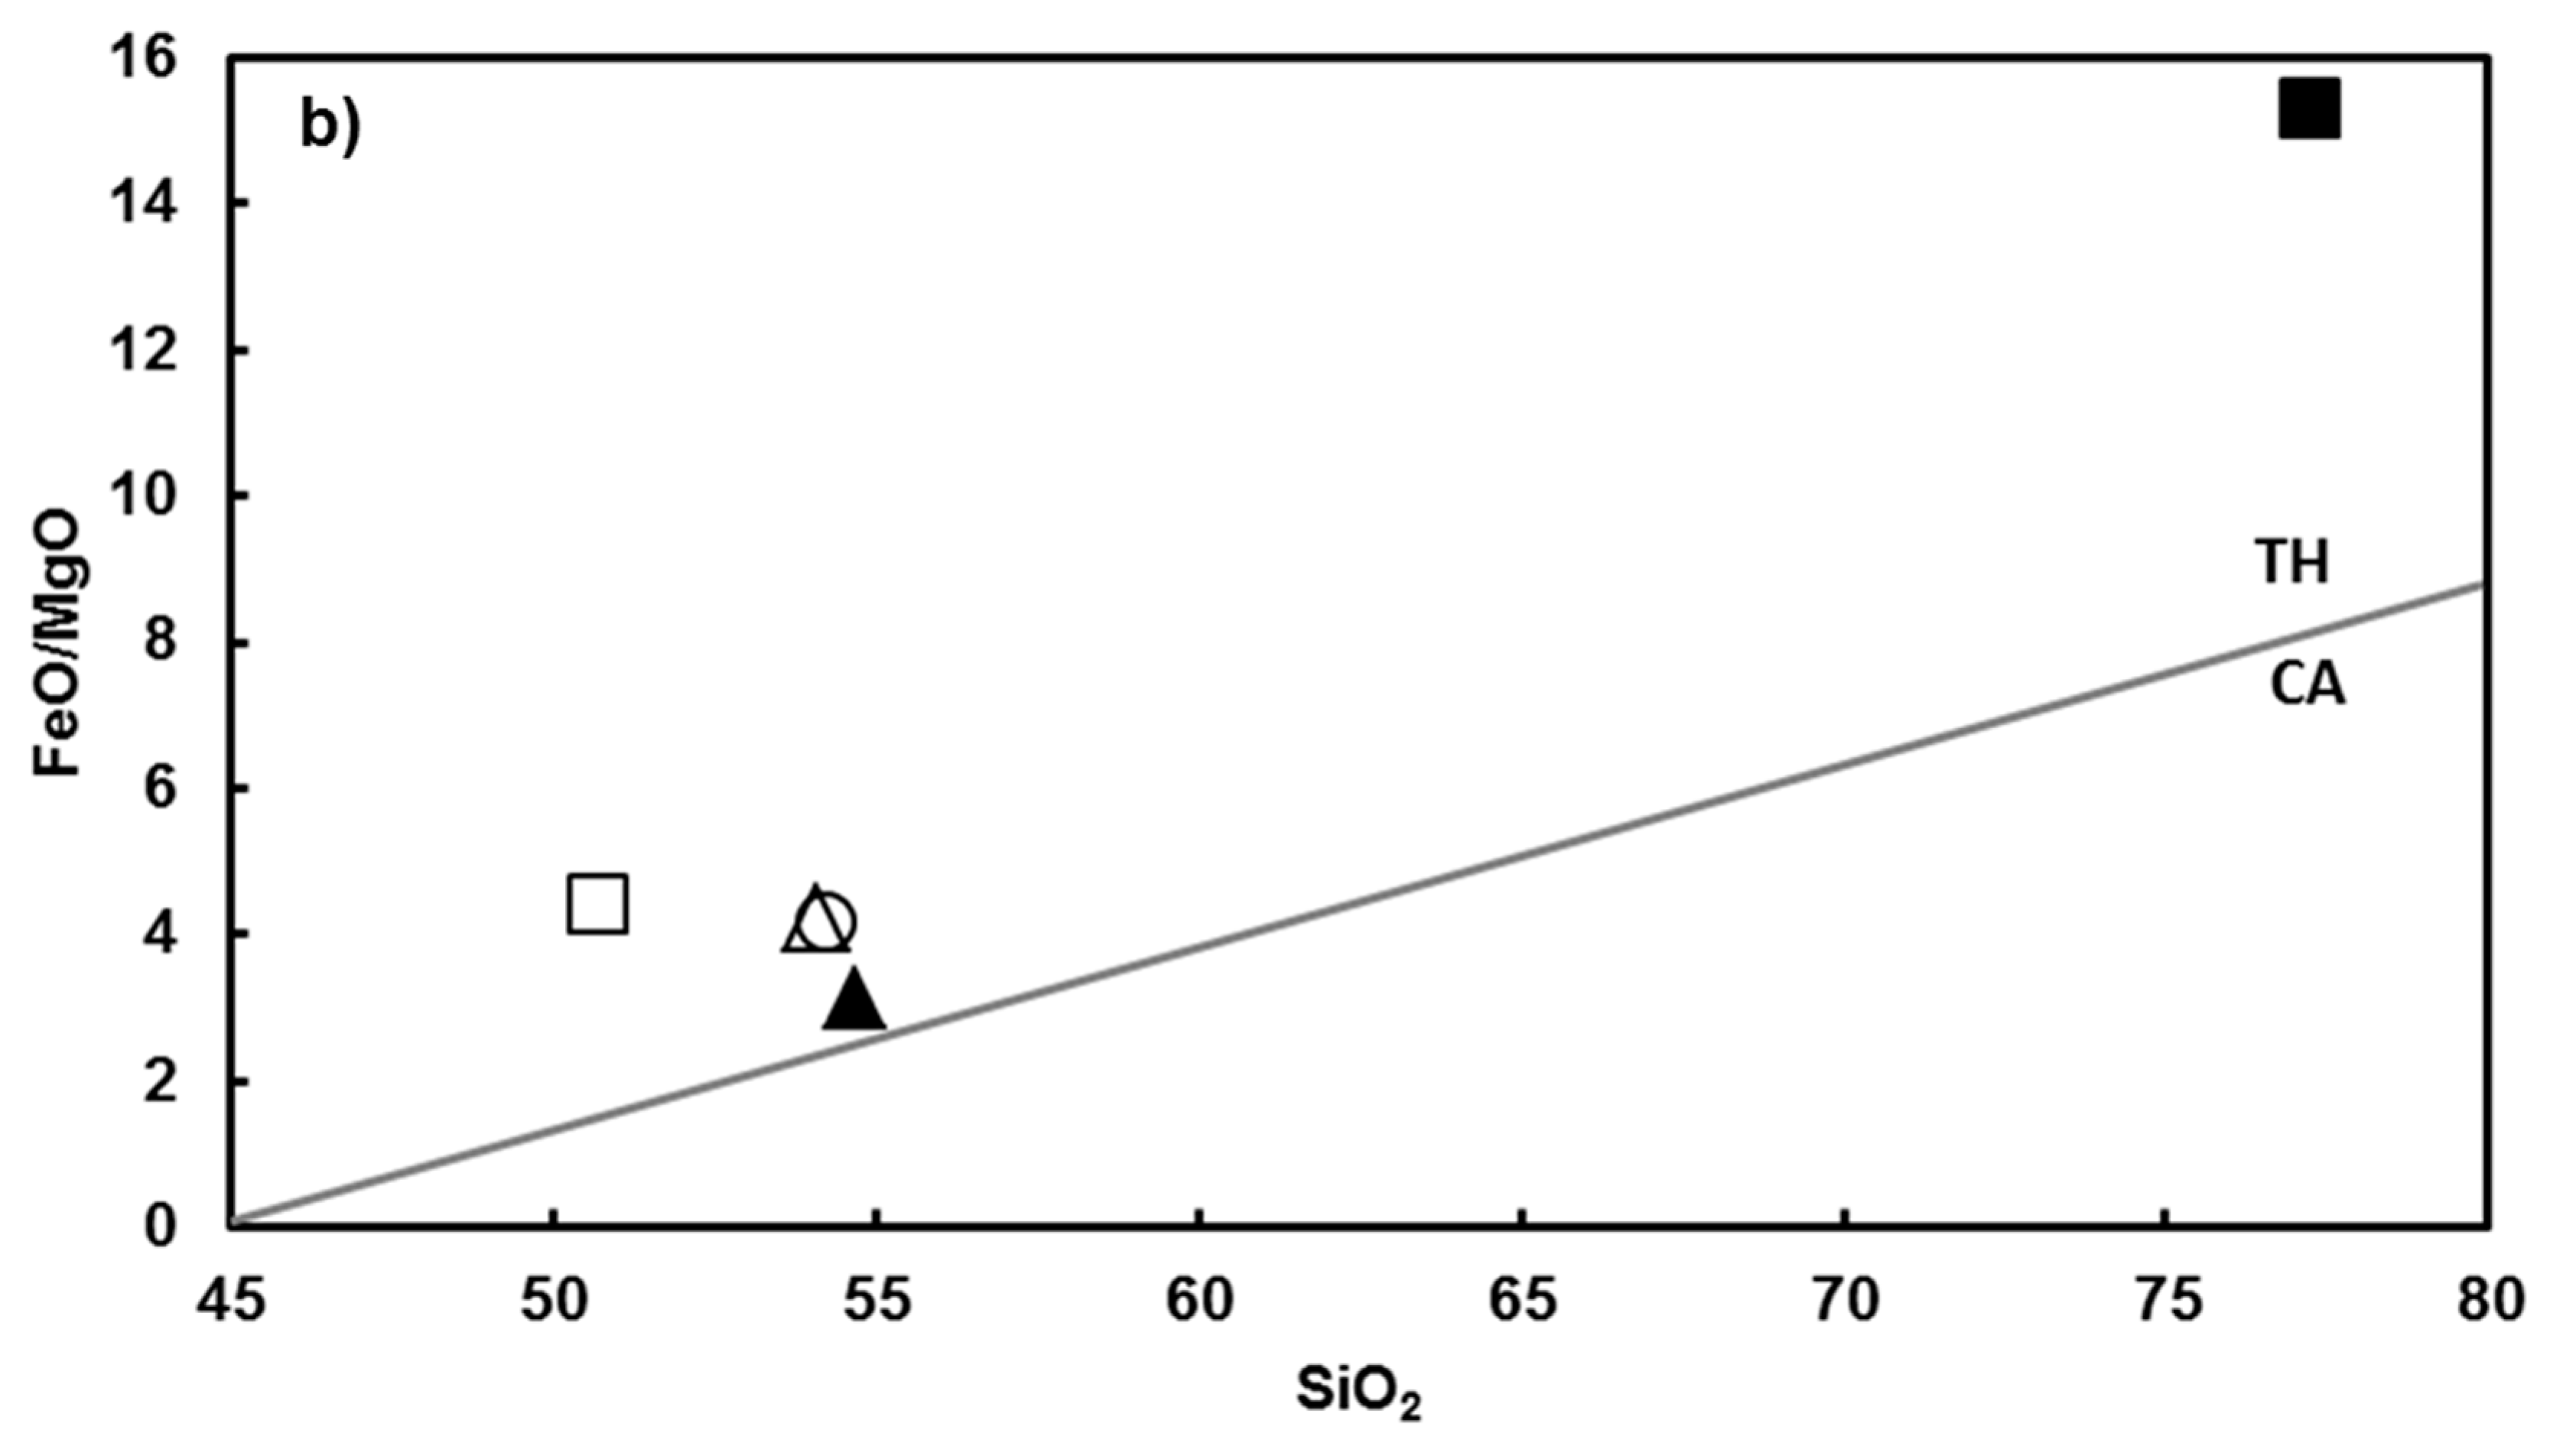
- Miyashiro, A. Volcanic rock series in island arcs and active continental margins. Am. J. Sci. 1974, 274, 321–355. [Google Scholar] [CrossRef]
- Rollinson, H.R. Using Gochemical Data: Evaluation, Presentation, Interpretation, 1st ed.; Pearson Education Limited: London, UK, 1993; p. 188. [Google Scholar]
- Tauxe, L. Essentials of Paleomagnetism, 4th ed.; University of California Press: Berkeley, CA, USA, 2010; pp. 8-2–8-8. [Google Scholar]
- Ubangoh, R.U.; Pacca, I.G.; Nyobe, J.B.; Hell, J.; Ateba, B. Petromagnetic characteristics of Cameroon Line volcanic rocks. J. Volcanol. Geotherm. Res. 2005, 142, 225–241. [Google Scholar] [CrossRef]
- Velasco, F.; Tornos, F.; Hanchar, J.M. Immiscible iron- and silica-richmelts and magnetite geochemistry at the El Laco volcano (northern Chile): Evidence for a magmatic origin for the magnetite deposits. Ore Geol. Rev. 2016, 79, 346–366. [Google Scholar] [CrossRef]
- Dunlop, D.J.; Özdemir, O. Rock Magnetism Fundamental and Frontiers, 1st ed.; Cambridge University Press: Cambridge, UK, 1997; pp. 306–307. [Google Scholar]
- Maher, B.A. Magnetic properties of some synthetic sub-micron magnetites. Geophys. J. Int. 1988, 94, 83–96. [Google Scholar] [CrossRef]
- Ferk, A.; Leonhardt, R.; Hess, K.-U.; Koch, S.; Egli, R.; Krása, D.; Dingwell, D.B. Influence of cooling rate on thermoremanence of magnetite grains: Identifying the role of different magnetic domain states. J. Geophys. Res. Solid Earth 2014, 119, 1599–1606. [Google Scholar] [CrossRef]
- Day, R.; Fuller, M.D.; Schmidt, V.A. Hysteresis properties of titanomagnetites: Grain size and composition dependence. Phys. Earth Planet. Inter. 1977, 13, 260–266. [Google Scholar] [CrossRef]
- Dunlop, D.J. Theory and application of the Day plot (Mrs/Ms versus Hcr/Hc): 1. Theoretical curves and tests using titanomagnetite data. J. Geophys. Res. 2002, 107, 2056. [Google Scholar] [CrossRef]
- Dunlop, D.J. Theory and application of the Day plot (Mrs/Ms versus Hcr/Hc): 2. Application to data for rocks, sediments, and soils. J. Geophys. Res. 2002, 107, 2057. [Google Scholar] [CrossRef]


| Oxides | Bromo | Widodaren | Segarawedi | Merapi Ash 1 | Toba Tuff 2 |
|---|---|---|---|---|---|
| SiO2 | 50.70 | 54.09 | 54.22 | 54.69 | 77.24 |
| TiO2 | 1.17 | 1.05 | 1.04 | 0.74 | 0.06 |
| Al2O3 | 17.09 | 18.23 | 18.82 | 19.29 | 12.54 |
| FeO | 10.93 | 9.57 | 9.29 | 7.76 | 0.85 |
| MnO | 0.20 | 0.19 | 0.18 | 0.19 | 0.07 |
| MgO | 2.22 | 2.04 | 2.00 | 2.25 | 0.05 |
| CaO | 7.58 | 6.08 | 5.90 | 8.12 | 0.78 |
| Na2O | 4.15 | 4.40 | 4.24 | 3.73 | 3.10 |
| K2O | 3.20 | 3.27 | 2.97 | 2.16 | 5.20 |
| P2O5 | 0.54 | 0.60 | 0.59 | 0.30 | - |
| SO3 | 1.44 | - | 0.21 | 0.03 | - |
| Total | 99.22 | 99.52 | 99.46 | 99.28 | 100.00 |
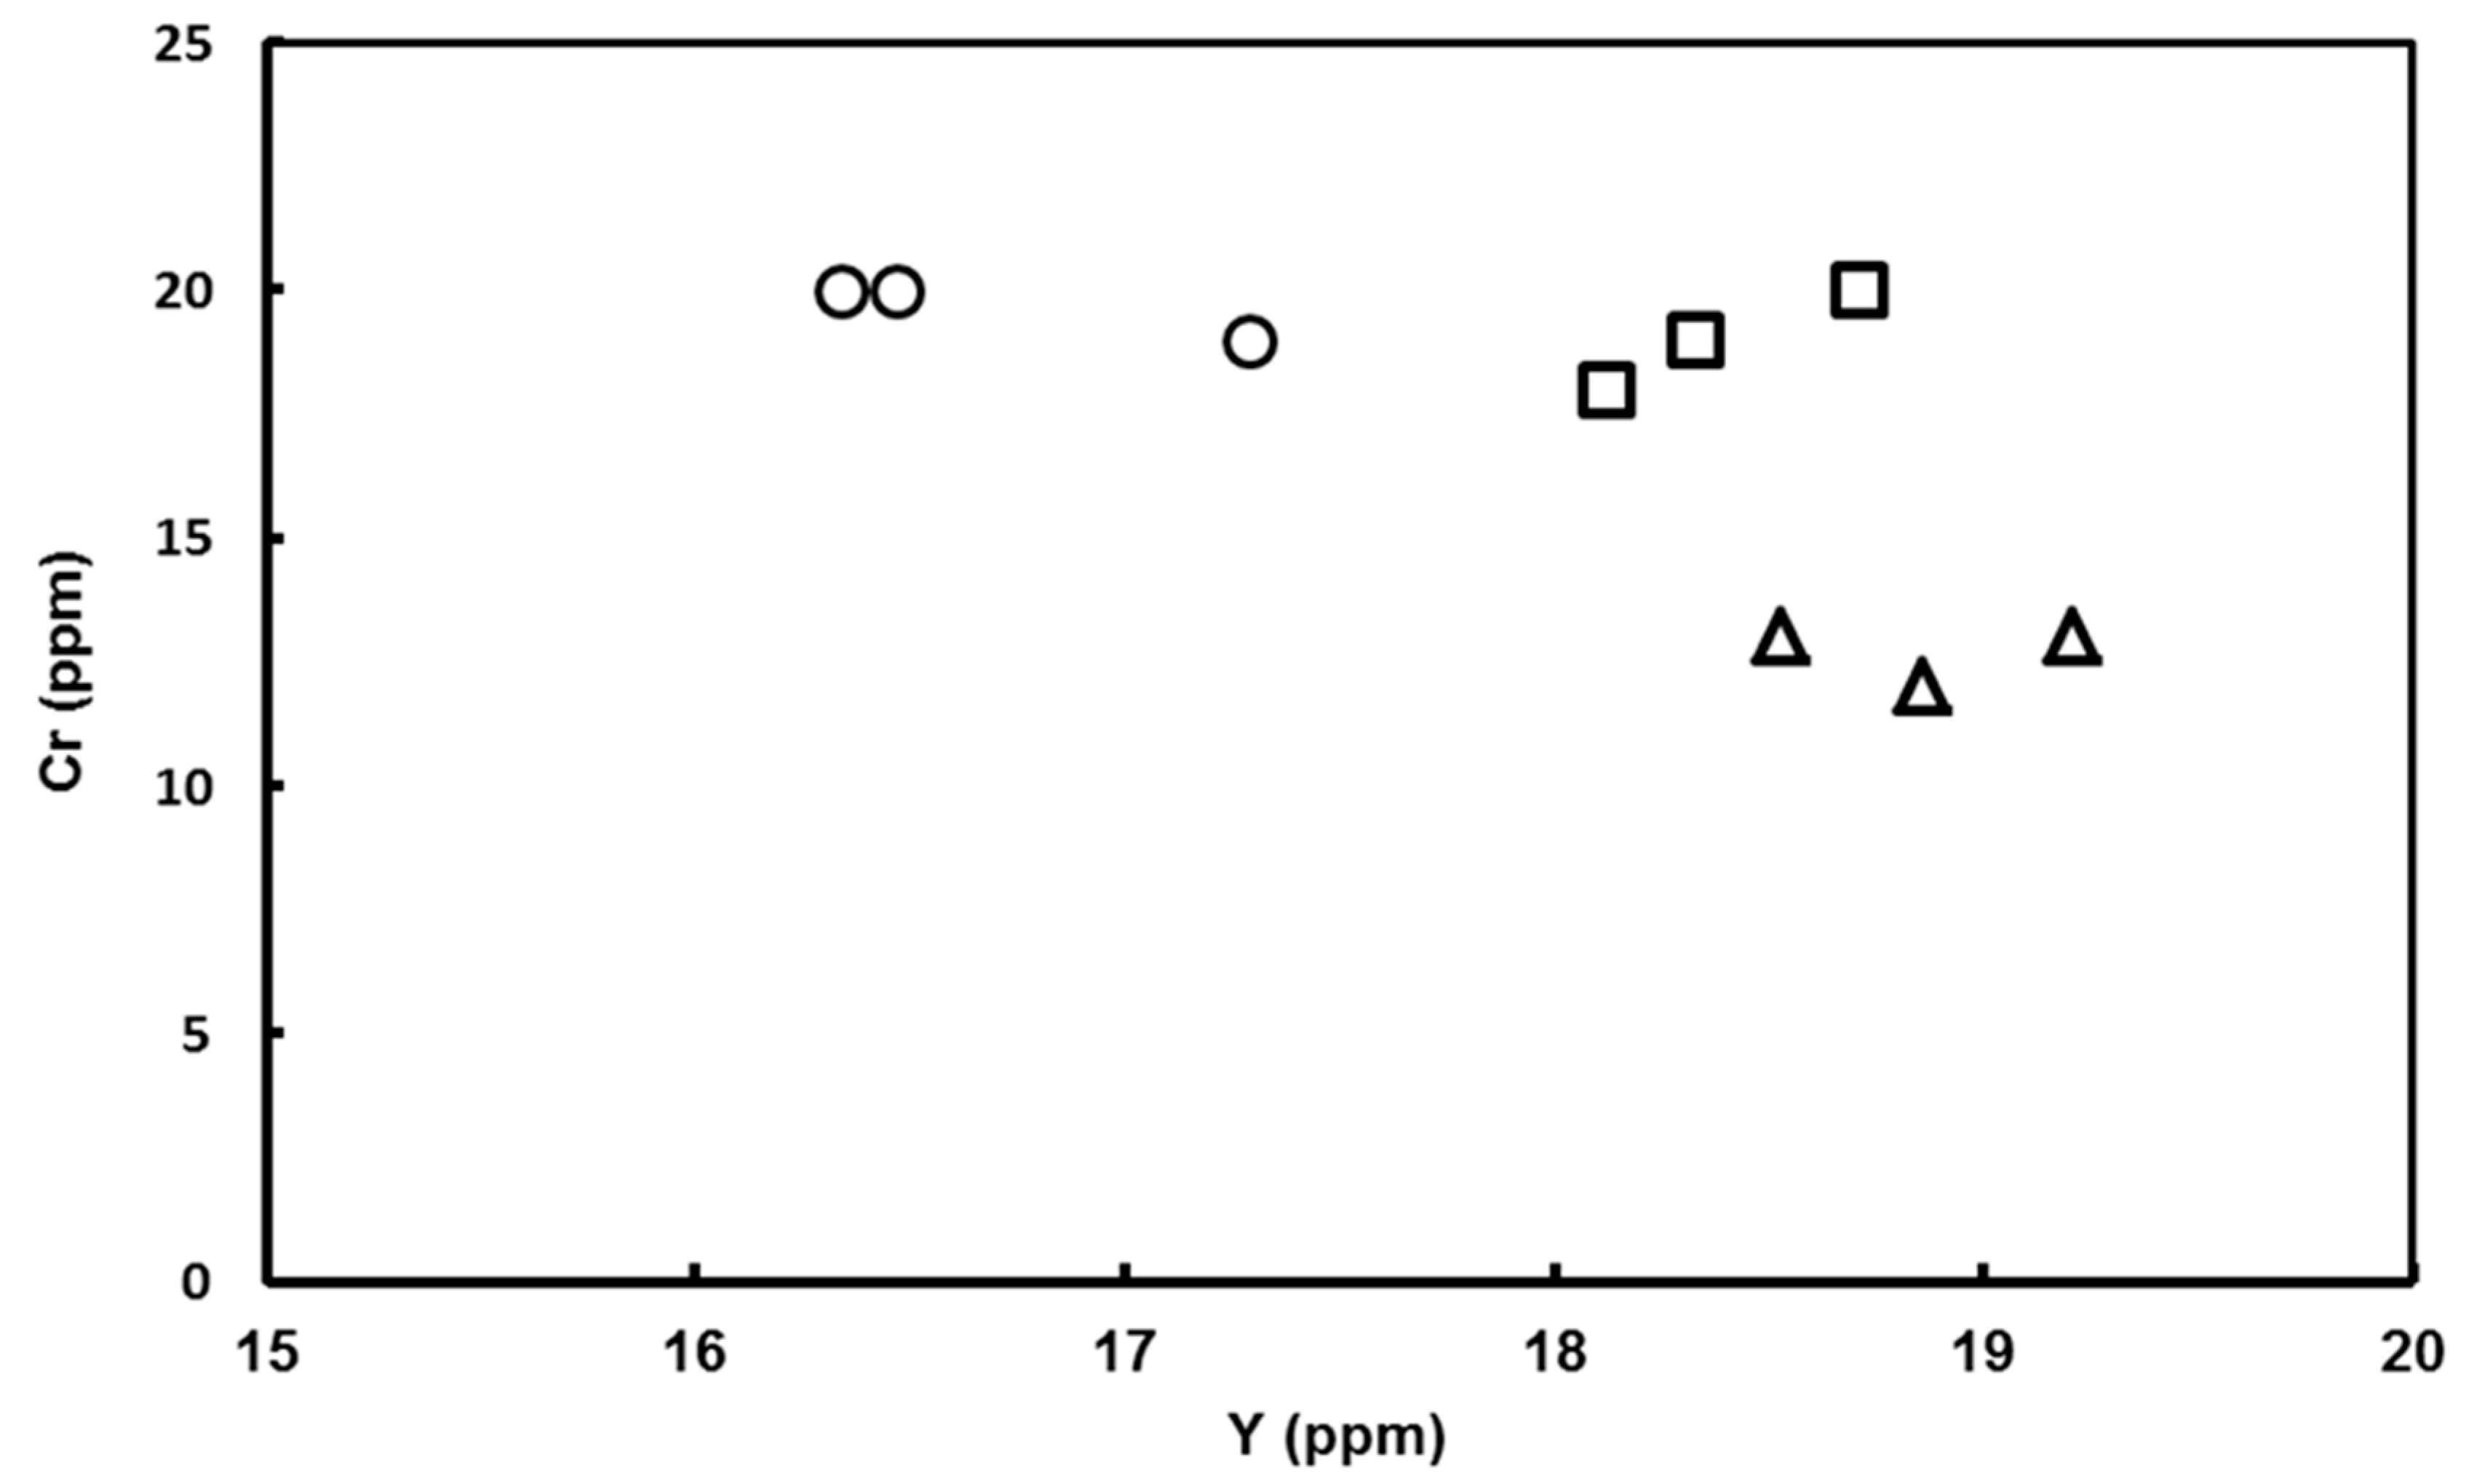
| Sample | Y (ppm) | Cr (ppm) | La (ppm) | Zr (ppm) | Ce (ppm) | V (ppm) |
|---|---|---|---|---|---|---|
| Bromo 1 | 18.12 | 18 | 13.84 | 130.14 | 40.66 | 40 |
| Bromo 2 | 18.71 | 20 | 14.94 | 133.60 | 46.14 | 40 |
| Bromo 3 | 18.33 | 19 | 13.78 | 129.97 | 42.42 | 40 |
| Widodaren 1 | 18.53 | 13 | 15.73 | 134.14 | 42.86 | 40 |
| Widodaren 2 | 19.21 | 13 | 15.09 | 141.28 | 45.92 | 40 |
| Widodaren 3 | 18.86 | 12 | 14.26 | 151.76 | 44.57 | 40 |
| Segarawedi 1 | 16.34 | 20 | 14.50 | 127.44 | 41.51 | 60 |
| Segarawedi 2 | 17.29 | 19 | 14.31 | 119.37 | 41.52 | 40 |
| Segarawedi 3 | 16.47 | 20 | 13.96 | 123.40 | 42.78 | 60 |
| Sample | χLF (× 10−8 m3/kg) | Average χLF (× 10−8 m3/kg) | χHF (× 10−8 m3/kg) | Average χHF (× 10−8 m3/kg) | χFD (%) | Average χFD (%) |
|---|---|---|---|---|---|---|
| Bromo 1 | 462.5 | 464.98 ± 2.54 | 444.6 | 448.54 ± 3.98 | 3.87 | 3.54 ± 0.57 |
| Bromo 2 | 465.5 | 446.1 | 4.17 | |||
| Bromo 3 | 462.2 | 447.7 | 3.14 | |||
| Bromo 4 | 467.8 | 454.9 | 2.76 | |||
| Bromo 5 | 466.9 | 449.4 | 3.75 | |||
| Widodaren 1 | 351.9 | 354.64 ± 10.79 | 338.5 | 341.04 ± 9.27 | 3.81 | 3.83 ± 0.34 |
| Widodaren 2 | 369.5 | 353.5 | 4.33 | |||
| Widodaren 3 | 350.2 | 336.8 | 3.83 | |||
| Widodaren 4 | 341.1 | 329.6 | 3.37 | |||
| Widodaren 5 | 360.5 | 346.8 | 3.80 | |||
| Segarawedi 1 | 530.1 | 530.26 ± 7.42 | 509.7 | 511.36 ± 6.45 | 3.85 | 3.56 ± 0.49 |
| Segarawedi 2 | 525.5 | 505.1 | 3.88 | |||
| Segarawedi 3 | 521.5 | 507.3 | 2.72 | |||
| Segarawedi 4 | 540.8 | 521.6 | 3.55 | |||
| Segarawedi 5 | 533.4 | 513.1 | 3.81 |
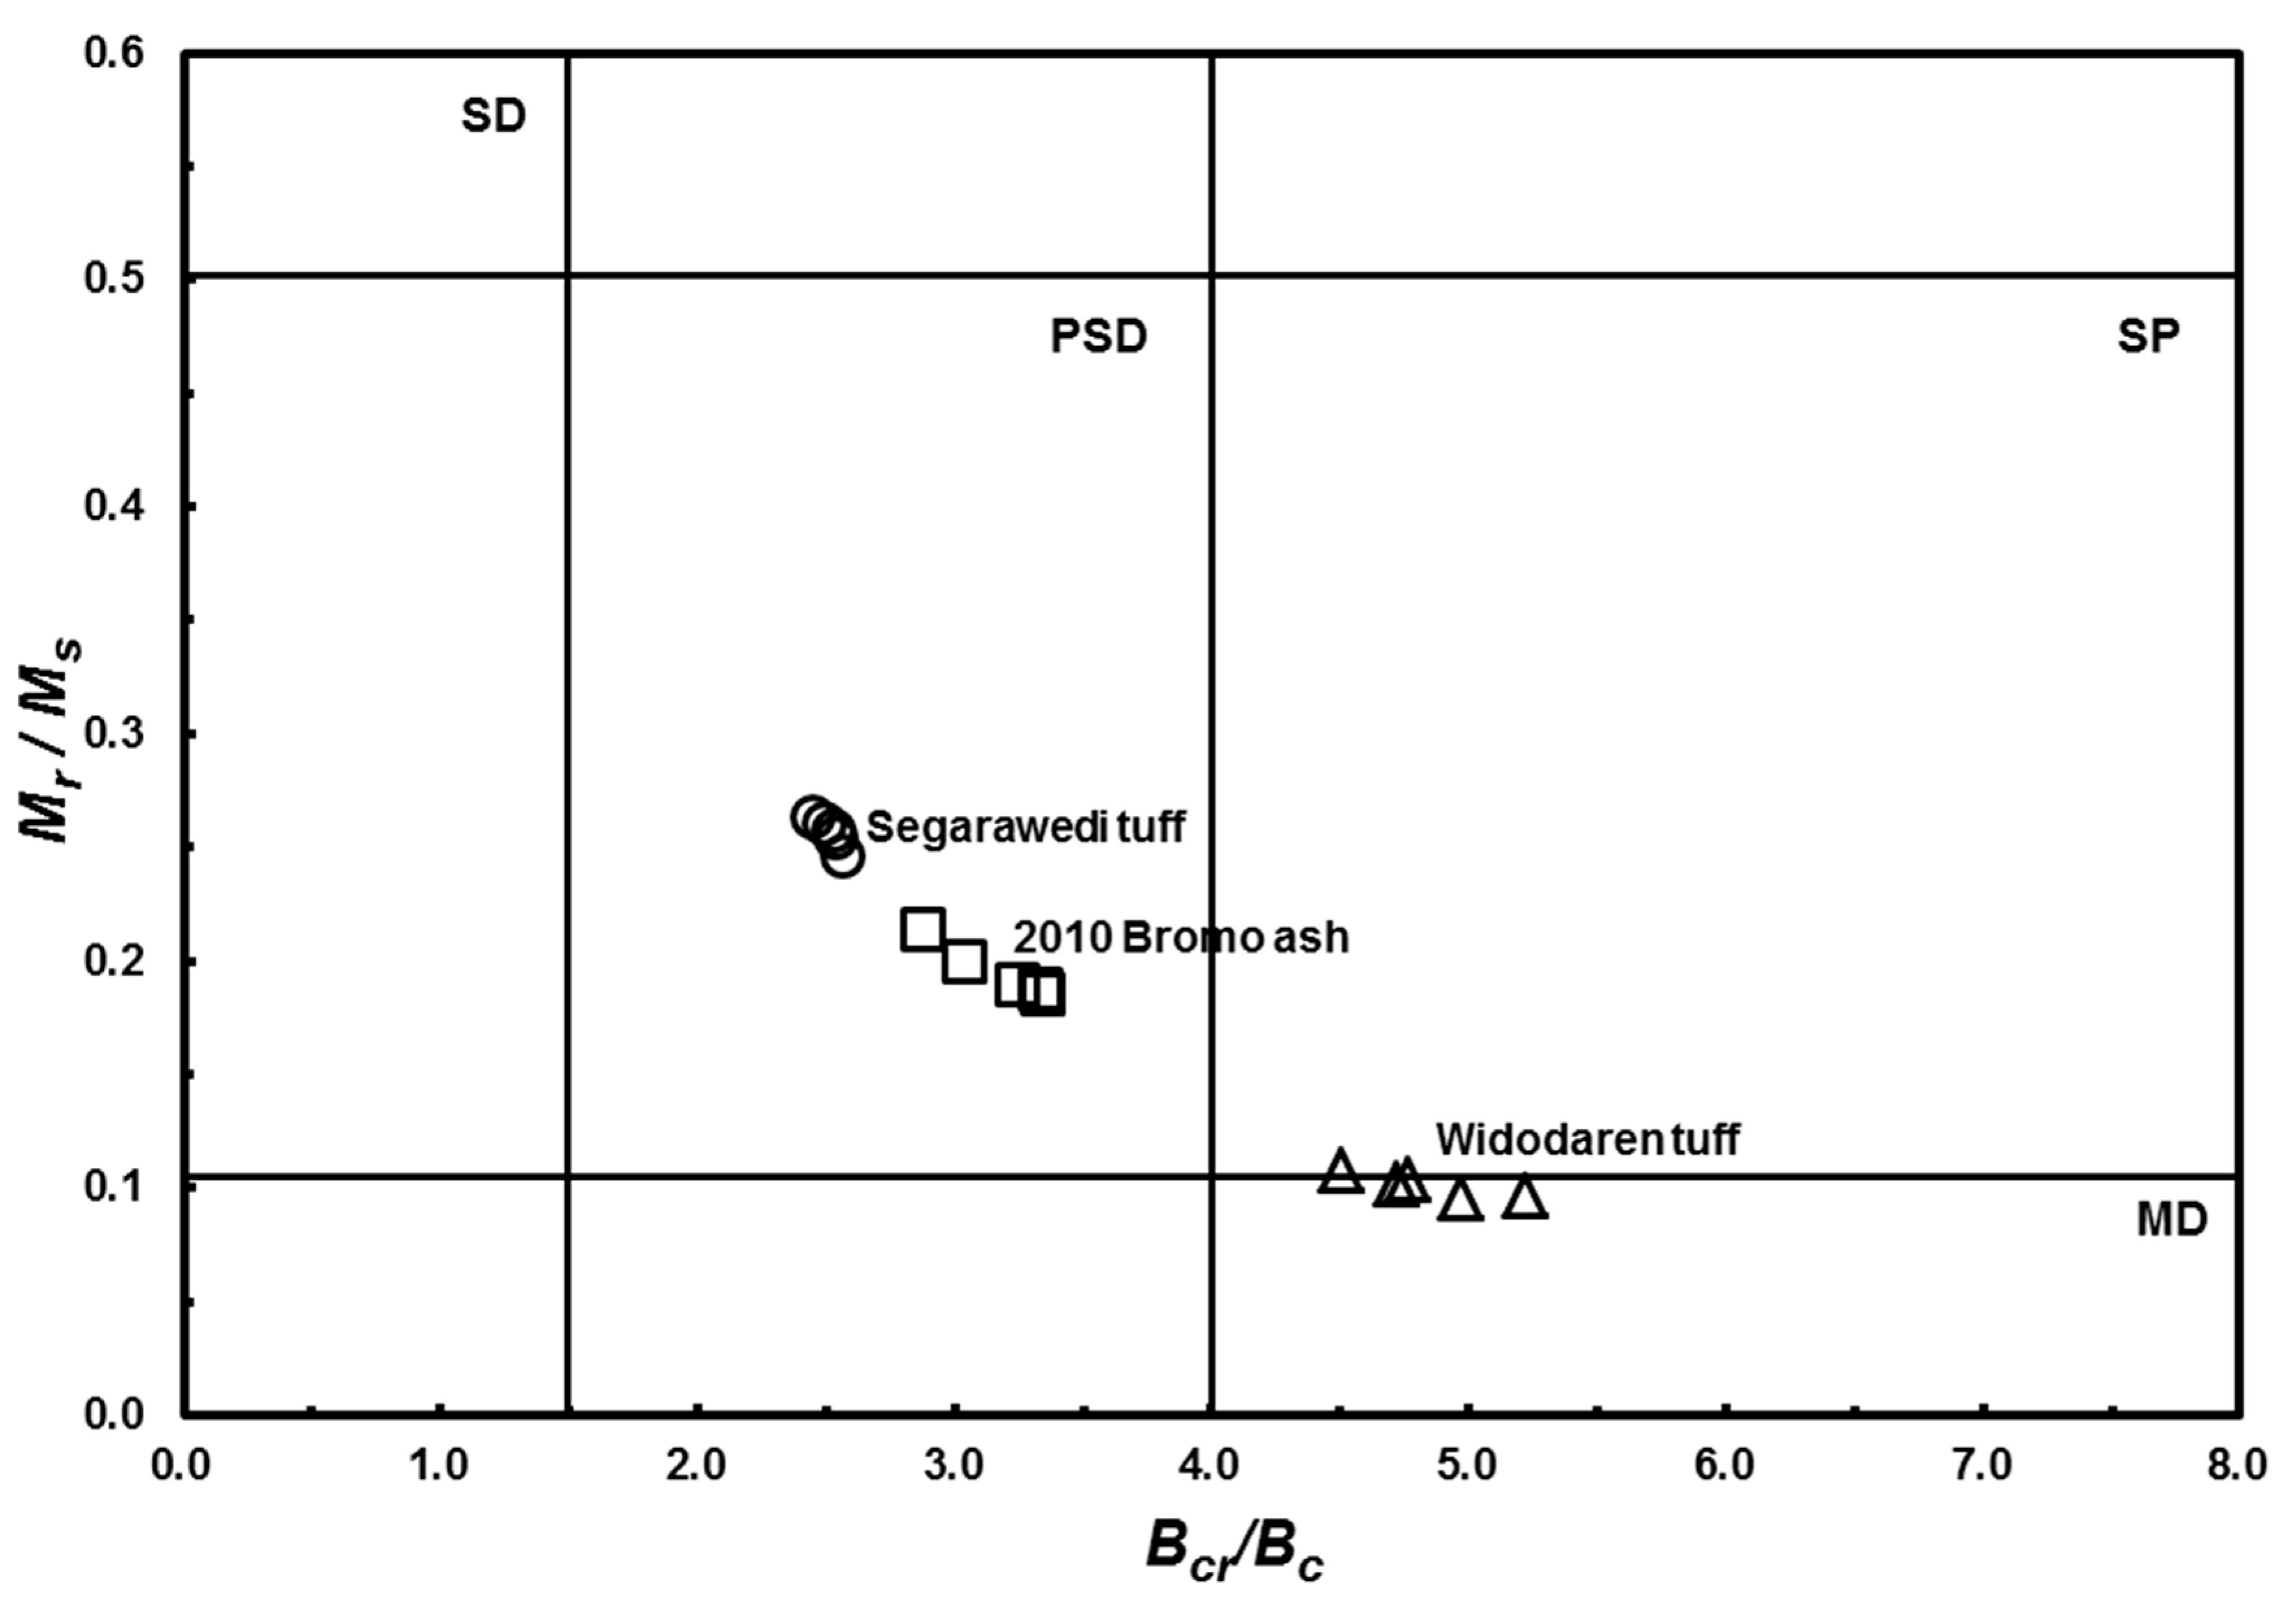
| Name of Volcano/Event | Sample Code | Mr/Ms | Bcr/Bc |
|---|---|---|---|
| Bromo 1 | BM1 | 0.19 | 3.35 |
| Bromo 2 | BM2 | 0.19 | 3.26 |
| Bromo 3 | BM3 | 0.19 | 3.35 |
| Bromo 4 | BM4 | 0.21 | 2.89 |
| Bromo 5 | BM5 | 0.20 | 3.05 |
| Widodaren 1 | WD1 | 0.10 | 5.23 |
| Widodaren 2 | WD2 | 0.10 | 4.72 |
| Widodaren 3 | WD3 | 0.11 | 4.51 |
| Widodaren 4 | WD4 | 0.10 | 4.98 |
| Widodaren 5 | WD5 | 0.10 | 4.77 |
| Segarawedi 1 | SW1 | 0.26 | 2.46 |
| Segarawedi 2 | SW2 | 0.26 | 2.54 |
| Segarawedi 3 | SW3 | 0.25 | 2.55 |
| Segarawedi 4 | SW4 | 0.25 | 2.58 |
| Segarawedi 5 | SW5 | 0.26 | 2.51 |
© 2017 by the authors. Licensee MDPI, Basel, Switzerland. This article is an open access article distributed under the terms and conditions of the Creative Commons Attribution (CC BY) license (http://creativecommons.org/licenses/by/4.0/).
Share and Cite
Santoso, N.A.; Bijaksana, S.; Kodama, K.; Santoso, D.; Dahrin, D. Multimethod Approach to the Study of Recent Volcanic Ashes from Tengger Volcanic Complex, Eastern Java, Indonesia. Geosciences 2017, 7, 63. https://doi.org/10.3390/geosciences7030063
Santoso NA, Bijaksana S, Kodama K, Santoso D, Dahrin D. Multimethod Approach to the Study of Recent Volcanic Ashes from Tengger Volcanic Complex, Eastern Java, Indonesia. Geosciences. 2017; 7(3):63. https://doi.org/10.3390/geosciences7030063
Chicago/Turabian StyleSantoso, Nono Agus, Satria Bijaksana, Kazuto Kodama, Djoko Santoso, and Darharta Dahrin. 2017. "Multimethod Approach to the Study of Recent Volcanic Ashes from Tengger Volcanic Complex, Eastern Java, Indonesia" Geosciences 7, no. 3: 63. https://doi.org/10.3390/geosciences7030063
APA StyleSantoso, N. A., Bijaksana, S., Kodama, K., Santoso, D., & Dahrin, D. (2017). Multimethod Approach to the Study of Recent Volcanic Ashes from Tengger Volcanic Complex, Eastern Java, Indonesia. Geosciences, 7(3), 63. https://doi.org/10.3390/geosciences7030063