Heat Response of Global Vegetation Biomes to Ongoing Climate Warming Based on Remote Sensing

Abstract
:1. Introduction
2. Materials and Methods
3. Results
4. Discussion and Concluding Remarks
Acknowledgments
Conflicts of Interest
References
- Lobell, D.B.; Schlenker, W.; Costa-Roberts, J. Climate Trends and Global Crop Production since 1980. Science 2011, 333, 616–620. [Google Scholar] [CrossRef] [PubMed]
- Mao, J.; Shi, X.; Thornton, P.E.; Hoffman, F.M.; Zhu, Z.; Myneni, R.B. Global latitudinal-asymmetric vegetation growth trends and their driving mechanisms: 1982–2009. Remote Sens. 2013, 5, 1484–1497. [Google Scholar] [CrossRef]
- Parry, M.L. Climate Change 2007-Impacts, Adaptation and Vulnerability: Working Group II Contribution to the Fourth Assessment Report of the IPCC; Cambridge University Press: Cambridge, UK, 2007. [Google Scholar]
- Zhu, Z.; Piao, S.; Myneni, R.B.; Huang, M.; Zeng, Z.; Canadell, J.G.; Ciais, P.; Sitch, S.; Friedlingstein, P.; Arneth, A. Greening of the Earth and its drivers. Nat. Clim. Chang. 2016, 6, 791–795. [Google Scholar] [CrossRef]
- Zeng, Z.; Piao, S.; Li, L.; Zhou, L.; Ciais, P.; Wang, T.; Li, Y.; Lian, X.; Wood, E.F.; Friedlingstein, P.; et al. Climate mitigation from vegetation biophysical feedbacks during the past three decades. Nat. Clim. Chang. 2017, 7, 432–436. [Google Scholar] [CrossRef]
- Cong, N.; Shen, M.; Piao, S.; Chen, X.; An, S.; Yang, W.; Fu, Y.; Meng, F.; Wang, T. Little change in heat requirement for vegetation green-up on the Tibetan Plateau over the warming period of 1998–2012. Agric. For. Meteorol. 2017, 232, 650–658. [Google Scholar] [CrossRef]
- Braswell, B.H.; Schimel, D.S.; Linder, E.; Moore, B. The response of global terrestrial ecosystems to interannual temperature variability. Science 1997, 278, 870–872. [Google Scholar] [CrossRef]
- Tietjen, B.; Schlaepfer, D.R.; Bradford, J.B.; Lauenroth, W.K.; Hall, S.A.; Duniway, M.C.; Hochstrasser, T.; Jia, G.; Munson, S.M.; Pyke, D.A.; et al. Climate change-induced vegetation shifts lead to more ecological droughts despite projected rainfall increases in many global temperate drylands. Glob. Chang. Biol. 2017, 23, 2743–2754. [Google Scholar] [CrossRef] [PubMed]
- Allen, C.D.; Macalady, A.K.; Chenchouni, H.; Bachelet, D.; McDowell, N.; Vennetier, M.; Kitzberger, T.; Rigling, A.; Breshears, D.D.; Hogg, E.H.; et al. A global overview of drought and heat-induced tree mortality reveals emerging climate change risks for forests. For. Ecol. Manag. 2010, 259, 660–684. [Google Scholar] [CrossRef]
- Sterl, A.; Severijns, C.; Dijkstra, H.; Hazeleger, W.; Oldenborgh, G.J.V.; Broeke, M.V.D.; Burgers, G.; Hurk, B.V.D.; Leeuwen, P.J.V.; Velthoven, P.V. When can we expect extremely high surface temperatures? Geophys. Res. Lett. 2008, 35, 63–72. [Google Scholar] [CrossRef]
- Zhao, M.S.; Running, S.W. Drought-Induced Reduction in Global Terrestrial Net Primary Production from 2000 through 2009. Science 2010, 329, 940–943. [Google Scholar] [CrossRef] [PubMed]
- Myneni, R.B.; Keeling, C.D.; Tucker, C.J.; Asrar, G.; Nemani, R.R. Increased plant growth in the northern high latitudes from 1981 to 1991. Nature 1997, 386, 698–702. [Google Scholar] [CrossRef]
- Nemani, R.R.; Keeling, C.D.; Hashimoto, H.; Jolly, W.M.; Piper, S.C.; Tucker, C.J.; Myneni, R.B.; Running, S.W. Climate-driven increases in global terrestrial net primary production from 1982 to 1999. Science 2003, 300, 1560–1563. [Google Scholar] [CrossRef] [PubMed]
- Leone, A.; Perrotta, C.; Maresca, B. Plant tolerance to heat stress: Current strategies and new emergent insights. In Abiotic Stresses in Plants; Springer: Amsterdam, The Netherlands, 2003; pp. 1–22. [Google Scholar]
- Xu, Y.; Zhan, C.; Huang, B. Heat shock proteins in association with heat tolerance in grasses. Int. J. Proteom. 2011, 2011, 1059–1062. [Google Scholar] [CrossRef] [PubMed]
- Singh, R.P.; Prasad, P.V.V.; Sunita, K.; Giri, S.N.; Reddy, K.R. Influence of high temperature and breeding for heat tolerance in cotton: A review. Adv. Agron. 2007, 93, 313–385. [Google Scholar]
- Walter, J.; Jentsch, A.; Beierkuhnlein, C.; Kreyling, J. Ecological stress memory and cross stress tolerance in plants in the face of climate extremes. Environ. Exp. Bot. 2013, 94, 3–8. [Google Scholar] [CrossRef]
- Pinzon, J.E.; Tucker, C.J. A non-stationary 1981–2012 AVHRR NDVI3g time series. Remote Sens. 2014, 6, 6929–6960. [Google Scholar] [CrossRef]
- Alward, R.D.; Detling, J.K.; Milchunas, D.G. Grassland vegetation changes and nocturnal global warming. Science 1999, 283, 229–231. [Google Scholar] [CrossRef] [PubMed]
- Bai, Y.; Han, X.; Wu, J.; Chen, Z.; Li, L. Ecosystem stability and compensatory effects in the Inner Mongolia grassland. Nature 2004, 431, 181–184. [Google Scholar] [CrossRef] [PubMed]
- Cleland, E.E.; Chuine, I.; Menzel, A.; Mooney, H.A.; Schwartz, M.D. Shifting plant phenology in response to global change. Trends Ecol. Evol. 2007, 22, 357–365. [Google Scholar] [CrossRef] [PubMed]
- Körner, C.; Basler, D. Phenology under global warming. Science 2010, 327, 1461–1462. [Google Scholar] [CrossRef] [PubMed]
- Yang, Y.; Fang, J.; Ma, W.; Wang, W. Relationship between variability in aboveground net primary production and precipitation in global grasslands. Geophys. Res. Lett. 2008, 35, L23710. [Google Scholar] [CrossRef]
- Mao, J.; Ribes, A.; Yan, B.; Shi, X.; Thornton, P.E.; Séférian, R.; Ciais, P.; Myneni, R.B.; Douville, H.; Piao, S.; et al. Human-induced greening of the northern extratropical land surface. Nat. Clim. Chang. 2016, 6, 959–963. [Google Scholar] [CrossRef]
- Huxman, T.E.; Smith, M.D.; Fay, P.A.; Knapp, A.K.; Shaw, M.R.; Loik, M.E.; Smith, S.D.; Tissue, D.T.; Zak, J.C.; Weltzin, J.F.; et al. Convergence across biomes to a common rain-use efficiency. Nature 2004, 429, 651–654. [Google Scholar] [CrossRef] [PubMed]
- Teixeira, E.I.; Fischer, G.; van Velthuizen, H.; Walter, C.; Ewert, F. Global hot-spots of heat stress on agricultural crops due to climate change. Agric. For. Meteorol. 2013, 170, 206–215. [Google Scholar] [CrossRef]
- Asseng, S.; Foster, I.; Turner, N.C. The impact of temperature variability on wheat yields. Glob. Chang. Biol. 2011, 17, 997–1012. [Google Scholar] [CrossRef]
- Long, S.P.; Ort, D.R. More than taking the heat: Crops and global change. Curr. Opin. Plant Biol. 2010, 13, 241–248. [Google Scholar] [CrossRef] [PubMed]
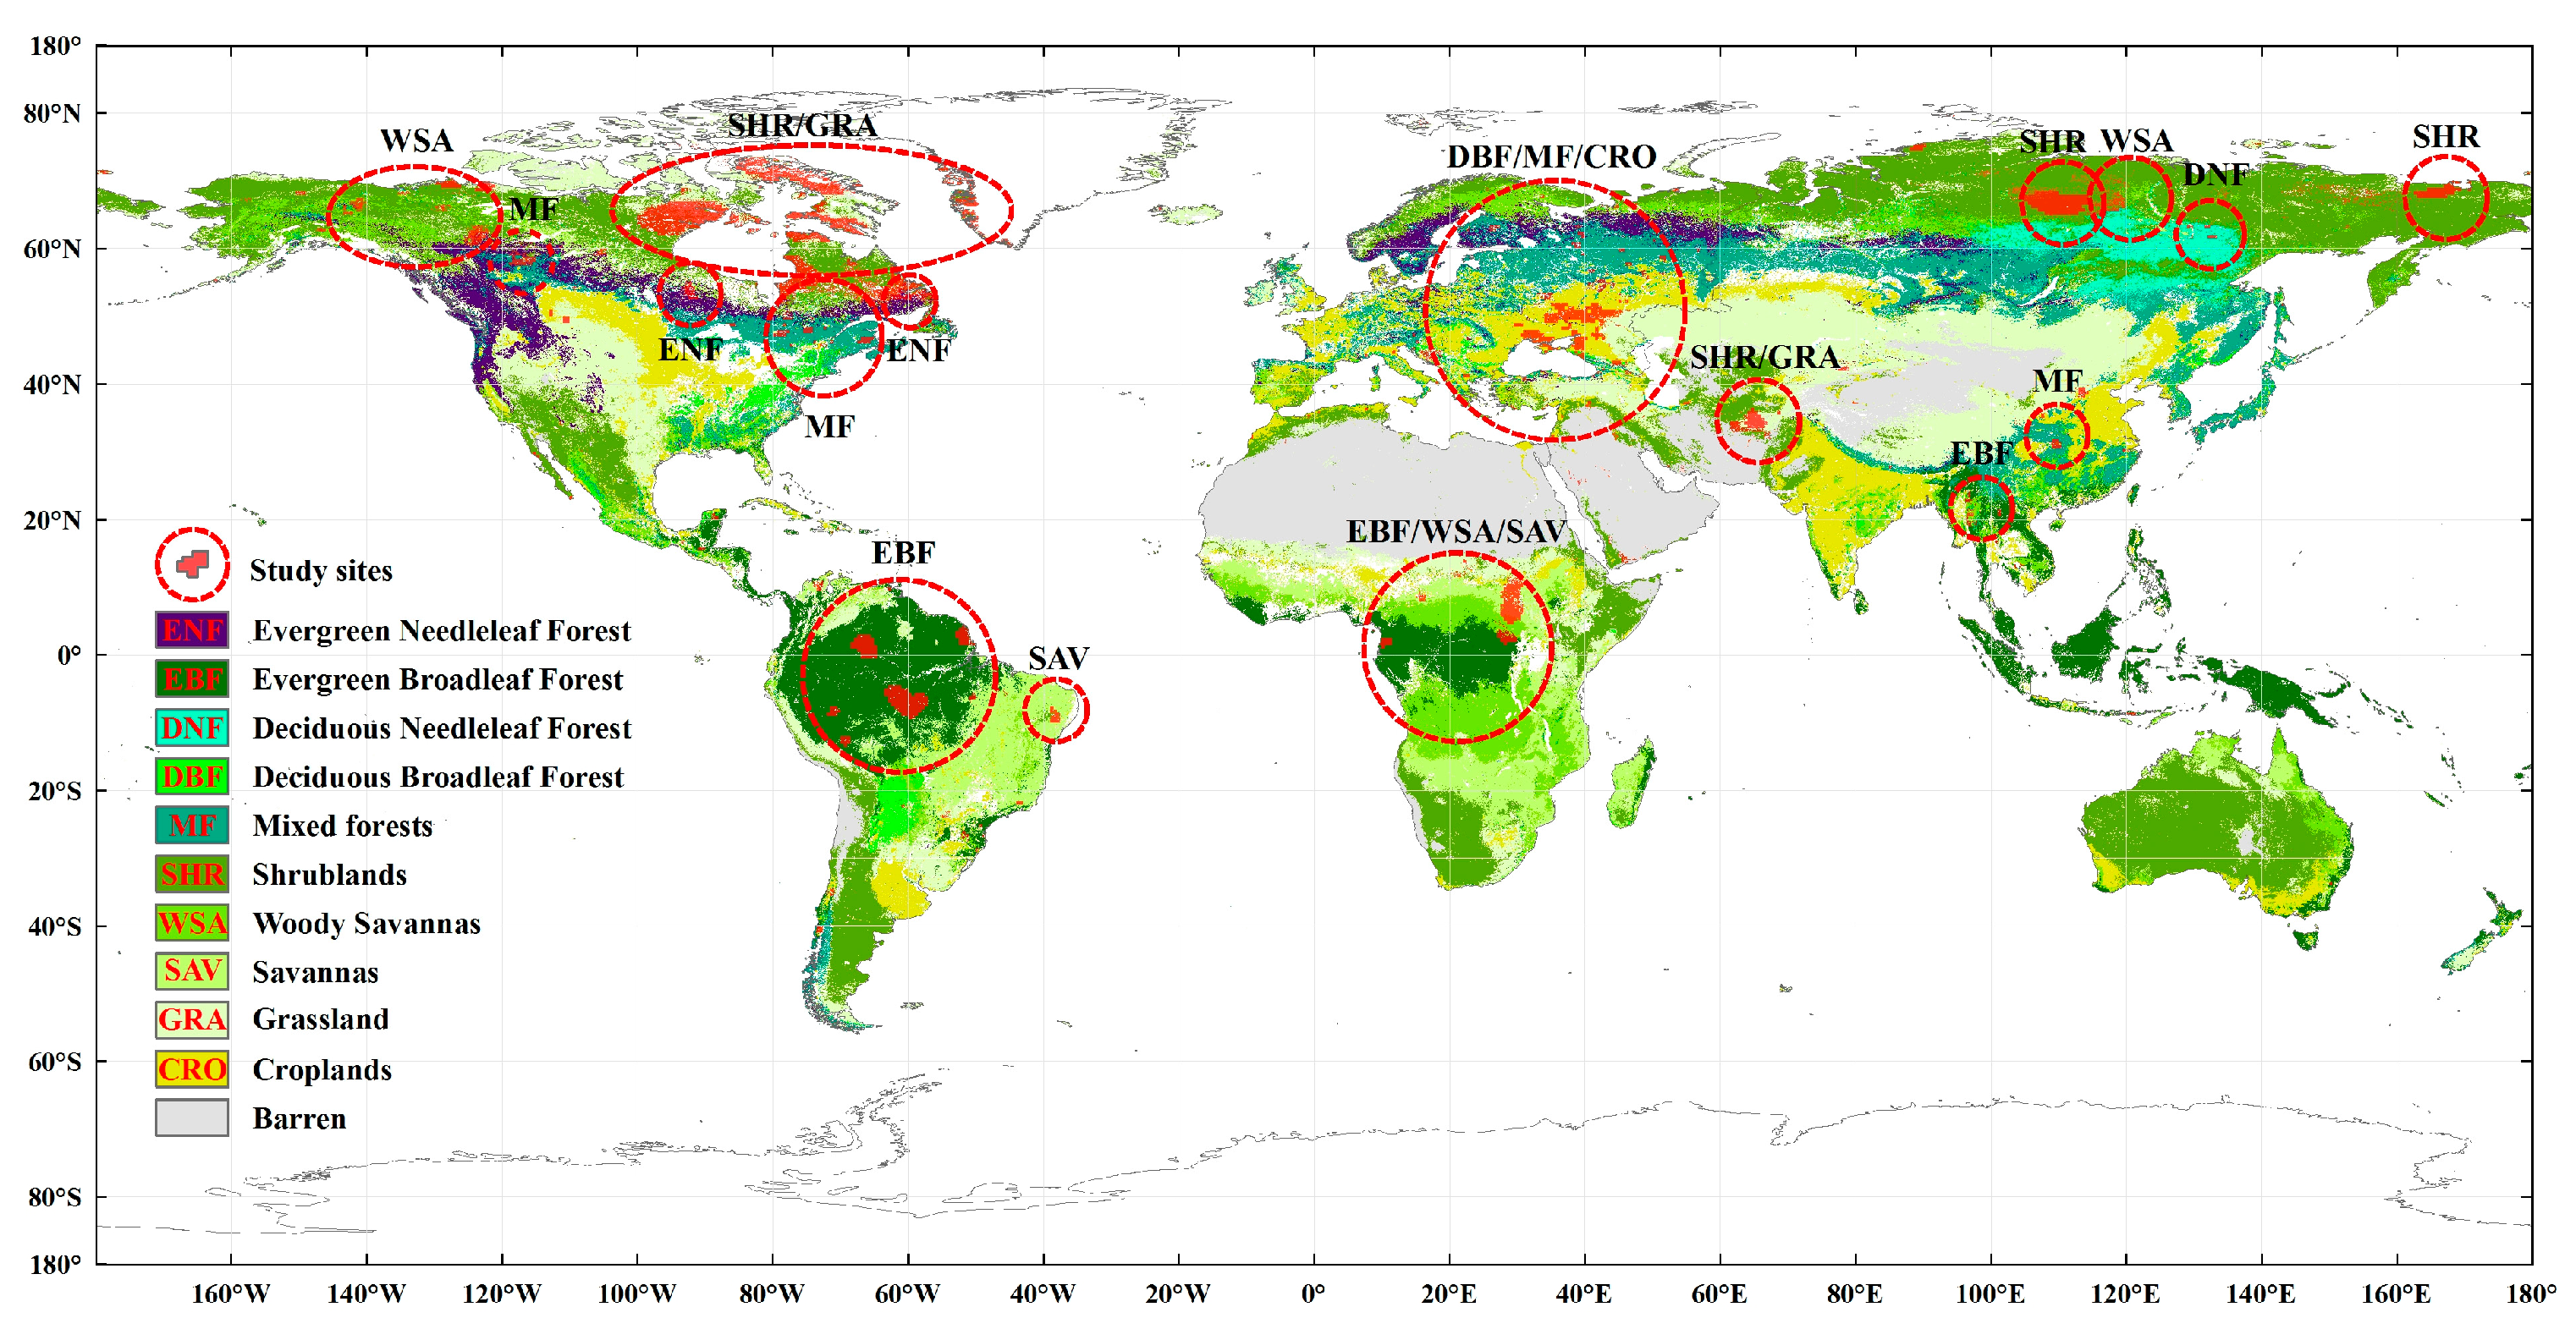
- Olson, D.M.; Dinerstein, E.; Wikramanayake, E.D.; Burgess, N.D.; Powell, G.V.; Underwood, E.C.; D’amico, J.A.; Itoua, I.; Strand, H.E.; Morrison, J.C. Terrestrial Ecoregions of the World: A New Map of Life on Earth A new global map of terrestrial ecoregions provides an innovative tool for conserving biodiversity. Bioscience 2001, 51, 933–938. [Google Scholar] [CrossRef]
- Hollister, R.D.; Webber, P.J.; Bay, C. Plant response to temperature in Northern Alaska: Implications for predicting vegetation change. Ecology 2005, 86, 1562–1570. [Google Scholar] [CrossRef]


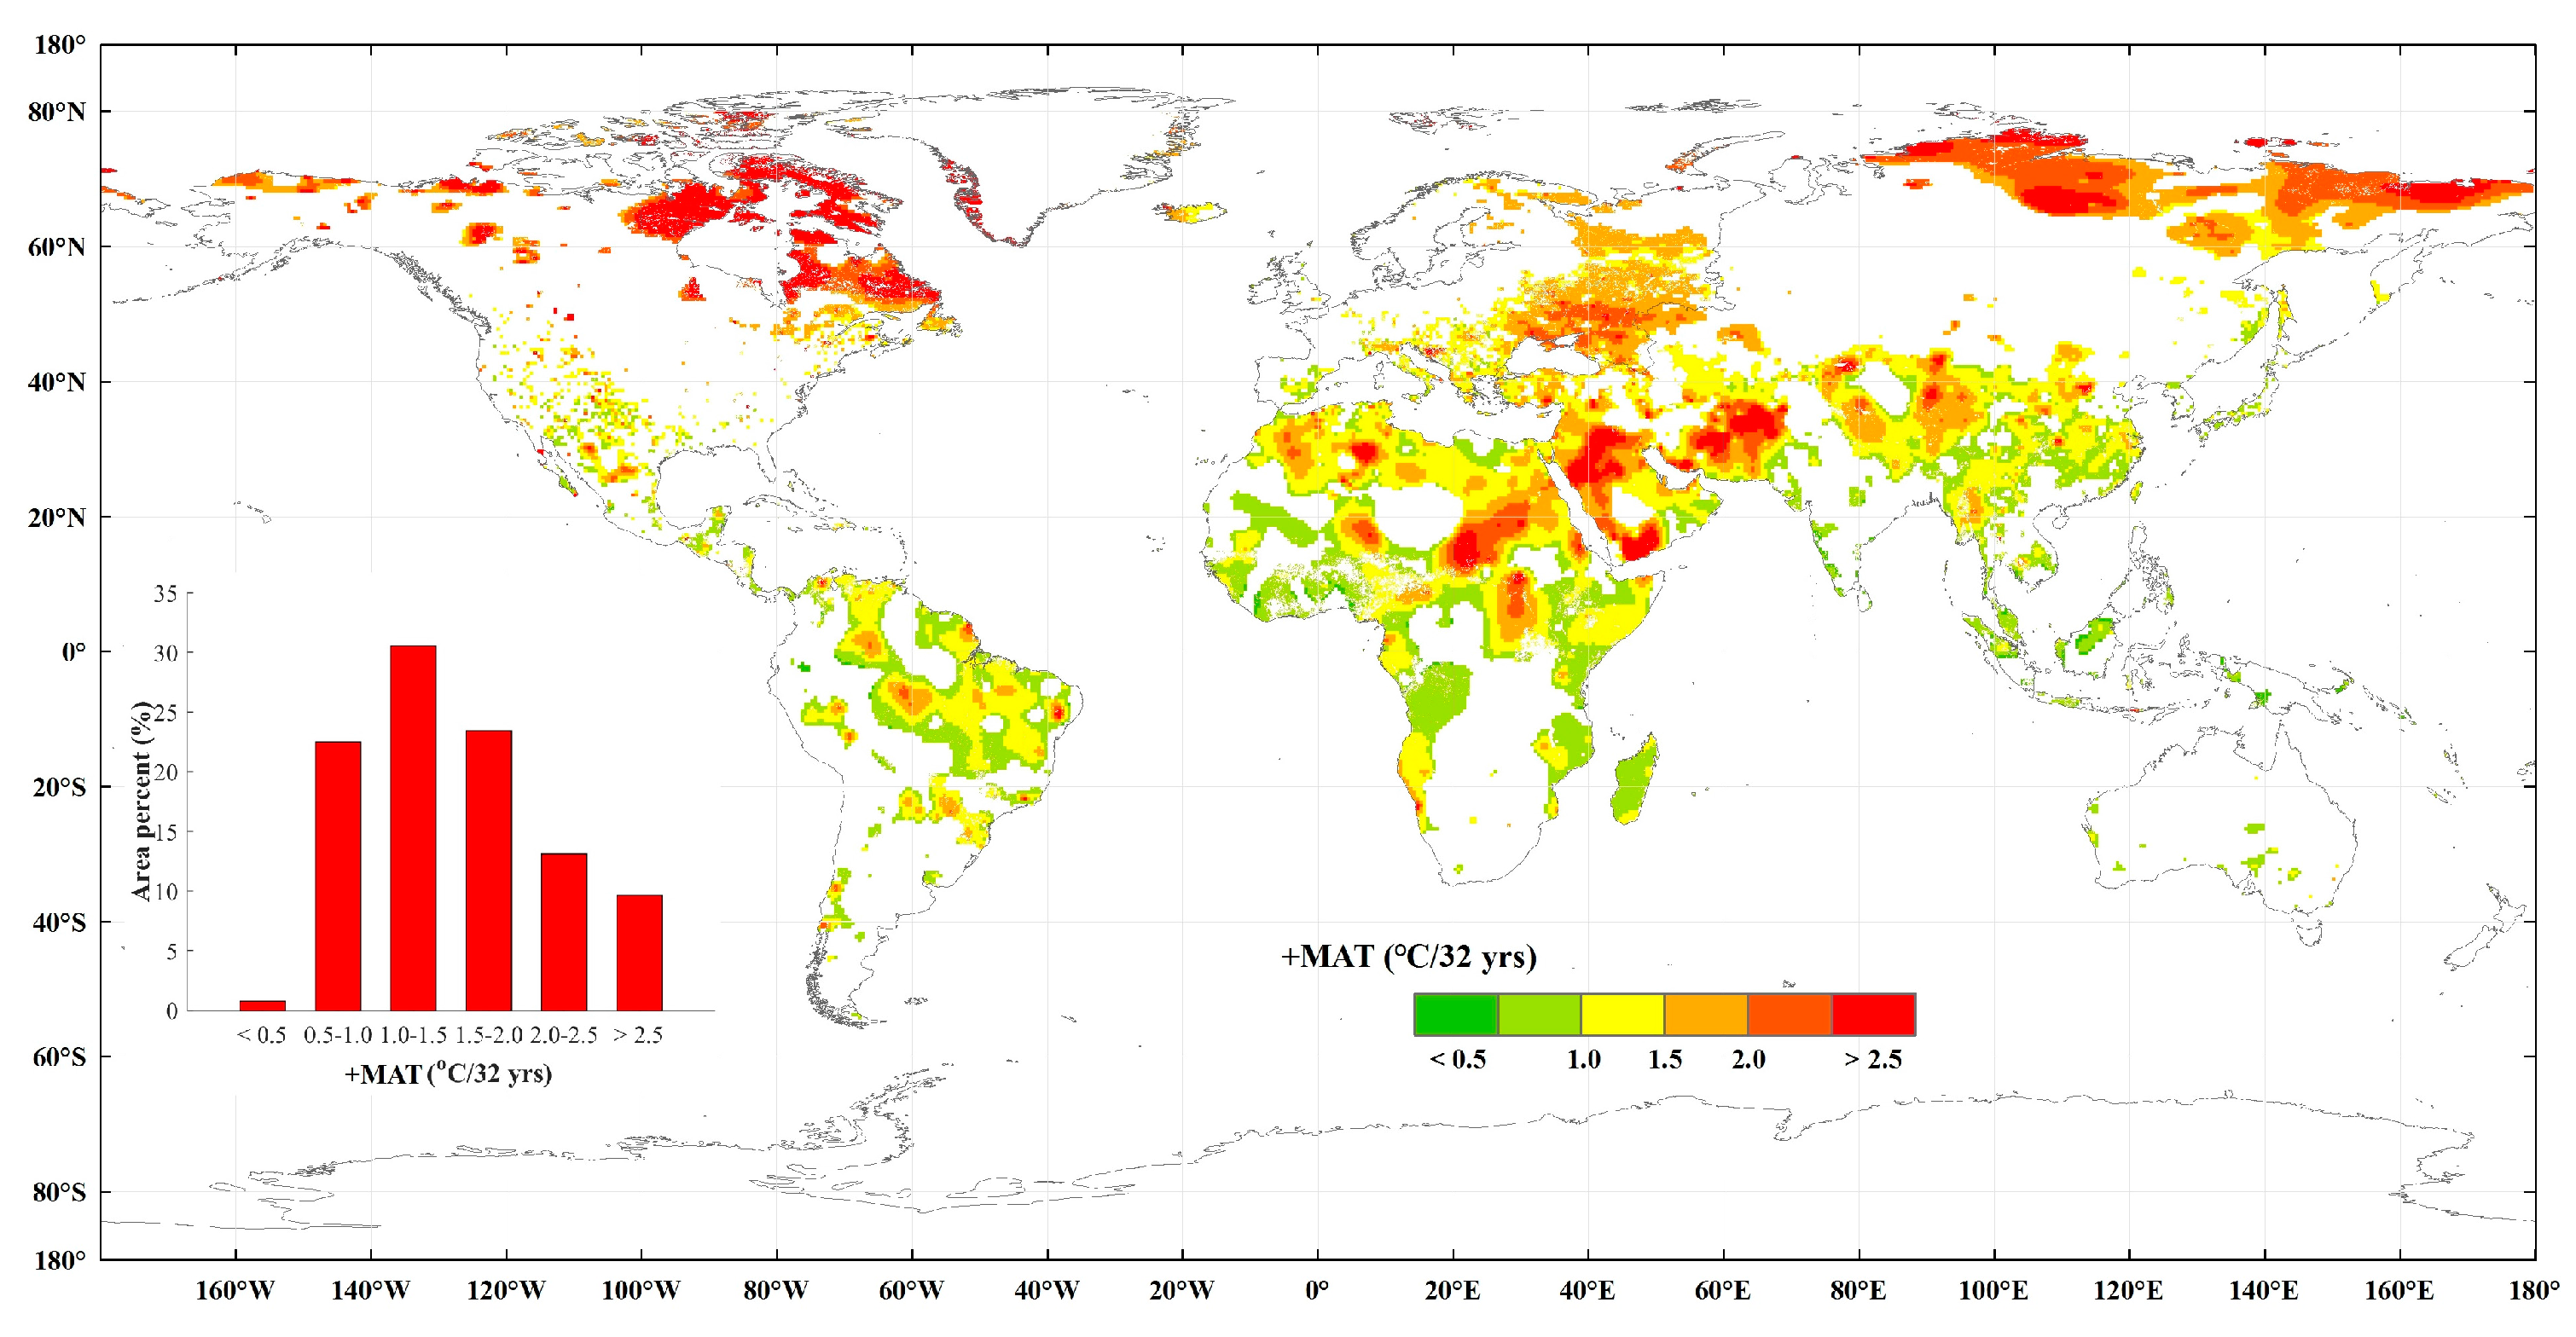
| Biome | Area (million km2) | Area Percent (%) | +MAT (°C) | +MAT at 90th Percentile (°C) |
|---|---|---|---|---|
| ENF | 4.82 | 3.51 | 0.28 | 2.65 |
| EBF | 10.34 | 7.52 | 0.47 | 1.53 |
| DNF | 2.37 | 1.72 | 0.39 | 2.11 |
| DBF | 1.44 | 1.05 | 0.37 | 1.82 |
| MF | 10.52 | 7.65 | 0.38 | 1.76 |
| SHR | 27.43 | 19.96 | 0.74 | 2.84 |
| WSA | 10.40 | 7.57 | 0.40 | 1.95 |
| SAV | 7.82 | 5.69 | 0.62 | 1.88 |
| GRA | 19.90 | 14.48 | 0.69 | 3.10 |
| CRO | 11.68 | 8.50 | 0.49 | 2.04 |
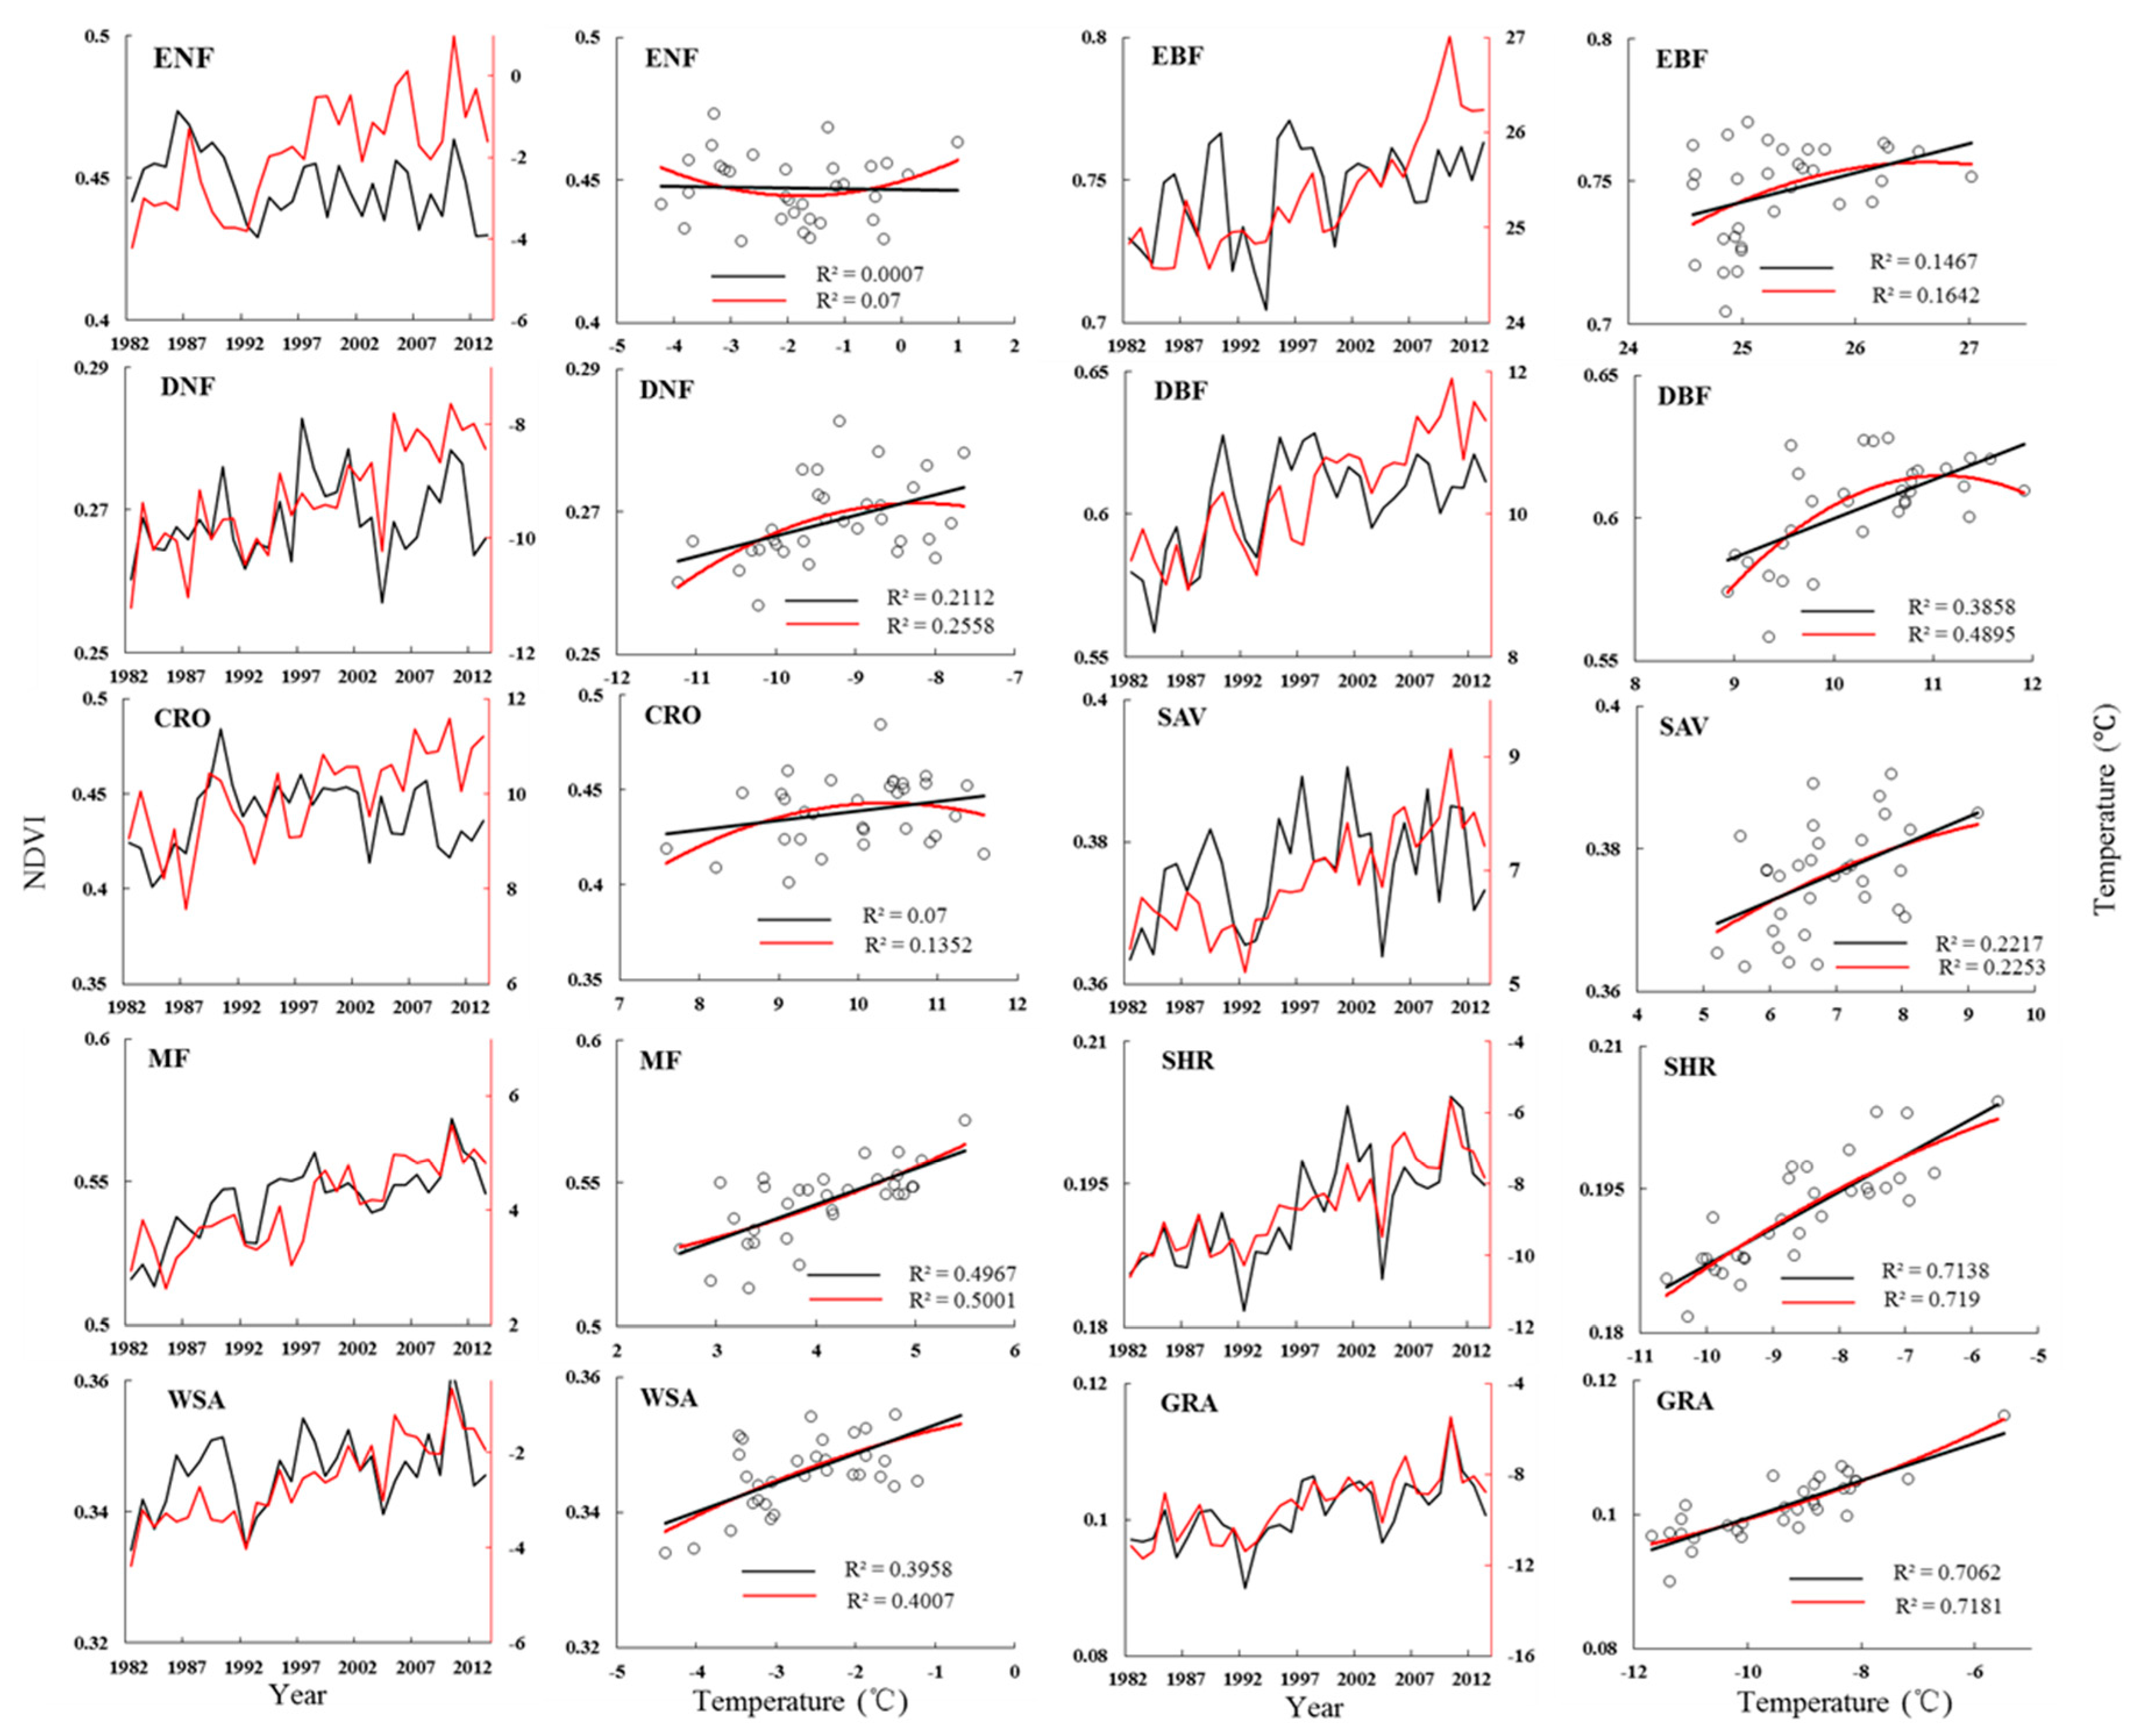
| ENF | EBF | DNF | DBF | MF | SHR | WSA | SAV | GRA | CRO | |
|---|---|---|---|---|---|---|---|---|---|---|
| Plinear | 0.888 | 0.031 | 0.008 | <0.001 | <0.001 | <0.001 | <0.001 | <0.001 | <0.001 | 0.143 |
| Pquadratic | 0.354 | 0.074 | 0.014 | <0.001 | <0.001 | <0.001 | <0.001 | 0.025 | <0.001 | 0.122 |
© 2017 by the authors. Licensee MDPI, Basel, Switzerland. This article is an open access article distributed under the terms and conditions of the Creative Commons Attribution (CC BY) license (http://creativecommons.org/licenses/by/4.0/).
Share and Cite
Li, F.; Zhang, X. Heat Response of Global Vegetation Biomes to Ongoing Climate Warming Based on Remote Sensing. Geosciences 2017, 7, 83. https://doi.org/10.3390/geosciences7030083
Li F, Zhang X. Heat Response of Global Vegetation Biomes to Ongoing Climate Warming Based on Remote Sensing. Geosciences. 2017; 7(3):83. https://doi.org/10.3390/geosciences7030083
Chicago/Turabian StyleLi, Fei, and Xiaoqiang Zhang. 2017. "Heat Response of Global Vegetation Biomes to Ongoing Climate Warming Based on Remote Sensing" Geosciences 7, no. 3: 83. https://doi.org/10.3390/geosciences7030083