Detecting Landscape Disturbance at the Nasca Lines Using SAR Data Collected from Airborne and Satellite Platforms


1
Cultural Site Research and Management Foundation, 2113 Saint Paul Street, Baltimore, MD 21218, USA
2
Jet Propulsion Laboratory, California Institute of Technology, 4800 Oak Grove Drive, Pasadena, CA 91109, USA
*
Author to whom correspondence should be addressed.
Geosciences 2017, 7(4), 106; https://doi.org/10.3390/geosciences7040106
Submission received: 1 August 2017
/
Revised: 12 October 2017
/
Accepted: 12 October 2017
/
Published: 16 October 2017
(This article belongs to the Special Issue Remote Sensing and Geosciences for Archaeology)
Abstract
:We used synthetic aperture radar (SAR) data collected over Peru’s Lines and Geoglyphs of Nasca and Palpa World Heritage Site to detect and measure landscape disturbance threatening world-renowned archaeological features and ecosystems. We employed algorithms to calculate correlations between pairs of SAR returns, collected at different times, and generate correlation images. Landscape disturbances even on the scale of pedestrian travel are discernible in correlation images generated from airborne, L-band SAR. Correlation images derived from C-band SAR data collected by the European Space Agency’s Sentinel-1 satellites also provide detailed landscape change information. Because the two Sentinel-1 satellites together have a repeat pass interval that can be as short as six days, products derived from their data can not only provide information on the location and degree of ground disturbance, but also identify a time window of about one to three weeks during which disturbance must have occurred. For Sentinel-1, this does not depend on collecting data in fine-beam modes, which generally sacrifice the size of the area covered for a higher spatial resolution. We also report on pixel value stretching for a visual analysis of SAR data, quantitative assessment of landscape disturbance, and statistical testing for significant landscape change.
1. Introduction
1.1. Applications of SAR to Archaeology: The State of the Art
The use of a synthetic aperture radar (SAR) for archaeological research and management began as early as the 1980s, when paleo-riverine networks and soils altered by agriculture provided clues to the locations of ancient sites in desert environments [1,2,3]. By the first decade of the twenty-first century, the direct detection of archaeological sites with SAR data collected by aerial platforms, notably AirSAR and GeoSAR [4], sometimes in concert with multispectral data [5,6,7], had been demonstrated.
Recent years have seen a surge in interest in using satellite SAR data for research and the management of archaeological sites and landscapes. This is partly due to the profusion of SAR data being collected: satellite SAR instruments can cover much greater areas than airborne SAR, and satellite SAR can now be obtained for, essentially, the entire world. In this project, we used data collected in Sentinel-1’s Interferometric Wide (IW) Swath mode, which covers a strip 250 km wide. This data is collected continually, and there is no need to place a special order or pay for it, making it eminently practical for the constant monitoring of large areas.
Satellite SAR data acquired in fine-beam or spotlight modes can be expensive or difficult to acquire, but it can also achieve pixel sizes as small as those generated from some kinds of optical satellite data. Even casual users of satellite imagery are familiar with the usefulness of high-resolution optical data, which facilitates the visual identification and analysis of features on the ground. The color images in Google Earth, for example, can be pan-sharpened to produce 65 cm pixels (though in certain regions, pixel size can be 2.5 m or even 15 m). For-profit companies offer imagery with even greater resolution: DigitalGlobe advertises that imagery generated from its WorldView-3 satellite has a pan-sharpened pixel size of 31 cm and an accuracy better than 5 m.
In comparison, however, TerraSAR-X satellites collect X-band data that can produce 16 m pixels when operating in ScanSAR mode over a scene 100 km by 150 km, and 0.24 m pixels in Staring Spotlight mode over an area that varies from 2.5 to 2.8 km in azimuth and 4.6 to 7.5 km in range [8]. ALOS PALSAR-2, COSMO-SkyMed, and Radarsat-2 can also provide imagery with pixels smaller than 1 m. As with high-resolution optical data, one can often discern targets of interest in high-resolution SAR amplitude imagery. Further, SAR data, unlike optical data, can be collected regardless of clouds or solar illumination. SAR’s indifference to these conditions is a great advantage over spectral data, particularly in parts of the world where cloud cover is common, and it is obviously valuable for change detection.
In some cases, such as when the features under consideration are characterized more by their spectral reflectance than their physical shape, SAR may be no more useful than spectral data for detection or monitoring [9,10]. In others, SAR’s sensitivity to structure makes it a clearly superior tool for site and feature detection. For example, at Pachacamac, in Peru, COSMO SkyMed X-band high-resolution imagery (with a pixel size of 3 m) was used to detect earthen structures that are only partially above ground; visually, these structures would be difficult to distinguish from the surrounding landscape [11]. An interferometric analysis of SAR data (InSAR) has been used to detect and measure deformation of the Earth’s surface, including that produced by seismic or volcanic activity or by groundwater depletion. Depending on the application, SAR can be used to measure such deformation at centimeter scales [12]. Surface deformation that threatens the ancient venue for the Olympics has been monitored with Differential Interferometric SAR (DInSAR) [13]. High-resolution TerraSAR-X data is being used to monitor ground subsidence in the ancient quarters of Mexico City [14]. The movement of the monuments at Angkor, along with changes in surface elevation, has been monitored with TerraSAR/TanDEM-X data [15].
For general discussions of the technical aspects of SAR as they relate to archaeology, we direct the reader to other works [16,17]. Several studies have applied satellite SAR data analysis to our area of interest (which offers a particularly suitable environment for SAR research, as we describe in the next section), demonstrating the technology’s usefulness in archaeological prospection [18,19] and research on the regional environment and its influences on human activity [20]. Satellite spectral data has been used for similar purposes [21,22].
This area has also been the focus of several studies on the use of SAR for monitoring anthropogenic and natural changes to the landscape [23,24,25]. It is on these applications of SAR that, with this project, we aimed to build a model by using satellite SAR to detect landscape disturbance on a finer scale than any of the studies just referenced; by proving the concept that high-temporal-resolution satellite SAR data can provide a continual stream of current, relevant information for protected area management and research; and by demonstrating that this data provides the basis for a quantitative assessment and the statistical testing of landscape disturbance in specific areas at small scales. In so doing, we demonstrate some advantages of satellite SAR over other potential monitoring methods, such as ground survey or change detection with high-resolution spectral data.
1.2. The Contribution of Correlation Images Generated with UAVSAR and Sentinel-1 Data
We demonstrate the capacity of repeat-pass InSAR to monitor small-scale landscape change, and more specifically to measure land-surface change caused by, for example, flooding, mining, erosion, and even vehicular and pedestrian traffic. The detection of landscape disturbance at the structural, and even micro-structural, level described here is different from the many applications of SAR data to archaeological landscape monitoring that have focused on ground deformation [14], large-scale erosion [25], and, more recently, the movements of monuments [15].
Our demonstration area is the Lines and Geoglyphs of Nasca and Palpa World Heritage Site (hereafter referred to as the Nasca Lines World Heritage Site), in southern Peru (see Figure 1). An analysis of L-band SAR data collected from an airborne platform over the Nasca Lines World Heritage Site demonstrates the data’s utility in monitoring the landscape and its archaeological features. Section 2 begins with an account of that analysis, which follows from work published in 2015 [26]. With the results of that analysis in mind, we hypothesized that satellite SAR data, specifically C-band Sentinel-1 data, acquired at different times over the same area, could detect locations where the landscape had been changed by relatively small-scale disturbances, such as those listed above.
These disturbances are a constant concern at the Nasca Lines World Heritage Site, which was designated to recognize and protect the fragile arrangements of stones and soil left on the area’s desert floor by ancient civilizations (first the Paracas people, then the Nasca) between approximately 700 BCE and 700 CE. Viewed from above, these arrangements take a variety of forms: geometric shapes, animals (such as the famous Hummingbird glyph), plants, humans, and mythological beings [27,28]. Despite the passage of centuries, the forms have been largely preserved. In cases where the glyphs’ constituent stones or soil have been disturbed, further damage may be more likely due to the increased vulnerability to wind and water erosion [29,30].
This area was an ideal test site for our application of SAR to the precise detection of landscape disturbance. The Nasca Lines World Heritage Site is in the Peruvian-Chilean Desert, one of the most arid places on Earth. In the flat areas, or pampas, where the lines and geoglyphs are found, vegetation is almost absent, except in stream and river valleys that run through the desert on their way to the Pacific Ocean. This was helpful because SAR easily detects seasonal vegetative change and water, which manifest in the data similarly to landscape change and can therefore mask the disturbances with which we were concerned.
Villages in this area, both modern and ancient, are located along the rivers and streams that cut through the pampas. Rapid population increase in extant villages, many of which are becoming cities, as well as increasing tourism, have encouraged human activities that have degraded some of the lines and glyphs; during fieldwork for this project, for example, Ministerio de Cultura personnel pointed out a geometric glyph on which people from a nearby, expanding village play soccer, using the glyph’s edges as boundaries. Monitoring destructive activities using traditional, on-the-ground methods is challenging because of the vast area that the lines and glyphs occupy (the Nasca Lines World Heritage Site covers over 73,000 hectares) and the impracticality of preventing access to it. As we show in the Results, the advantages of satellite SAR, and particularly Sentinel-1, that we described in Section 1.1, include high temporal resolution, wide area coverage, and sensitivity to structural change that can help circumvent this challenge.
We calculated the InSAR coherence, or correlation, for a pair of data sets collected by the National Aeronautics and Space Administration (NASA)/Jet Propulsion Laboratory (JPL) Uninhabited Aerial Vehicle Synthetic Aperture Radar (UAVSAR) platform on 19 March 2013 and 23 March 2015. In addition to the general observations that arose from analyzing this data and encouraged our further experimentation with Sentinel-1 data, an incident that occurred in the December of 2014, between the two UAVSAR flights, was of particular interest. Persons affiliated with Greenpeace, a non-governmental organization with an environmental focus, placed panels on the ground to form the message “Time for change! The future is renewable, Greenpeace” very near one of the most famous and pristine Nasca geoglyphs, the Hummingbird. The place and means of disturbance were well documented: Greenpeace posted a video on the internet that showed its team’s approach to the glyph, the placement of the message, and aerial photos of the glyph and message together [31]. Because of the geoglyphs’ extreme fragility, access to this area had been prohibited for decades before the incident (though this did not prevent unpermitted access). Greenpeace’s activity offered an opportunity to determine, with UAVSAR, SAR data’s utility in detecting, evaluating, and testing for landscape disturbance. We then followed a similar process in analyzing pairs of data sets collected by the Sentinel-1 satellites. Sentinel-1’s data collection interval of six to twenty-four days made such an analysis particularly attractive, because it suggested the potential to use satellite SAR data to monitor landscape change, and therefore some threats to cultural and natural resources, over large areas and with a relatively high temporal resolution.
2. Materials and Methods
Acquiring the L-Band UAVSAR Data and Producing the Initial Correlation Images
UAVSAR is a NASA/JPL L-band airborne SAR platform, funded by NASA to conduct research for its Science Mission Directorate, that has been in operation since 2009. UAVSAR is designed to collect fully polarimetric SAR data at a spatial resolution of about two meters from an aircraft that can fly near-exact-repeat flight lines for interferometry research and applications [26].
In March 2013, UAVSAR data were collected opportunistically over the Nasca Lines, when the UAVSAR platform flew over them during a deployment to image volcanoes in Chile, simply to see how the lines and geoglyphs might appear in airborne SAR imagery. A second UAVSAR data set was gathered in March 2015 to see if the production of a very high-resolution correlation image could allow for the detection and measurement of disturbance to the geoglyphs, and to the Hummingbird geoglyph in particular. After examination of the correlation image, it became apparent that UAVSAR data could be used not only to evaluate damage to the Hummingbird geoglyph and the area immediately around it, but also to detect other ways in which the Nasca Lines had been disturbed and, more importantly, could be further disturbed in the future [26].
The UAVSAR has a wavelength of 23 cm and flies aboard the NASA Armstrong Gulfstream C-20A aircraft. This aircraft has been modified to fly extremely precise planned flight paths, such that it can repeat a previously flown path and only rarely diverge from it by more than five meters over hundreds of kilometers of flight. This allows the data from two or more UAVSAR flights to be made into interferograms or correlation images with a near-zero baseline between observations, using the technique called InSAR. With the UAVSAR datasets collected in March 2013 and March 2015, we generated a high-resolution correlation image that displays the degree to which SAR returns obtained in the first deployment of UAVSAR are statistically different from those obtained in the second [26].
The UAVSAR data were processed as “Single Look Complex” (SLC) image files. Each pixel in these files contains both the magnitude and phase of the SAR backscatter. As described below, the correlation image is produced from the SLC image files and has an output ground pixel spacing of about two meters.
To generate a correlation image that was sensitive to ground disturbance, we co-registered each pixel in the SLC images from the two UAVSAR flights. We then obtained a calibrated interferometric correlation γcal using Equation (1) [32], as follows:
where E1 and E2 are the SLC estimates of the calibrated complex electric field for the two data takes and the ensemble average is over a given number of statistical looks. The * indicates the complex conjugate. The SNR is the signal-to-noise ratio, where the noise is given by an empirically derived quadratic fit to the noise-equivalent, radar-backscattered power of the image. γcal can vary between 0 (complete decorrelation or, equivalently, no correlation between the two images) and 1 (no decorrelation or, equivalently, complete correlation between the images). Normalization by the SNR can result in some areas having a correlation greater than 1, particularly in those areas that are shadowed by topographic features. For Sentinel-1 data, the correlation product can be obtained using the standard approaches implemented by the European Space Agency’s (ESA’s) Sentinel Application Platform (SNAP) [33]. For the UAVSAR data, Equation (1) was coded in the interactive display language (IDL).
As mentioned in the Introduction, one general property of the correlation data product is that vegetated areas have much lower values than areas without vegetation. Open water also decorrelates, because the scattering of the radio waves is highly variable over water. Atmospheric conditions can interfere with SAR collection, but we did not observe any kilometer-scale effects on the coherence from tropospheric water content, which is often visible in InSAR interferometric phase measurements.
The desert pampas of the Nasca Lines World Heritage Site are almost completely lifeless and static, and therefore, absent of any changes to the ground surface, the correlation in these areas should be close to 1. In areas with steep slopes, however, there is often decorrelation caused by erosion: in such places, a small movement of soil or stones can be augmented by gravity, resulting in greater decorrelation than would have been caused by a similar movement on flat ground. In both the UAVSAR and Sentinel-1 data, we found that such downslope erosion is common in the Nasca Lines World Heritage Site. (In applications to similar phenomena at larger scales, satellite SAR has been used to study landslides [34]).
The correlation products developed from SAR data can be visualized as gray-scale images, with pixel values ranging from 0 (black) to 255 (white). Lesser correlation (greater decorrelation) is indicated by darker pixel values. That is, for dry areas without vegetation, we can generally infer from the correlation images that the greater the landscape change over the two-year period between UAVSAR flights, the greater the difference between the returns from the two data takes, the lower the correlation (the greater the decorrelation), and the darker that area appears in the correlation images. This decorrelation might be caused by natural disturbances, such as erosion by flooding, or by anthropogenic disturbances, such as urban or agricultural development or surface disturbance by vehicles.
In the UAVSAR correlation image, to make decorrelation at the Greenpeace protest site more visually evident, we assigned a color scale to the correlation values, making areas of no or very low decorrelation green and areas of high decorrelation red (see Figure 2). Yellow (medium-low decorrelation) and orange (medium-high decorrelation) pertain to values between the extremes. To soften the effects of noise and of minor phenomena not pertinent to substantial landscape change, we modified the color scale with a stretching technique that assigns values farther than one standard deviation from the mean of the most extreme possible values (that is, values that are greater than one standard deviation from the mean in the positive direction take the value 255, and values greater than one standard deviation from the mean in the negative direction take 0) and squares values that are within one standard deviation of the mean. This made the minor landscape changes that were unlikely to be associated with real threats to cultural resources much less salient; it had a similar effect on most, if not all, of the noise inherent to the SAR instrument. It also highlighted the areas of greatest and least change. Red areas in the colorized image can therefore safely be considered locations where real and substantial terrain disturbance has occurred, and areas shaded yellow to orange are candidates for further investigation to determine whether there are ongoing natural or human disturbances to the landscape.
There are many options for modifying color tables and scales when visualizing results like these; we explore other options in subsequent figures. The correlation data products we generated, however, also allow for other forms of analysis. To quantitatively assess and verify the disturbances that are apparent in the colorized images, we used tests for statistically significant differences among sets of correlation pixel values. As reported elsewhere [26], the UAVSAR correlation image clearly reveals disturbance where Greenpeace placed its message, along the route the activists used to approach the Hummingbird, and in the areas where they placed and prepared their equipment. The details and results of the application of a Wilcoxon rank-sum test to corroborate visual evidence of disturbance at the Hummingbird glyph with the correlation images is discussed in Section 3.
Other locations where landscape disturbance occurred during the two-year window between UAVSAR flights can also be seen in correlation images. On-the-ground examination of these areas indicated that terrain disturbance had resulted from several kinds of ongoing activity. Among these were illegal mining operations, unsustainable agricultural practices, the looting of archaeological sites, and rain events associated with the El Niño–Southern Oscillation (ENSO) cycle. Personnel from JPL/NASA, the CSRM Foundation, and the Ministerio de Cultura Management System for the Cultural and Territorial Heritage of Nasca and Palpa went into the field several times from January through March 2016 to verify these and other apparent disturbances. The goal of these field sessions was to corroborate or correct our interpretations of the correlation data, including the location, causes, and intensity of disturbance. Data collection methods included photography, note-taking, and accessing and editing our GIS using mobile devices running the ArcGIS Collector app. This field verification was indispensable to drawing reliable conclusions about the location, degree, and cause of landscape disturbance within and around the World Heritage Site.
Results suggesting that the UAVSAR data detected landscape change and provided insight into the degrees and causes of change are discussed further in the next section. Having acquired these results, we built upon our analysis of the UAVSAR data by applying a similar analytical process to C-band SAR data gathered by the Sentinel-1 satellites, aiming to assess the utility of that data in pursuing the kinds of monitoring tasks we had demonstrated with UAVSAR.
Sentinel-1A, launched on 3 April 2014, carries a C-band SAR instrument that transmits and receives radiation at wavelengths of about five centimeters. It and its identical companion, Sentinel-1B, which was launched on 25 April 2016, are part of the European Union’s Copernicus Earth observation program. They can operate in four imaging modes: Interferometric Wide (IW), Extra Wide (EW), Strip Map (SM), and Wave (WV). The first two modes are regularly used to collect data over much of the Earth’s land surface. The IW mode is commonly applied over land and typically used to cover the Nasca Lines World Heritage Site. It provides a single-look spatial resolution of better than 20 m over a strip 250 km wide [33]. Interferometric Sentinel-1 data is being used widely for the rapid imaging of surface displacements caused by earthquakes, subsidence, and landslides [35], as well as other applications at various spatial scales.
3. Results
3.1. Field Verification of UAVSAR and Sentinel-1 Correlation Images
3.1.1. UAVSAR
Our observations on the ground indicate that even small surface disturbances are visible as slightly decorrelated areas in the UAVSAR-derived correlation images. For example, minor erosion caused by low volumes of water moving slowly across the ground surface, which was documented at the time of its occurrence by Ministerio de Cultura personnel, appears as light gray areas in the gray-scale images. Heavily traveled roads and pedestrian trails are black in the gray-scale images, as are steep hillsides where substantial volumes of soil and rock moved downslope [26].
During field observations, it was evident that landscape disturbance caused by human activities, such as walking or driving across the pampas, are threatening the preservation of the Nasca lines and geoglyphs and degrading the Rio Grande de Nasca drainage. We also found that different forms of landscape disturbance can be distinguished by their appearances in the UAVSAR correlation image (see Figure 3). The data, and therefore the image, are highly precise: even minor terrain disturbances were detected, and the degree of decorrelation in the image is obviously associated with the intensity of disturbance on the ground.
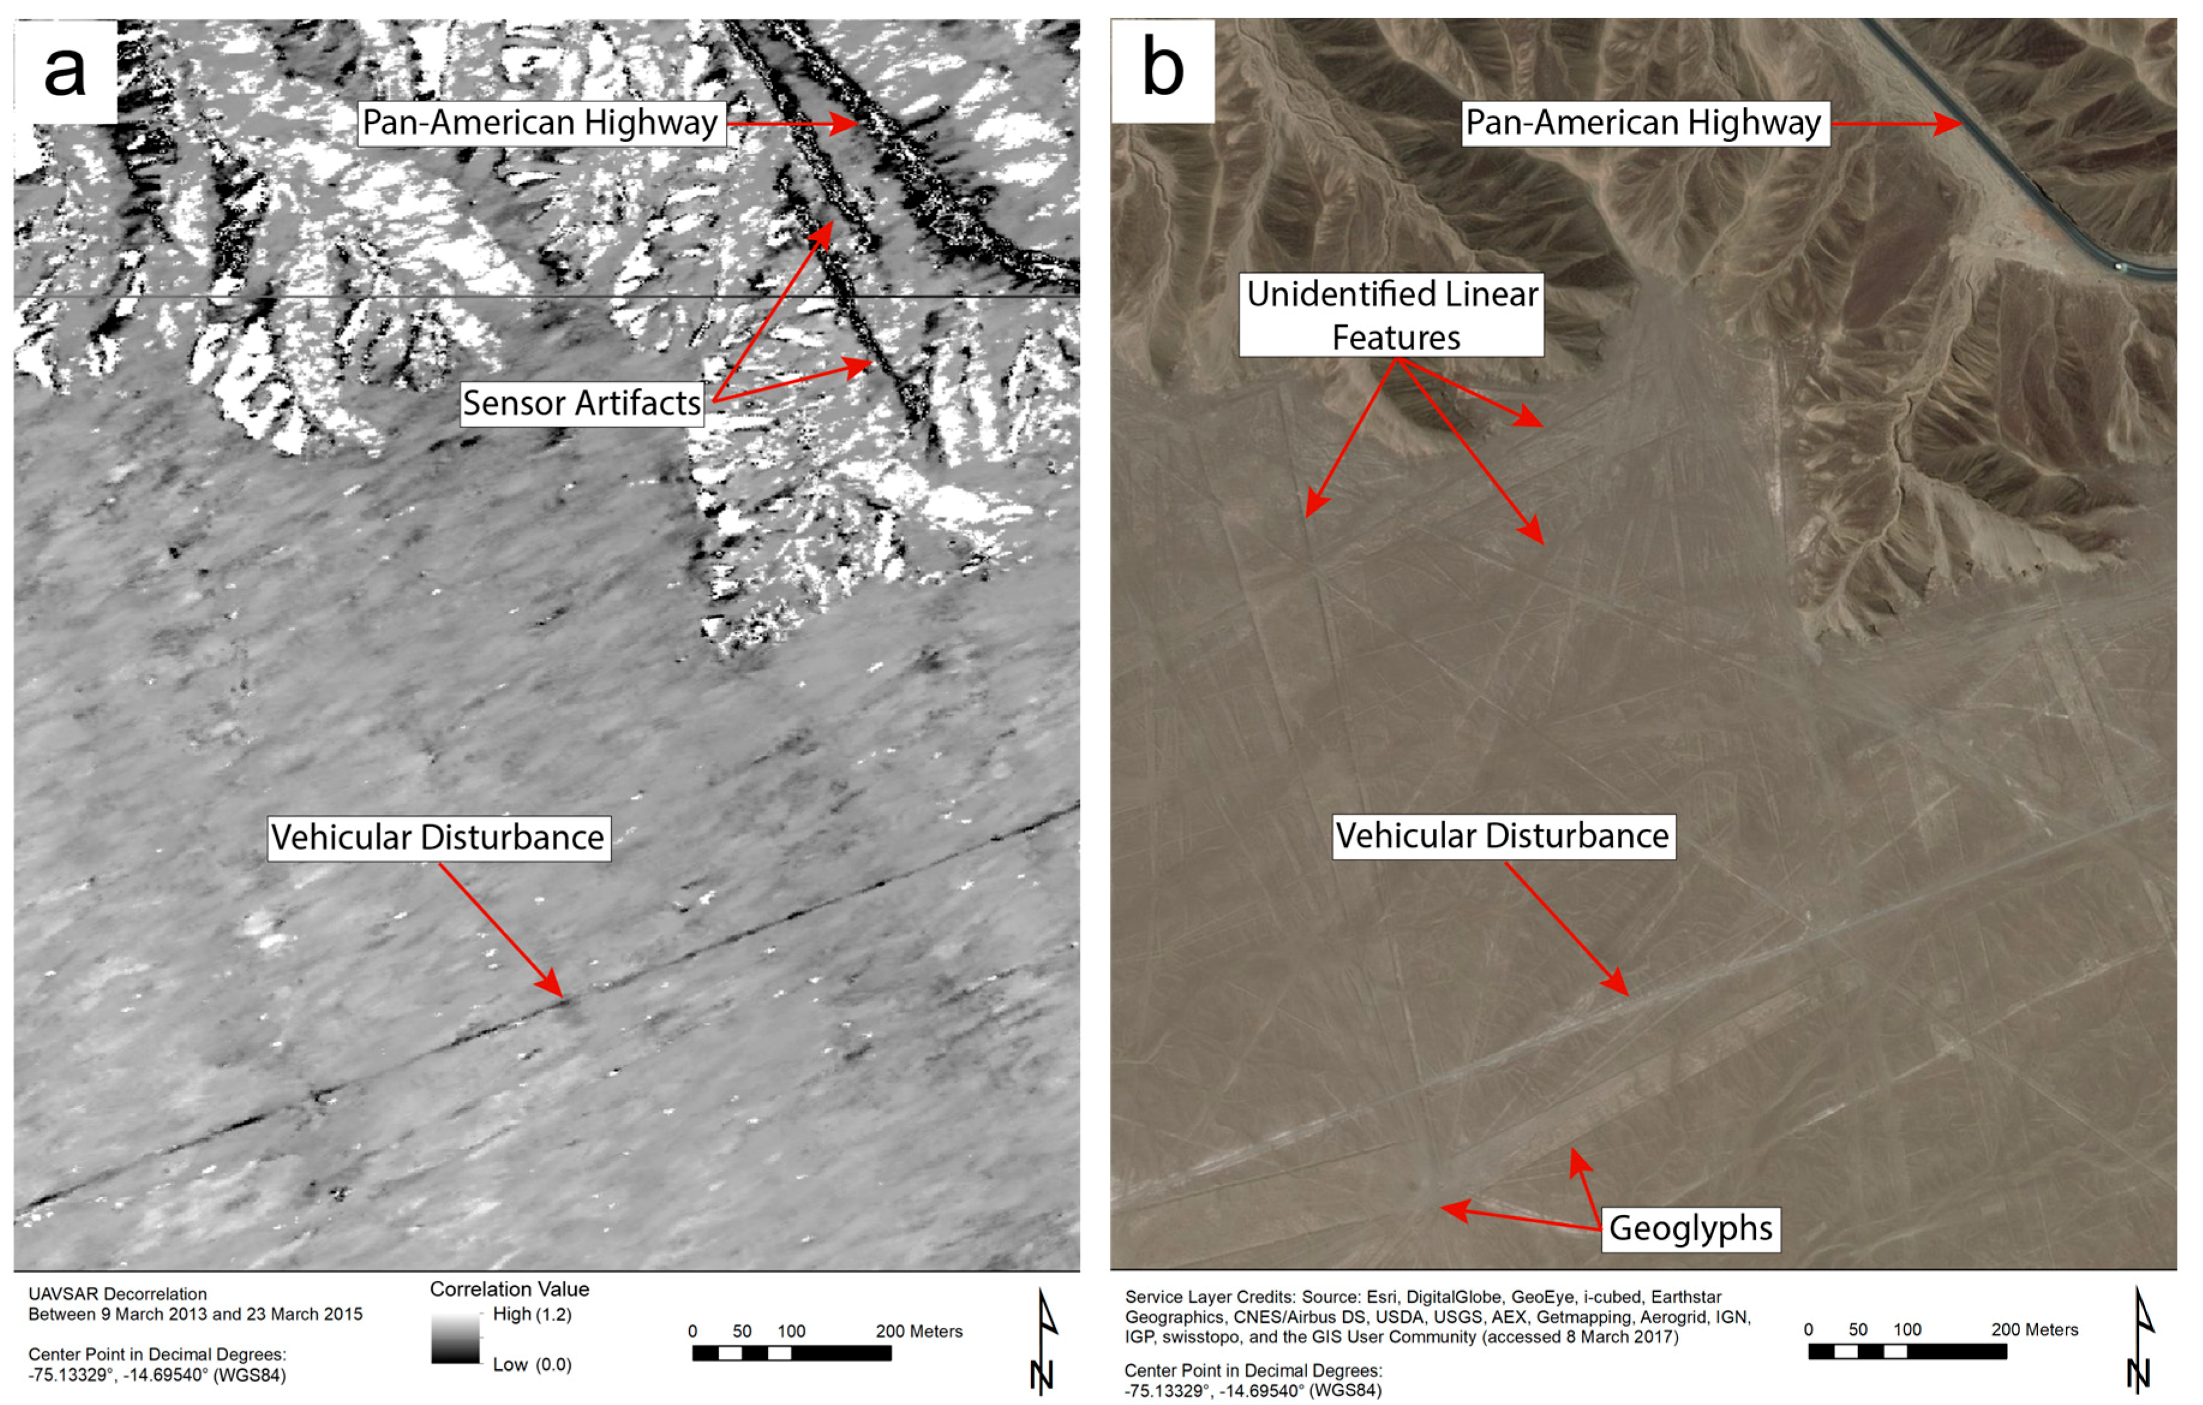
Among the more remarkable applications of the UAVSAR correlation images is in revealing the unpaved paths and roads that were traveled between data takes. Figure 4 shows disturbance to a dirt road leading from the Pan-American Highway in the east to a power line running across the pampas in the west. In satellite imagery of the same area, there is little to distinguish this road from other, nearby lines on the ground, which may be geoglyphs, trails, or other dirt roads (during fieldwork, the features labeled as geoglyphs at the bottom of Figure 4b were positively identified). The correlation image, however, clearly shows that this particular road was disturbed. Also visible in Figure 4a are signs of interference with SAR waves by vehicles on the Pan-American Highway. These so-called sensor artifacts have no association with features on the ground.
3.1.2. Sentinel-1
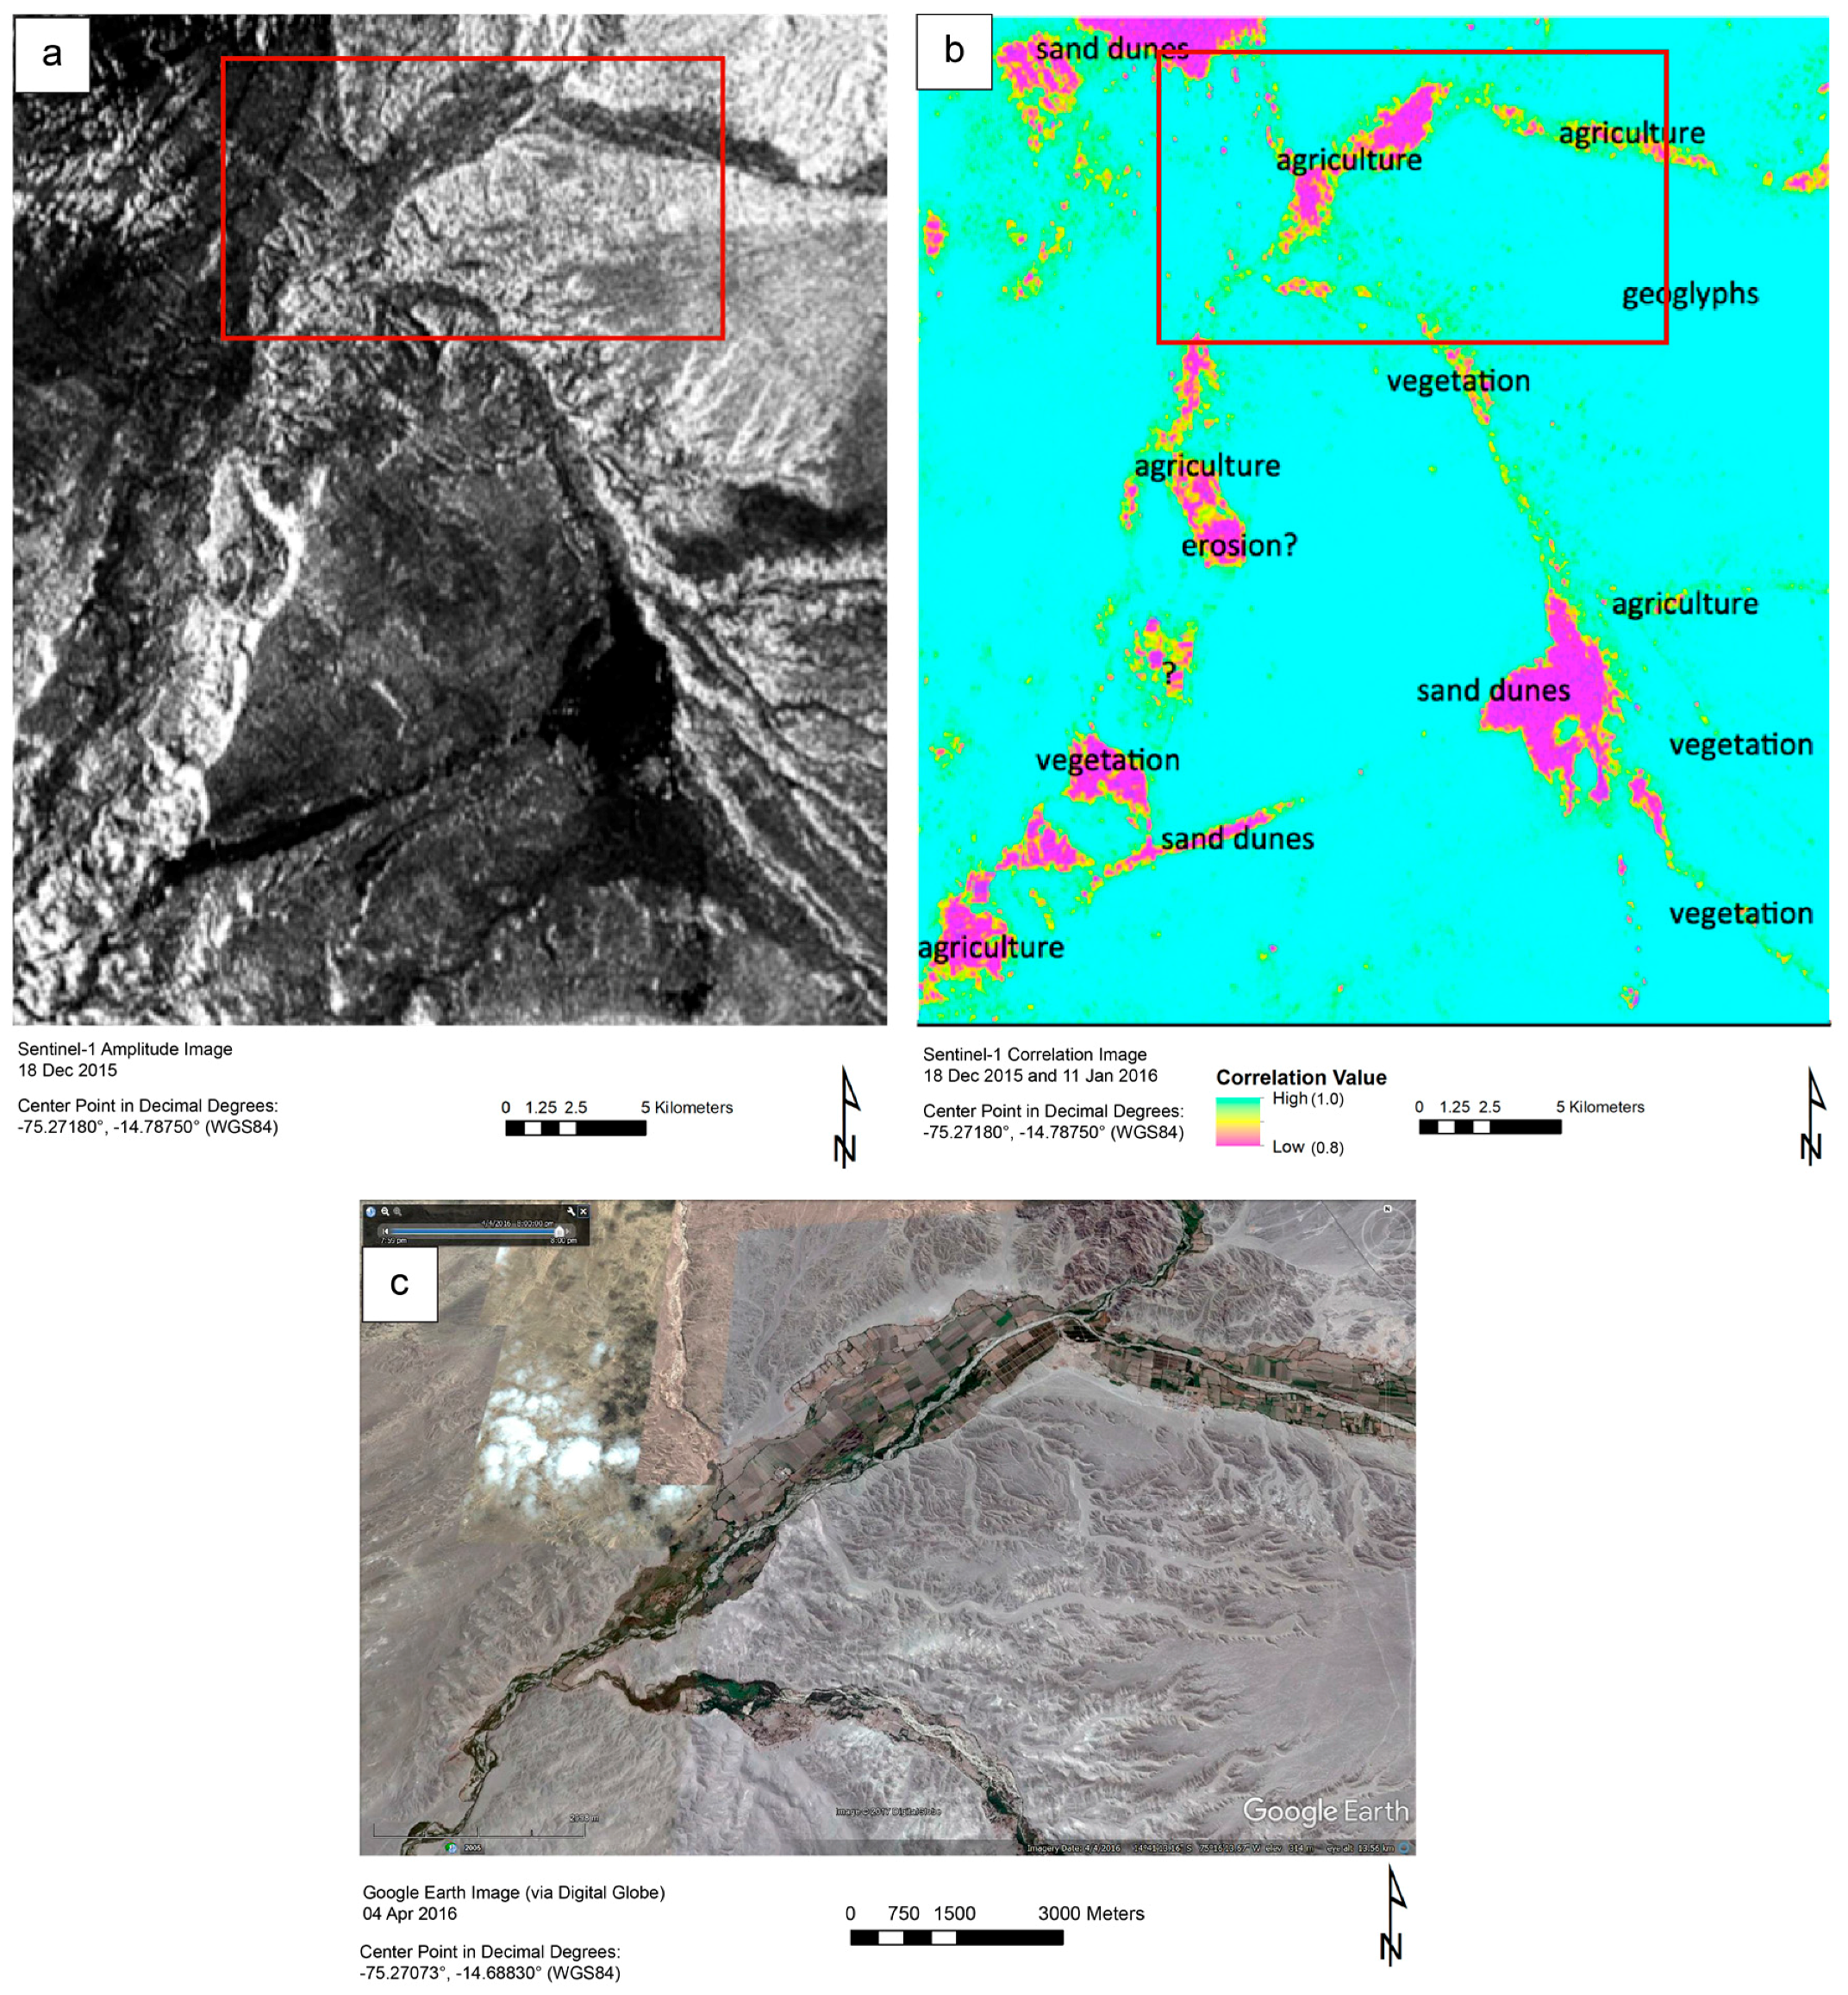
Despite its lower spatial resolution, the Sentinel-1 data proved useful in similar ways. Figure 5 illustrates the difference in utility between a Sentinel-1 amplitude image and a correlation image derived from two acquisitions forty-two days apart. While the amplitude image shows similar backscatter features for very different kinds of ground cover and structure, the correlation image specifically differentiates three land cover classes from the dry pampas landscape: natural vegetated areas, cultivated vegetated areas, and sand dunes. All these areas were decorrelated after forty-two days.
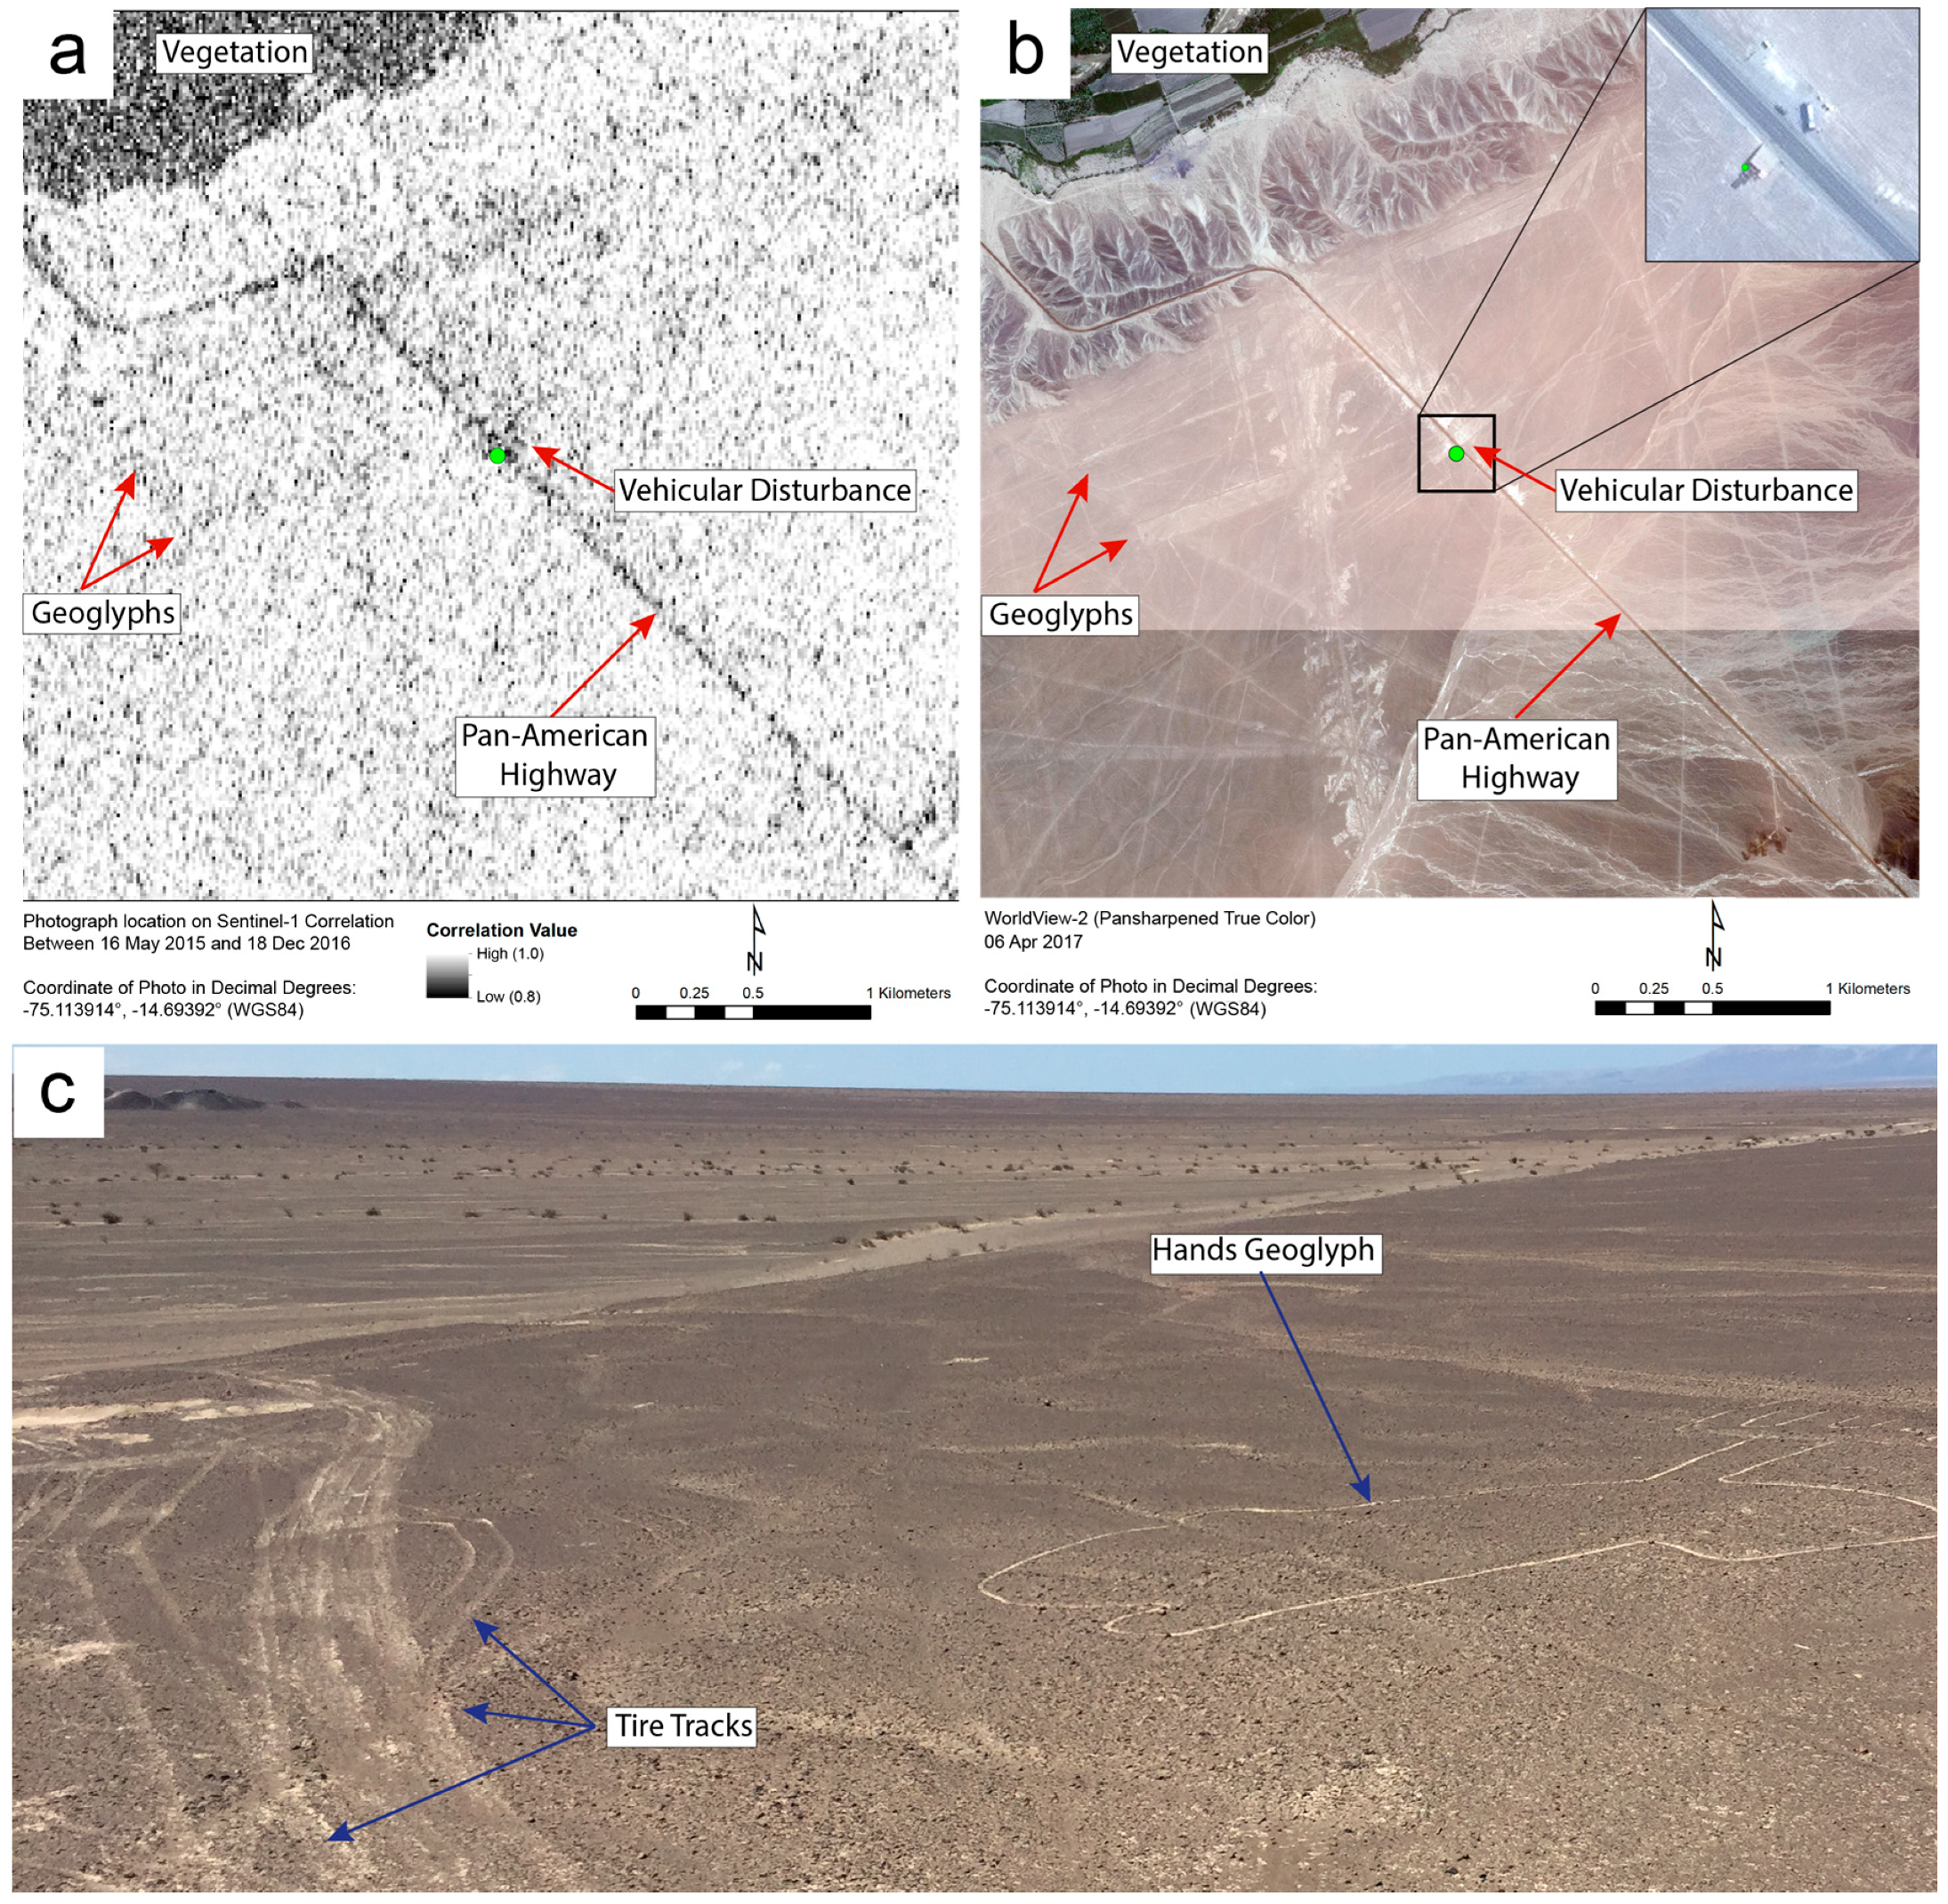
Satellite SAR data, specifically TerraSAR-X [25] and ERS-2 [23] data, has been used to identify erosion and sedimentation in the Nasca area at small scales, but the disturbance revealed here by Sentinel-1 is yet more subtle. Figure 6 shows the area along the Pan-American Highway near an observation tower. From the tower, visitors can view some of the nearby lines and geoglyphs on both sides of the road.
Panel 6a is a correlation image generated from Sentinel-1 data takes on 16 May 2015 and 18 December 2016. The Pan-American Highway appears as a dark line that runs from the southeast to the northwest (in [24], the highway manifests similarly in a correlation image derived from ENVISAT-ASAR data). Panel 6b is a pan-sharpened WorldView-2 optical satellite image. In it, the observation tower and the area where vehicles were driven off the highway are visible, but this single image cannot tell us when the vehicle tracks were made. The decorrelation in Figure 6a, however, tells us that the disturbance occurred between 16 May 2015 and 18 December 2016.
The green dots in Figure 6a,b show where the photo in Figure 6c was taken. This picture shows where vehicles were driven off the paved highway near the observation tower. Their tracks are clearly visible and indicate that some of the vehicles were driven some distance past the highway’s eastern edge. The correlation image in Figure 6a shows these disturbed areas as dark patches of pixels. Other decorrelation in Figure 6a is very near the geoglyph called the Hands, which is visible at the right of the photo in Figure 6c.
Figure 7 provides similar ground-verified evidence of disturbance. Panel Figure 7a contains a correlation image of Cahuachi, a major ceremonial center of the Nasca culture during the early centuries of the Common Era, generated using data collected by Sentinel-1 on 16 May 2015 and 18 December 2016. As in the other correlation images, dark pixels indicate decorrelation. Heavily vegetated areas, such as those along the Rio Grande de Nasca (which runs across the image from top left to center right), appear as masses of dark pixels. The green dot in Figure 7a,b, which shows a pan-sharpened WorldView-2 image, indicates the intersection of an unpaved road and a pedestrian trail where the photo in Figure 7c was taken. Both the road and the trail are visible in Figure 7b,c. They also show up as lines of dark pixels in Figure 7a, which suggests they were used between 16 May 2015 and 18 December 2016. Satellite SAR has been used to detect ground disturbance and soil moisture changes at Cahuachi, but not, apparently, at such a high spatial resolution [20]; past studies have not, as far as we are aware, revealed evidence of vehicle or foot traffic along unpaved routes near the site.
Figure 6 and Figure 7 are examples of our evidence that support the idea described at the end of Section 1.2: that Sentinel-1 SAR data, with its high temporal resolution, is useful for monitoring landscape change, and threats to cultural and natural resources in particular, in areas like the Nasca Lines. This data allows us not only to identify the location and measure the intensity of disturbance, but also to infer a usefully small time window within which the disturbance must have occurred. By continually generating Sentinel-1 correlation images, researchers or site managers can gather helpful information on where disturbance is happening, what kind of disturbance it might be, and when it happened. For example, looting is a major problem in and near Cahuachi; correlation images derived from Sentinel-1 data can show which paths or roads leading to the site have been used, or whether new looting pits have been dug, every six to twenty-four days.
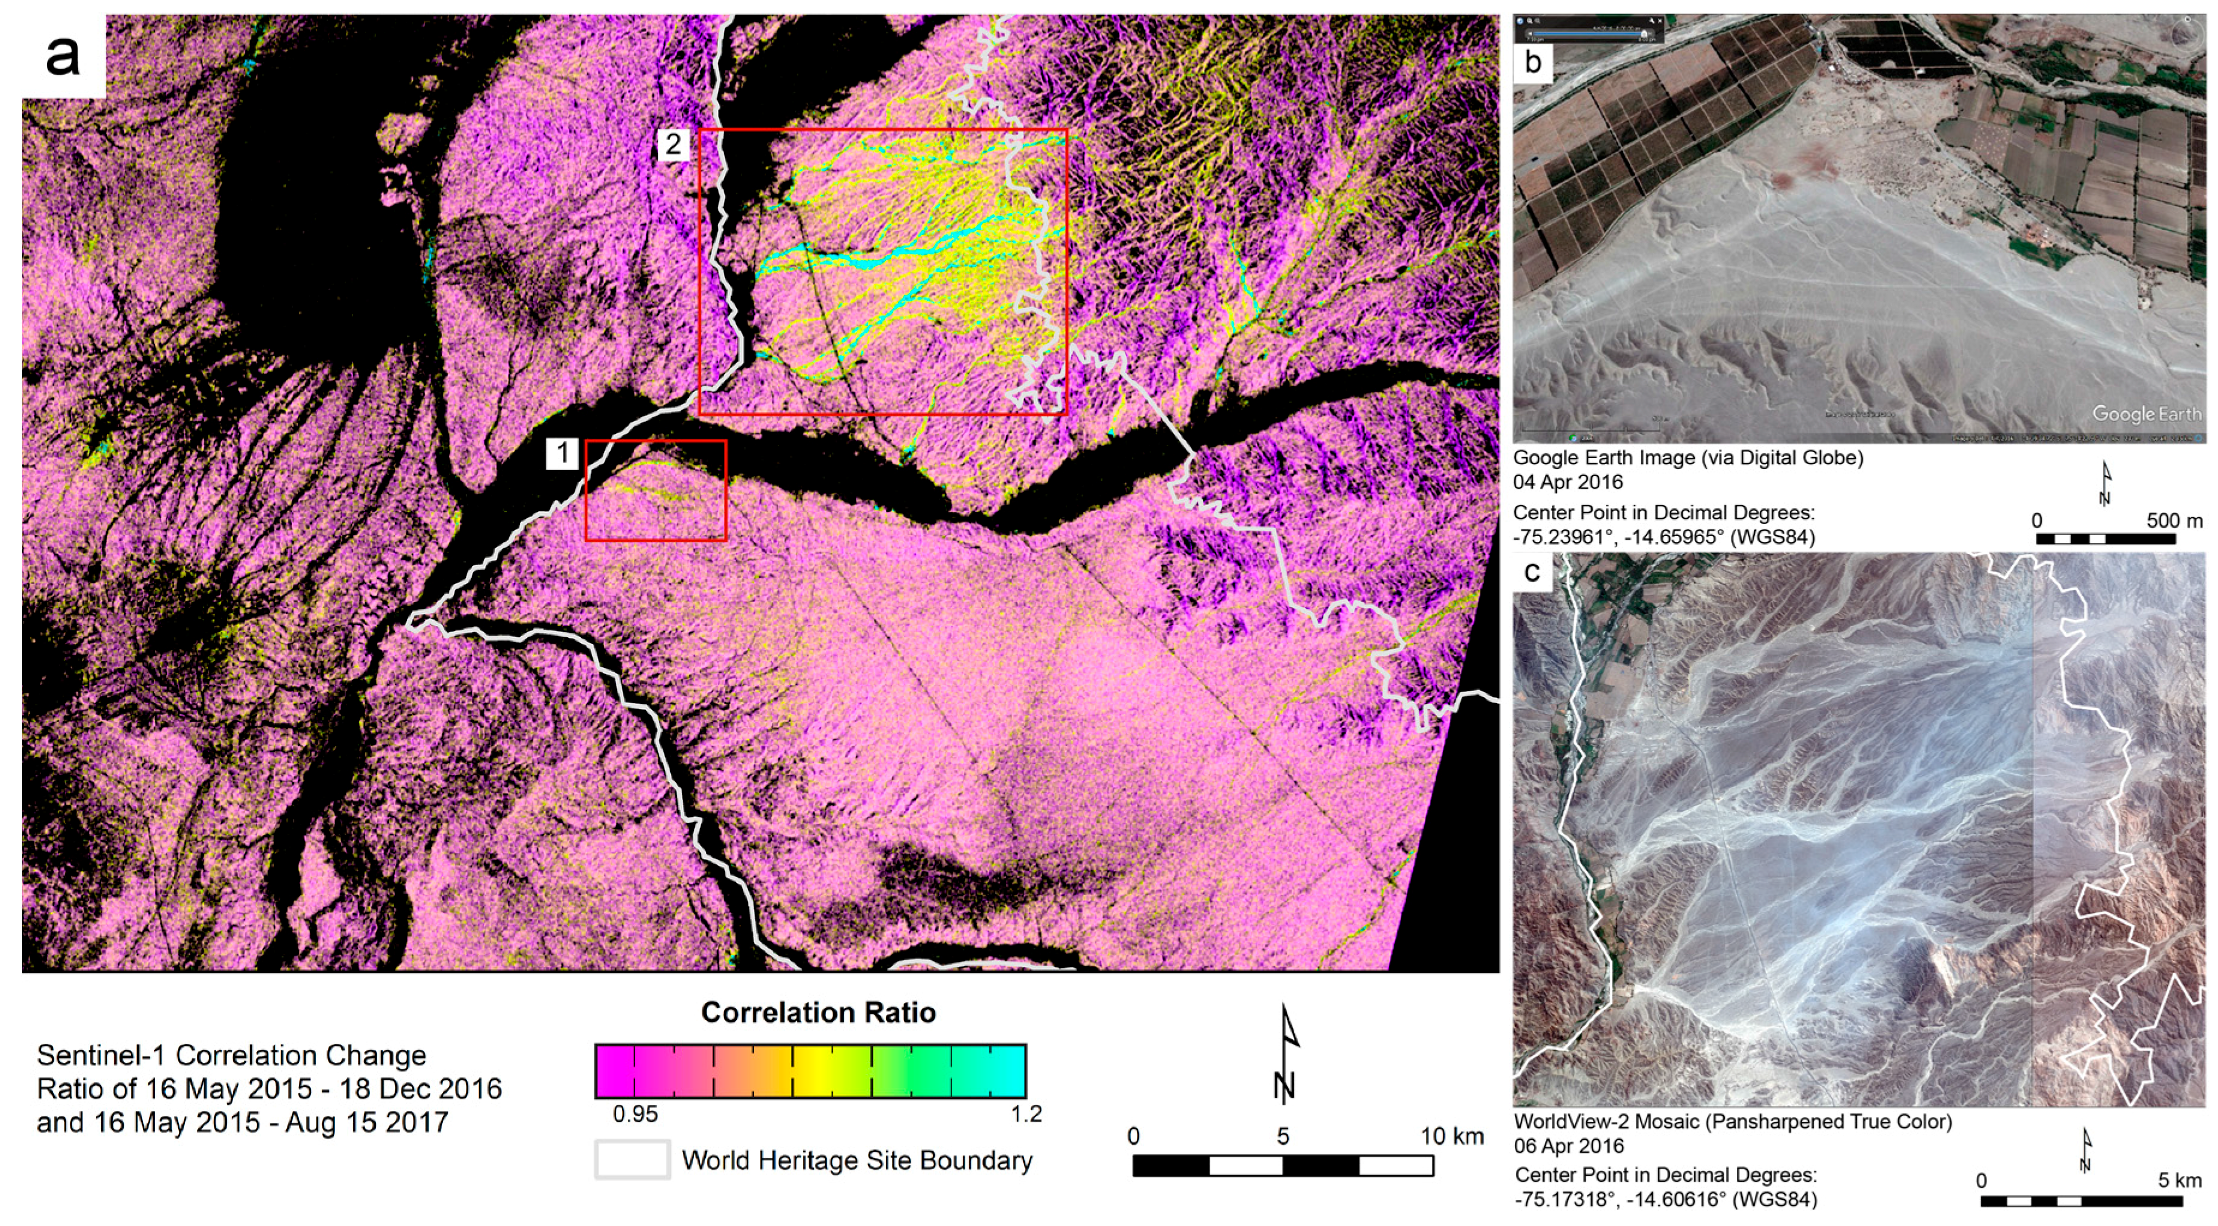
The correlation change image in Figure 8a was produced by computing pixel value ratios from two Sentinel-1 correlation images. Each of these two correlation images was derived from a pair of Sentinel-1 data takes: the first image was generated from collects on 16 May 2015 and 18 December 2016, and the second from collects on 16 May 2015 and 15 August 2017 (note that the first collect is the same for both images). Each pixel value in Figure 8a is the ratio of the value of the corresponding pixel in the 2015–2016 correlation image to that of the corresponding pixel in the 2015–2017 correlation image.
The correlation change image facilitates a visual identification of areas where the occurrence of decorrelation was uneven over the entire 27-month period between May 2015 and August 2017. In effect, it highlights atypical decorrelation: areas that were similarly disturbed over both the May 2015–December 2016 period and the May 2015–August 2017 period have values close to 1, but those areas that experienced disturbance during only the latter period are shown here in brighter colors. The black areas in Figure 8a correspond to those areas that exhibited high decorrelation in both correlation images. Most of these areas are dominated by vegetation, which (as already noted) appears as high decorrelation in correlation images but does not necessarily reveal true landscape disturbance.
In interpreting Figure 8, it is helpful to note that the ENSO cycle produced torrential rainfall in the Nasca region during the first three months of 2017 [36]. The area marked by box 2 in Figure 8a includes substantial terrain, with many ridges and valleys. We suggest that the correlation change in this area (indicated by green and yellow) is the result of flooding, because the areas showing change correspond with what appear to be watercourses. Here, as in other parts of the Nasca Lines World Heritage Site, there are lines and geoglyphs that could be damaged or threatened. Correlation change images like the one in Figure 8a can be useful in assessing weather-related and other disturbances within World Heritage Sites, particularly in regions that are difficult to access.
The pink to purple areas in Figure 8a fall largely within the pampas, which is level and dry but crossed by several dry or intermittent streams. The apparent correlation change in the pampas that shows as faint, yellow smears may be due to recent alterations of the landscape, such as the construction of the Pan-American Highway, electrical lines, and roads that provide access to the electrical lines. These changes might exacerbate the damage done by heavy seasonal rainfalls, which can cause water to run through or flood the dry or intermittent streams just mentioned. This would be a cause for concern for the geoglyphs on the pampas.
3.2. Statistical Testing and Assessment of Disturbance
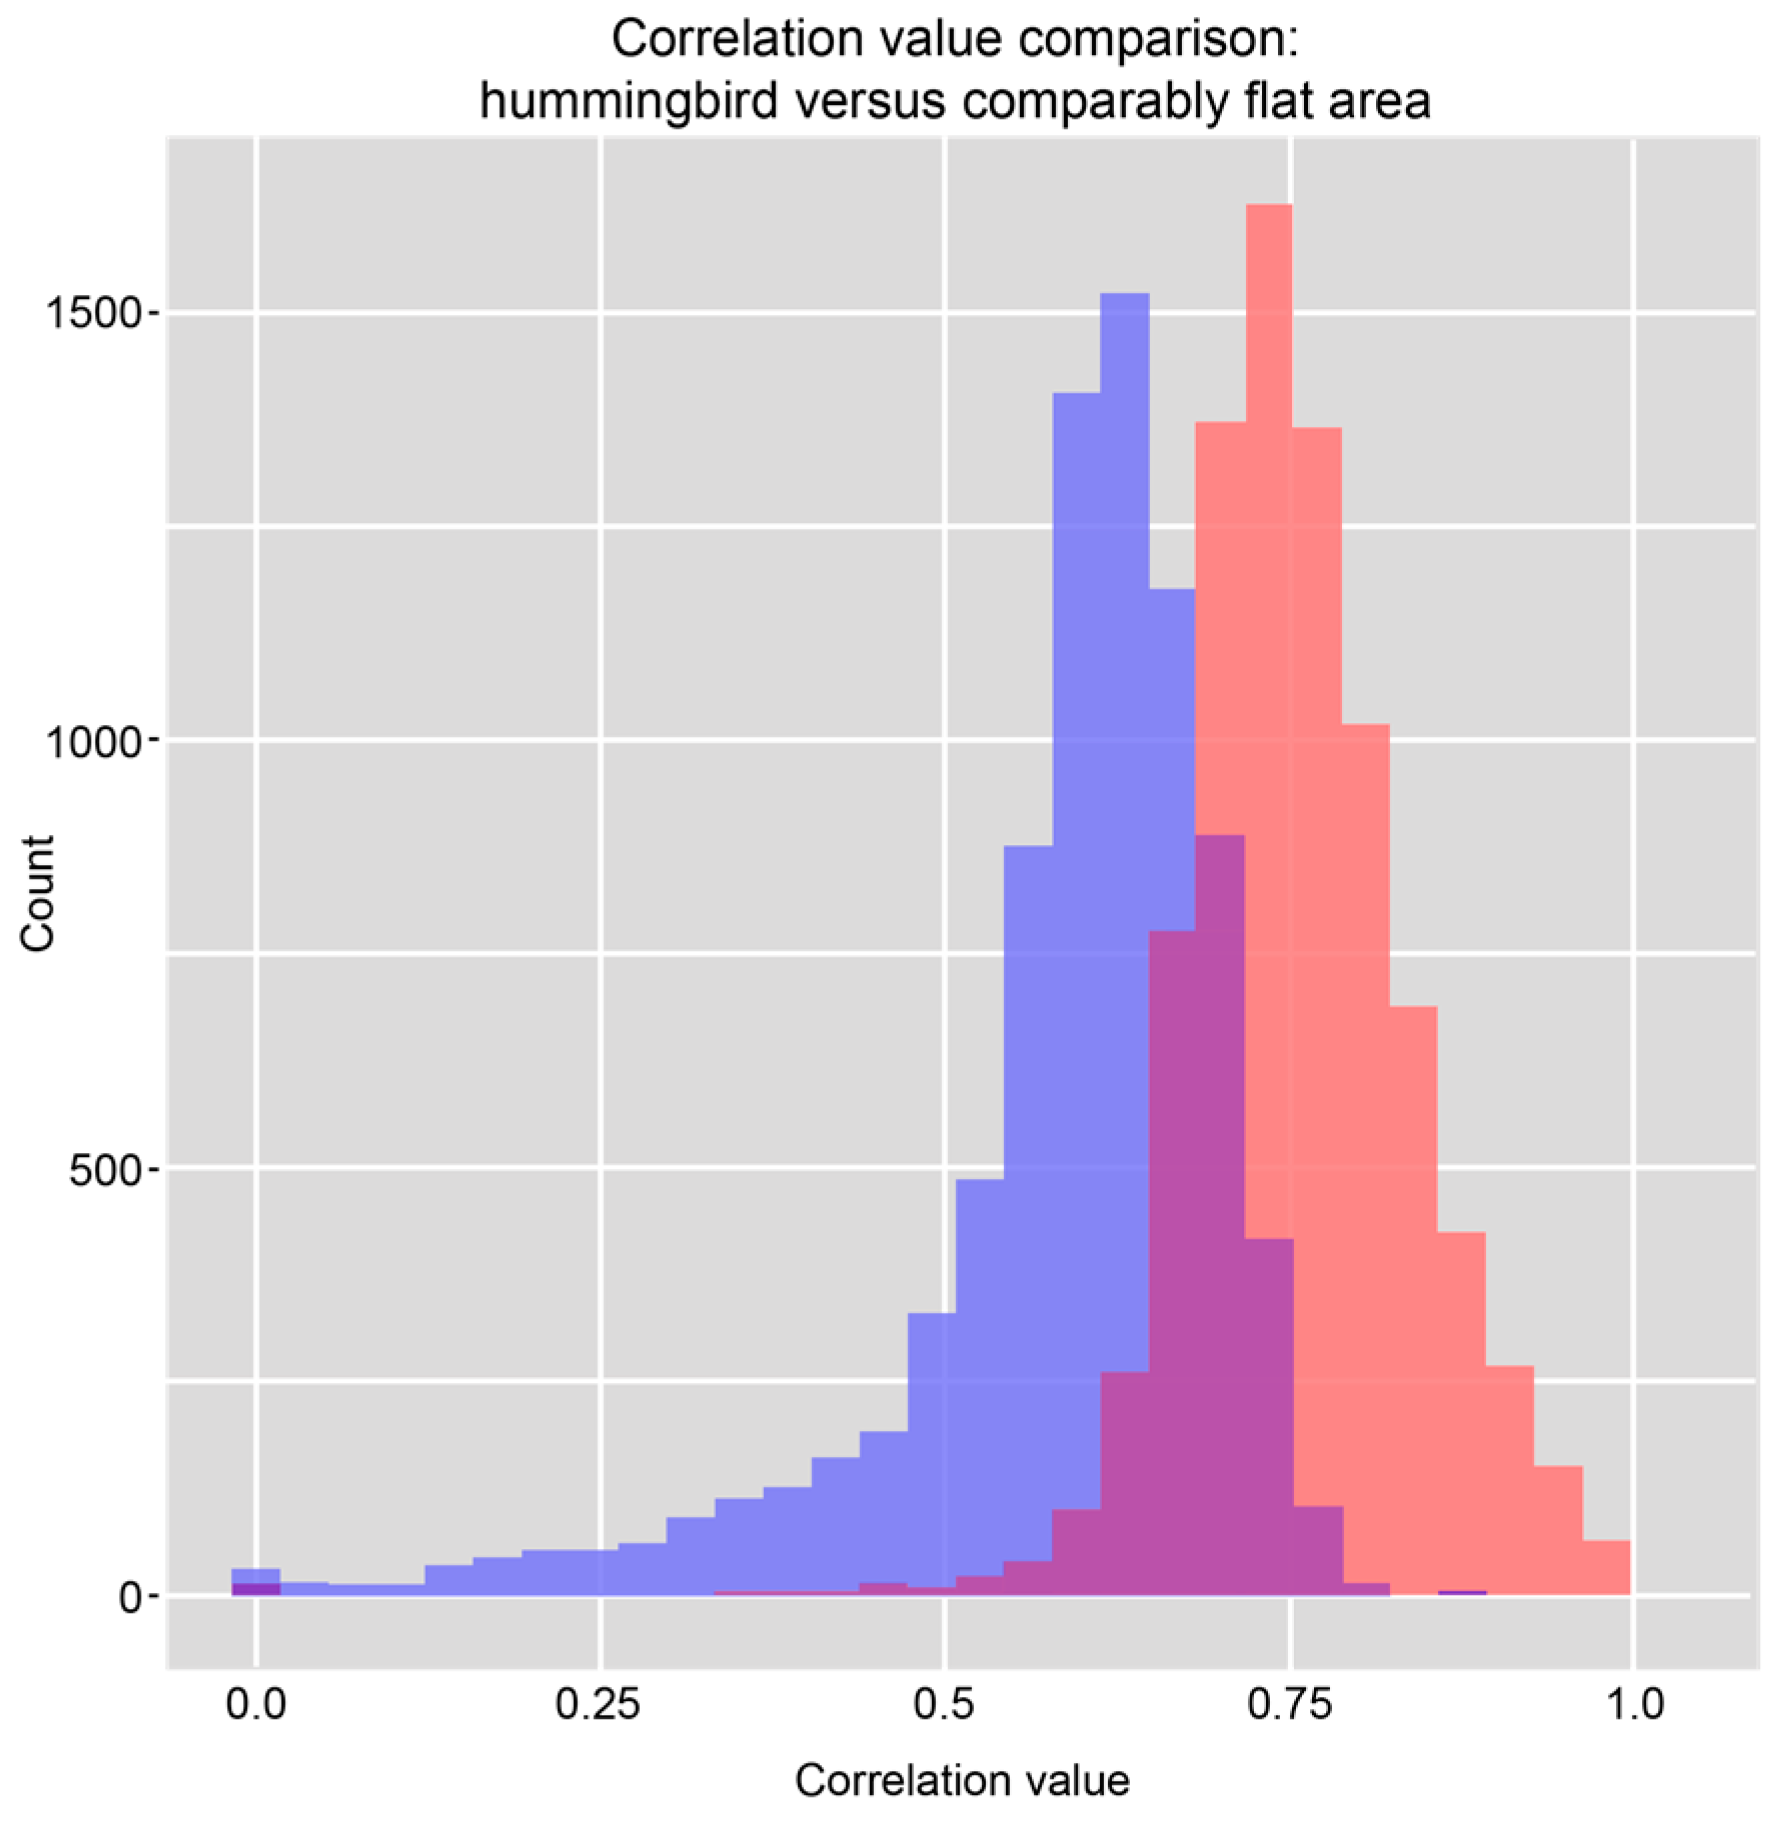
Statistical analysis of the UAVSAR decorrelation values provided further evidence of substantial disturbance to the Hummingbird geoglyph and illustrated the kind of quantitative assessment that SAR correlation images allow. The Hummingbird lies on a flat area at the northern edge of the pampas; a Wilcoxon rank-sum test compared the values of the correlation image pixels in the Hummingbird’s immediate area (n = 8240) with a random sample of correlation pixel values (also n) in the wider surrounding area. The test’s purpose was to assess whether the correlation values in and around the Hummingbird tended to be lower than those of the random sample. Figure 9 shows histograms of these two samples, and Figure 10 shows the locations of the pixels belonging to the random sample.
We chose a Wilcoxon rank-sum test for its general applicability to the ordinal comparison of two groups of observations, but also because it is nonparametric and therefore not reliant on any assumptions about the probability distributions of the groups being compared [37,38,39]. Preliminary analysis of the correlation values belonging to the pixels within and around the Hummingbird glyph and the pixels randomly chosen from areas of comparable topography did not indicate that the distributions of these groups were well characterized by parameterized families of probability distributions, which recommended a robust statistical approach.
Because decorrelation is generally higher on slopes, the random sample of correlation pixels was drawn only from nearby areas that are, like the Hummingbird area, flat. We used a digital elevation model (DEM) with a 30 m resolution derived from Shuttle Radar Topography Mission (SRTM) data to identify areas of the pampas that have a lower slope than the mean slope within the Hummingbird area, and drew pixels randomly from only these flat areas. We also identified and avoided areas where accurate SAR returns were obscured by radar shadow. Our random sample, therefore, came only from flat areas with no radar shadow. This limited the potential for bias in the test statistic that could arise from the association of slope with decorrelation, and it avoided measurement error from radar shadow.
The test suggests, at a confidence level greater than 0.999, that the correlation values within and around the Hummingbird indeed tend to be lower than those of the general area. These results indicate that, between the two UAVSAR flights, the Hummingbird and its immediate area experienced a significantly higher level of disturbance than the rest of the landscape. By statistically corroborating the clear evidence of disturbance to the Hummingbird, most notably the video taken by Greenpeace itself, these results also demonstrate the use of SAR for quantitatively identifying and testing landscape disturbance.
4. Discussion
This successful application of Sentinel-1 data presents unprecedented opportunities for continually monitoring landscape disturbance with a high temporal resolution. Together, the two Sentinel-1 satellites can acquire data over a given part of the Earth every six (not typical) to twenty-four (currently typical) days. In landscapes favorable to analysis with InSAR, such as the Nasca region, it is possible to identify areas of terrain disturbance and ascertain the disturbance intensity every time one of the satellites collects data over the area.
Though the spatial resolution of the Sentinel-1 data is not as high as that of the UAVSAR data, we found that Sentinel-1 data can be used to monitor landscape disturbance and gather information on the reason and degree of disturbance in a manner similar to that which we applied to the UAVSAR data. Because Sentinel-1 data can cover a much greater area with a far higher temporal resolution than UAVSAR or other SAR satellites that offer readily accessible data, it is of particular use in identifying and preventing damage to the cultural and natural resources of the Nasca Lines World Heritage Site.
These resources and the area’s ecosystem services support sustainable tourism, agriculture, mining, and fishing industries. Without these continuing and dependable sources of income for the people living in and near the World Heritage Site, many of whom have fled the poverty of villages in the Andes, there will be a relatively high incentive for individuals to engage in commonly detrimental activities such as looting, and little incentive for the community in general to discourage such activities.
Broader Environmental Implications of This Research
The streams and rivers that flow through the pampas connect watersheds in the high Andes with the coastal waters of the Pacific. This coastal ecosystem is enormously productive. The river and stream networks that cross the pampas not only contain fertile soils, but also form habitat corridors that nurture a variety of plant and animal species that were exploited by sophisticated ancient societies, such as the Paracas and Nasca civilizations, for thousands of years. These systems rose and fell in concert with the ENSO cycle. Periods of drought or of torrential rains were catalysts for collapse, but the essentially robust environments of the stream and river courses provided the basis for renewal [27,40,41,42,43,44].
In many years, this region receives no measurable precipitation [45], and many of the streams and rivers flow only seasonally [44]. Flows can vary greatly from year to year, and especially from decade to decade, due to ENSO. With the loss of vegetation in the stream and river valleys, particularly of keystone species such as the huarango (P. limensis), the deluges that occur about once every 15 years are scouring the waterways that lead to the Rio Grande de Nasca and on to the Pacific Ocean, with effects that may be irreversible. However, as noted previously, the Rio Grande and its tributaries lie largely within the Nasca Lines World Heritage Site and thus can be considered assets to the conservation of the regional environment and its cultural and natural resources. Efforts to preserve the environment as well as the ancient glyphs, which help make the Nasca Lines World Heritage Site the second-most popular tourism destination in Peru, are likely to receive worldwide attention and generate popular understanding and support.
Disturbance of the landscape and activities that intrude on the site’s ambiance (such as mining and large-scale agriculture) are incompatible with the values that render a site eligible for inscription on the World Heritage List. The Nasca Lines World Heritage Site itself provides ecosystem services in the forms of recreation and education. Further, maintaining ecosystem health in the area provides income and entrepreneurial opportunities to the local population. Environmental health here could be the basis for a strengthened eco-tourism industry that would draw from the same demographics that typically visit archaeological and historic sites. This would be a source of economic development other than mining and agriculture, which can harm the environment.
5. Conclusions
We initially used high-resolution SAR data from NASA/JPL’s UAVSAR to demonstrate that InSAR can be used, in certain environments, to detect and test for subtle disturbances to a landscape that occur between SAR data takes. The disturbance to the Hummingbird geoglyph provided us with an opportunity to develop and test a means by which this can be done. Our results suggested that SAR data collected from satellite platforms could be used similarly, allowing for larger areas to be searched for landscape disturbances occurring within shorter timeframes. Our development and ground verification of correlation images from Sentinel-1 SAR data has established that this is possible.
The successful use of SAR data to monitor landscape disturbance carries with it enormous implications for the preservation of archaeological sites and the detection of human activities and natural processes that threaten cultural and natural resources. High-spatial-resolution imagery that can discern features such as the lines and glyphs of Nasca and Palpa, some of which are less than a meter or two in width, is commonly available. Before 2000, aerial photographs were the most effective tools for such tasks. Now there is Google Earth, which is free and in which many of the Nasca features are easily visible. There are also several commercial optical sensors that generate images with even higher spatial resolutions (pixels smaller than one meter), such as Quickbird, Pleiades, and WorldView-2, -3, and -4.
Yet this high-spatial-resolution spectral imagery provides what is essentially a one-off look at the landscape, the conditions frozen at the moment the imagery was obtained; the spatial resolutions of these instruments are high, but their temporal resolutions are not. Usually, these high-resolution data takes are sporadically acquired, driven by orders from customers who want to examine images acquired recently, and they can be expensive. In contrast, SAR satellites such as Sentinel-1 have short revisit cycles: Sentinel-1, as we have mentioned, acquires data at intervals of six to twenty-four days. Correlation images generated from Sentinel-1 data allow us to quantify the degree to which SAR backscatter changes between data takes, which can indicate where and how intensely the landscape has been disturbed within that time window. While the pixel sizes of the correlation images may be larger than those of commercial high-spatial-resolution images, SAR’s sensitivity to structure nonetheless allows it to detect disturbance in the order of only a few meters. This provides a tool that, as this paper demonstrates, can be more useful than higher-resolution imagery. The use of free satellite SAR data, collected about every one to three weeks and indifferent to clouds or fog, provides a superior solution to many of the challenges of monitoring wide-area landscape disturbance on a continual basis.
Even within the Nasca Lines World Heritage Site, the relevance and utility of Sentinel-1 data goes far beyond the protection of the area’s cultural resources. It can also be applied, using the methods described here, to monitor landscape disturbance that threatens ecosystems and crucial habitats, habitat corridors, aquifers, native vegetation, and other resources, as well as ecosystem services such as water filtration, opportunities for recreation, and biodiversity [27,28,40,41,42,43,44].
Acknowledgments
We would like to acknowledge the generous support of the Ministerio de Cultura del Perú and, in particular, Minister of Culture Jorge Nieto Montesinos, Minister of Culture Diana Álvarez-Calderón Gallo, Deputy Minister of Culture Luis Jaime Castillo Butters, Deputy Minister of Culture Juan Pablo de la Puente Brunke, Secretary General Mario Christofer Huapaya Nava, and Johny Isla, who is the Ministry of Culture Director of Management for the Territory of Nasca and Palpa. We also thank Pedro Gamboa Moquillaza, chief of the Servicio Nacional de Áreas Naturales Protegidas (SERNANP) del Perú; David Beresford-Jones, of the McDonald Institute of Archaeological Research, Cambridge University; Justin Moat, Research Leader of Spatial Analysis at the Royal Botanic Gardens, Kew; O.Q. Whaley, Latin America Projects Officer at the Royal Botanic Gardens, Kew; Stive Marthans, Gerente Regional de Recursos Naturales y Gestión del Medio Ambiente en Gobierno Regional de Ica; José Angel Valdivia Morón, Secretario General del Servicio Nacional Forestal y de Fauna Silvestre del Perú; and Ana María Ortiz de Zevallos Madueño, Director of the Dirección Desconcentrada de Cultura de Ica. We thank the NASA/JPL UAVSAR program and NASA’s Craig Dobson for providing the data, and the NASA Space Archaeology program for its support. We thank ESA for providing Sentinel-1 data and the SNAP software. We thank Joe Mazzariello of CSRM Foundation for designing the figures and proofreading.
Author Contributions
The interpretation of the imagery was led by Douglas C. Comer. The SAR processing was led by Bruce D. Chapman. The field verification was led by Douglas C. Comer, Bruce D. Chapman, and Jacob A. Comer. The statistical analysis was led by Jacob A. Comer.
Conflicts of Interest
The authors declare no conflict of interest.
References
- McCauley, J.F.; Schaber, G.G.; Breed, C.S.; Grolier, M.J.; Haynes, C.V.; Issawi, B.; Elachi, C.; Blom, R. Subsurface valleys and geoarchaeology of the eastern Sahara revealed by shuttle radar. Science 1982, 218, 1004–1020. [Google Scholar] [CrossRef] [PubMed]
- Elachi, C.; Roth, L.; Schaber, G. Spaceborne Radar Subsurface Imaging in Hyperarid Regions. IEEE Trans. Geosci. Remote Sens. 1984, GE-22, 383–388. [Google Scholar] [CrossRef]
- Blom, R.G.; Crippen, C.; Elachi, C.; Clapp, N.; Hedges, G.R.; Zarins, J. Southern Arabian Desert Trade Routes, Frankincense, Myrrh, and the Ubar Legend. In Remote Sensing in Archaeology; Wiseman, J.R., El-Baz, F., Eds.; Springer: New York, NY, USA, 2007; pp. 71–87. [Google Scholar]
- Comer, D.C.; Blom, R.G. Detection and Identification of Archaeological Sites and Features Using Synthetic Aperture Radar (SAR) Data Collected from Airborne Platforms. In Remote Sensing in Archaeology; Wiseman, J.R., El-Baz, F., Eds.; Springer: New York, NY, USA, 2007; pp. 71–87. [Google Scholar]
- Comer, D.C. Merging Aerial Synthetic Aperture Radar (SAR) and Satellite Multispectral Data to Inventory Archaeological Sites; NCPTT: Washington, DC, USA, 2007. Available online: https://www.ncptt.nps.gov/blog/merging-aerial-synthetic-aperture-radar-sar-and-satellite-multispectral-data-to-inventory-archaeological-sites-2007-11/ (accessed on 21 September 2017).
- Comer, D.C. Wide-area, planning level archaeological surveys using SAR and multispectral images. In Proceedings of the Geoscience and Remote Sensing Symposium, Boston, MA, USA, 7–11 July 2008; pp. 45–47. [Google Scholar]
- Tilton, J.C.; Comer, D.C. Identifying Probable Archaeological Sites on Santa Catalina Island, California Using SAR and Ikonos Data. In Mapping Archaeological Landscapes from Space; Comer, D.C., Harrower, M., Eds.; Springer: New York, NY, USA, 2013; pp. 241–249. [Google Scholar]
- Mittermayer, J.; Wollstadt, S.; Prats-Iraola, P.; Scheiber, R. The TerraSAR-X Staring Spotlight Mode Concept. IEEE Trans. Geosci. Remote Sens. 2014, 52, 3695–3706. [Google Scholar] [CrossRef]
- Tapete, D.; Cigna, F. SAR for Landscape Archaeology. In Sensing the Past; Masini, N., Soldoveri, F., Eds.; Springer: New York, NY, USA, 2017; pp. 101–116. [Google Scholar]
- Patruno, J.; Dore, N.; Crespi, M.; Potteir, E. Polarimetric Multifrequency and Multi-incidence SAR Sensors Analysis for Archaeological Purposes. Archaeol. Prospect. 2013, 20, 89–96. [Google Scholar] [CrossRef]
- Lasaponara, R.; Masini, N.; Pecci, A.; Perciante, F.; Escot, P.E.; Rizzo, E.; Scavone, M.; Sileo, M. Qualitative evaluation of COSMO SkyMed in the detection of earthen archaeological remains: The case of Pachamacac (Peru). J. Cult. Herit. 2017, 23, 55–62. [Google Scholar] [CrossRef]
- Amelung, F.; Galloway, D.L.; Bell, J.W.; Zebker, H.A.; Laczniak, R.J. Sensing the ups and downs of Las Vegas: InSAR reveals structural control of land subsidence and aquifer-system deformation. Geology 1999, 27, 483–486. [Google Scholar] [CrossRef]
- Foumelis, M.; Pavlopoulos, K.; Kourkouli, P. Ground deformation monitoring in cultural heritage areas by time series SAR interferometry: The case of ancient Olympia site (Western Greece). In Proceedings of the ESA FRINGE Workshop, Frascati, Italy, 30 November–4 December 2009. [Google Scholar]
- Marotti, L.; Prats, P.; Scheiber, R.; Wollstadt, S.; Reigber, A. Differential SAR interferometry with TerraSAR-X TOPS data: Mexico city subsidence results. In Proceedings of the EUSAR 9th European Conference on Synthetic Aperture Radar, Nuremberg, Germany, 24 April 2012; pp. 677–680. [Google Scholar]
- Chen, F.; Guo, H.; Ma, P.; Lin, H.; Wang, C.; Ishwaran, N.; Hand, P. Radar interferometry offers new insights into threats to the Angkor site. Sci. Adv. 2017, 3. [Google Scholar] [CrossRef] [PubMed]
- Chapman, B.D.; Blom, R.G. Synthetic Aperture Radar, Technology, Past and Future Applications to Archaeology. In Mapping Archaeological Landscapes from Space; Comer, D.C., Harrower, M., Eds.; Springer: New York, NY, USA, 2013; pp. 113–132. [Google Scholar]
- Chen, F.; Lasaponara, R.; Masini, N. An overview of satellite synthetic aperture radar remote sensing in archaeology: From site detection to monitoring. J. Cult. Herit. 2017, 23, 5–11. [Google Scholar] [CrossRef]
- Cigna, F.; Tapete, D.; Lasaponara, R.; Masini, N. Amplitude Change Detection with ENVISAT ASAR to Image the Cultural Landscape of the Nasca Region, Peru. Archaeol. Prospect. 2013, 20, 117–131. [Google Scholar] [CrossRef]
- Tapete, D.; Cigna, F.; Masini, N.; Lasaponara, R. Prospection and Monitoring of the Archaeological Heritage of Nasca, Peru, with ENVISAT SAR. Archaeol. Prospect. 2013, 20, 133–147. [Google Scholar] [CrossRef]
- Cigna, F.; Tapete, D. Satellite SAR Remote Sensing in Nasca. In The Ancient Nasca World; Lasaponara, R., Masini, N., Orefici, G., Eds.; Springer: Cham, Switzerland, 2016; pp. 529–542. [Google Scholar]
- Lasaponara, R.; Masini, N. Following the Ancient Nasca Puquios from Space. In Satellite Remote Sensing: A New Tool for Archaeology; Lasaponara, R., Masini, N., Eds.; Springer: Berlin, Germany, 2012; pp. 269–290. [Google Scholar]
- Hesse, R. Combining Structure-from-Motion with high and intermediate resolution satellite images to document threats to archaeological heritage in arid environments. J. Cult. Herit. 2015, 16, 192–201. [Google Scholar] [CrossRef]
- Lefort, A.; Grippa, M.; Walker, N.; Stewart, L.J.; Woodhouse, I.H. Change detection across the Nasca pampa using spaceborne SAR interferometry. Int. J. Remote Sens. 2004, 25, 1799–1803. [Google Scholar] [CrossRef]
- Ruescas, A.; Delgado, J.; Costantini, F.; Sarti, F. Change Detection by Interferometric Coherence in Nasca Lines, Peru (1997–2004). In Proceedings of the Fringe 2009 Workshop, Frascati, Italy, 30 November 2009–4 December 2009. [Google Scholar]
- Baade, J.; Schmullius, C. High-resolution mapping of fluvial landform change in arid environments using TerraSAR-X Images. In Proceedings of the 2010 IEEE International Geoscience and Remote Sensing Symposium (IGARSS), Honolulu, HI, USA, 25–30 July 2010. [Google Scholar]
- Chapman, B.; Comer, D.; Isla, J.A.; Silverman, H. The Measurement by Airborne Synthetic Aperture Radar (SAR) of Disturbance within the Nasca World Heritage Site. Conserv. Manag. Archaeol. Sit. 2015, 17, 270–286. [Google Scholar] [CrossRef]
- Silverman, H. Paracas in Nazca: New Data on the Early Horizon Occupation of the Rio Grande de Nazca Drainage, Peru. Lat. Am. Antiqu. 2017, 5, 359–382. [Google Scholar] [CrossRef]
- Orefici, G. The Paracas-Nasca Cultural Sequence. In The Ancient Nasca World; Lasaponara, R., Masini, N., Orefici, G., Eds.; Springer: New York, NY, USA, 2016; pp. 121–161. [Google Scholar]
- Adelsberger, K.A.; Smith, J.R. Desert pavement development and landscape stability on the Eastern Libyan Plateau, Egypt. Geomorphology 2009, 107, 178–194. [Google Scholar] [CrossRef]
- Bowker, M.A. Biological Soil Crust Rehabilitation in Theory and Practice: An Underexploited Opportunity. Restor. Ecol. 2007, 15, 13–23. [Google Scholar] [CrossRef]
- Streep, A. This Man Is Greenpeace’s Best Hope Outside, 13 March 2015. Available online: http://www.outsideonline.com/1959936/man-greenpeaces-best-hope (accessed on 29 September 2015).
- Zebker, H.A.; Villasenor, J. Decorrelation in Interferometric Radar Echoes. IEEE Trans. Geosci. Remote Sens. 1992, 30, 950–959. [Google Scholar] [CrossRef]
- ESA, Sentinel-1 Mission Objectives. Available online: https://sentinel.esa.int/web/sentinel/missions/sentinel-1/mission-objectives (accessed on 31 July 2017).
- Strozzi, T.; Farina, P.; Corsini, A.; Ambrosi, C.; Thüring, M.; Zilger, J.; Wiesmann, A.; Wegmüller, U.; Werner, C. Survey and monitoring of landslide displacements by means of L-band satellite SAR interferometry. Landslides 2005, 2, 193–201. [Google Scholar] [CrossRef]
- Angster, S.; Fielding, E.J.; Wesnousky, S.; Pierce, I.; Chamlagain, D.; Gautam, D.; Upreti, B.N.; Kumahara, Y.; Nakata, T. Field Reconnaissance after the 25 April 2015 M 7.8 Gorkha Earthquake. Seismol. Res. Lett. 2015, 86, 1506–1513. [Google Scholar] [CrossRef]
- Di Liberto, T. Heavy Summer Rains Flood Peru. NOAA Climate.gov. Available online: https://www.climate.gov/news-features/event-tracker/heavy-summer-rains-flood-peru (accessed on 21 September 2017).
- Wilcoxon, F. Individual Comparisons by Ranking Methods. Biom. Bull. 1945, 1, 80–83. [Google Scholar] [CrossRef]
- Mann, H.B.; Whitney, D.R. On a Test of Whether One of Two Random Variables is Stochastically Larger Than the Other. Ann. Math. Stat. 1947, 18, 50–60. [Google Scholar] [CrossRef]
- Bauer, D.F. Constructing Confidence Sets Using Rank Statistics. J. Am. Stat. Assoc. 1972, 67, 687–690. [Google Scholar] [CrossRef]
- Beresford-Jones, D.G.; Whaley, O.Q.; Ledesma, C.; Cadwallader, L. Two millennia of changes in human ecology: Archaeobotanical and invertebrate records from the lower Ica valley, south coast Peru. Veg. Hist. Archaeobot. 2011, 20, 273. [Google Scholar] [CrossRef]
- Beresford-Jones, D.; Arce, T.S.; Whaley, O.Q.; Chepstow-Lusty, A.J. The Role of Prosopis in Ecological and Landscape Change in the Samaca Basin, Lower Ica Valley, South Coast Peru from the Early Horizon to the Late Intermediate Period. Lat. Am. Antiq. 2009, 20, 303–332. [Google Scholar] [CrossRef]
- Beresford-Jones, D.; Lewis, H.; Boreham, S. Linking cultural and environmental change in Peruvian prehistory: Geomorphological survey of the Samaca Basin, Lower Ica Valley, Peru. Catena 2009, 78, 234–249. [Google Scholar] [CrossRef]
- Andrus, C.F.T.; Sandweiss, D.H.; Reitz, E.J. Climate Change and Archaeology: The Holocene History of El Niño on the Coast of Peru. In Case Studies in Environmental Archaeology, 2nd ed.; Reitz, E., Scarry, C.M., Scudder, S., Eds.; Springer: New York, NY, USA, 2008; pp. 143–157. [Google Scholar]
- Whaley, O.Q.; Beresford-Jones, D.G.; Milliken, W.; Orellana, A.; Smyk, A.; Leguía, J. An ecosystem approach to restoration and sustainable management of dry forest in southern Peru. Kew Bull. 2010, 65, 613–641. [Google Scholar] [CrossRef]
- Harris, I.; Jones, P.D.; Osborn, T.J.; Lister, D.H. Updated high-resolution grids of monthly climatic observations–the CRU TS3.10 Dataset. Int. J. Climatol. 2013, 623–642. [Google Scholar] [CrossRef] [Green Version]
Figure 1.
A map showing the Nasca Lines World Heritage Site and the locations of subsequent figures.
Figure 1.
A map showing the Nasca Lines World Heritage Site and the locations of subsequent figures.
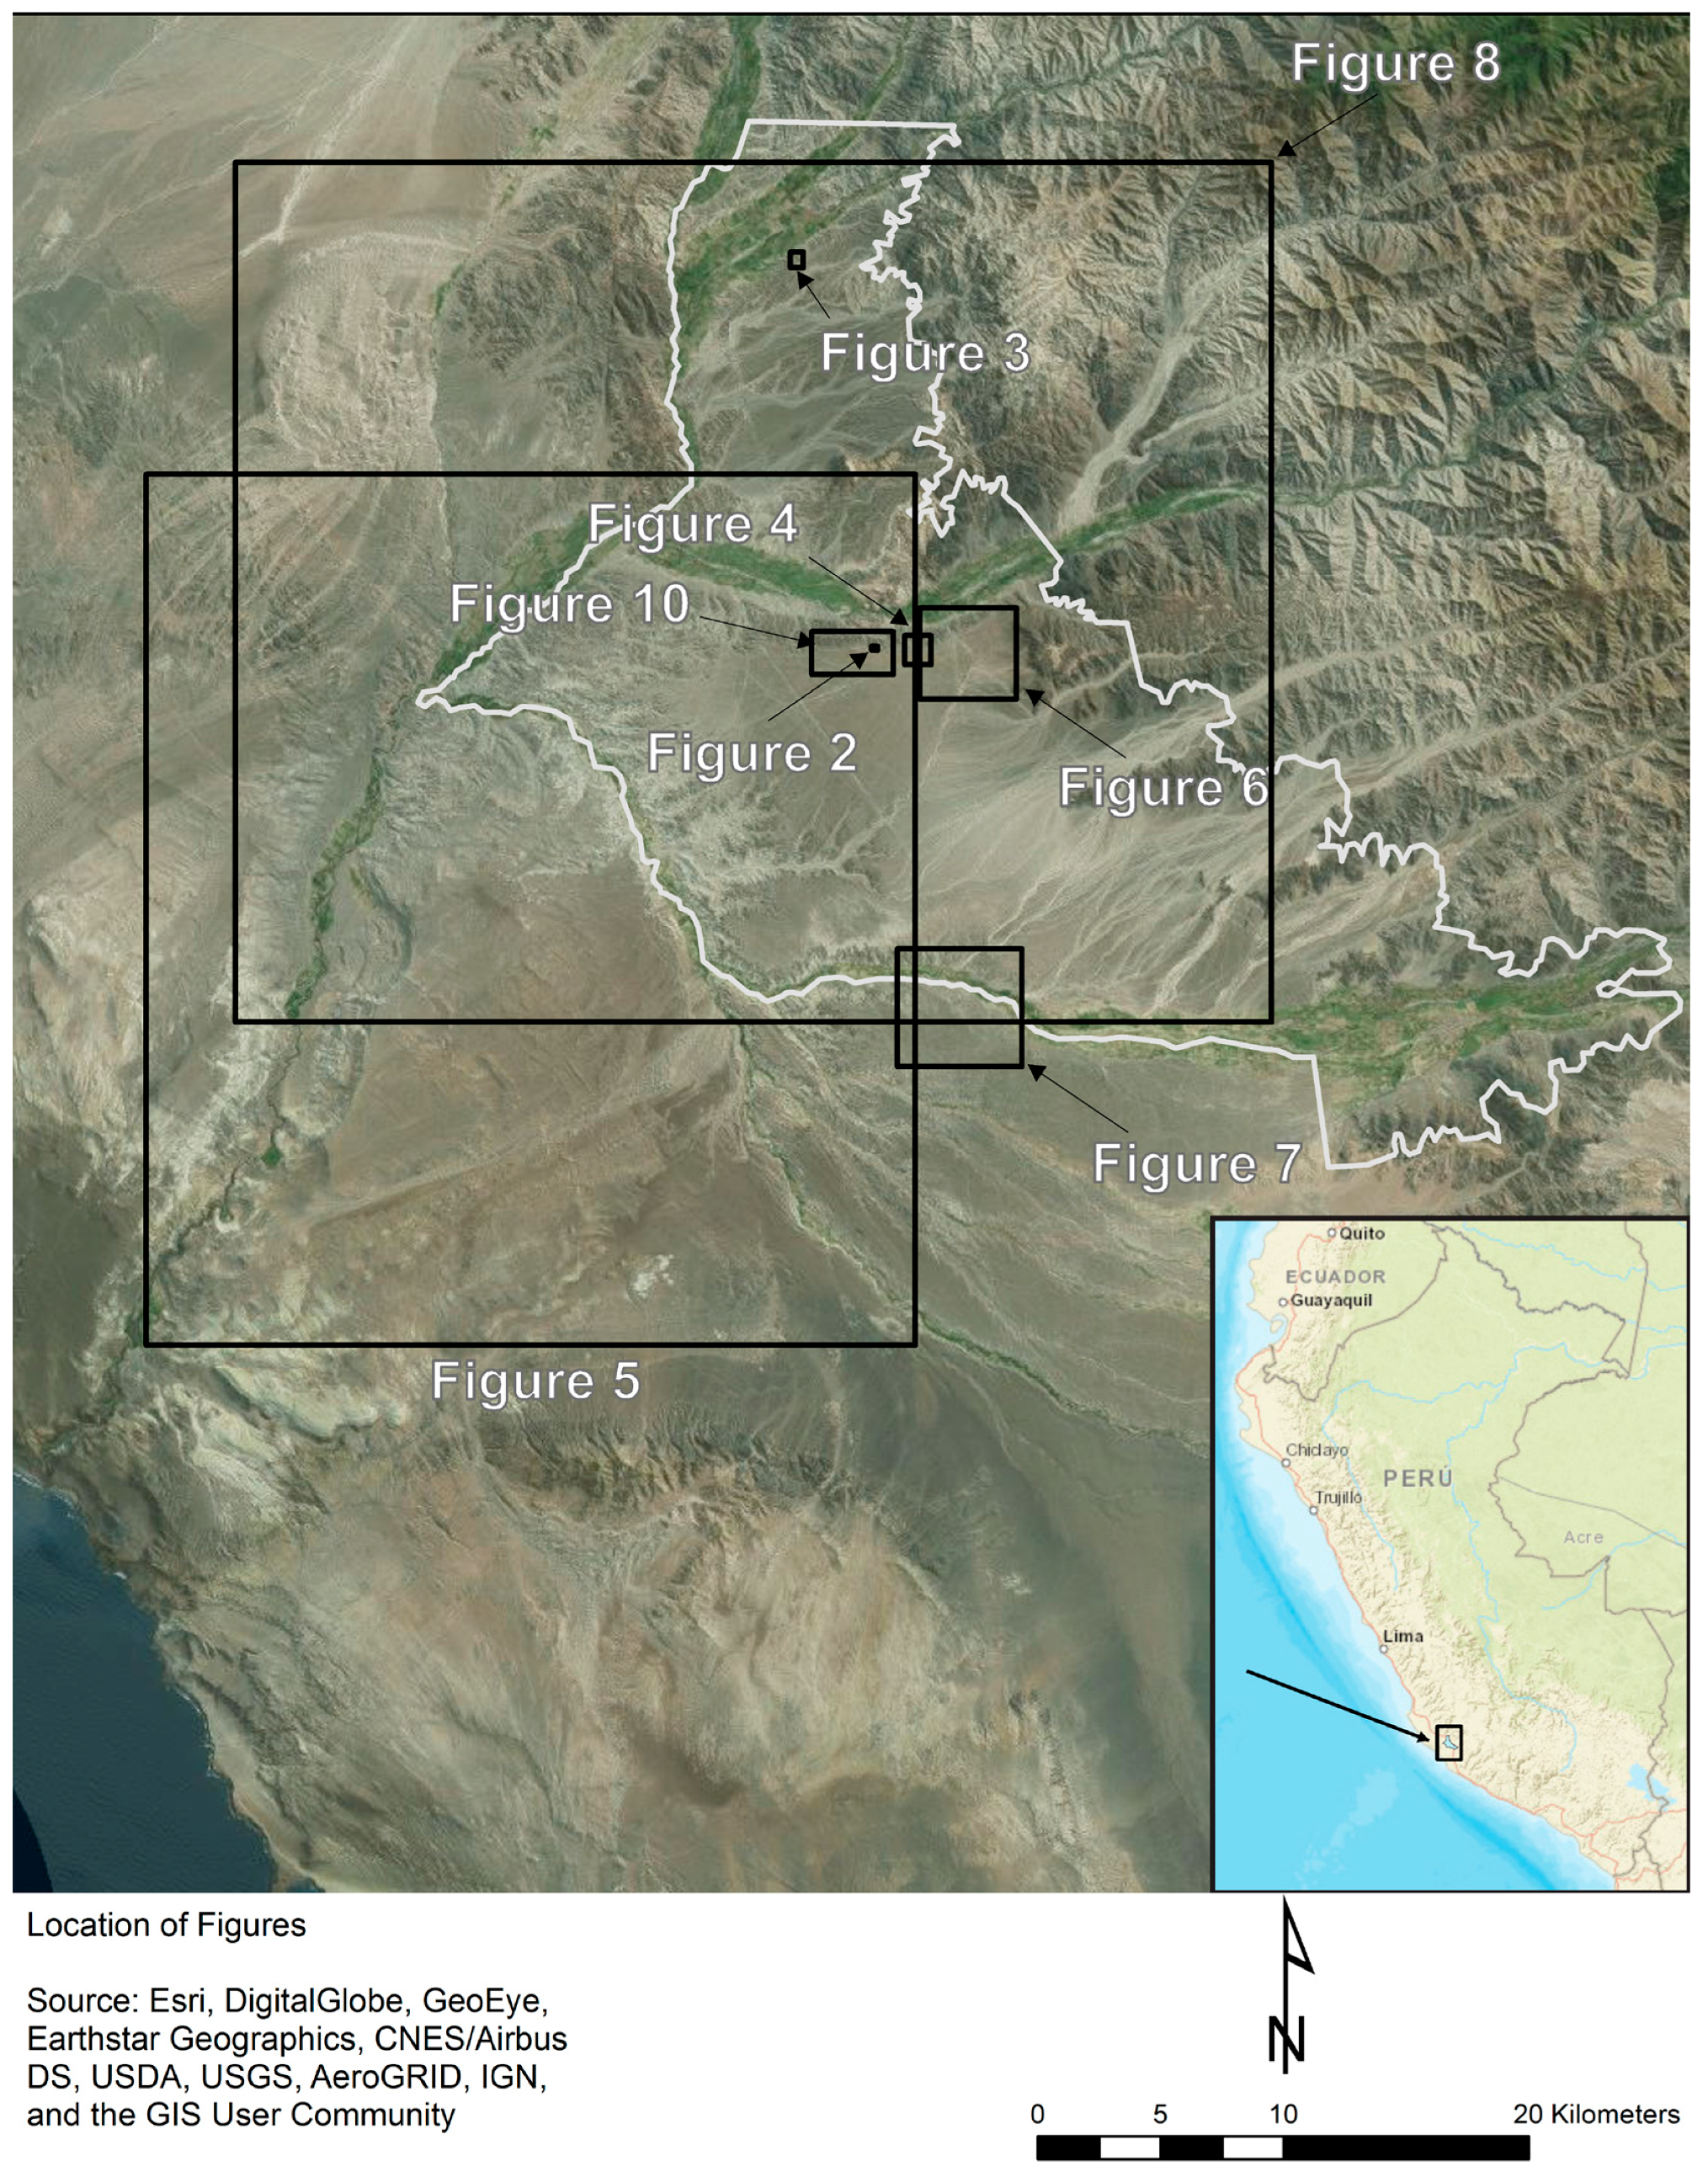
Figure 2.
A correlation image of the Hummingbird glyph (outlined) after applying the colorized stretch (the inset shows an optical satellite image of the same area). Highly decorrelated areas are in red. These areas include those at which Greenpeace activists placed their message and prepared their materials, as well as the trail they took to reach the Hummingbird (extending southward from the top of the image). The other decorrelated areas correspond to steep slopes (visible in the inset) leading down from the pampas; we found decorrelation in such areas to be common, because of gravity pulling sediment downslope.
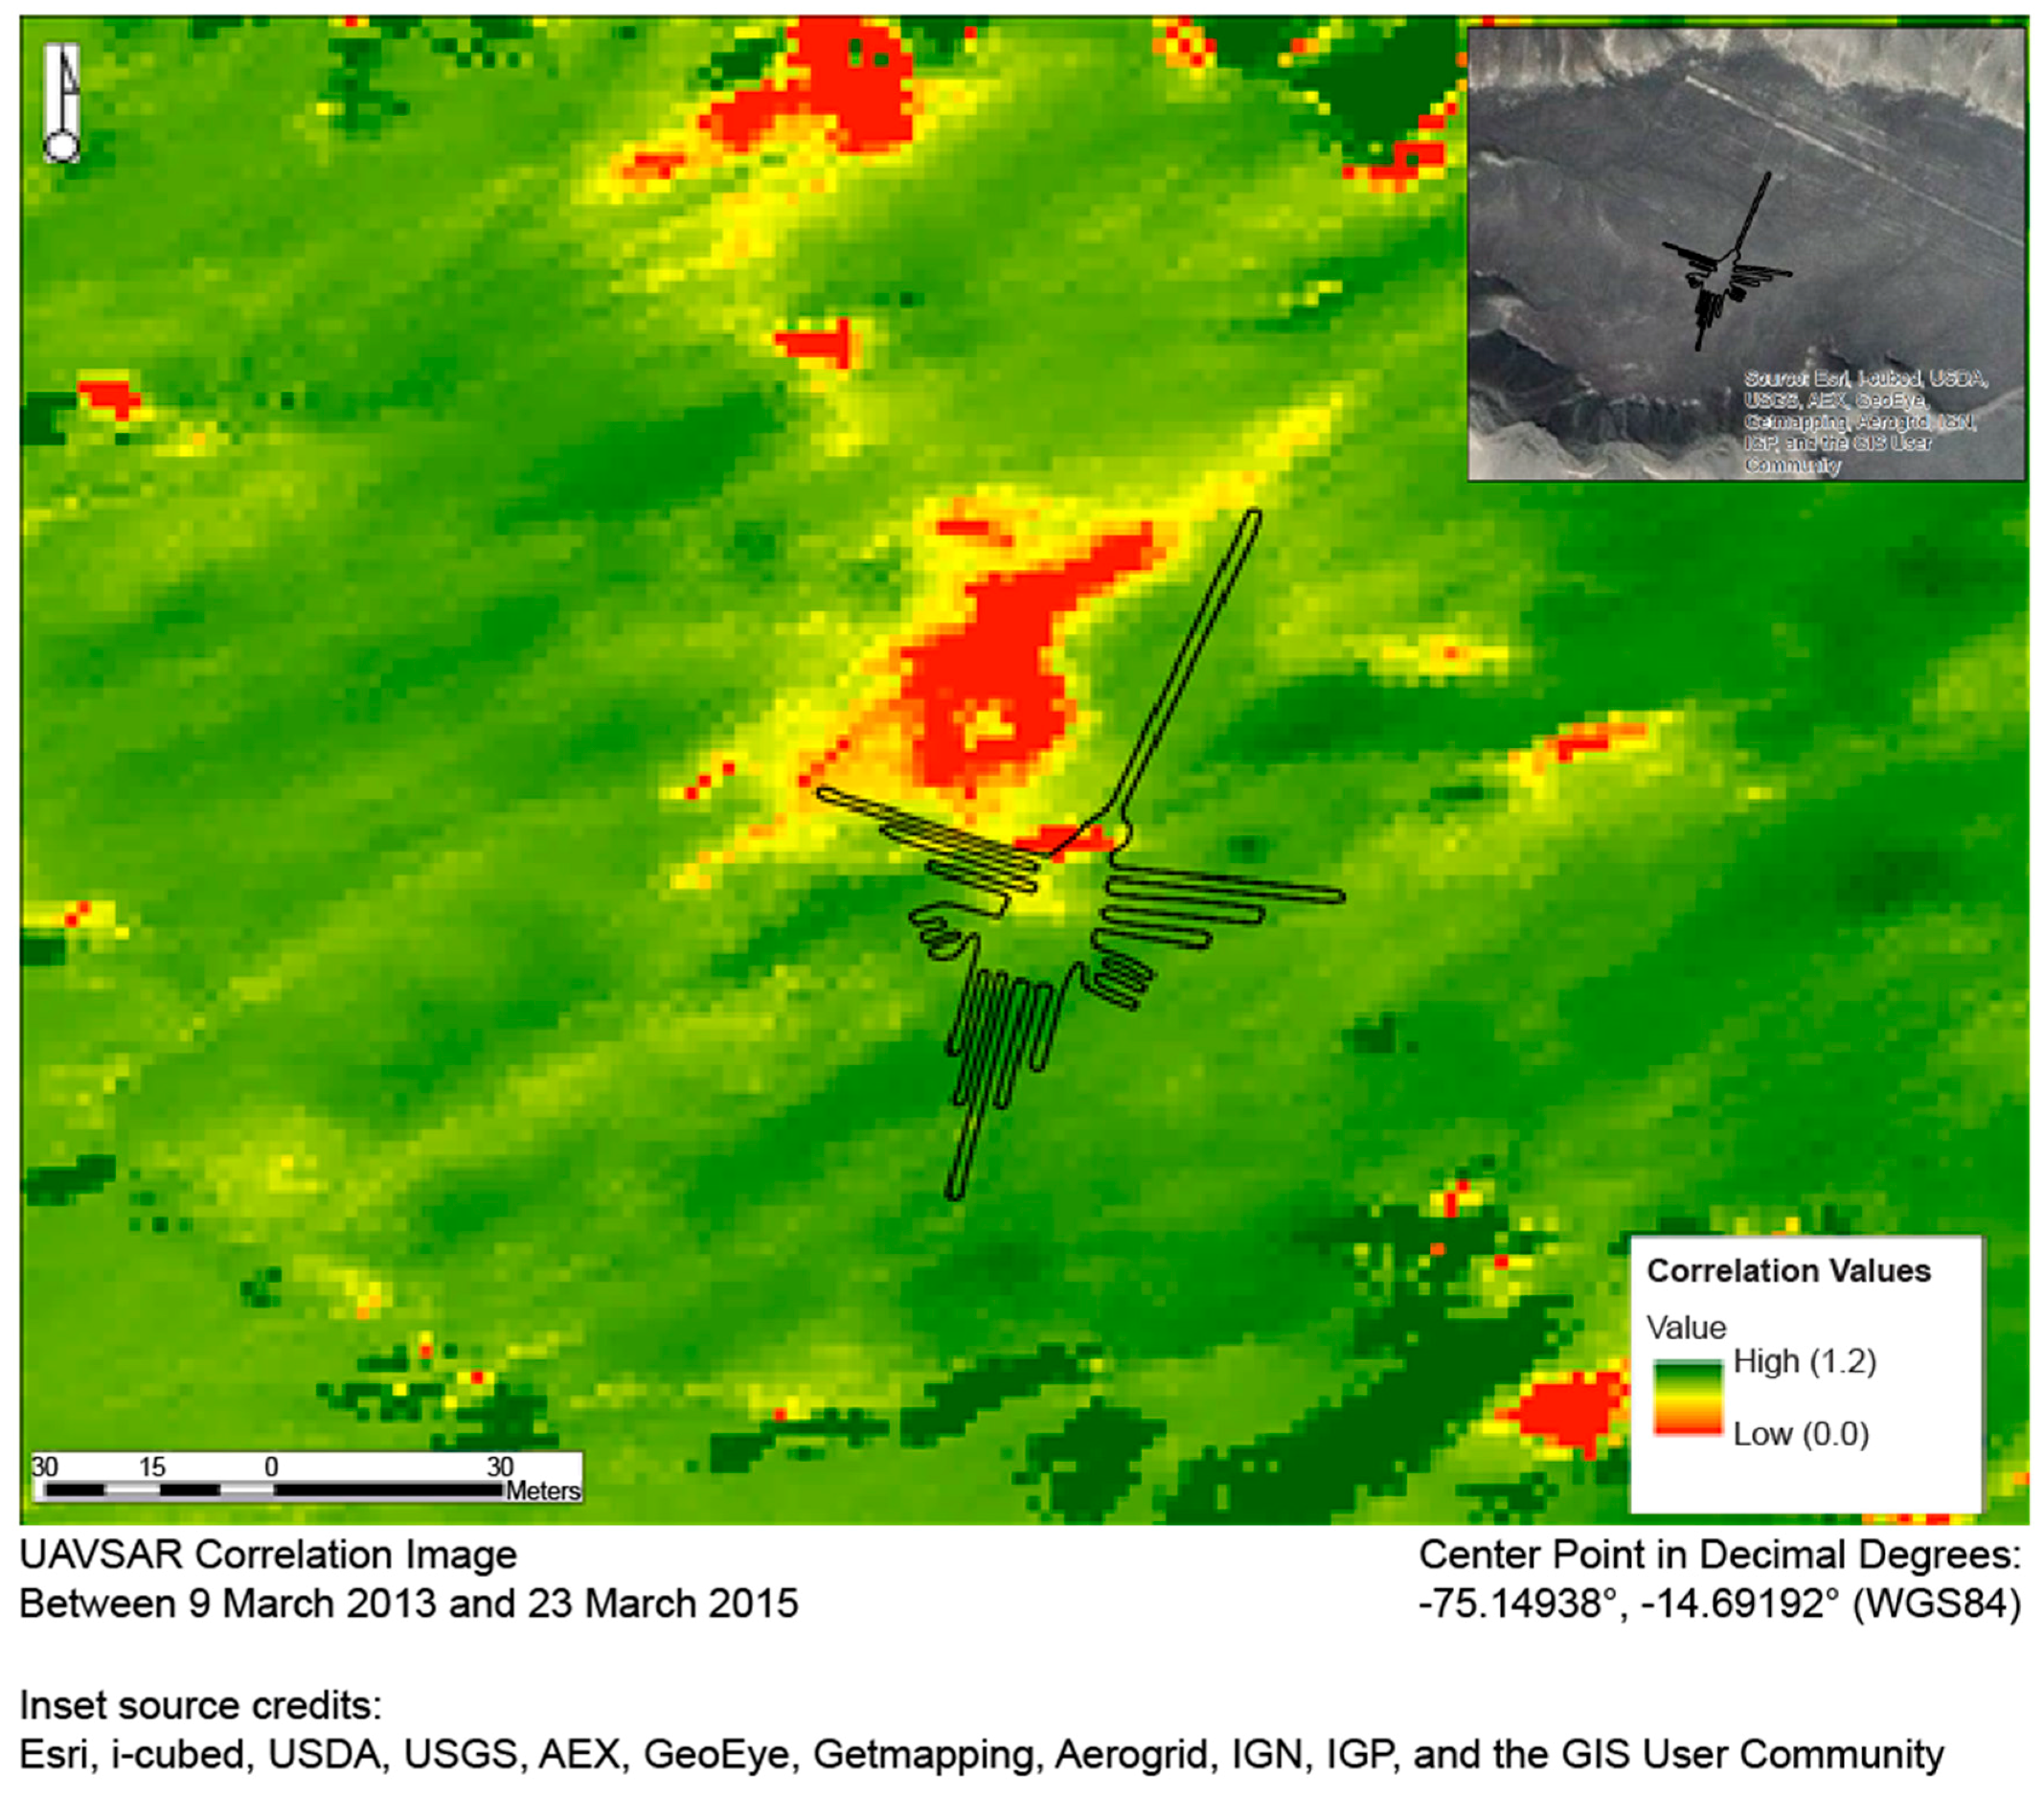
Figure 3.
The correlation image in (a) reveals landscape disturbance in the area shown in the satellite image in (b). According to Ministerio de Cultura personnel, pedestrian traffic and informal games of soccer are common in and around the geometric glyphs at the bottom and right of (b); such activity manifests as smooth, intense decorrelation. The steep and rugged terrain in the top left of the image has been disturbed by foot traffic and encroaching development from the river valley just to the north of the image. As these images attest, we found that disturbance tends to be greater in sloped areas, where gravity augments small movements of rocks or soil. This downslope erosion results in uneven, speckled decorrelation.
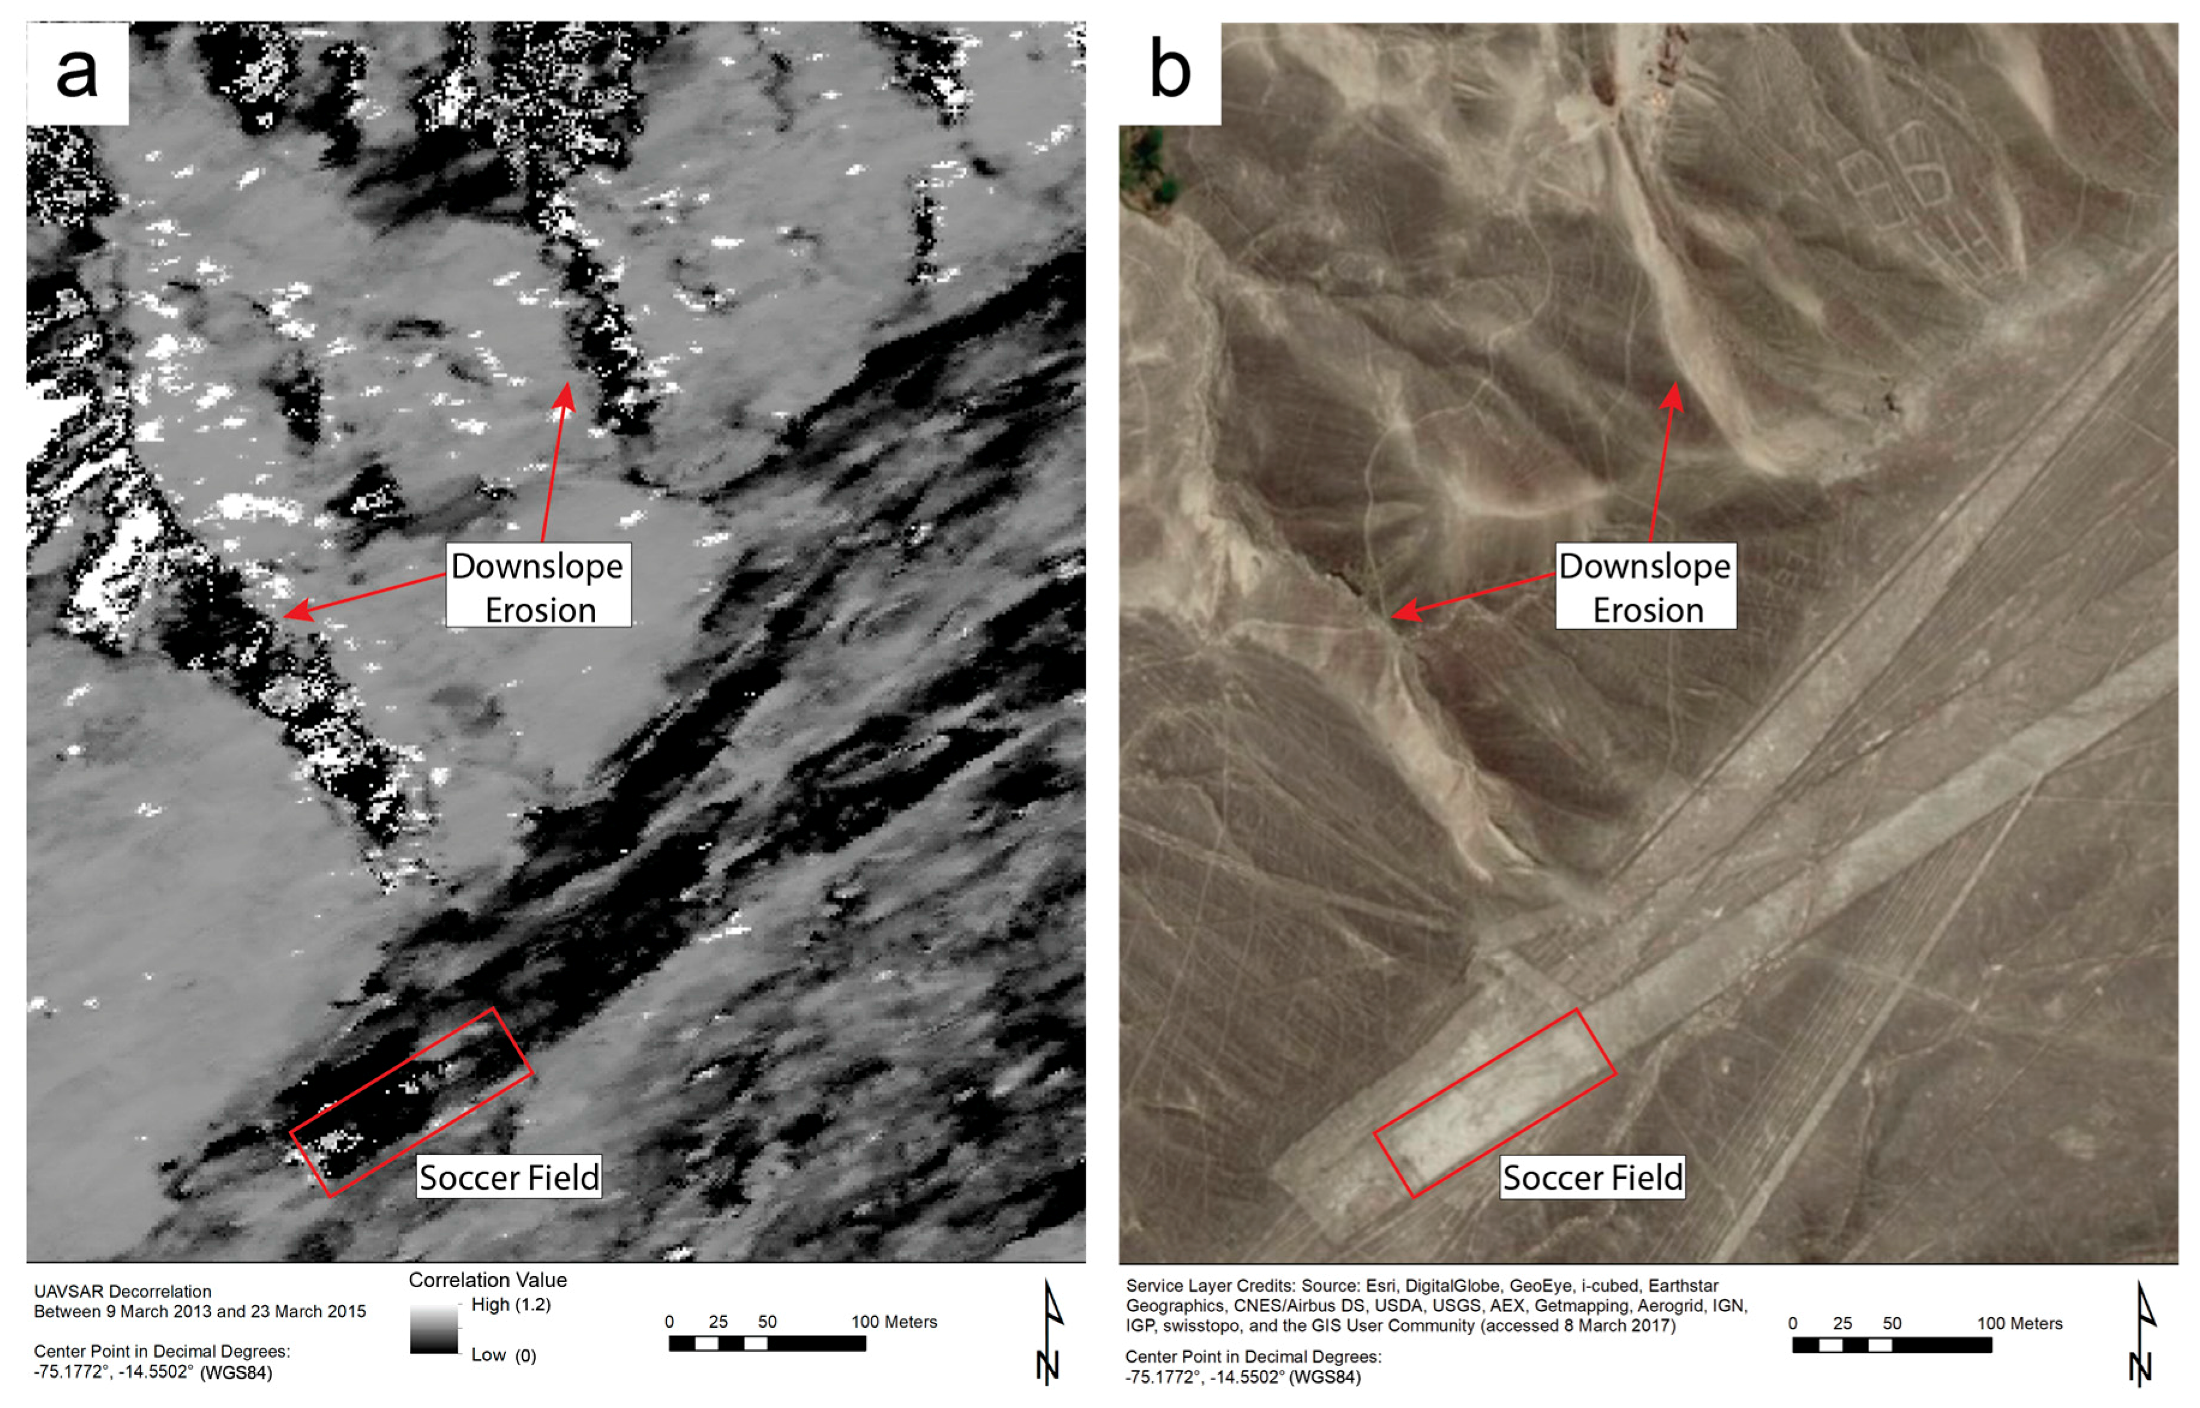
Figure 4.
The correlation image in (a) indicates that only one of the linear features visible in (b)—some of which may be not trails or roads, but geoglyphs—was substantially disturbed between UAVSAR flights (without ground verification, it is difficult to confidently classify the unidentified linear features). Sensor artifacts, visible in (a), are due to interference with radar waves by fast-moving vehicles on the highway and do not correspond to any physical features or changes on the ground.

Figure 5.
Panel (a) shows a Sentinel-1 amplitude image created using data collected on 18 December 2015. While many large landscape features are discernible here, the correlation image in (b); derived from data collected on 18 December 2015 and 11 January 2016, provides more information. In this image, we can differentiate among three types of land cover: natural vegetation, cultivated vegetation, and sand dunes. Panel (c) shows a pan-sharpened WorldView-2 image in which the agricultural areas demarcated by the box in (b) are visible.

Figure 6.
Panel (a) reveals slight disturbance to geoglyphs west of the Pan-American Highway and heavier disturbance, caused by vehicles, near the observation tower. These geoglyphs and the tower are visible in (b). In both (a,b), the tower is marked by the green dot, which is where the photo in (c) was taken. This photo shows vehicle tracks off the east side of the highway, running very near the Hands geoglyph. In (a), these tracks manifest as a patch of dark pixels near the green dot, and the highway appears as a dark line running southeast-northwest.

Figure 7.
Roads and trails near the archaeological site of Cahuachi that were used between 16 May 2015 and 18 December 2016 are visible in the Sentinel-1 correlation image in (a) as lines of dark pixels. In (b), the roads and trails in the same area are visible in a pan-sharpened WorldView-2 satellite image. Panel (c) is a photo taken at the juncture of the road and trail near the green dot in both (a,b).
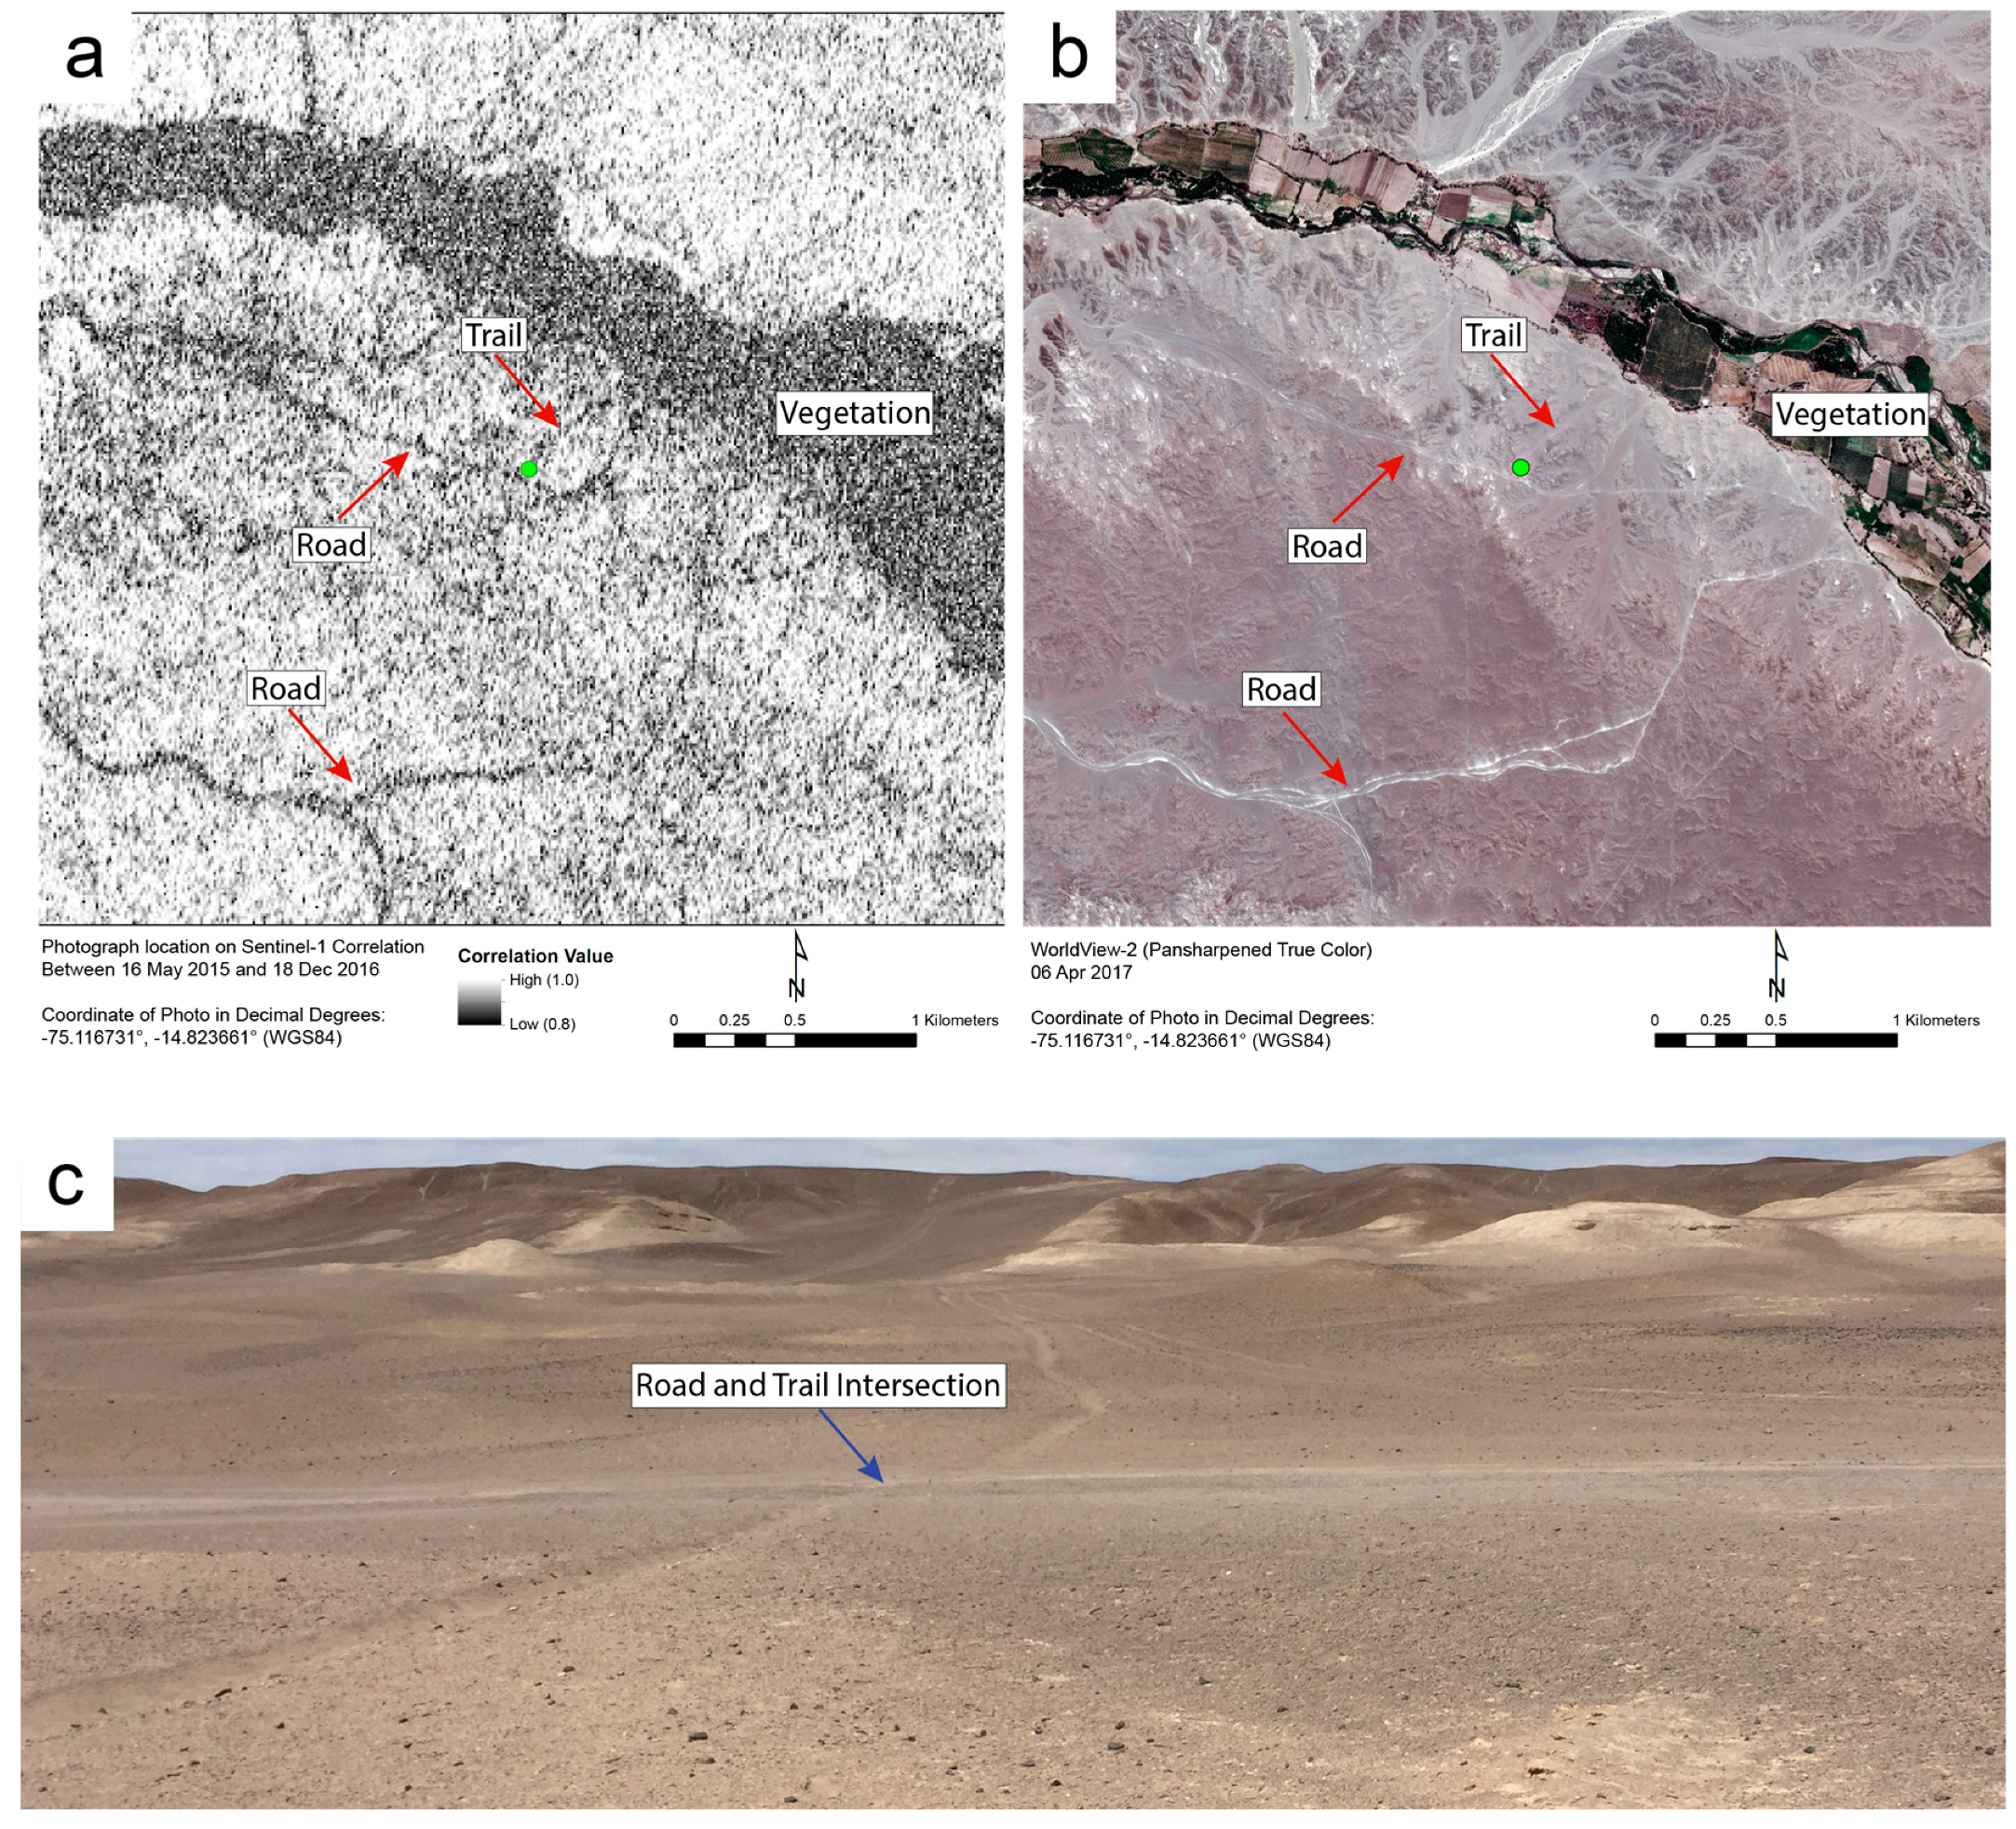
Figure 8.
The correlation change image in (a) compares two correlation images. Red and orange areas experienced a relatively constant level of disturbance between May 2015 and August 2017. Yellow to green indicates that decorrelation during the 2016–2017 period was 5% to 20% higher than during the 2015–2016 period. Panel (b) is a satellite image of the area delineated and labeled 1 in (a); (c) is a satellite image of area 2. Area 1 shows two lines of atypical decorrelation: one following a road that makes a corner-like turn, and one where drivers have cut across that turn. Both the road and the shortcut are visible in (b). Area 2 shows evidence of flooding between December 2016 and August 2017; the apparent watercourses that this flooding appears to have followed are visible in (c).

Figure 9.
Histograms of the correlation values of the pixels falling within the Hummingbird and its immediate area (blue) and a random sample of comparable cells from nearby, flat areas without radar shadow (red).
Figure 9.
Histograms of the correlation values of the pixels falling within the Hummingbird and its immediate area (blue) and a random sample of comparable cells from nearby, flat areas without radar shadow (red).

Figure 10.
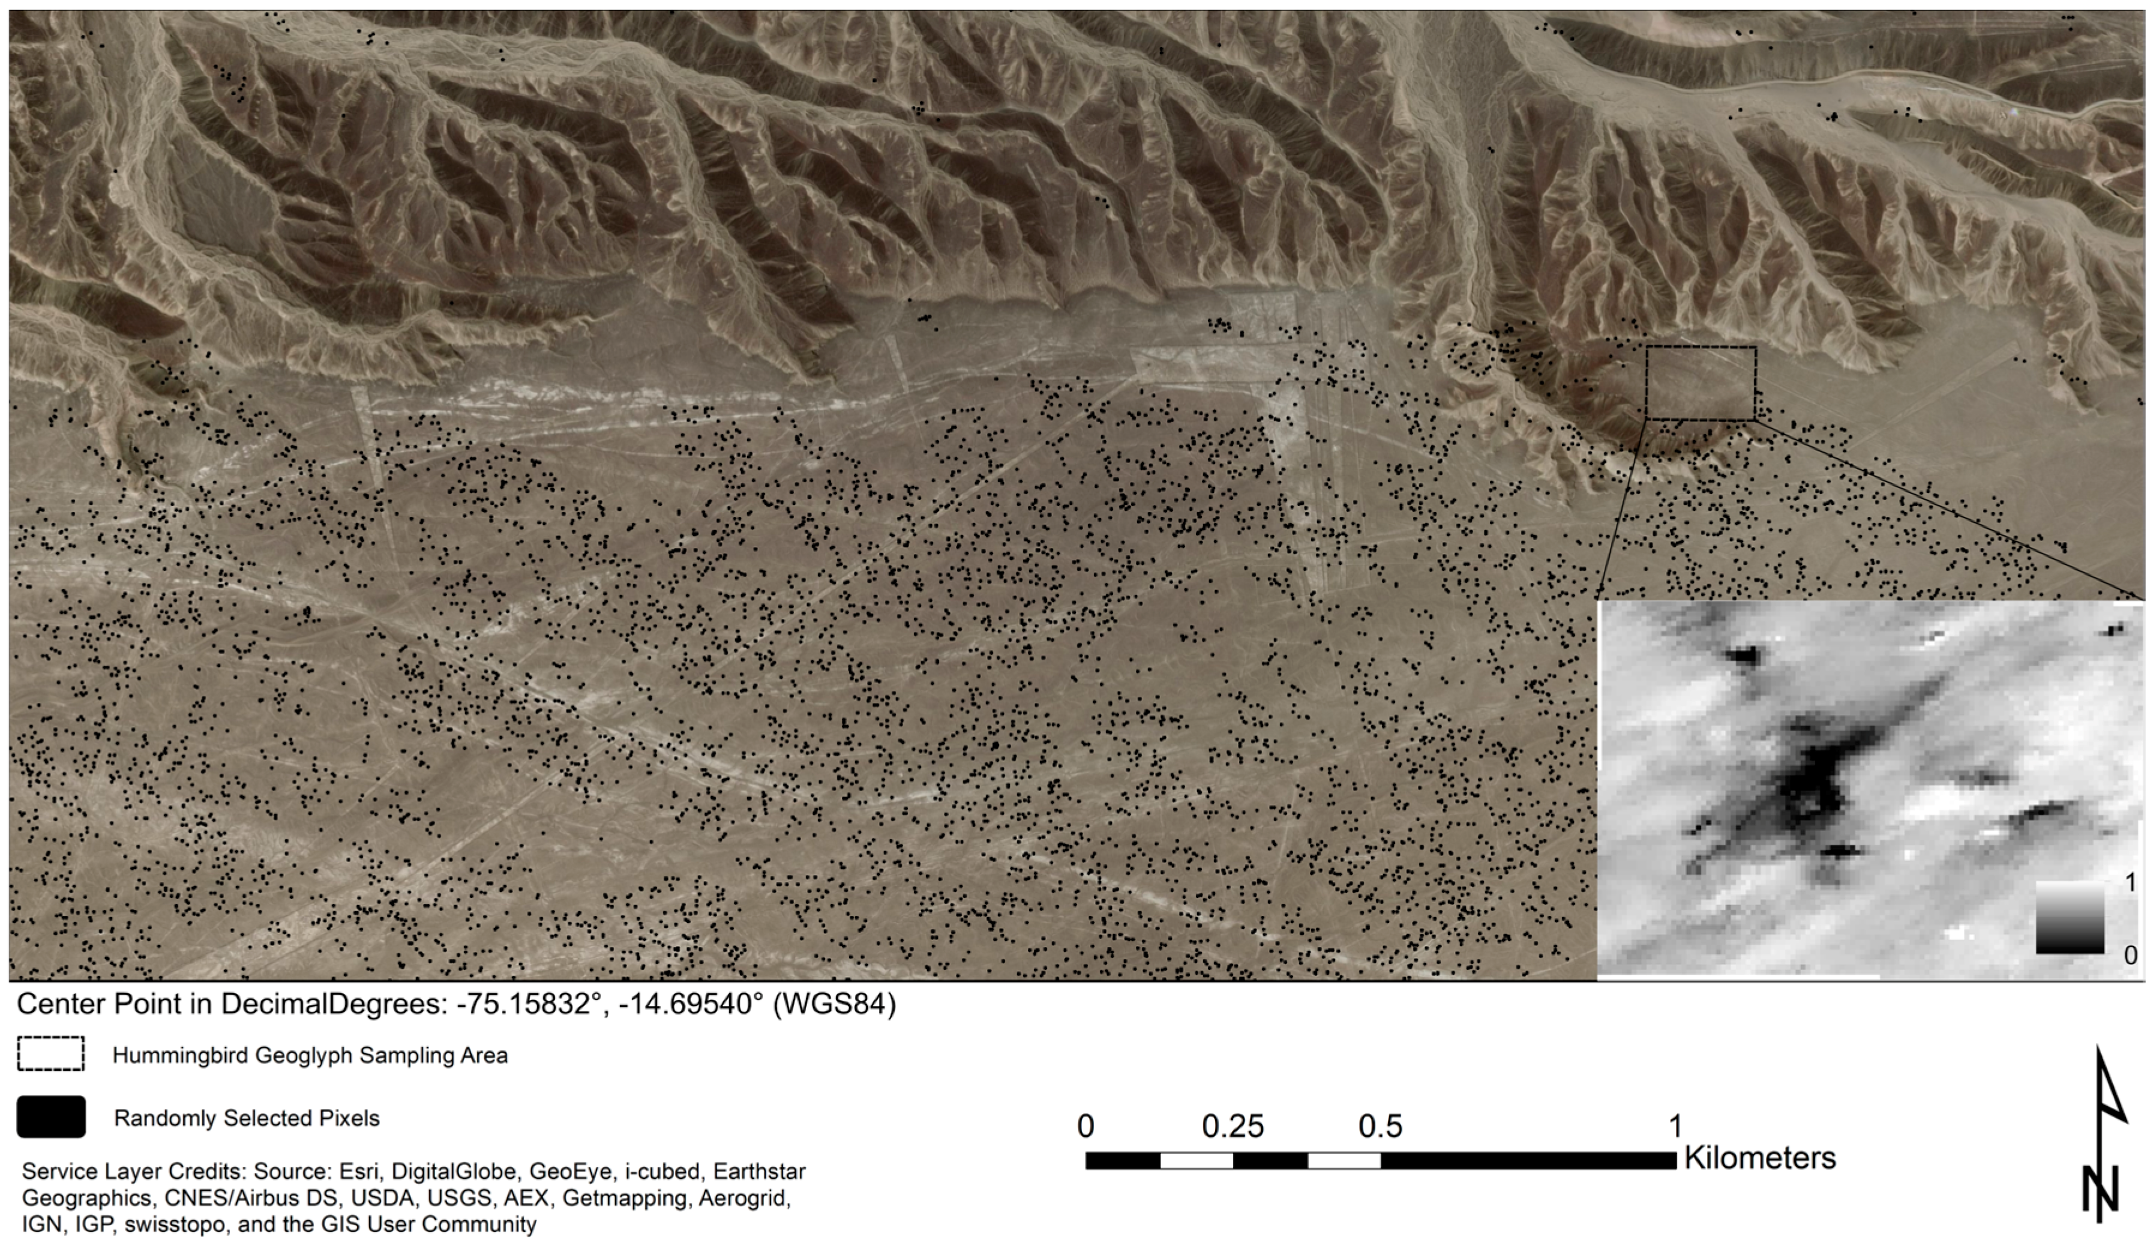
Satellite imagery of the northern edge of the pampas, with the Hummingbird near the top right corner, showing the locations of the pixels in the UAVSAR decorrelation image that were statistically compared. The 8240 pixels within and around the Hummingbird fall within the dotted rectangle; the inset shows the same area from the decorrelation image. The black dots show the locations of the 8240 pixels with which the Hummingbird pixels were compared. These pixels were randomly selected from areas without radar shadow that are, like the Hummingbird area, flat.
Figure 10.
Satellite imagery of the northern edge of the pampas, with the Hummingbird near the top right corner, showing the locations of the pixels in the UAVSAR decorrelation image that were statistically compared. The 8240 pixels within and around the Hummingbird fall within the dotted rectangle; the inset shows the same area from the decorrelation image. The black dots show the locations of the 8240 pixels with which the Hummingbird pixels were compared. These pixels were randomly selected from areas without radar shadow that are, like the Hummingbird area, flat.

© 2017 by the authors. Licensee MDPI, Basel, Switzerland. This article is an open access article distributed under the terms and conditions of the Creative Commons Attribution (CC BY) license (http://creativecommons.org/licenses/by/4.0/).
Share and Cite
MDPI and ACS Style
Comer, D.C.; Chapman, B.D.; Comer, J.A. Detecting Landscape Disturbance at the Nasca Lines Using SAR Data Collected from Airborne and Satellite Platforms. Geosciences 2017, 7, 106. https://doi.org/10.3390/geosciences7040106
AMA Style
Comer DC, Chapman BD, Comer JA. Detecting Landscape Disturbance at the Nasca Lines Using SAR Data Collected from Airborne and Satellite Platforms. Geosciences. 2017; 7(4):106. https://doi.org/10.3390/geosciences7040106
Chicago/Turabian StyleComer, Douglas C., Bruce D. Chapman, and Jacob A. Comer. 2017. "Detecting Landscape Disturbance at the Nasca Lines Using SAR Data Collected from Airborne and Satellite Platforms" Geosciences 7, no. 4: 106. https://doi.org/10.3390/geosciences7040106
Note that from the first issue of 2016, this journal uses article numbers instead of page numbers. See further details here.