1. Introduction
The occurrence and movement of groundwater is governed mainly by porosity and permeability of a rock formation. In crystalline rocks, there exist an irregularity in the movement of groundwater due to its variable subsurface geology and complex hydrogeology. This in part is due to the fact that groundwater occurrence and accumulation in crystalline terrain is controlled by secondary porosities developed as a result of weathering, jointing and fracturing which enhance porosities and storage capacities of crystalline rock units. Field experience has revealed that in crystalline rock terrains, boreholes have exhibited variable yields even at short distances apart. Major targets in regional groundwater exploration surveys in crystalline basement terrains occur in areas having weathering of considerable thickness and/or where fracturing and jointing are preponderant [
1,
2,
3]. Geological fieldwork required in traditional structural mapping can be time-ineffective and limited in operations scope by environmental issues comprising thick vegetation, rugged topography and local social unrest. Remote sensing techniques circumvent these limitations to provide time-effective capture of attributes that may reveal regional geological structures [
4,
5,
6,
7,
8]. Lineaments are readily observable on aerial photographs, satellite imageries and airborne geophysical data. Lineaments derived from geophysical and remote sensing data have been shown to correlate well with structural discontinuities mapped in the field [
2,
9].
Fractures inferred from both aerogeophysical and remote sensing data are usually verified by surface structural mapping and ground geophysical methods in groundwater exploration because inferred fractures may not always be water bearing. One of such ground geophysical techniques is Radial Vertical Electrical Sounding (RVES). RVES is a modified resistivity technique wherein the magnitude, intensity and direction of electrical anisotropy are determined. This method has proved very successful in the delineation of subsurface geology and structures, especially for effective identification, behavior and delineation of fracture orientations in the shallow (about 100 m) subsurface of crystalline basement terrains [
2,
10,
11,
12].
Communities within the Basement Complex terrains commonly suffer acute potable water shortages arising from the complex hydrogeological setting of the terrain [
13,
14]. The poor success rates of water borehole drilling in Basement Complex regions can be attributed to (i) non-incorporation of hydrogeological concepts into VES anomaly interpretations in borehole siting, (ii) complex tectonic setting of the terrain and (iii) geologic models that are not completely correct [
15]. Improving success rates in such low porosity aquifers requires the interpretation of complimentary geophysical datasets that can image fracture and fault networks.
Hence, this study attempts to delineate hydrogeologically significant structures via the preparation of thematic maps of lithology, lineament density, geomorphology, slope and drainage density for the final identification of groundwater potential zones in Paiko region, North Central Nigeria. The objectives of this paper are: (i) To employ enhanced Landsat ETM+, Shuttle Radar Topographic Mission Digital Elevation Model (SRTM DEM), aeromagnetic data and RVES to infer deep-seated and shallow lineaments of hydrogeologic significance; (ii) to model groundwater potential zones from integrated analysis of produced thematic maps; (iii) to correlate the groundwater potential map with existing boreholes and study the relationship between the thematic maps and groundwater yield of the area.
The outcome of this research would constitute an information framework that would guide the siting of productive water wells and provide baseline information for relevant agencies or the private sector in need of data for the development of groundwater resources and other associated environmental projects.
1.1. Study Area Description
The study area lies between latitudes 9°00′ N and 9°30′ N and longitudes 6°30′ E and 7°00′ E (
Figure 1). The area generally slopes southwest from regions underlain by the basement complex rocks to areas covered by sedimentary rocks forming flat and low-lying terrains. The eastern half of the area is rugged country with several peaks formed by granitic and migmatitic rocks. The highest point, which lies within the Fuka hills, stands above 600 m above sea level and about 300 m above the surrounding country. River Gurara and its tributaries including rivers Gudna, Jedna, Jednadalaso, Kudan and Jatau drain the study area [
16]. Some of the smaller rivers dry up during the dry seasons between November and April. As a result, rural dwellers have to depend on shallow hand-dug wells or pits dug into streambeds for water. Indeed, the settlement patterns in the area have been largely determined by the availability of water in both the sedimentary and the basement. There are two seasons associated with the climate. These include the rainy and dry seasons. The total annual rainfall in this area is between 1270 mm and 1524 mm, spread over the months of April to October.
1.2. Geology of Study Area
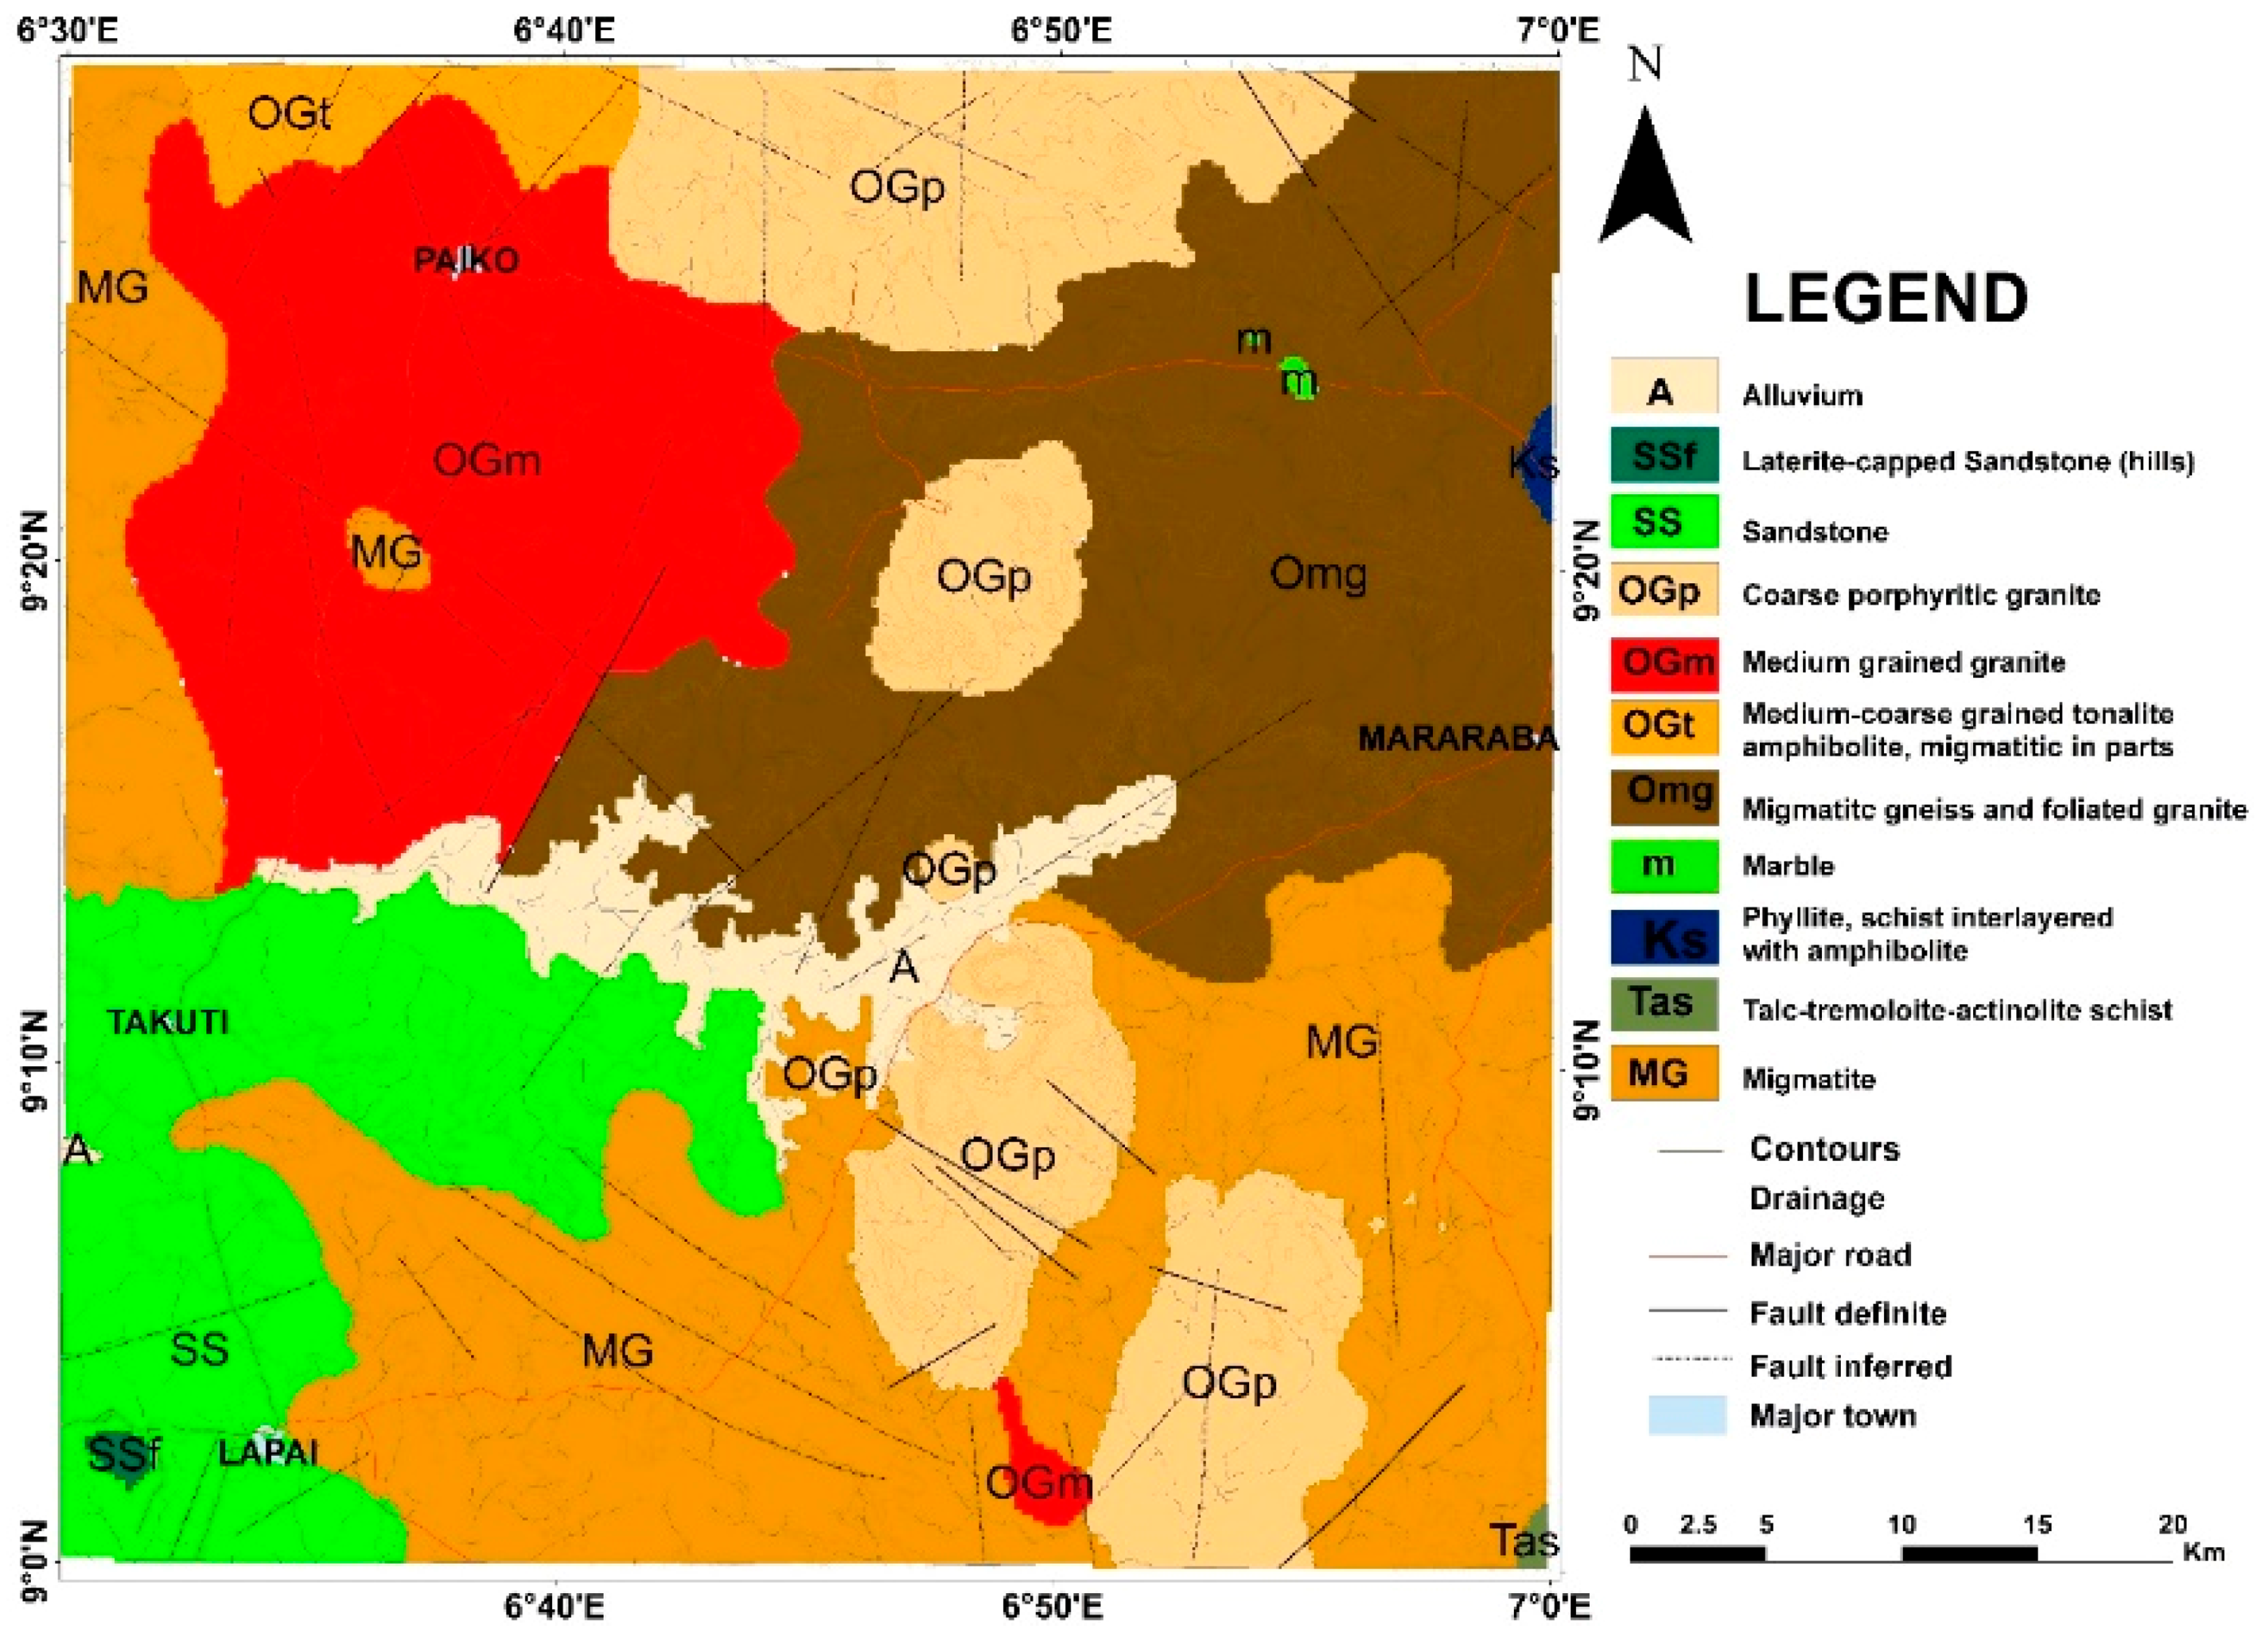
The study area lies within the Basement Complex Terrain of Nigeria. The Nigerian Basement Complex forms part of reworked part of the West African Craton underlies about 60% of Nigeria’s land mass [
17]. The Basement complex has been described by Rahaman (1988), as a heterogeneous assemblage, which includes migmatites, gneisses, schists and a series of basic to ultrabasic metamorphosed rocks. Pan African Granites and other minor intrusions such as pegmatite and Aplites dykes and quartz veins have intruded these rocks. About 15% of the area in the southwestern part is covered by sedimentary rocks made up of sandstones while alluvial deposits of gravel, coarse and fine sand, silt and clay are found in the central part of the area (
Figure 1).
The structural elements in the study area include joints, faults, foliations and minor folds. Most of these structural elements do not appear on the map due to the scale of the map. Some fault lines that appear on the map are deep-seated in origin and ancient in age and was as a result of thermotectonic deformational events mostly of the Eburnean and Pan-African Orogeny [
18]. The dominant structural trend in the basement is essentially NE–SW and follows the tectonic grain of the schist belt [
2,
19]. Subordinate directions, which are locally dominant, include E–W and NW–SE. Widespread fracturing occurs throughout the area and follows the orientation of the major faults.
Information from fieldwork established that the area suffered from chronic water shortages as a consequence of the seasonal nature of the streams and hand-dug wells which dry up during dry seasons. Boreholes, when available, are poorly developed and have extremely low yields or are completely unproductive.
2. Methods
Integrating aeromagnetic data and Landsat imagery in groundwater exploration is an established practice in some parts of the world [
20,
21]. In central Nigeria, integration of different datasets for groundwater exploration is not very common except for studies performed by [
22] who incorporated both Landsat and aeromagnetic analysis in appraising the structural geology of Kakuri, central Nigeria and [
23] who used the same method for groundwater exploration. Hence, the methodologies applied in their studies have been adopted and built upon in this study. Processing of Landsat ETM+, SRTM DEM, aeromagnetic, surface structural and RVES datasets reveal anomalies that are employed in delineating features and aquifers that may impact the accumulation and flow of groundwater. Since Landsat ETM+ and SRTM DEM have approximately 30 m spatial resolution, only the aeromagnetic dataset was resampled to 30 m spatial resolution using a bilinear resampling method.
2.1. Lithologic and Surface Structural Data
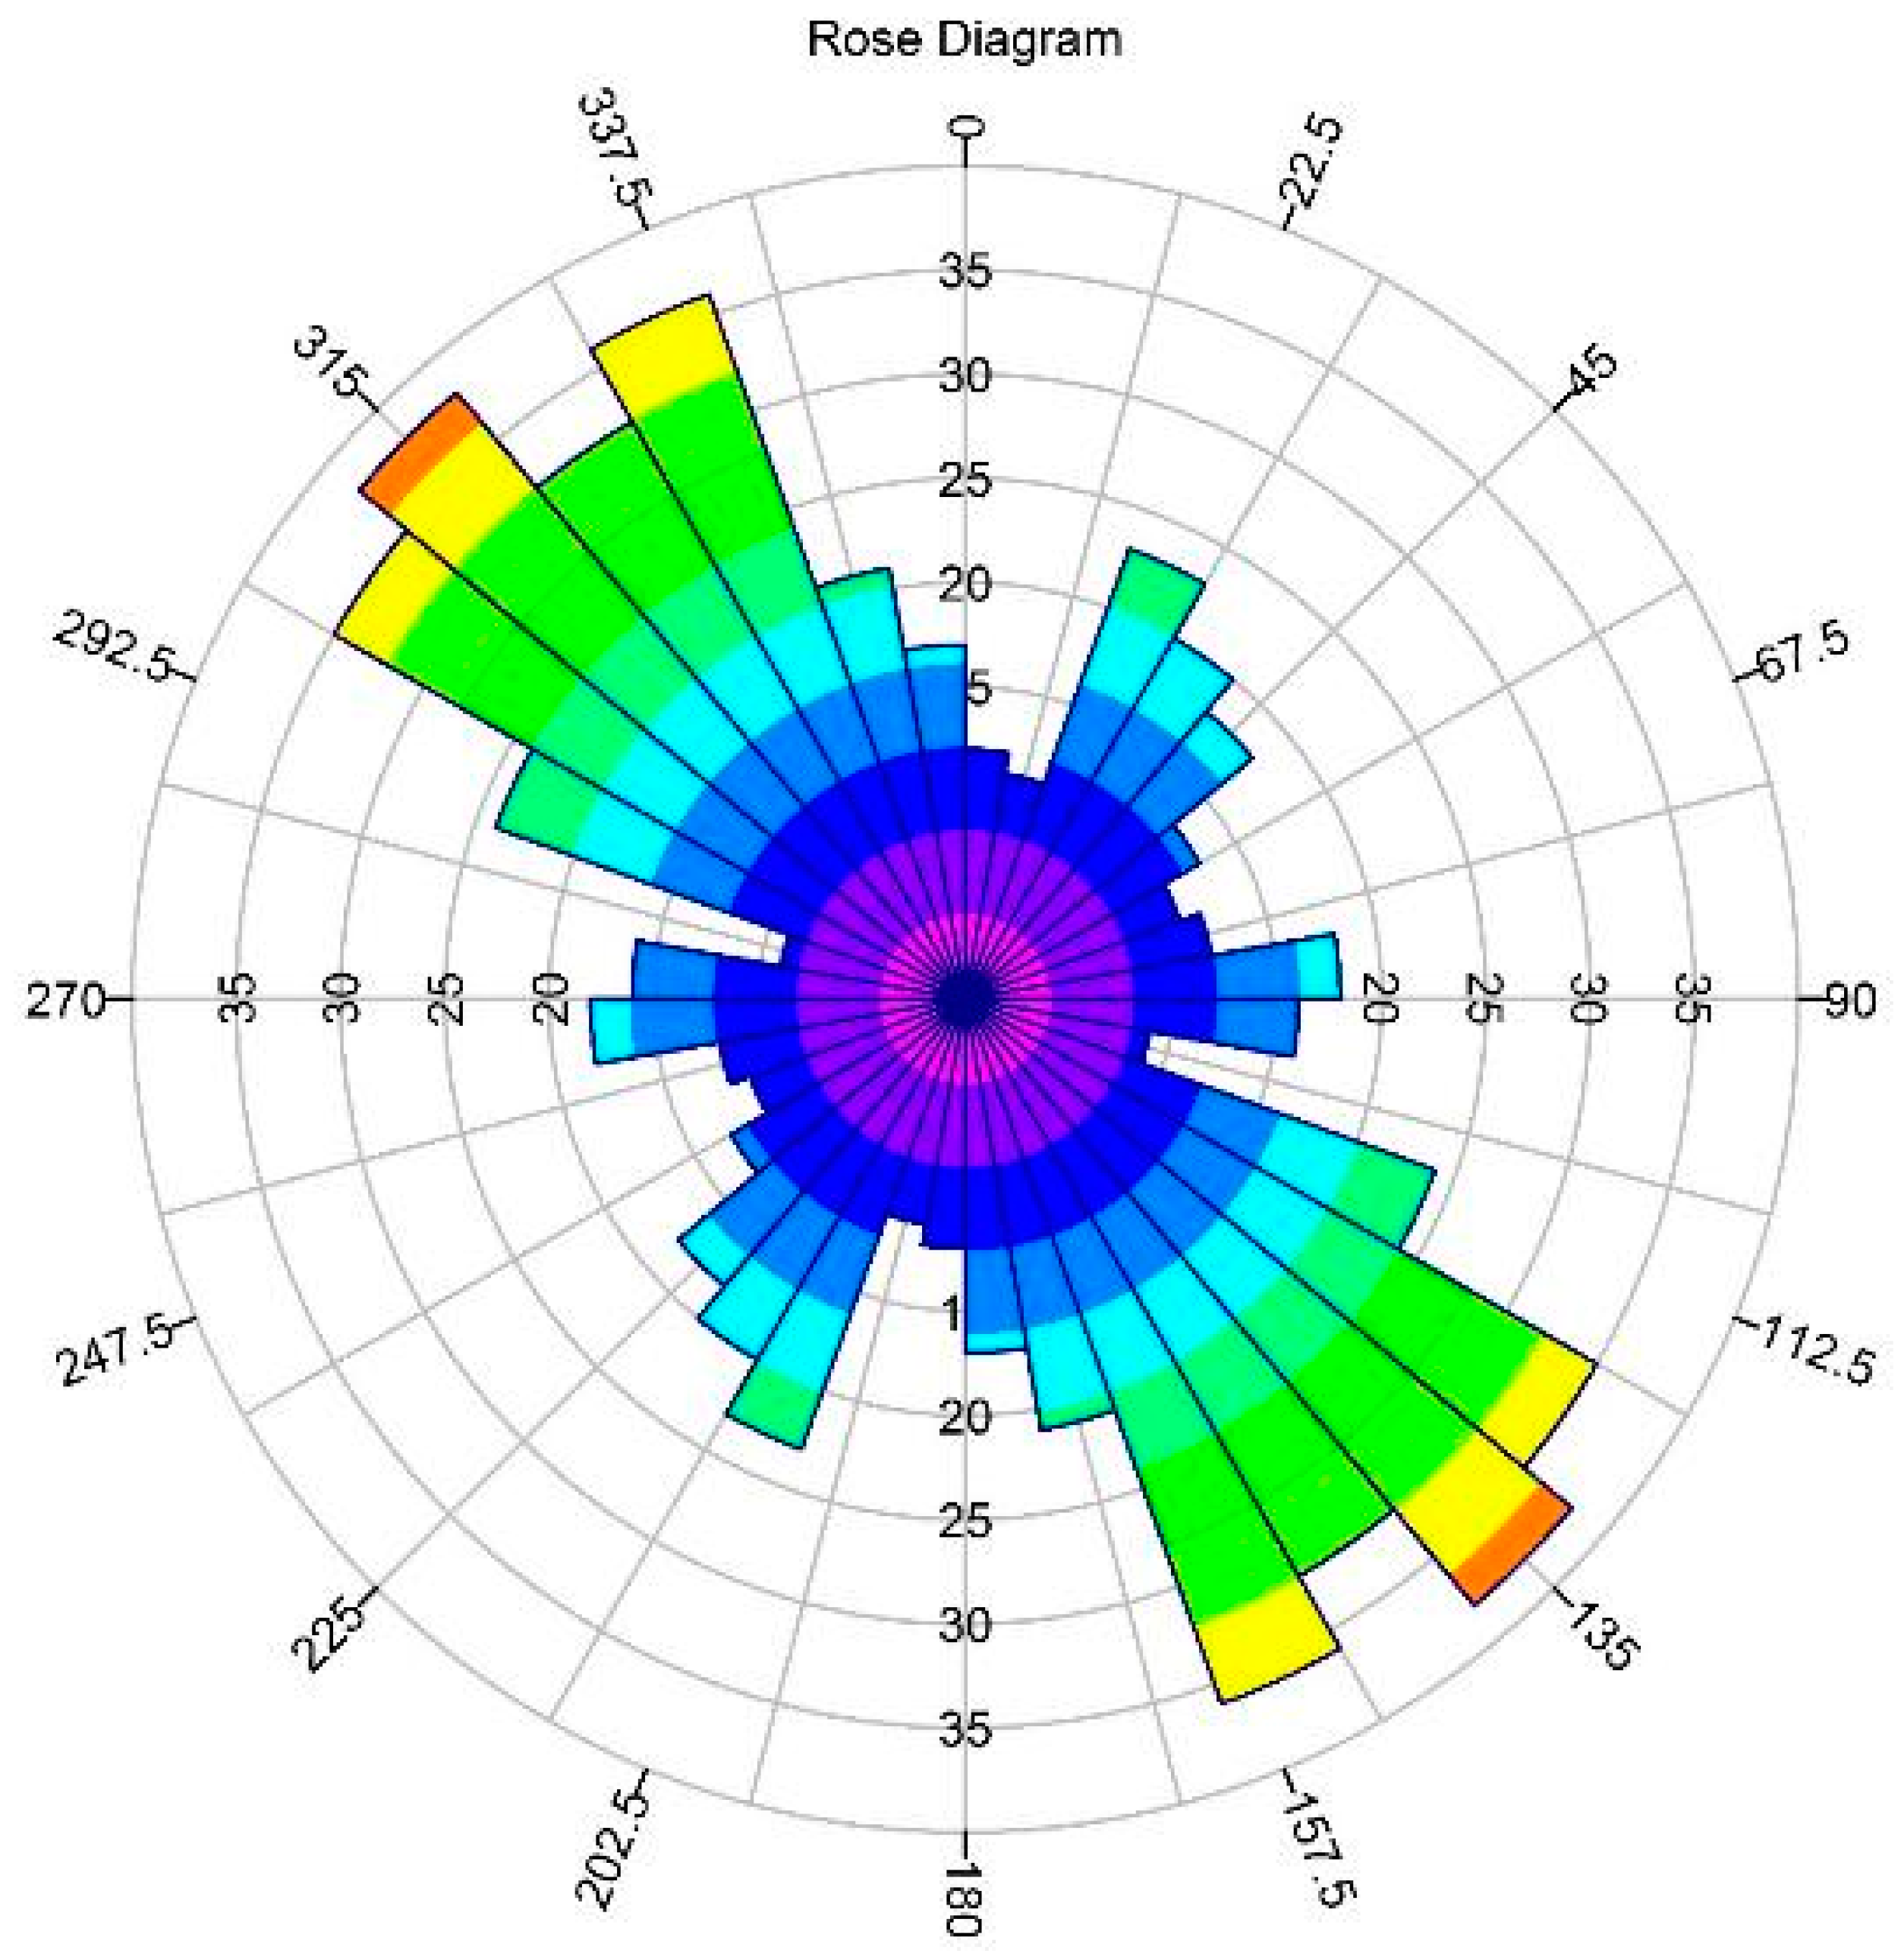
Field geologic mapping was conducted on a scale of 1:12,500 in the northwestern quadrant of the Sheet. In order to assess the hydrogeological conditions of selected boreholes and hand-dug wells, existing wells were investigated with regard to geographic location, rock type, weathering, topography and structure. Structural measurements of joint and fracture sets were taken where possible. A rose diagram showing the predominant joint directions was subsequently produced.
2.2. Remote Sensing Data Processing
Image processing for both Landsat ETM+ and SRTM DEM was performed using a combination of ENVI version 4.8 software (Exelis Visual Information Solutions, Boulder, CO, USA) and ArcGIS software (Environmental Systems Research Institute, Redlands, CA, USA). Shaded relief representations of SRTM DEM using sun elevation angle of 25° and sun illumination directions of 0°, 45°, 90°, 270° and 315°, perpendicular to the prominent structural orientations in the region were selected to enhance the linear features. SRTM DEM with 30 m spatial resolution was digitally processed to produce thematic layers that included geomorphologic and slope maps. Drainage networks were extracted using the spatial analyst tool of ArcGIS. Drainage density map delineation was carried out by dividing the study area into micro-watersheds using the methods of [
24]. Intersection of micro-watersheds and drainage layer was used for the calculation of drainage density for each of the micro-watersheds expressed in terms of the length of channels per unit area (km/km
2) in the ArcGIS software using a search radius of 2 km. Higher search radii gave rise to drainage densities that are not representative of the drainage networks in the area when compared to published topographic map of the region. The drainage density values obtained were reclassified to prepare drainage density map of the study area.
Landsat Enhanced Thematic Mapper (ETM+) 7 (28.5 m resolution) path/row (189/054) was acquired February, 2013. Pre-processing and processing of Landsat images included layer stacking, Optimum Index Factor (OIF) calculations (to select the best band combinations) and principal component analysis (PCA). Contrast stretching and edge enhancement using the Sobel edge detector algorithm were also applied to the Band 5 image in order to enhance delineation of linear structures. For other features like contact locations and lithologic discrimination, PCA worked better as spectral responses are important in this regard. Lineaments were digitized separately from SRTM DEM and Landsat maps and subsequently combined to form a composite of lineaments extracted from remote sensing imagery.
2.3. Aeromagnetic Data Processing
The aeromagnetic data was obtained from Nigeria Geological Survey Agency (NGSA). The data was acquired along a series of NE–SW profiles with a flight line spacing of 500 m and terrain clearance of 80 m. The average magnetic inclination and declination across the survey is −5.49° and −1.99° respectively. The data were gridded at 125 m spatial resolution using the minimum curvature gridding method [
25]. The total magnetic intensity field was IGRF (International Geomagnetic Reference Field, 2009) corrected and a super-regional field of 32,000 nT was deducted from the raw data. Airborne magnetic data was processed in Oasis montaj software, while information extraction and interpretation was done using ArcGIS software. The aeromagnetic data was initially subjected to Reduction to the Magnetic Equator (RTE) and was further processed to investigate the presence of buried structures that might be relevant in groundwater exploration. Directional and normalized derivatives were calculated to accentuate near surface structures from which lineaments were identified and delineated. These included shaded relief, first vertical, total horizontal, tilt derivatives and analytic signal maps. These maps show delineated lineaments of relatively shallow features important for groundwater evaluation (about 100 m) [
26,
27].
Magnetic lineaments can be related to faults and fractures or lithologic contacts. Several geologic processes may change the magnetic properties of the bedrock depending on prevailing physical and chemical conditions and mineralogy [
28]. Hence, faults and fractures may induce a magnetic minimum or maximum. After a series of interpretation, magnetic minima were found to be more representative of faults and fractures. A composite of all magnetic lineaments and their corresponding rose diagram was constructed. Finally, composite lineament maps from different data sources were integrated to form a final lineament map of the study area. Subsequently, a lineament density map was created using the line density tool of ArcGIS with search radius of 2 km. Source Parameter Imaging algorithm (local wave number) [
29] was applied to the RTE magnetic data to model depth to causative bodies.
2.4. GIS Modeling
In regional groundwater exploration, there are many criteria to select from that control the availability of groundwater in particular terrains [
21]. Selection criteria for optimum groundwater development site are highly subjective. As the number of criteria to be considered keeps increasing, the task of objectively and optimally selecting a site becomes increasingly complex. The Analytic Hierarchy Process (AHP) is a mathematical approach for the decision-support tool capable of solving complex decision problems [
30]. It is a powerful tool capable of considering an unlimited number of significant criteria exhibiting different units or no units at all. The AHP is a three-step process that enables multiple criteria optimization into an objective algorithmic approach. First, a hierarchy consisting of the possible and intermediate outcomes (in this case, the thematic layers) of influence are constructed. For each level of the hierarchy, pairwise comparisons between the thematic layers and between classes of the thematic layer criteria determined the ordering of decision elements. This step enabled priority weighting of the criteria influencing the outcome decision, as well as ranking of the possible outcomes in terms of performance for each criterion (
Table 1).
Selected thematic layers were assigned weights using AHP excel template [
32] according to their importance in groundwater availability. Thereafter, these thematic layers were reclassified to a common scale of 1 to 5 by intervals of 1, called scale values for the weighted overlay operation, with 5 being the highest potentiality score, 1 being the lowest and 0 being restricted (unsuitable) values (
Table 2). The ArcGIS Weighted Overlay tool requires integers for the scale values, which were calculated by multiplying the weighted values by 5 and rounding to the nearest integer. These scale values were used as the potentiality scores (
Table 2).
2.5. Ground Geophysical Survey
The essence of conducting surface structural mapping is to understand the relationship between exposed fractures on outcrops and their behavior in the subsurface. However, inferences made about the surface fractures in relation to their subsurface behaviors are always met with high uncertainties. Therefore, to greatly minimize these uncertainties, Radial Vertical Electrical Sounding (RVES) is employed to aid the understanding of the behavior of crystalline rock structures at depth. The interpreted RVES data is used to correlate the general fracture trends of the rocks from surface geology, with those determined by RVES method.
Rock formations which are anisotropic due to the presence of fractures, have shown that the apparent resistivity ρ
t, measured normal to its strike direction, is less than ρ
s, measured along the strike direction, although the true resistivity ρ
t, normal to its stratification, is greater than that parallel to the plane of stratification, ρs. This is called the ‘paradox of anisotropy’ [
33].
In this study, RVES was conducted at selected sites using Schlumberger configuration (AB/2 = 100 m). Apparent resistivities are measured along three different azimuths N–S, NE–SW and NW–SE for a given AB/2 separation and are plotted as electrical anisotropy polygons. For an isotropic homogeneous formation, the electrical anisotropy polygon will assume a circular shape. Any deviation from a circle to an ellipse is indicative of anisotropic nature of the formation. Major axis of the ellipse which can fit any such anisotropy polygon gives the strike direction of the fracture. A high ratio of the long to short axis is indication of the presence of fractures (faults and joints system) in an area. If it is low, fractures are not significant or are absent.
The coefficient of apparent anisotropy λa (degree of fracturing) is calculated from each anisotropy ellipse using the relationship, λa = a/b, where a and b are the semi-major and semi-minor axes of the ellipse. All the calculated λa values are then plotted against the corresponding AB/2 separations. The behavior of rock fracturing at various depths equivalent to different AB/2 separations can thus be understood qualitatively from the variation of λa.
3. Results
3.1. Lithologic and Structural Mapping
Exposed lithologic units comprised alluvial deposits, granite, gneiss and migmatite. Alluvial deposit occupies streambeds and stream banks composed of sand, silt and clay in various proportions with some pebbles and cobbles and the color varies from greyish white through reddish brown to black. There is a variation in the height of the outcrops which range from steep hills to low lying massive stock with gentle elevations and textures ranging from fine to coarse. Migmatites, which are the most widespread lithology within the study area are low lying. Gneisses occur as a group of minor discontinuous intrusions of small areal extent in the migmatites. Granitic rocks outcrop mainly as high, extensive whalebacks. They form the highest elevation in the area. Foliations in gneisses gave dominant trend of NW–SE and NE–SW. Transcurrent fault sets were observed in the area. Fault axis of 40°–60° were measured in the granites. The principal joint directions trend NW–SE. Minor joint directions trend NE–SW (
Figure 2).
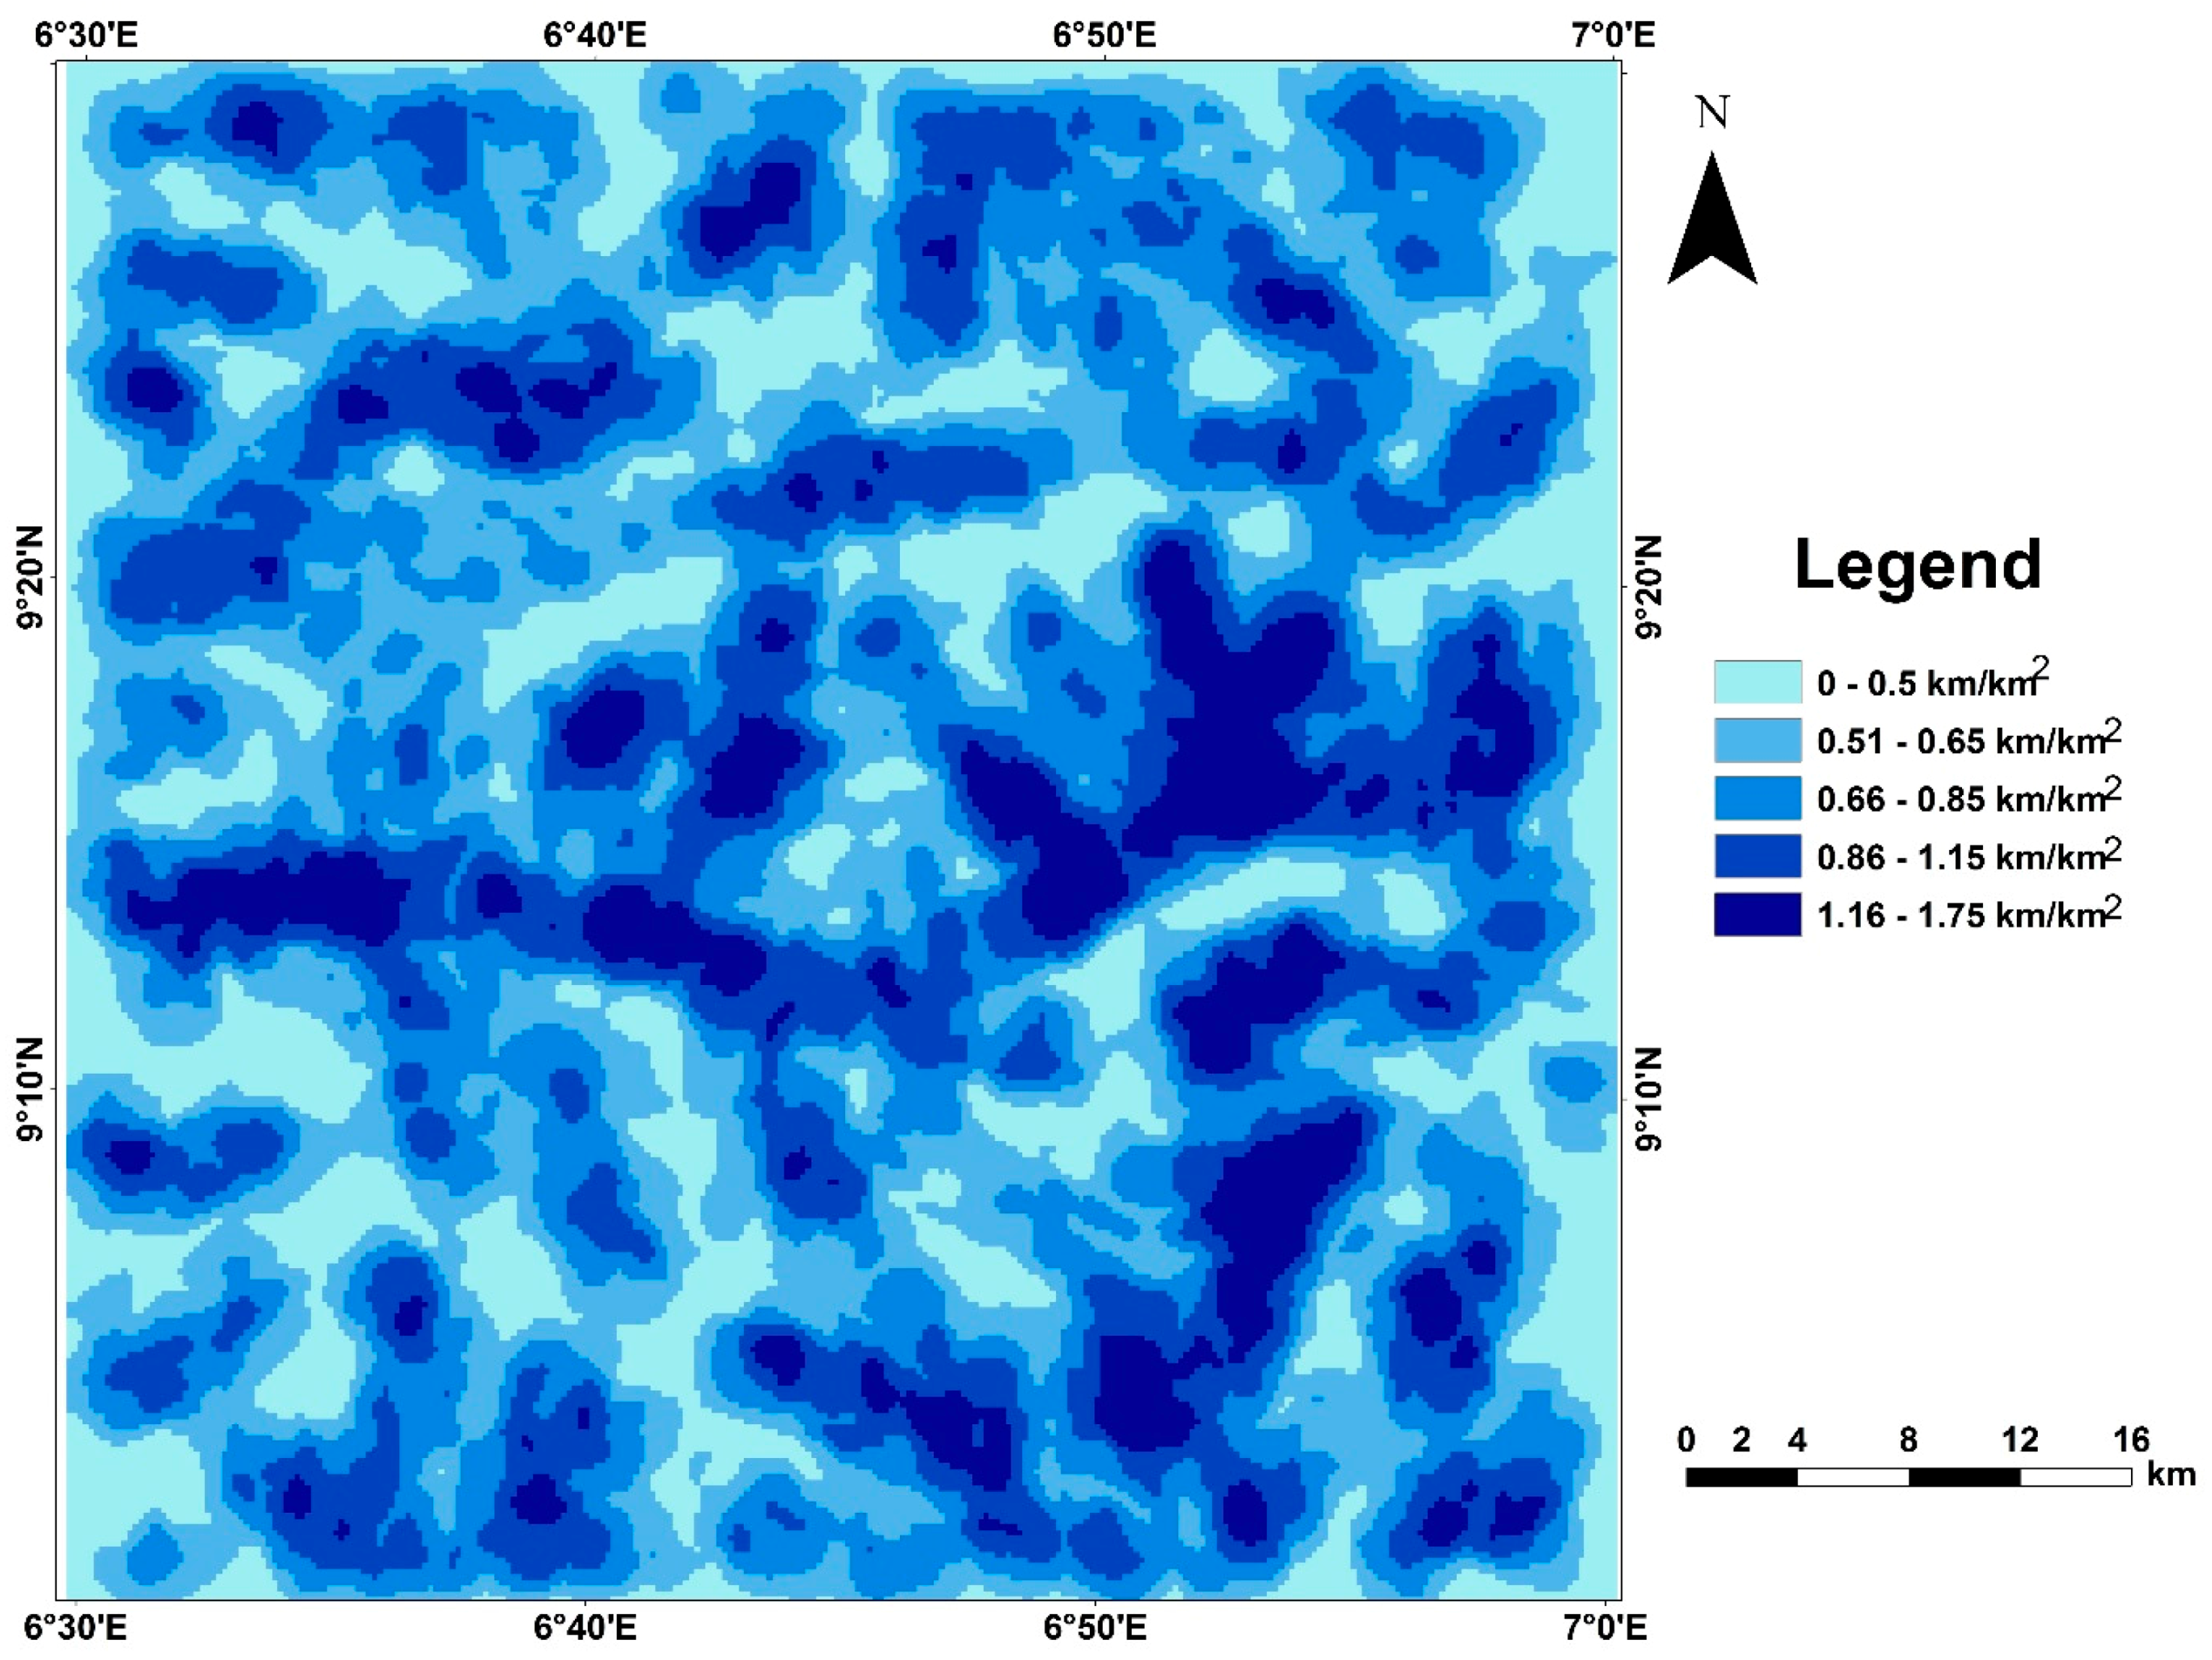
3.2. Drainage Networks Density
The drainage system of the area exhibits dendritic drainage, typical of a crystalline basement terrain. Spatial distribution of drainage density is shown in (
Figure 3). The area has a moderately dense drainage system with values ranging from 0.5 km/km
2 to 1.75 km/km
2. Higher drainage densities are found concentrated in central and southeastern part of the area due to higher surface water runoff. These values imply that recharge and percolation into the subsurface is low. Therefore, in using this thematic map for the GIS modeling, drainage density was assigned a low weight because of its minimal contribution to the groundwater potential in the area.
3.3. Lineaments and Lineament Density Maps
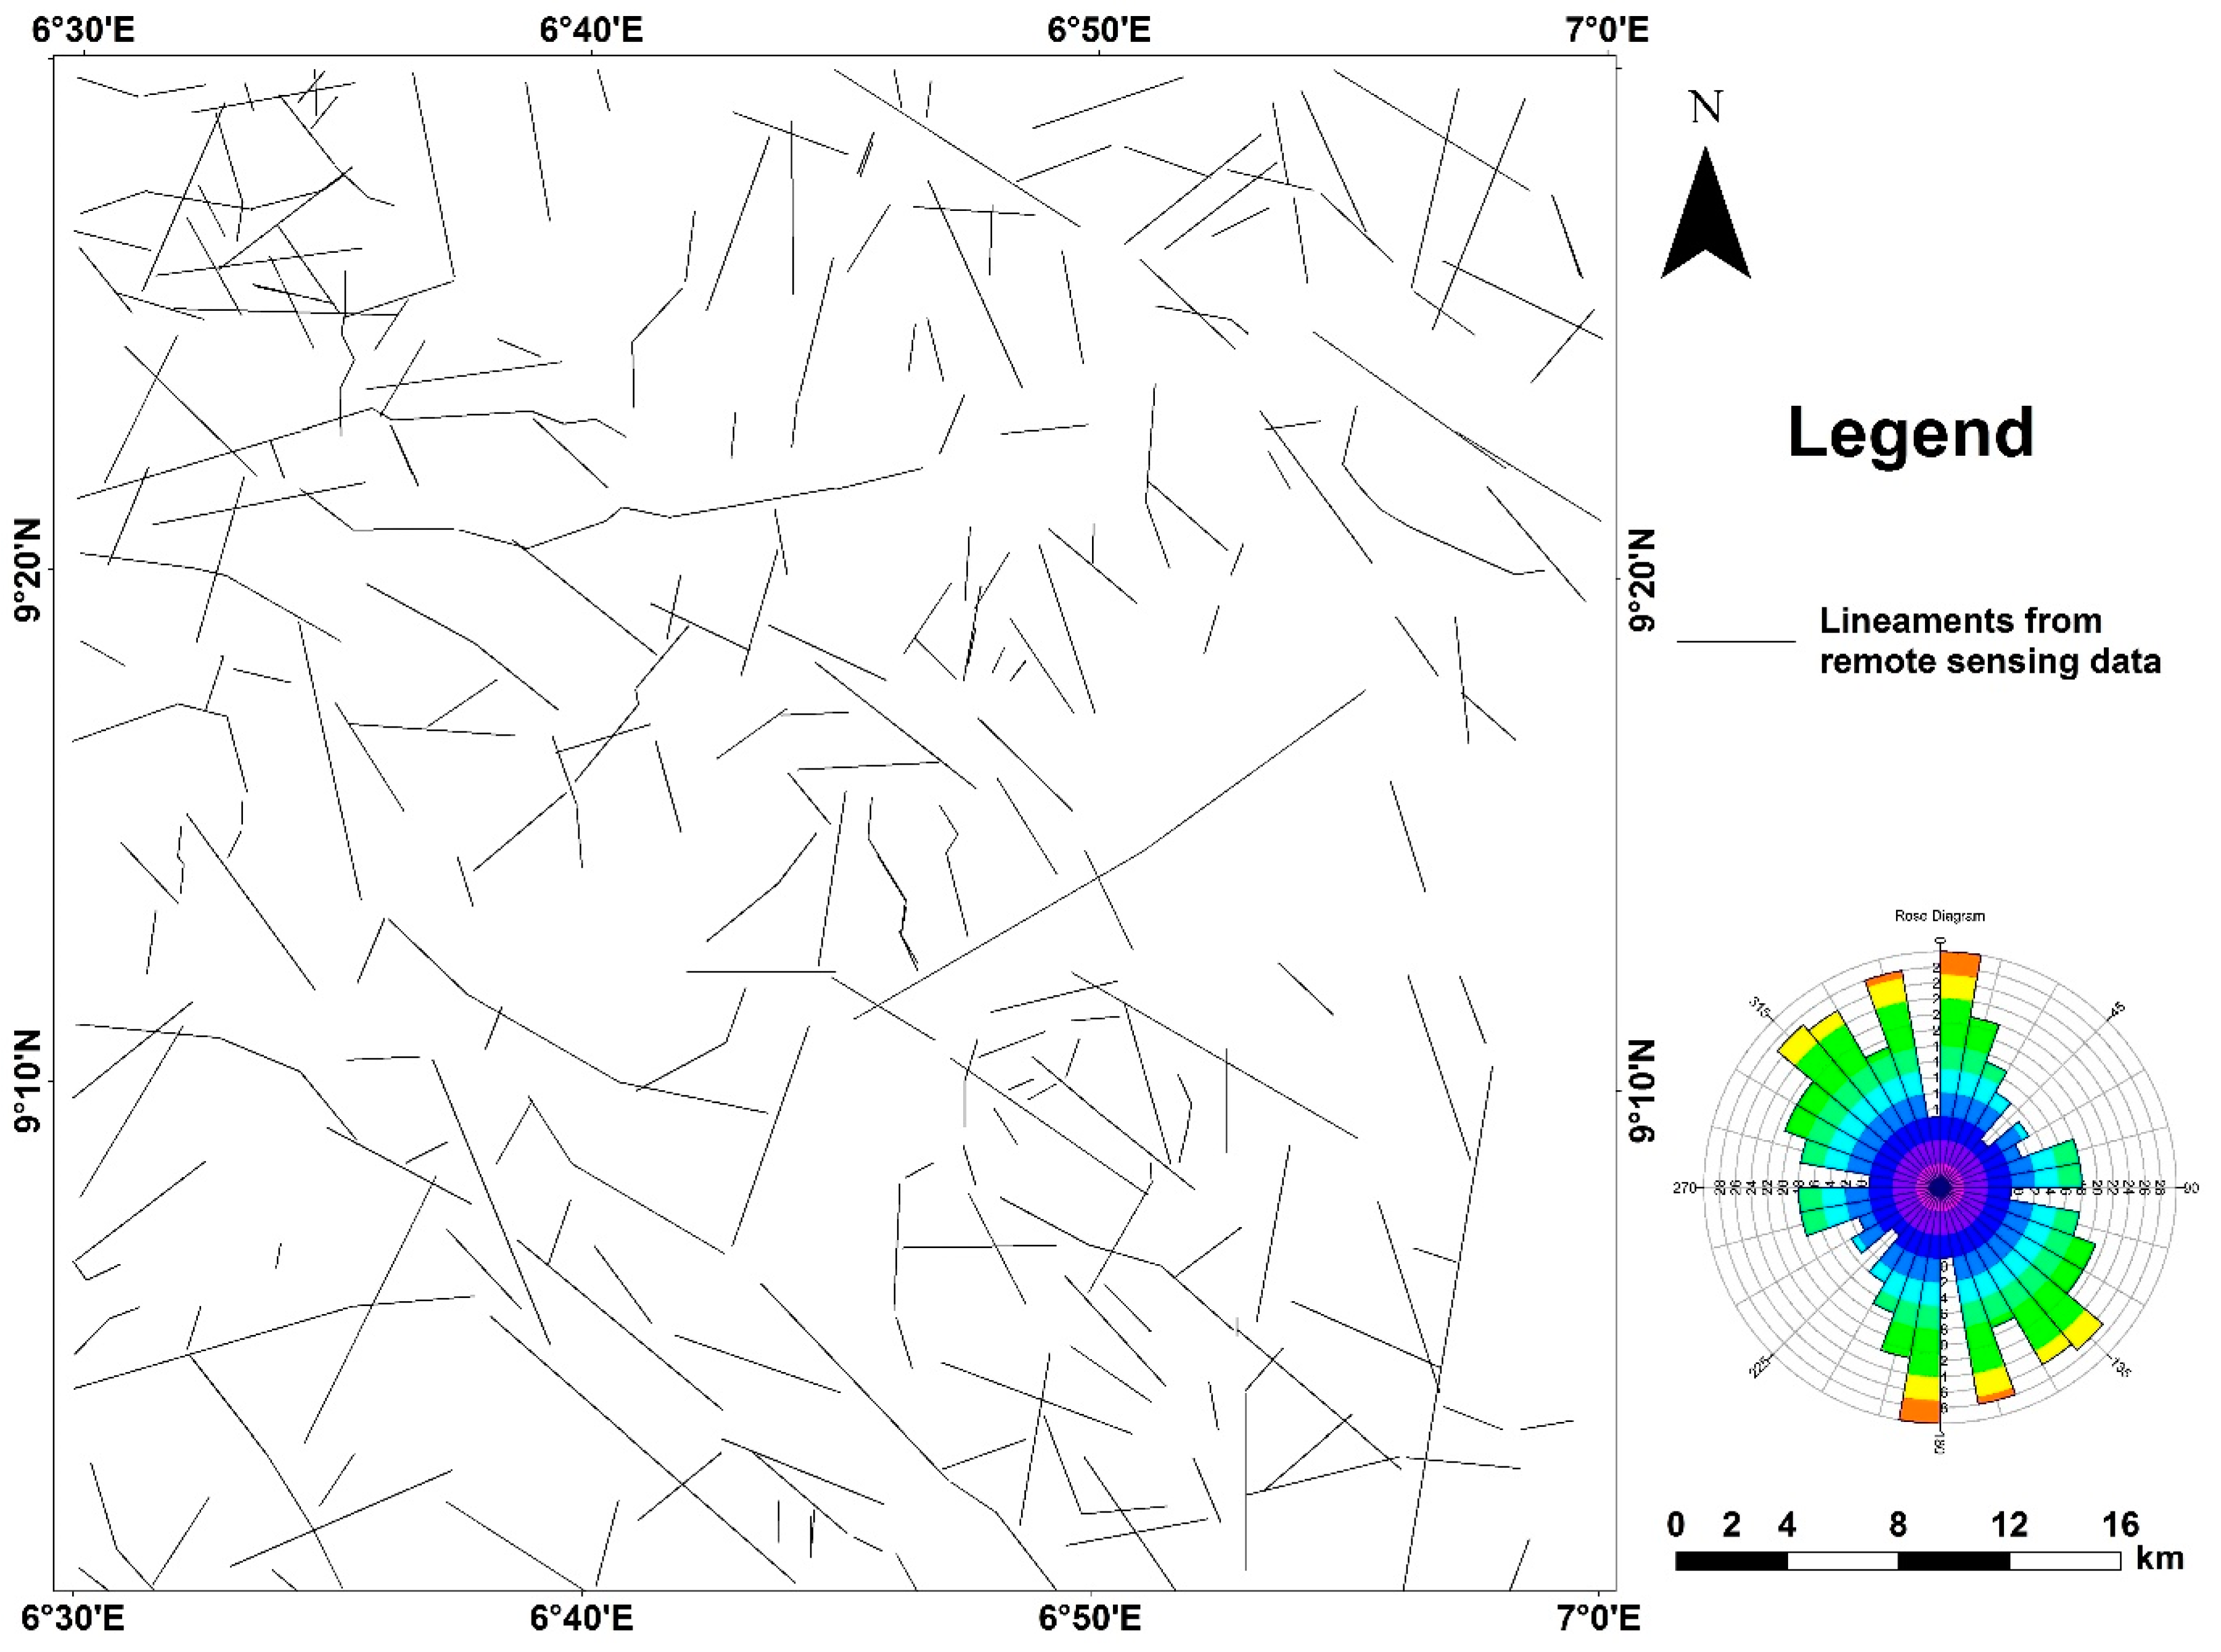
Lineaments extracted from remotely sensed imagery are oriented predominantly in the NW–SE and NE–SW directions (
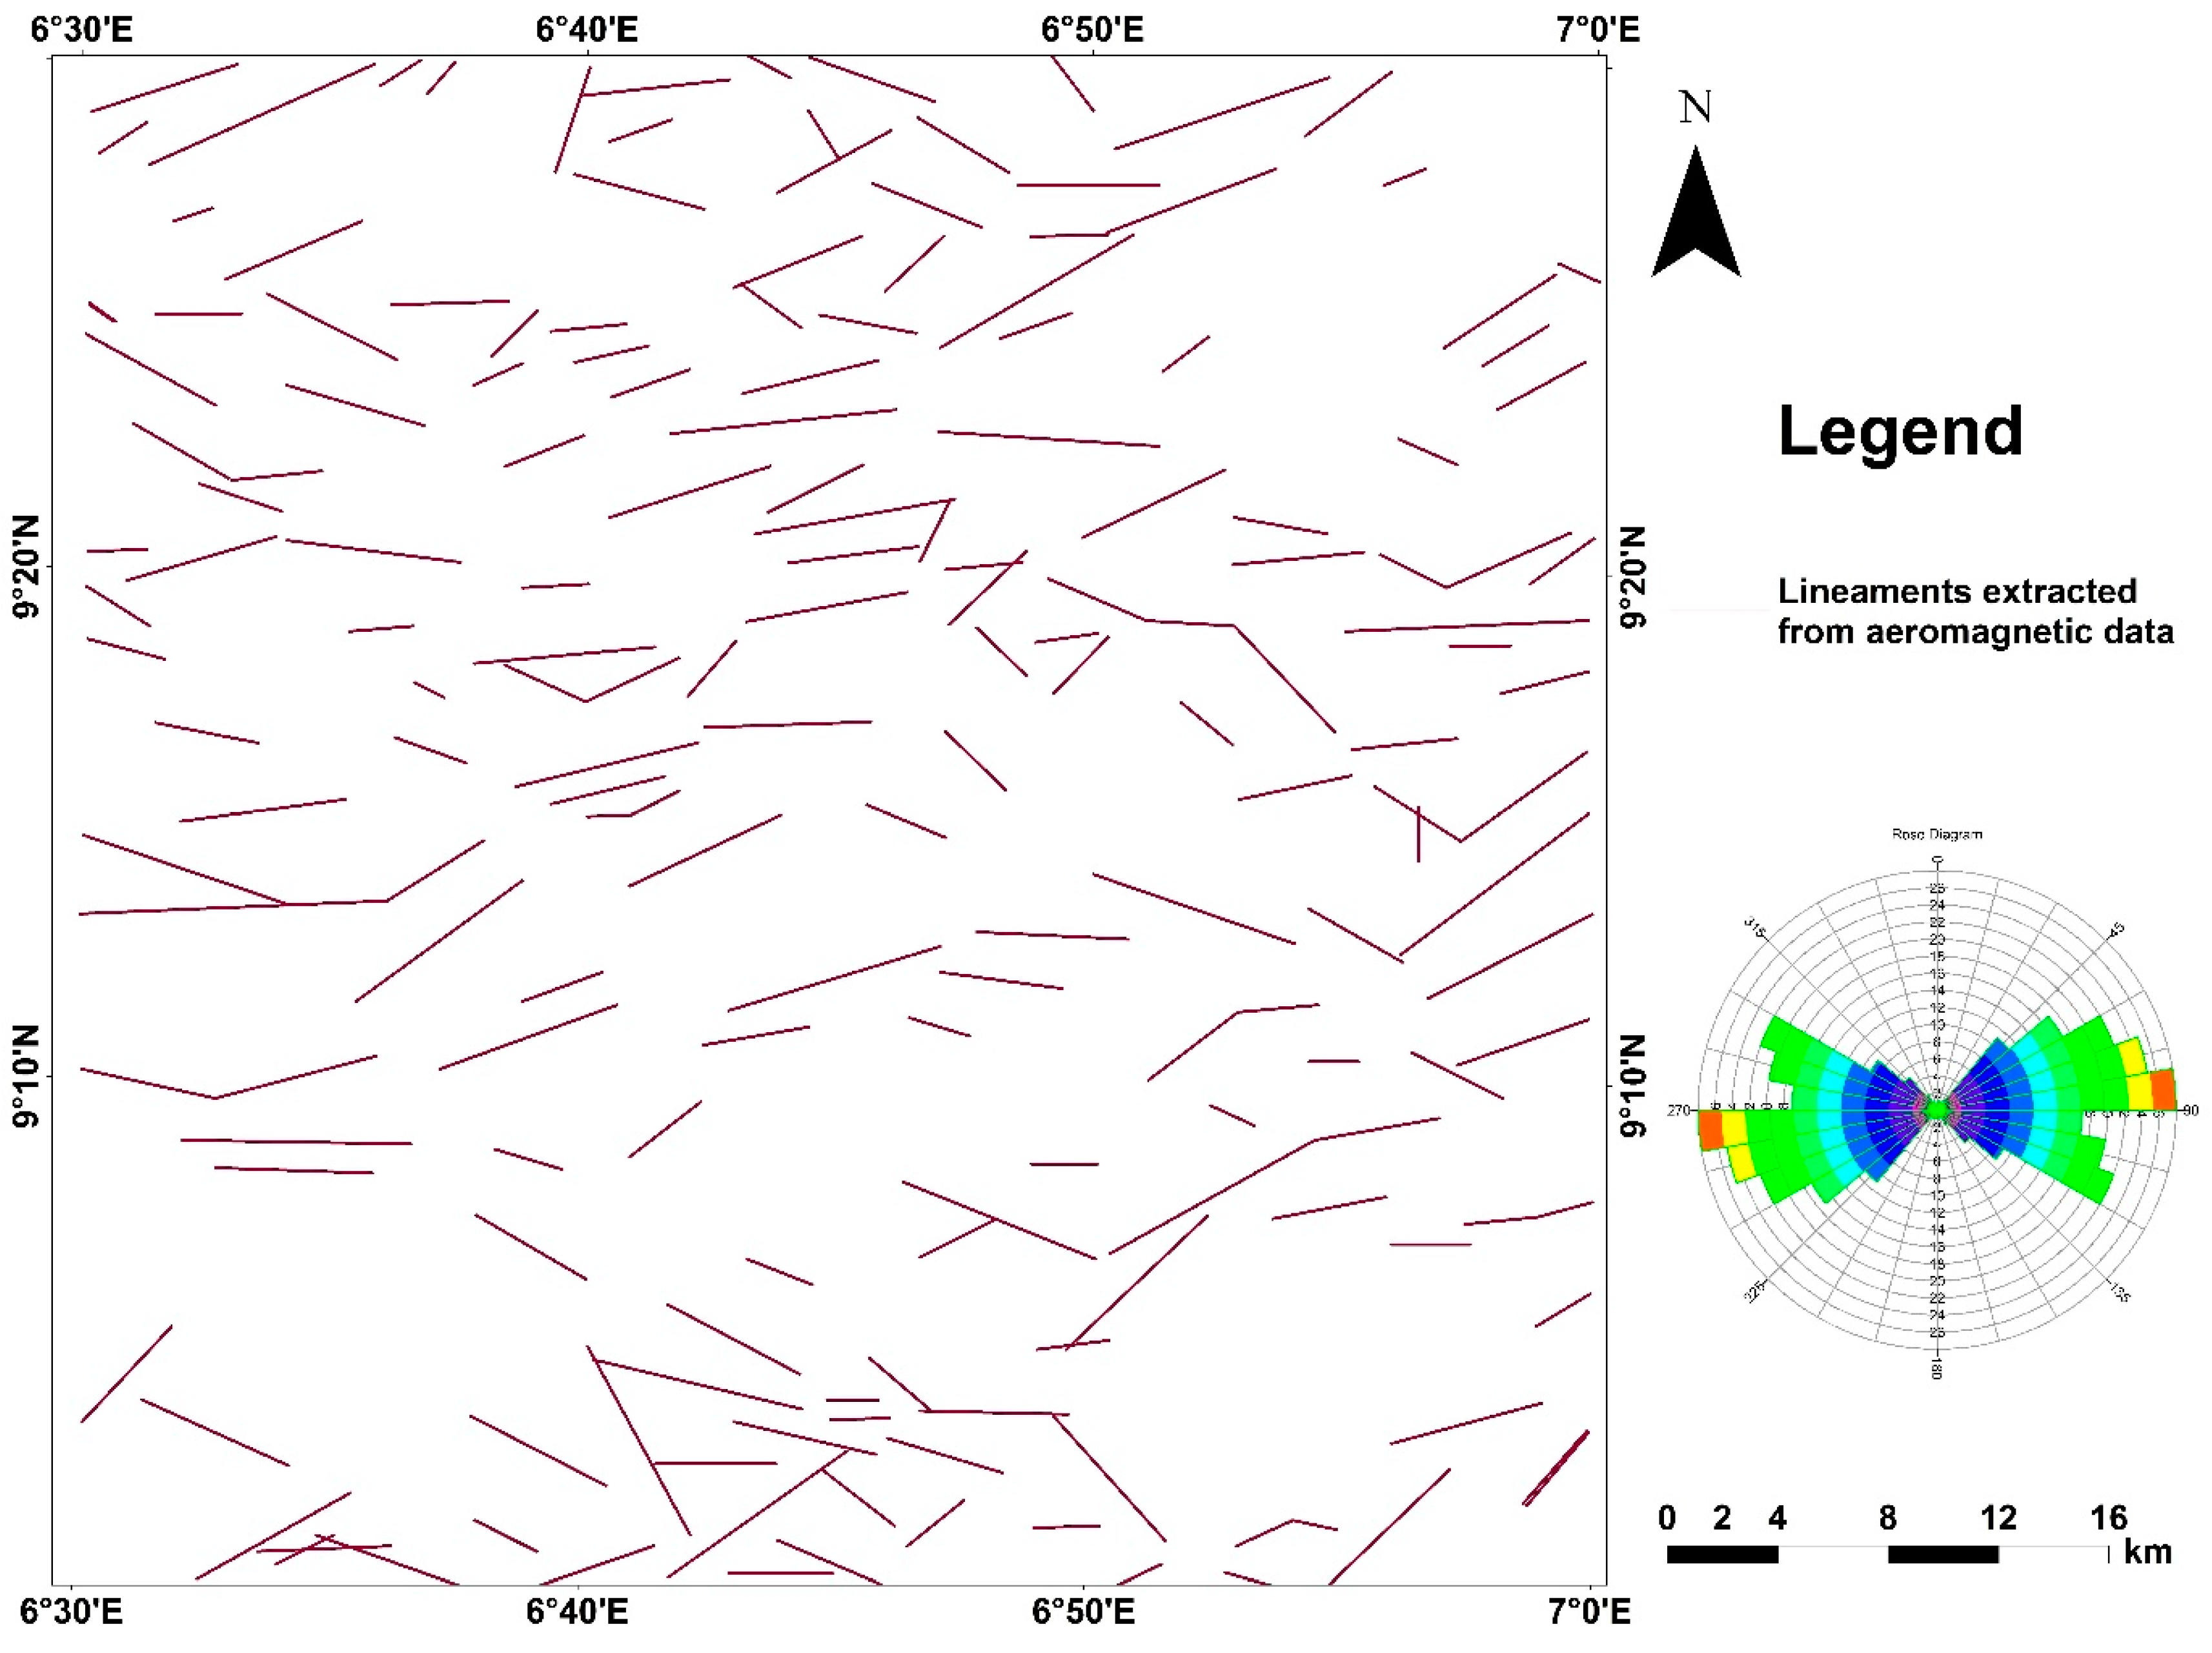
Figure 4). These lineament directions correlate well with joint directions mapped on the surface. In addition, these lineaments correspond to alignment of stream segments implying a form of structural control of the drainage system. Magnetic lineaments extracted from aeromagnetic data trend principally in the ENE–WSW and ESE–WNW directions (
Figure 5). These lineaments are attributable to deep-seated structures [
34] of the oldest fault/fractures formed during the initial tectonic processes of the region which exerted strong controls on the overall structural orientations. The NW–SE structures are related to structural fabrics of the Cretaceous Bida Basin, while the NE–SW trending structures are parallel to the Pan-African regional tectonics. This deformation event is closely related to the formation of the schist belts and mylonites in the region. [
35] have attributed NE–SW trend to the landward extension of the Chain and Romanche Fracture Zones from the Atlantic Ocean [
36].
It is clear that magnetic lineaments and remotely sensed lineaments have made different contributions towards groundwater availability in the area. Aeromagnetic data delineated lineaments likely to be deep fractures and intrusive bodies under thickly weathered zones. These areas are likely to be open groundwater conduits. The remotely sensed data delineated surface lineaments that most likely represent recharge areas.
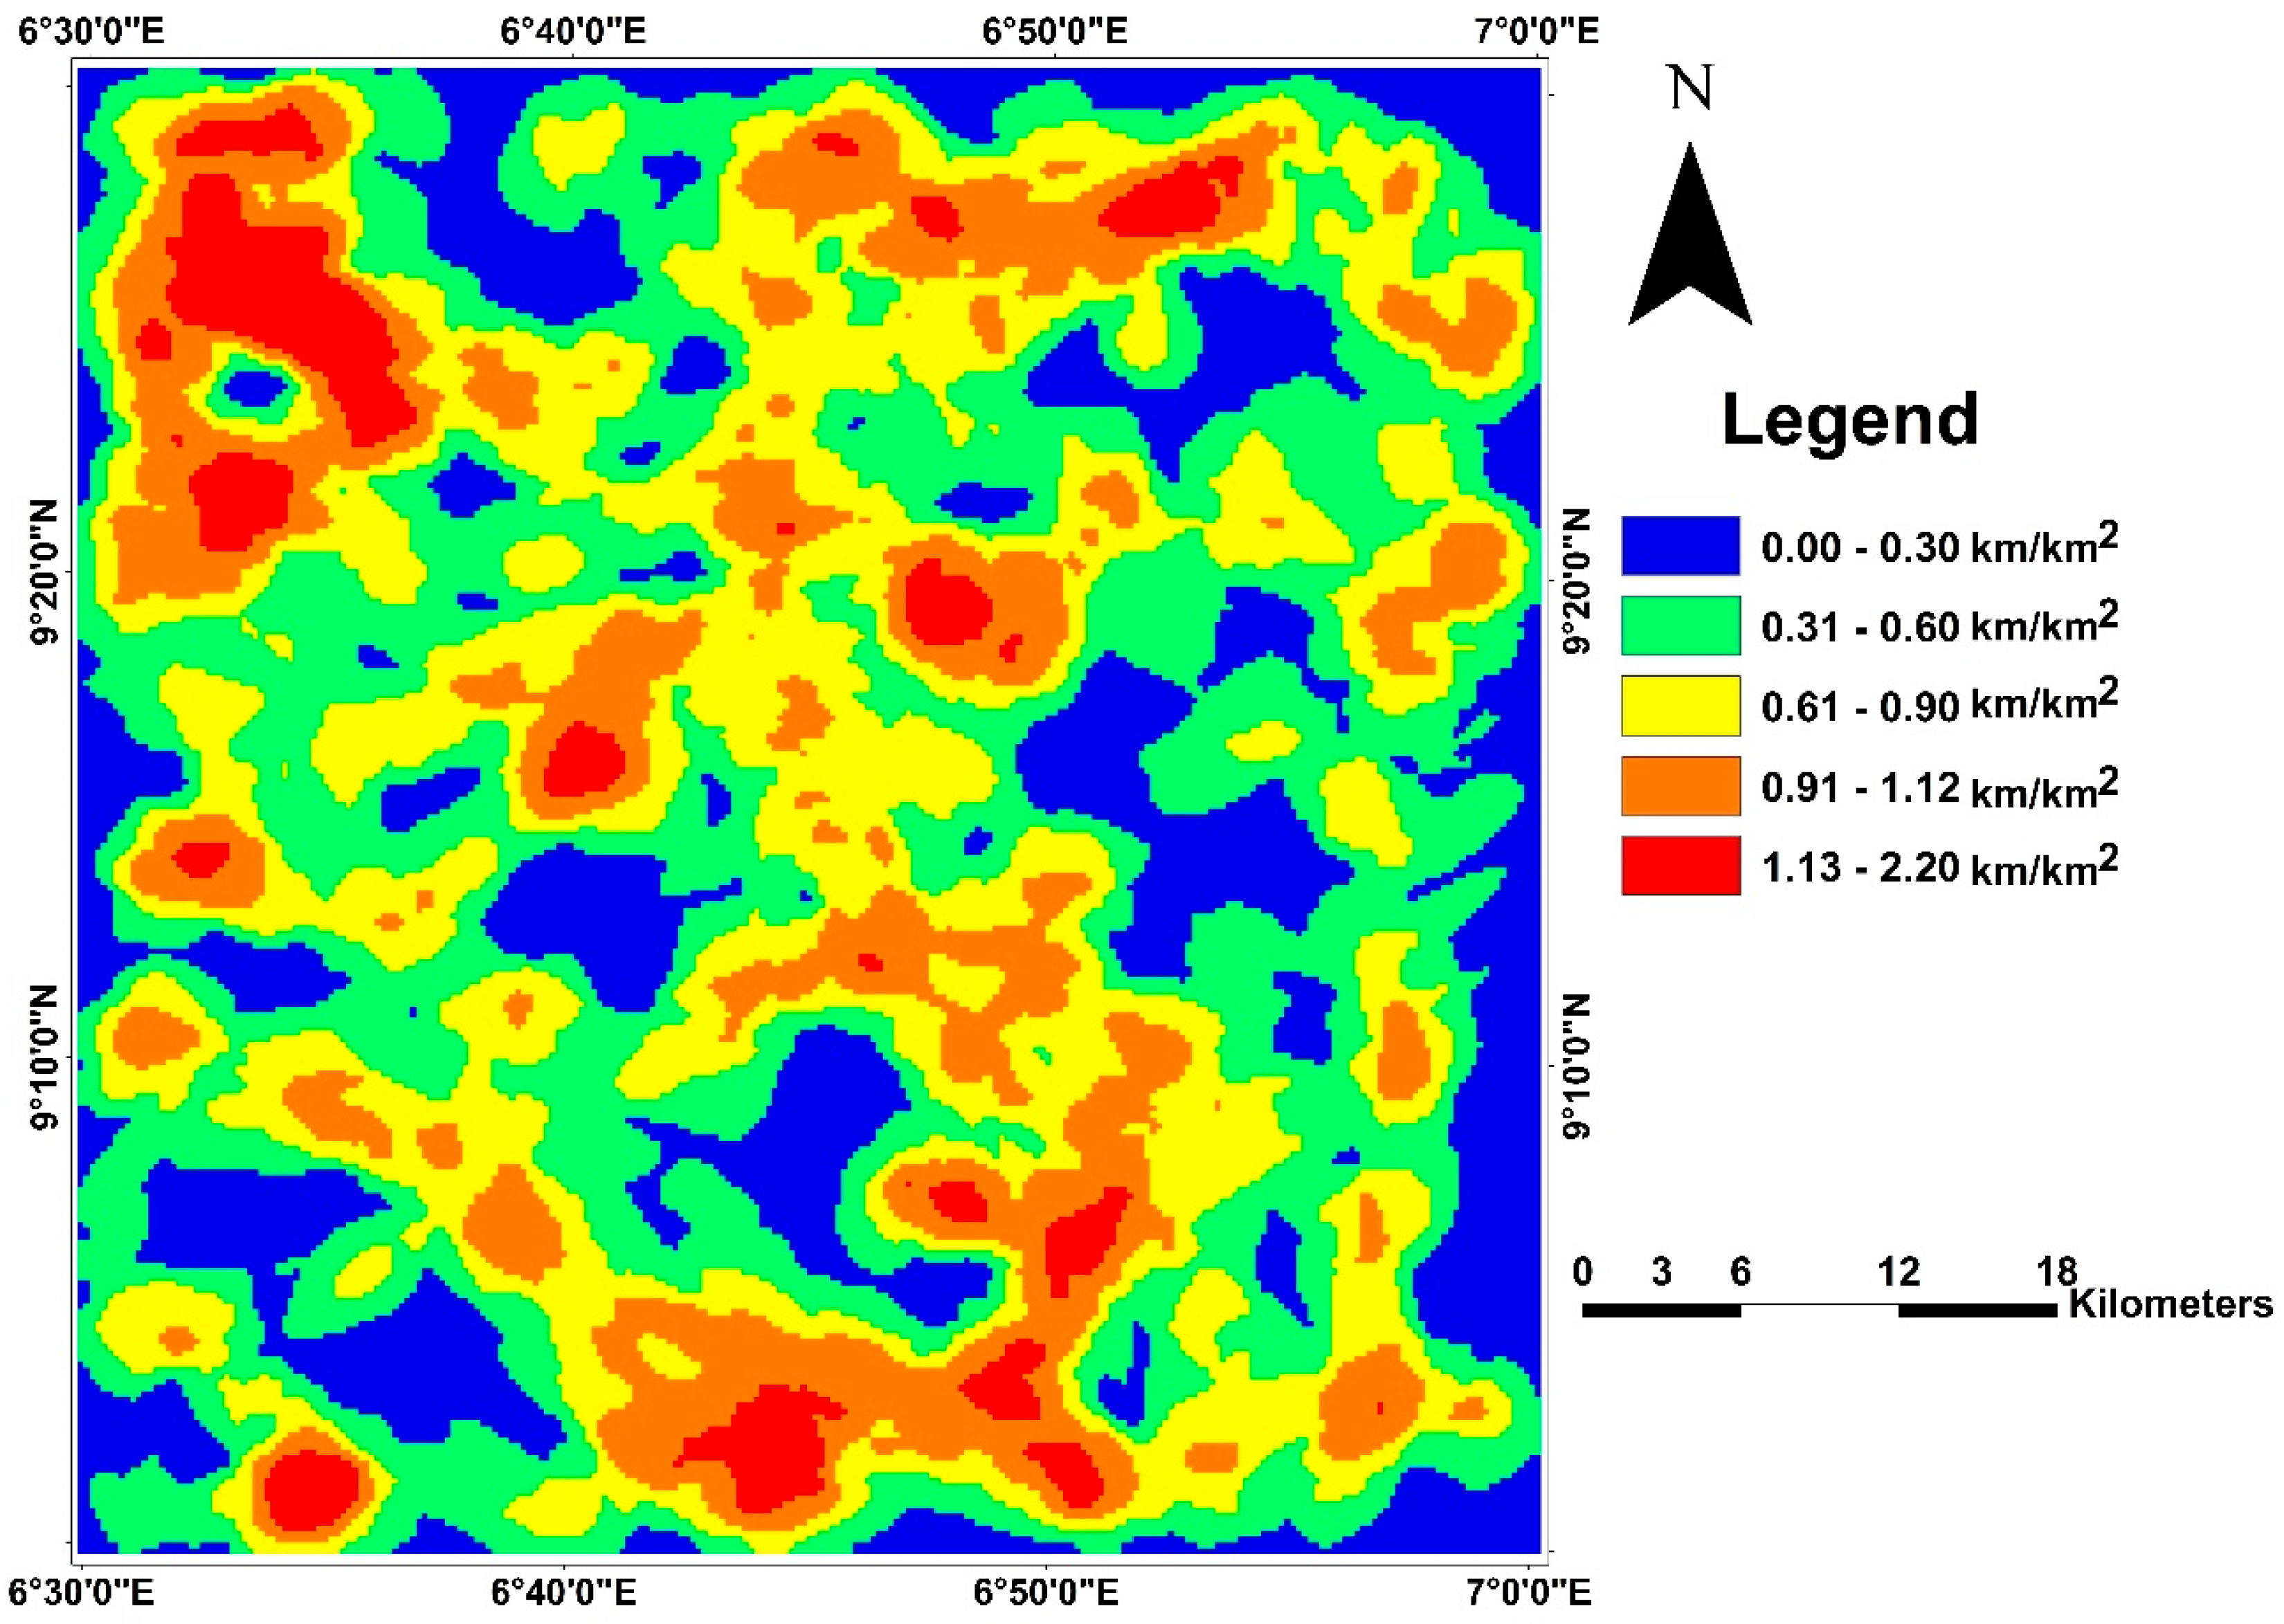
A composite of all extracted lineaments which was used to produce the composite lineament density map of the study area (
Figure 6) reveal that the northwestern portion of the map has the highest lineament density. This is due to the intersection of several lineaments oriented in different directions. Areas having high lineament densities are inferred to be fracture zones having high porosity and permeability which in turn have greater chance of accumulating groundwater.
3.4. Hydrogeological Model
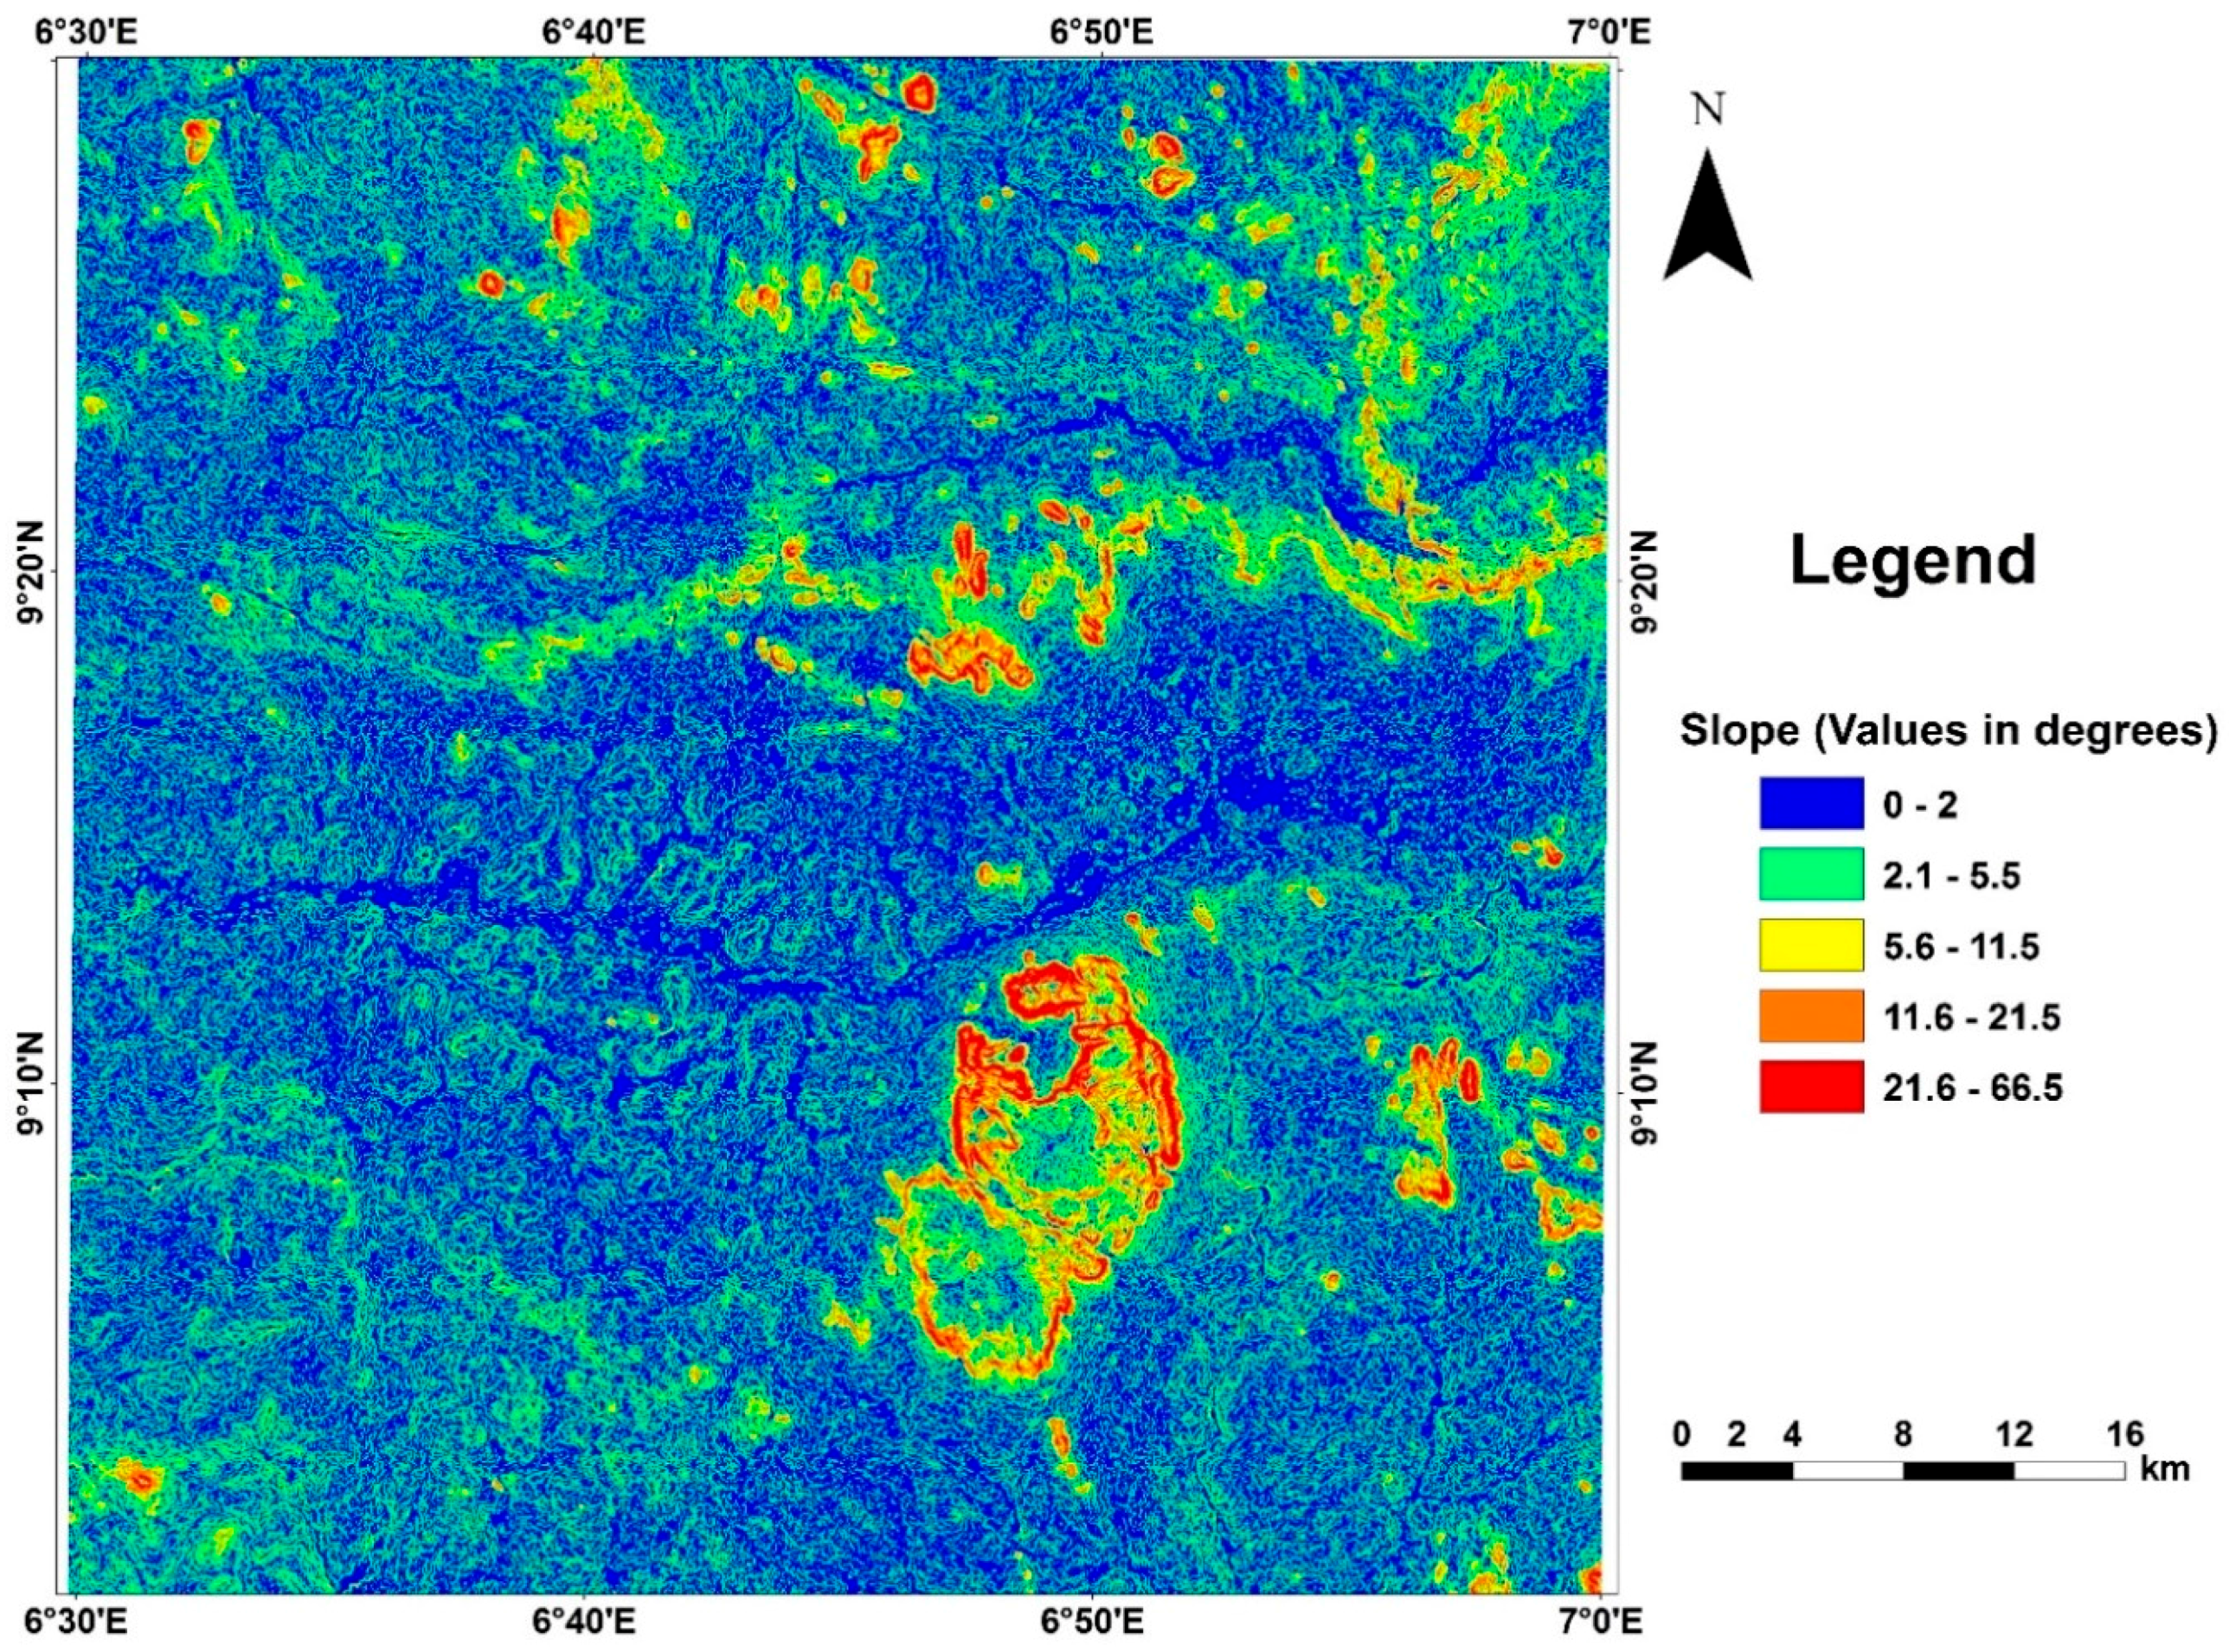
Geomorphology and slope of an area play important roles in recharge rates of aquifers, thus giving an indication of good groundwater prospect of an area. The wide range and distribution of slope values in the study area is typical of crystalline basement terrain, thus, a reason why groundwater potential varies significantly in basement complex terrains. In areas of low slope values, surface runoff is low, allowing more time for infiltration of rainwater, while high slope values enhance runoff and shorten residence times for infiltration and recharge. In reclassifying the slope angle thematic map (
Figure 7), low classes were assigned to higher slope angles because higher slope angles impact negatively on infiltration and groundwater recharge [
37].
Geomorphological units like peaks and ridges form inclined erosion surfaces that slope away from the highland fronts and are typically formed by running water. The bedrock in the passes may be exposed or thinly covered with alluvium and soils. In the alluvium, they represent different channels with alluvial deposits. The planes and channels are flat to gently sloping topographic features. These support percolation of rainwater and hence promote groundwater accumulation. Deep weathering of crystalline rock formations produce laterites during periods of quite tectonic activities. Some of the lateritic planes form isolated patches at the peaks of the crystalline rocks. The presence of ridges, peaks and other elevated areas, favor loss of water and hence, are not favorable for groundwater accumulation.
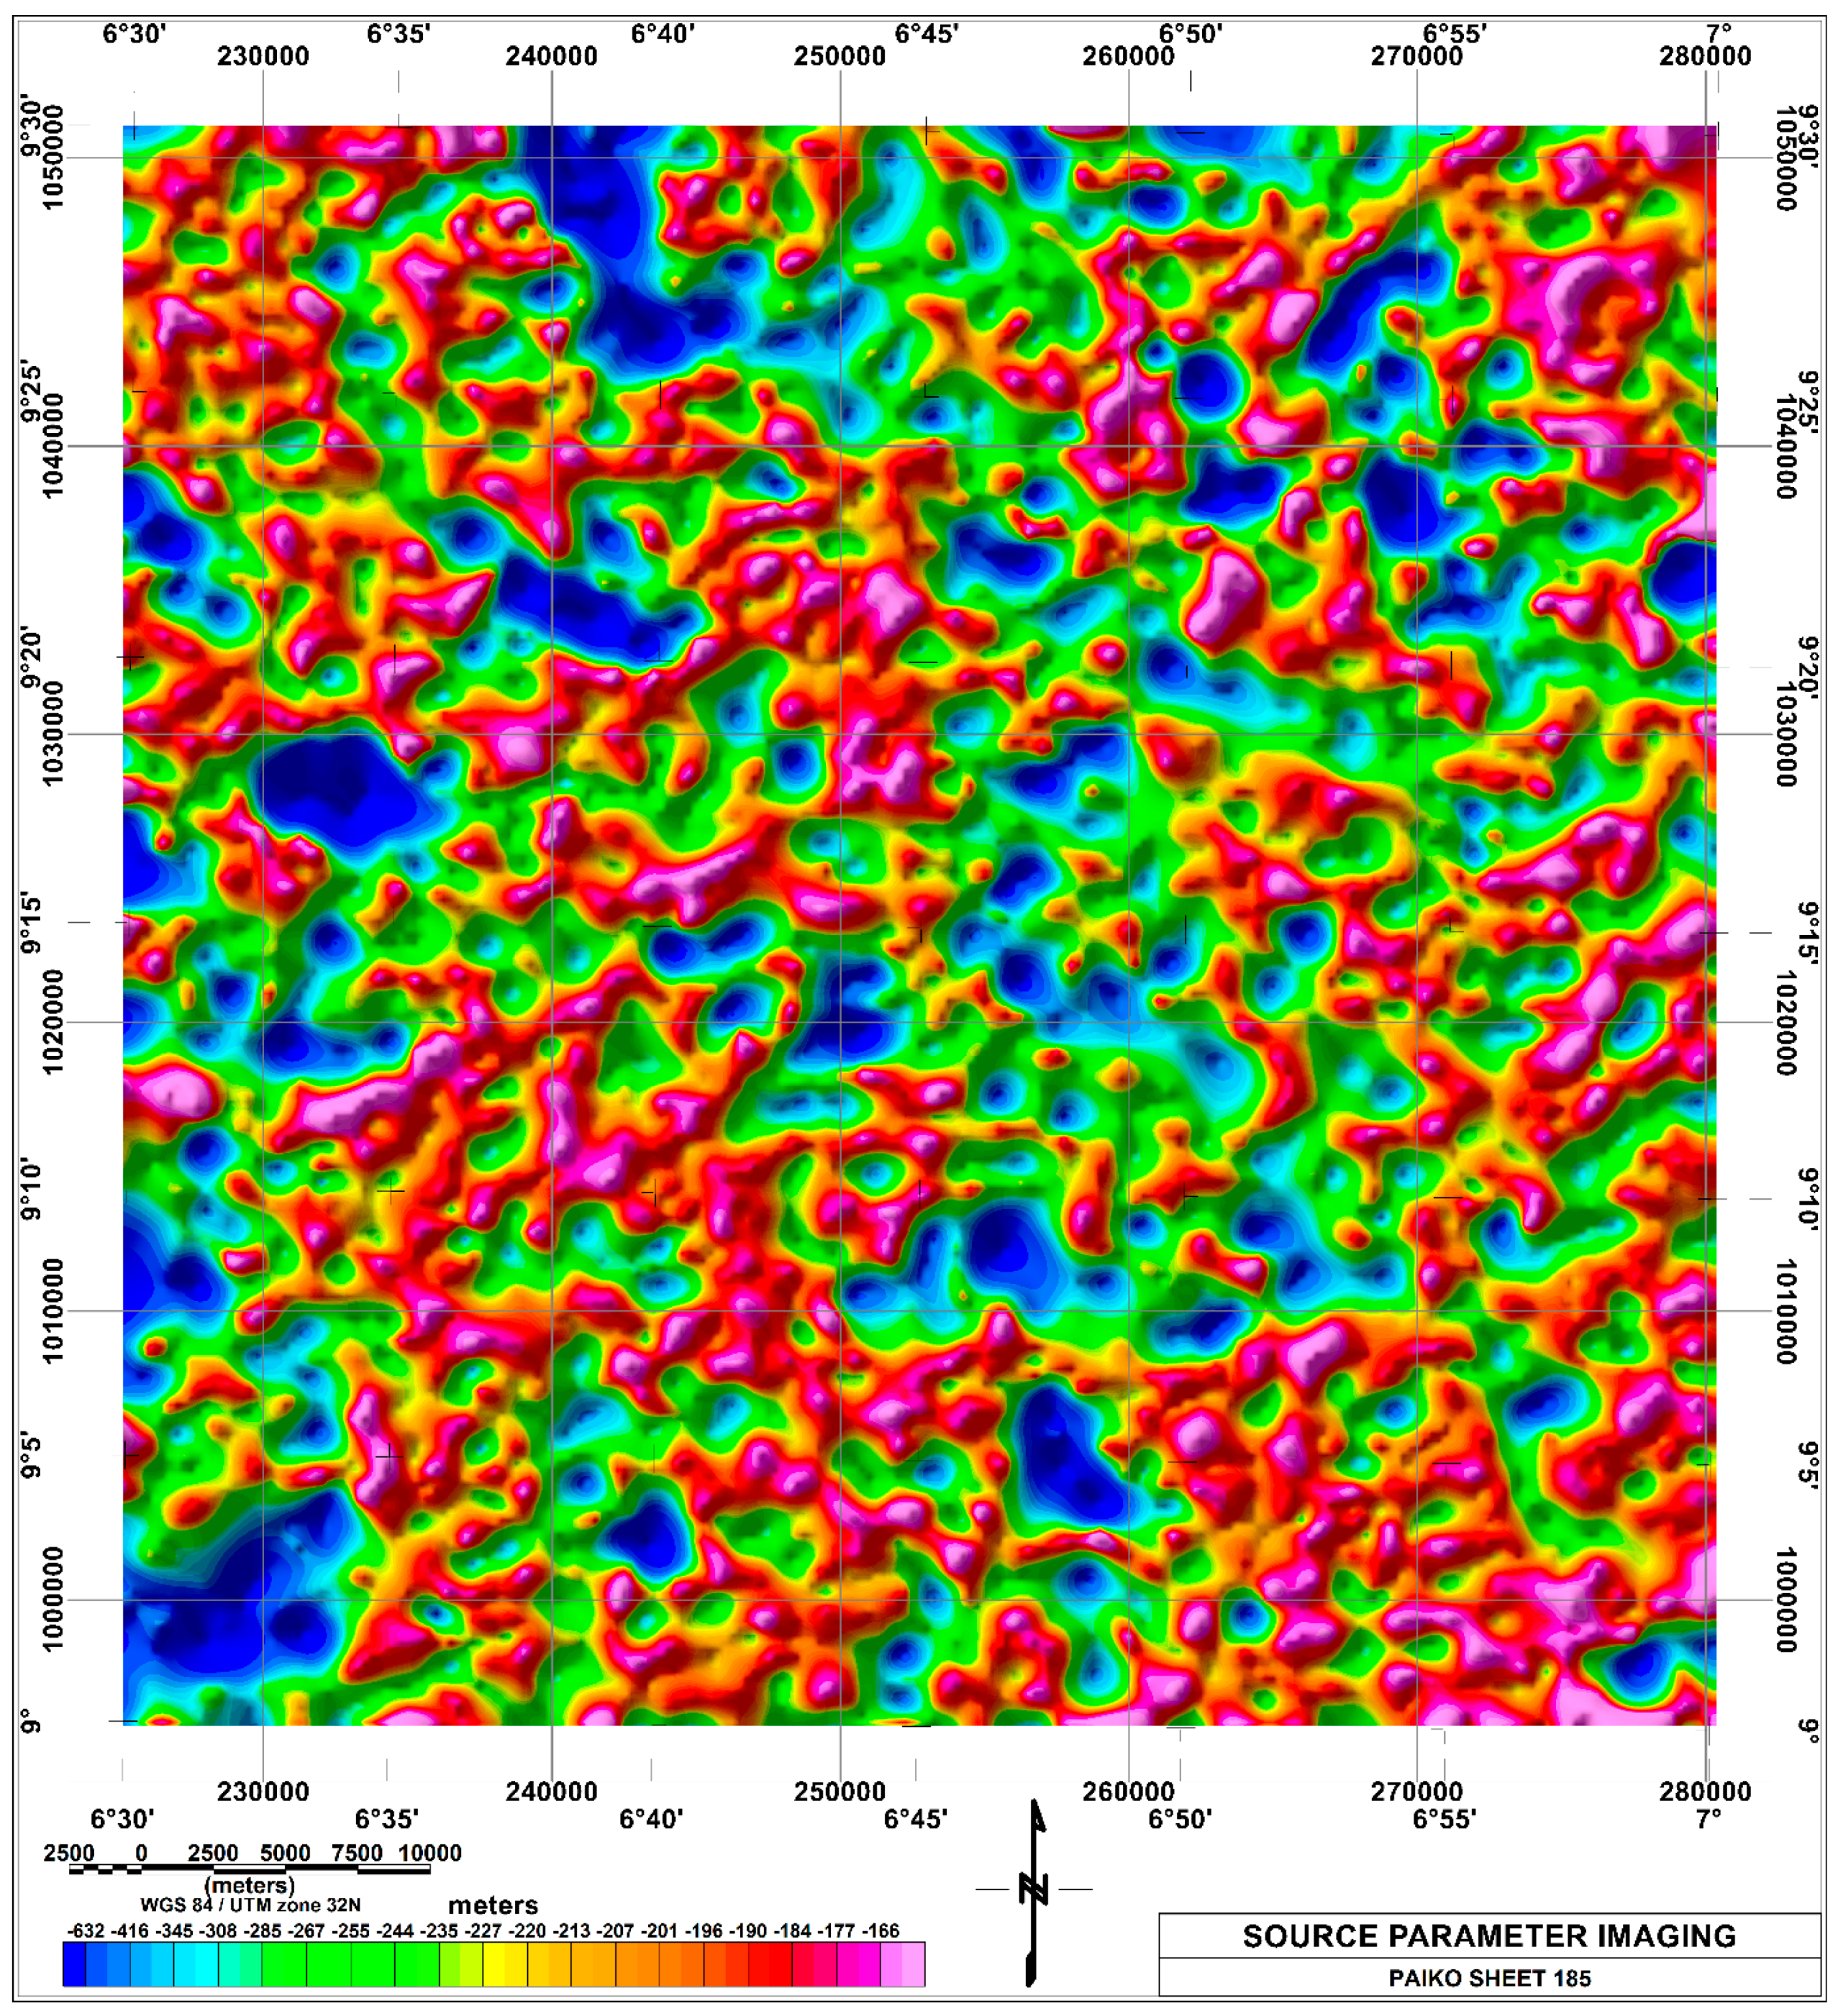
3.5. Depth Modelling Using Source Parameter Imaging (SPI)
The basis for using SPI to determine magnetic source depths is to create a database for every grid of 250 m cell size. SPI depth range from 100 m to 3000 m. It should be noted that only shallow depths of not greater than 150 m is considered adequate for groundwater development in this area. The depth of causative sources as interpreted from SPI map show that areas within the crystalline basement are shallower than areas within the sedimentary portion (
Figure 8). In places where shallow depths (magenta) were obtained within the sedimentary region may likely be intrusives. Since intersection of lineaments is an indication of fracturing, it is expected that these zones especially in the crystalline rock terrains should coincide with high lineament density (
Figure 6). These are promising sites for groundwater accumulation. Also, relatively deep sections within the crystalline basement are attributable to areas where deep weathering may have occurred as a result of high lineament density. These areas have considerable contribution to groundwater availability.
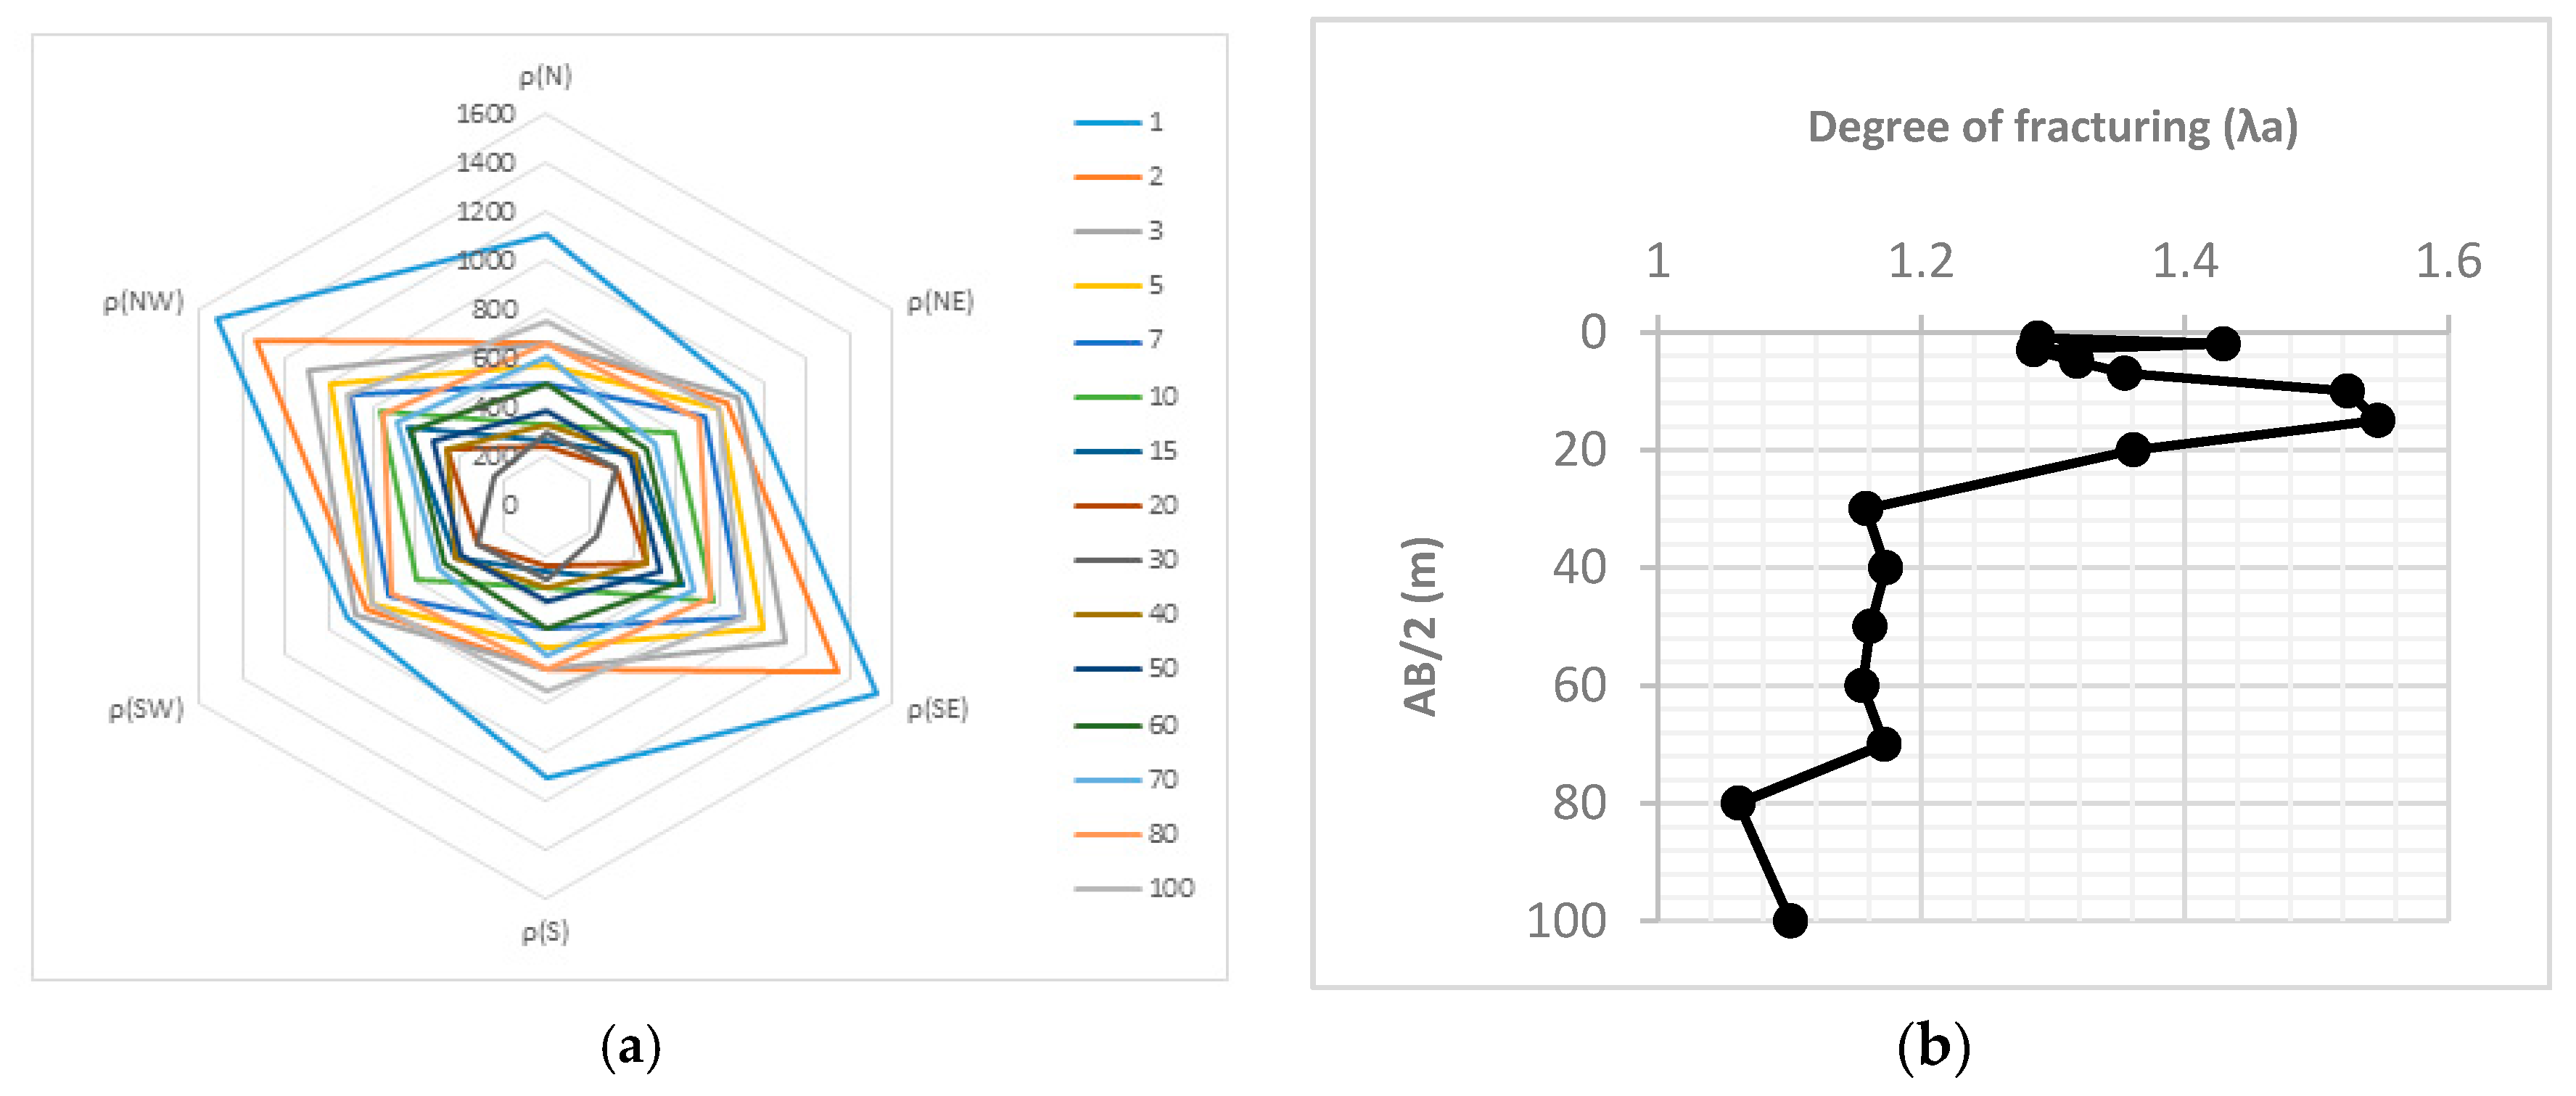
3.6. Description of Electrical Anisotropy Polar Diagrams and Coefficient of Anisotropy
The direction of electrical anisotropy lie predominantly in the NW–SE direction while others lie in the NE–SW and N–S directions (
Figure 9a). N–S orientations are predominant at shallow depths especially at the top soil layer. The coefficient of apparent anisotropy values (λ
a) against various depth equivalents to different AB/2 separations act as an aid to quantitatively understand the behavior of rock fracturing at various depths (
Figure 9b). Minor fracturing exists at depths of about 30 m in all sounding locations. Beyond this depth, there is a decrease in anisotropy values with depth. The decrease of anisotropy is an indication that fractures are closing up with increasing depth [
14].
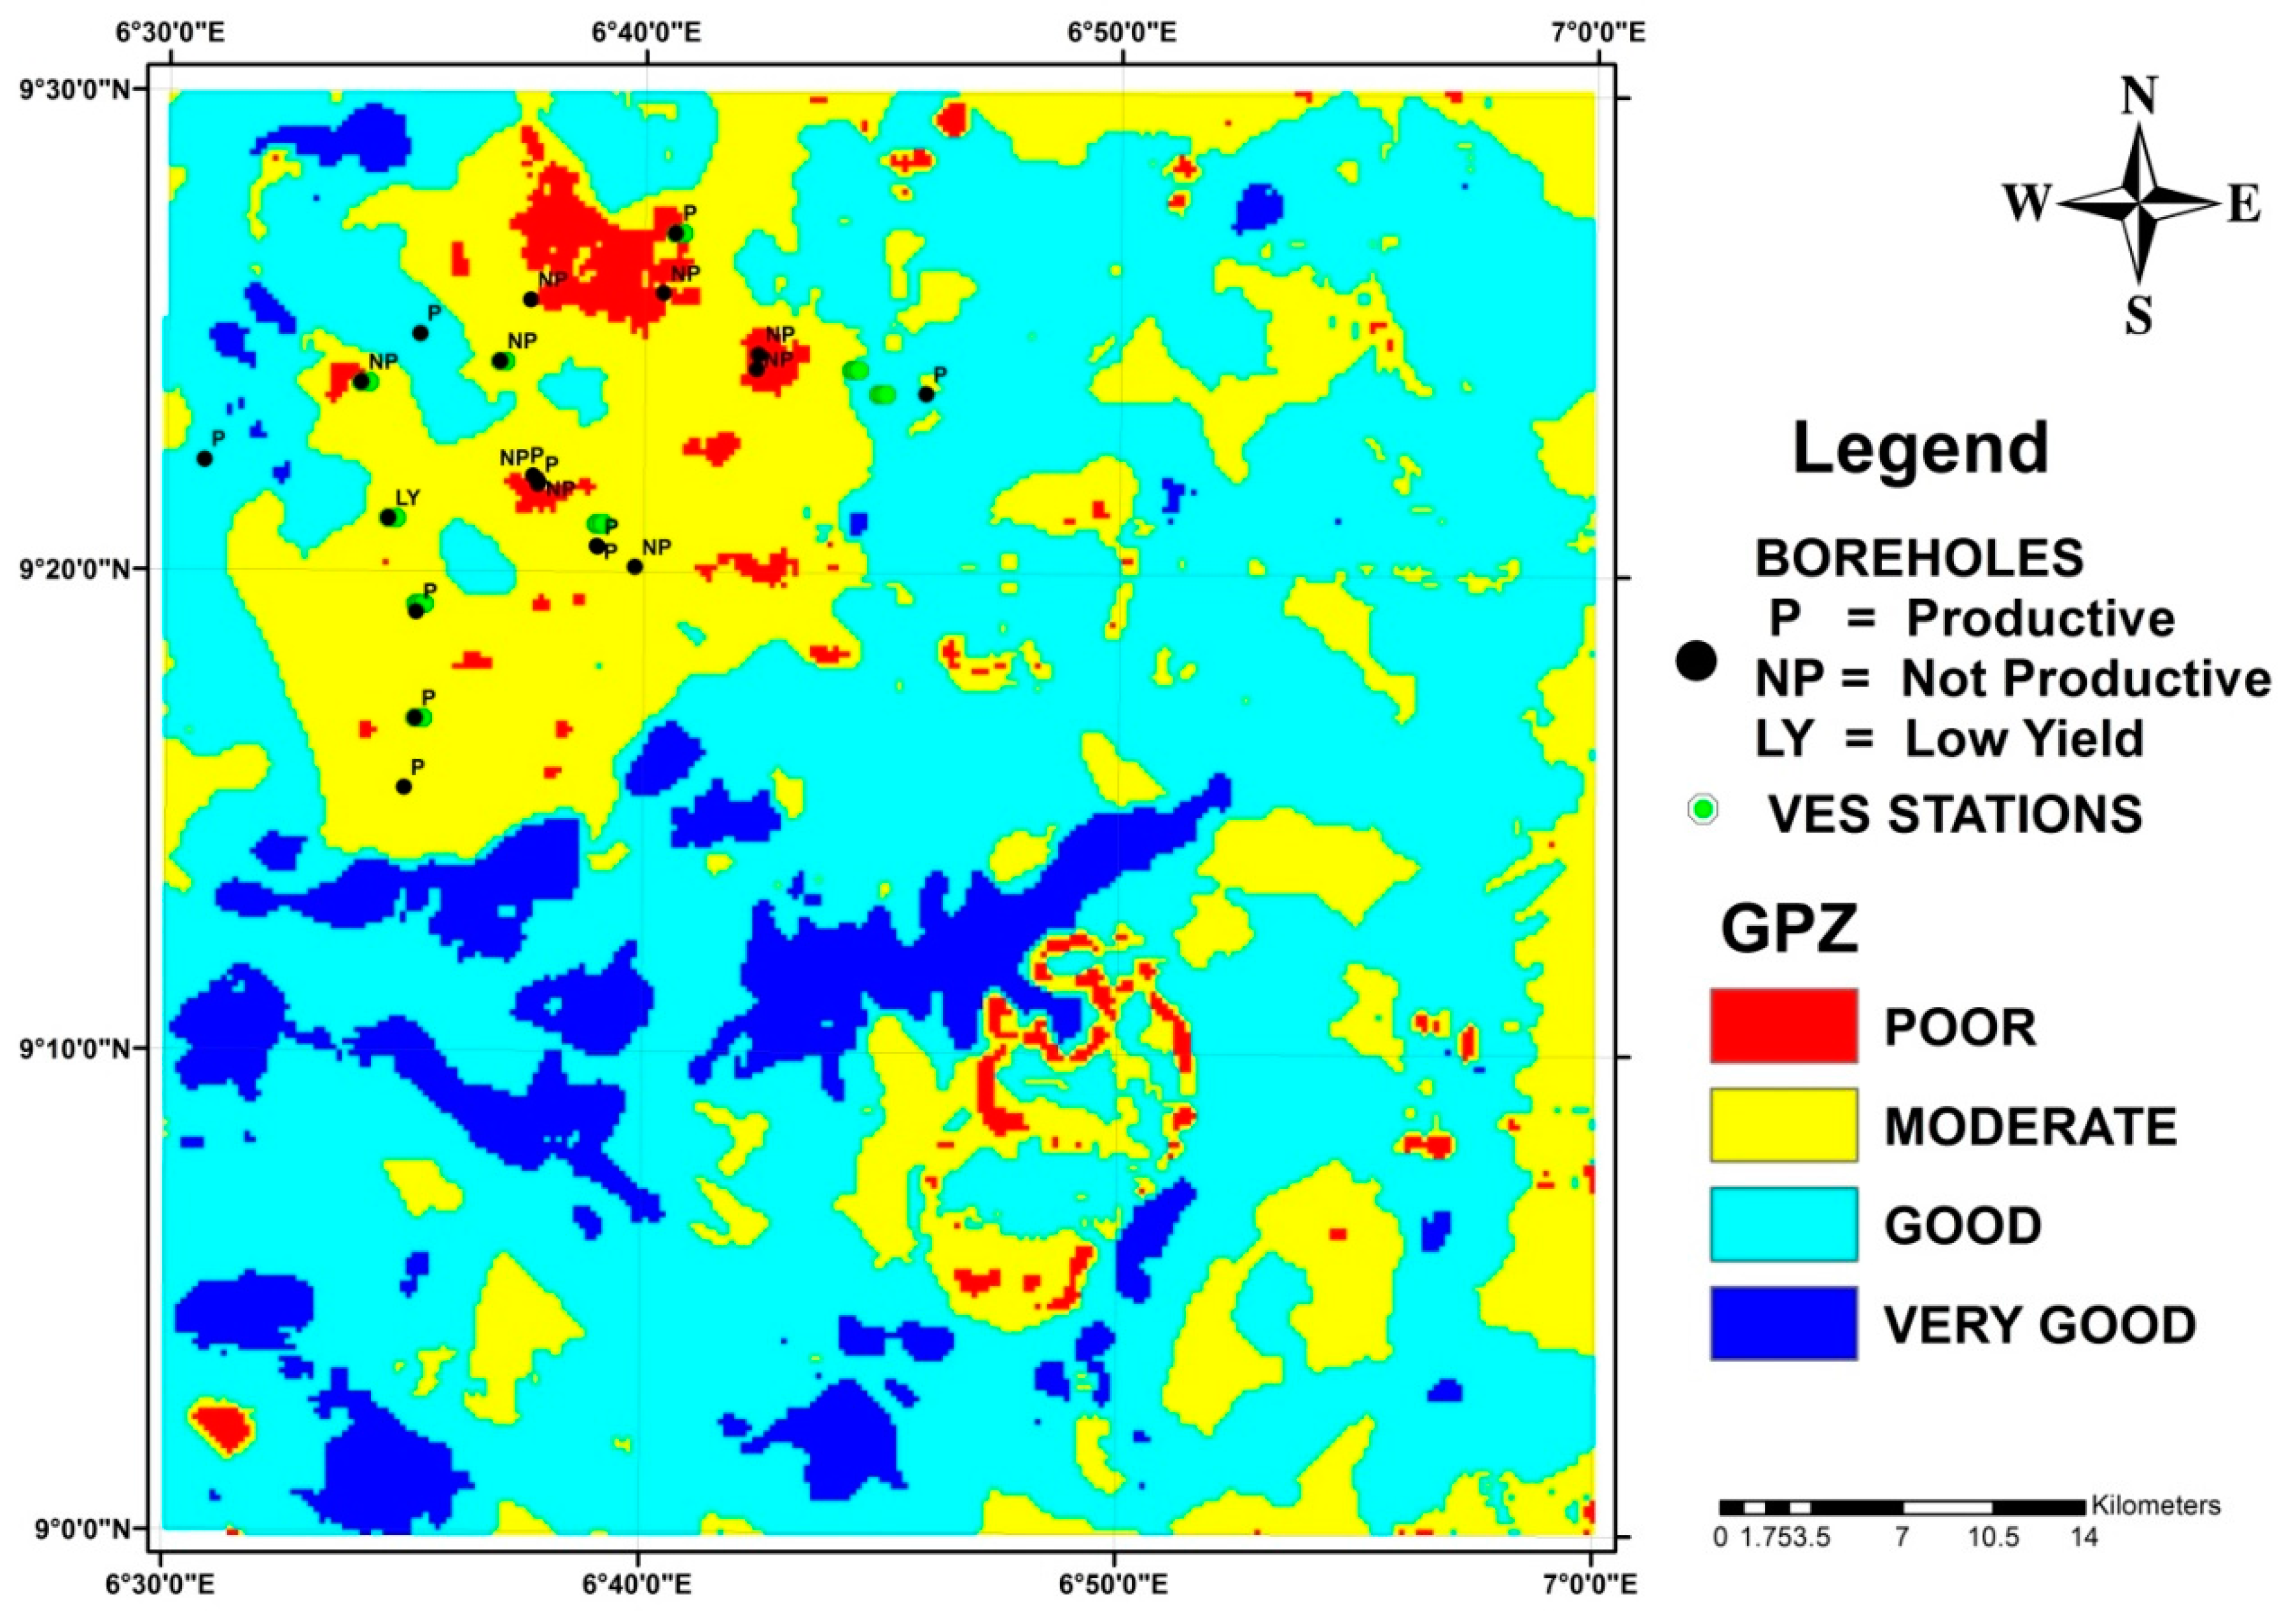
3.7. GIS Modeling
Four groundwater potential zones have been delineated (Very Good, Good, Moderate and Poor and Very poor). The spatial distribution of the various groundwater potential zones are shown in
Figure 10. Very good to good zones are spatially distributed in areas where the lithology are most appropriate to have primary porosities (sedimentary sequences in the southwest) or along major lineaments and drainage channels. This underscores the importance of lithology, lineaments and geomorphological units that favor groundwater accumulation in groundwater investigations. Areas with good to moderate groundwater prospectivity are attributed to favorable combinations of lithology and geomorphology. The poor categories of groundwater potential zones are spatially distributed mainly along ridges and peaks and to certain extent, zones with low lineament density. Foliated rocks such as migmatites and gneisses are classified as moderate groundwater potential zones. The alluvium that lies at the central portion of the map with the sedimentary rocks in southwest have very good to good groundwater potential. The most promising targets in the alluvium constitute areas with dense lineaments.
4. Discussion
Depths to groundwater level in hand-dug wells are often very shallow between 3 m and 10 m. Most of these are seasonal because water tapped in these wells are from shallow weathered residuum. The siting of certain boreholes most times is biased to proximity to settlements and good access for drilling rigs. This indicates that considerations are not given to the factors that affect groundwater availability such as the influence of the structural features and thickness of weathering. This can possibly explain the prevalence of low yields in boreholes as drill depths rarely exceed 60 m. Results of the RVES attest to the fact that pronounced fracturing does not occur at depths penetrated by drilled boreholes in the region, hence, the reason for most failed boreholes as drilled depths were not able to penetrate structures required for the accumulation of groundwater. However, an important contribution of the aeromagnetic data was in the delineation of structures beyond 100 m that could be hydrogeologically significant.
Linear structures such as fractures and shear zones that characterize the study area have different orientations. Present are the minor N–S fractures which are attributed to brittle deformation and the twin conjugate sets of NE–SW and NW–SE trends, produced by transcurrent movements [
38]. The age relationships of the conjugate fracture sets cannot be easily resolved from their relative dispositions on the map, but it has been established that NW–SE trending lineaments are analogous to the predominant trend of the Bida Basin [
35]. The structural framework of the Nigerian Basement Complex is dominated by the NE–SW lineaments [
35,
36]. The ENE–WSW orientation from the aeromagnetic data is from an ancient zone of weakness in the basement oriented in the E–W direction that got reactivated during the late Phanerozoic plate tectonic episode [
34]. Intersections of aeromagnetic and remote sensing lineaments with RVES structural orientations will aid accumulation and flow of groundwater. Relatively flat areas and thickly weathered zones in association with high lineament densities mapped using remote sensing and GIS characterize high groundwater potential zones.
Validation of the groundwater potential map was done on well data for selected drilled boreholes. Borehole yields range from 50 m
3/day to 100 m
3/day. On the average, yield of boreholes are poor. However, higher yields were found in boreholes drilled at places having intersection of fractures and deeply weathered residuum. Since thickly weathered crystalline rocks favor infiltration and storage of groundwater, their potential to yield higher amounts of water to boreholes are greatly enhanced especially when this occurs within fractured zones [
39]. These areas were clearly demarcated as good groundwater potential areas on the map. It is also pertinent to note that some low yield boreholes in areas otherwise marked good potential were due to boreholes penetrating only shallow weathered basement or not penetrating fractures at depth.
In the development of groundwater resources in places demarcated as good groundwater potential areas, mitigation efforts should be put in place so as to check possible water quality issues arising from contamination associated with mineralization in deep water wells in weathered igneous rocks. Although, this phenomenon is not unique only to deep water wells, further work should investigate the likelihood of its occurrence in the area.
In many areas, settlements are not densely populated and a large percentage of the inhabitants’ inability to afford motorized boreholes still make access to sustainable and potable water a challenge. Hence, it behoves on the government to either subsidise or take complete responsibility of the drilling projects. However, if these conditions are not met, the inhabitants have to settle for boreholes drilled at relatively shallow depths with the risk of having insufficient water supplies and possible groundwater contamination.
5. Conclusions
Lineament mapping was carried out using Landsat ETM+, SRTM DEM and aeromagnetic datasets by applying various digital image-processing techniques which included edge enhancement, shaded relief image representations. Aeromagnetic derivative maps were also utilised. Most of the lineaments were identified using greyscale, shaded relief, digitally processed color composite images and edge enhancement provided an effective way to detect most remote sensing lineaments. Vertical and tilt derivative maps of the aeromagnetic data were used to delineate magnetic lineaments. Comparison of rose diagrams of principal joint directions and regional lineaments trends show a high correlation with the major linear structures in the study area. High correlation exist between lineaments delineated from remote sensing and aeromagnetic data and fracture orientations mapped in the field and those derived from RVES survey. Where these features intersect may correspond to fracture zones. The accumulation and flow of groundwater is largely controlled by rock type, fractures and slope revealed from GIS analyses and field investigations. In granitic rocks, bedrock fractures and intense fracturing control groundwater flow and storage.
Utilizing GIS in groundwater exploration strategies is cost-effective and has many advantages over traditional approaches. However, to fully understand the hydrogeological nature of hard rock aquifers, surface lithologic and structural mapping are crucial. Optimum yields to drilled wells are obtainable in areas having deep weathering profiles in association with intense fracturing resulting mainly from intrusive bodies. Integration of different data layers in a GIS environment followed by spatial and statistical analysis of the data allowed to understand the correlation between different parameters and unravel the nature of hard rock aquifers. The groundwater potential model derived through integration of thematic maps demonstrates the hydrogeological significance of structure, lithology and landform types.
Expected advantages of this study will result in rapid selection of optimal sites, reduction in survey costs, improved borehole drilling success rates and subsequently, increased borehole yields. Furthermore, this integrated approach will help design suitable groundwater exploration plans in the future.


