Article

A New Degassing Model to Infer Magma Dynamics from Radioactive Disequilibria in Volcanic Plumes

1
Laboratoire Magmas et Volcans, CNRS, IRD, OPGC, Université Clermont Auvergne, F-63000 Clermont-Ferrand, France
2
Département de Géosciences, École Normale Supérieure, PSL Research University, 75005 Paris, France
3
Istituto Nazionale di Geofisica e Vulcanologia, Sezione di Catania, Osservatorio Etneo, 95125 Catania, Italy
4
Laboratoire de Météorologie Dynamique, CNRS-UMR8539, École Normale Supérieure, PSL Research University, 75005 Paris, France
5
Laboratoire de Géologie, CNRS-UMR8538, École Normale Supérieure, PSL Research University, 75005 Paris, France
*
Author to whom correspondence should be addressed.
Geosciences 2018, 8(1), 27; https://doi.org/10.3390/geosciences8010027
Submission received: 15 November 2017 / Revised: 11 January 2018 / Accepted: 14 January 2018 / Published: 18 January 2018

Abstract

:
Mount Etna volcano (Sicily, Italy) is the place where short-lived radioactive disequilibrium measurements in volcanic gases were initiated more than 40 years ago. Almost two decades after the last measurements in Mount Etna plume, we carried out in 2015 a new survey of 210Pb-210Bi-210Po radioactive disequilibria in gaseous emanations from the volcano. These new results [ ( 210 Po / 210 Pb ) = 42 and ( 210 Bi / 210 Pb ) = 7.5 ] are in fair agreement with those previously reported. Previously published degassing models fail to explain satisfactorily measured activity ratios. We present here a new degassing model, which accounts for 222Rn enrichment in volcanic gases and its subsequent decay into 210Pb within gas bubbles en route to the surface. Theoretical short-lived radioactive disequilibria in volcanic gases predicted by this new model differ from those produced by the former models and better match the values we measured in the plume during the 2015 campaign. A Monte Carlo-like simulation based on variable parameters characterising the degassing process (magma residence time in the degassing reservoir, gas transfer time, Rn-Pb-Bi-Po volatilities, magma volatile content) suggests that short-lived disequilibria in volcanic gases may be of use to infer both magma dynamics and degassing kinetics beneath Mount Etna, and in general at basaltic volcanoes. However, this simulation emphasizes the need for accurately determined input parameters in order to produce unambiguous results, allowing sharp characterisation of degassing processes.

1. Introduction

Many active basaltic open-conduit volcanoes emit a persistent gas plume, even during quiescence stages without eruptive activity at the surface. This behaviour provides evidence for ongoing magma degassing beneath volcanic centers. Degassing budgets at such active volcanoes may be inferred from both long time-series of SO2 flux measurements [1] and analysis of the sulfur content preserved in melt inclusions [2]. At subduction-zone-related volcanoes, the amount of degassing magma usually exceeds by one or several orders of magnitude the volume of lava actually erupting during the same period [3], which is notably the case of Mount Etna [4]. Moreover, the budget of magma entering the Mount Etna plumbing system, inferred from gravity changes and deformation data, matches the volume of degassing magma and exceeds by far the erupted lava volume [5]. It thus emphasizes the fact that degassing and actually erupted volumes of magma can be significantly unbalanced, a feature that is not observed at non-subduction-related volcanoes [3,6]. This feature also appears to depend on the eruptive style over a given temporal window [7]. At a volcano like Mount Etna (subduction-zone-related stratovolcano fed with volatile-rich-alkali basalts, e.g., [8]), it could be explained by a dynamic regime of magma redistribution beneath the volcano during which degassed magma is continuously removed by convection from the degassing reservoir and replaced by fresh undegassed magma [9,10,11].
This observation raises questions about the geometry and dynamic properties of degassing magma reservoirs, which remains poorly known and might have a strong control on eruptive activity [12,13]. For instance, high gas fluxes could be explained by the degassing of either large volumes of deep stagnant magma (>1 k m 3 stored at a few kilometres depth) or else small batches ( 10 5 10 6 m 3 ) of quickly overturned magma brought at shallow levels (hundreds of meter). It is thus of primary importance to set constraints on the characteristic timescales of both magma degassing and gas phase transfer from the degassing reservoir to the surface active craters.
The study of radioactive disequilibria in volcanic gases has proved relevant in constraining magmatic degassing dynamics [14,15]. This method focuses on the three last radionuclides of the 238U decay chain: 210Pb, 210Bi and 210Po (see Figure 1). Because they all have short half-lives (22 years, 5 days and 138 days, respectively), these isotopes are suitable to study recent fractionations (younger than two years based on 210Po half-life, the longest-lived 210Pb decay product) associated with pre-eruptive and syn-eruptive magmatic processes. Furthermore, lead, bismuth and polonium are strongly fractionated upon degassing (polonium being more volatile than bismuth, which is in turn more volatile than lead), which gives birth to large radioactive disequilibria between 210Pb-210Bi-210Po in the gas phase [14,16,17]. These properties have enabled radioactive disequilibrium measurements in volcanic plumes to be linked to degassing activity through the use of two models. Lambert et al. [14] first developed a static degassing model for which radionuclide exsolution takes place in a degassing cell containing a proportion μ of deep undegassed magma in radioactive equilibrium. They also considered the transfer time of radionuclides between the time of exsolution from the magma and the time of emission at the surface, as 210Bi (five days half-life) is short-lived enough to significantly decay during gas transfer towards the surface. This approach has been extensively used to characterise gaseous emissions at Mount Etna [14,18,19]. More recently, Gauthier et al. [15] proposed a dynamic degassing model for which radioactive disequilibria in the gas phase also depend on the magma residence time in the degassing reservoir because of continuous regeneration of highly volatile 210Po by decay of its less volatile parent (210Bi) within the reservoir. This latter model has been successfully applied to persistently degassing, open-conduit, basaltic volcanoes like Stromboli [15] or Ambrym [20]. At these two volcanoes, both the magma residence time in the degassing reservoir and the transfer time of the gas phase towards the surface were estimated and were shown to vary according to eruptive activity.
Almost two decades after the last radioactivity survey in Mount Etna gaseous emissions [19], we went back to Mount Etna in 2015 in order to investigate radioactive disequilibria in the plume. The new measurements presented in this paper have benefited from recent methodological and analytical improvements [21], and they are in fair agreement with previously published data ([19], and references therein). Based on the concept of the previous dynamic degassing model [15], a new theoretical framework for the degassing of radionuclides is presented here. We show that the very short-lived radon isotope 222Rn can be significantly enriched in the gas phase when magma residence time in the degassing reservoir increases. Although it has been neglected so far, mostly because of its short half-life of 3.8 days, we show that 222Rn plays a major role in controlling the magnitude of 210Pb-210Bi-210Po disequilibria by producing, through its radioactive decay, a new generation of 210Pb atoms within gas bubbles. By using a dataset of previously published values describing both trace element volatilities and volatile content in magmas from Etna, we present a Monte Carlo-like simulation that explains radioactive disequilibria measured in 2015 in Mount Etna gases well. Implications for the retrieval of quantitative information on degassing dynamics from radioactive disequilibria in a volcanic plume are presented at the end of the paper.

2. Short-Lived Radioactivity Measurements in Mount Etna Plume

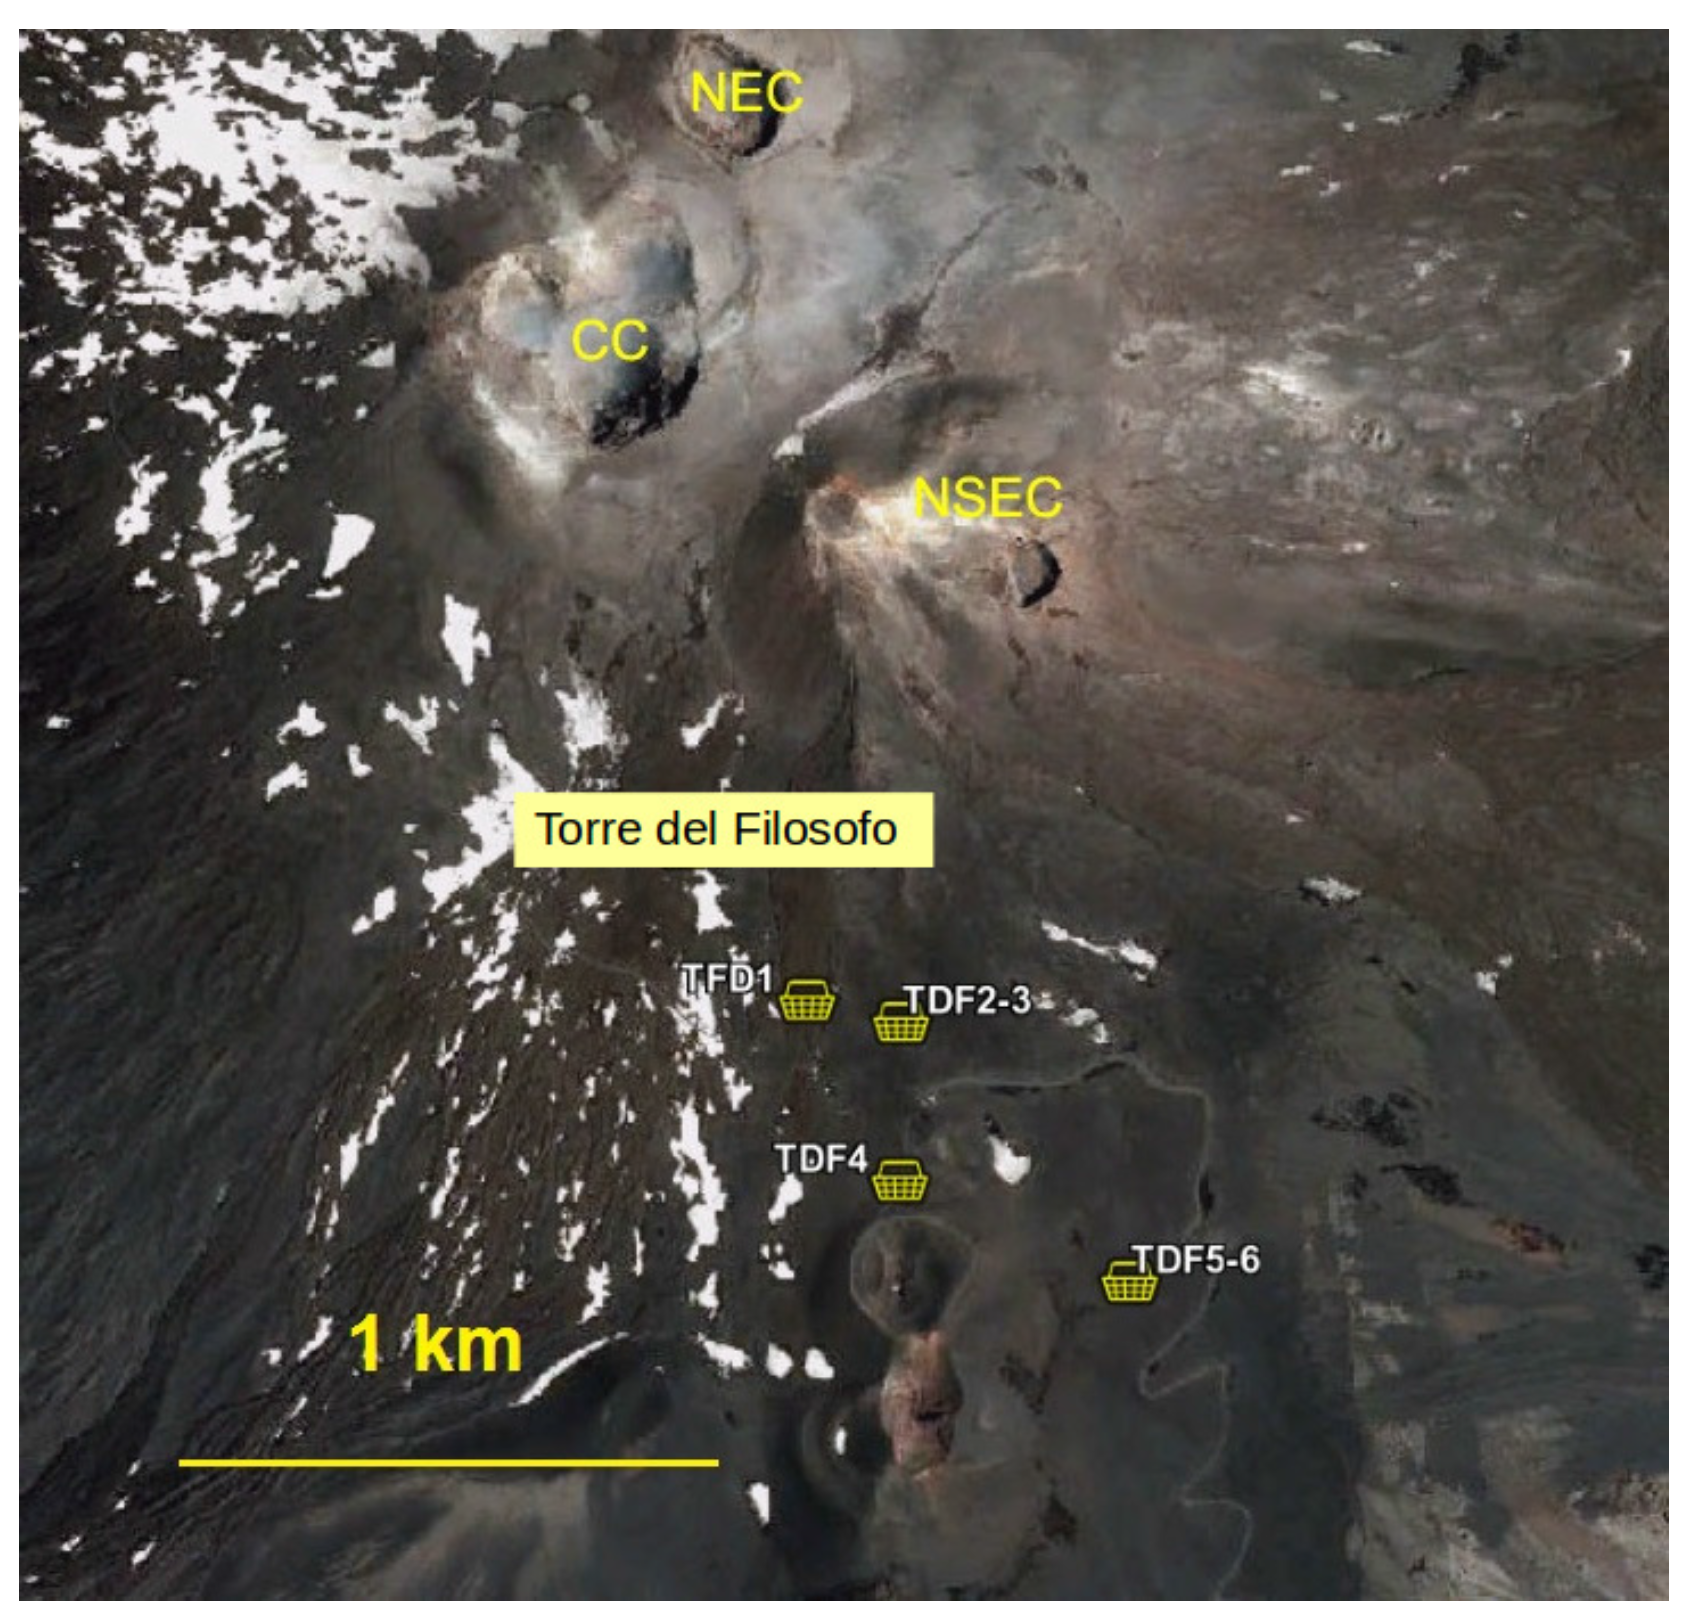
2.1. Field Description and Sampling Techniques

Mount Etna, one of the most active volcanoes worldwide, is an easily accessible volcano with a persistent degassing activity, making it a strong gas emitter. It has been the focus of many studies aiming at surveying short-lived disequilibria in volcanic gases [14,16,18,19,22,23]. During these two decades of regular survey at the end of the 20th century, the Mount Etna summit area was quite different than it is today. At that time, the volcano had only four summit craters (northeast Crater (NEC), Voragine (VOR), Bocca Nuova (BN) and the late-born southeast Crater (SEC); Figure 2). Since 2001, Mount Etna has erupted frequently, almost on a yearly basis, producing large lava flows and powerful paroxysmal events associated with lava fountaining episodes that significantly remodeled the summit area and ultimately gave birth to the New South-East Crater (NSEC, see Figure 2) [24]. In May 2015, we carried out a new survey of 210Pb-210Bi-210Po radioactive disequilibria in the volcanic plume. The field campaign took place during a brief, 5-day-long eruption at NSEC. After several days of tremor increase, eruptive activity started at NSEC on 12 May 2015 with loud explosions producing reddish to dark grey ash-rich plumes, followed by sustained strombolian activity at NSEC summit while a fissure opened on the eastern flank of the cone, emitting a lava flow that travelled towards and inside Valle del Bove. On 15 May, the intensity of the eruption gradually decreased until it reached an end on 16 May. The eruptive activity at NSEC during this short eruptive episode was too intense to grant safe access to the summit. We collected the diluted plume of Mount Etna downwind of the crater on the southern slope of the volcano, at remote sites near Torre del Filosofo (Figure 2). Samples collected at these locations were mostly from the main ash-rich gas plume emitted by the NSEC summit, although a minor contribution of the small gas plume released from the eruptive fissure cannot be ruled out.
The three investigated radionuclides are engaged in chemical compounds (mostly halides and sulfates) that are gaseous at magma temperature but are quenched into solid particles once in the cold atmosphere. They are consequently born in the aerosol fraction of the gas plume and can be easily sampled by filtration of the diluted plume through a membrane. For this study, we used high flowrate pumps (110 L/min) fed by a 12V-35Ah battery and connected to a home-designed polyvinyl chloride (PVC) filter-holder (exposition diameter of 50 mm) containing a single cellulose acetate filter (Poelmann–Schneider blue type, 0.2 μ m mean porosity). Sampling times ranged between 15 min and 1 h (corresponding to a volume of filtrated air in the range 1.7–6.6 m 3 , Table 1) to ensure that enough diluted plume passed through the filters so that radionuclide activities on filter samples can be analysed.

2.2. Analytical Techniques

Because 210Bi (5.01 days half-life) thoroughly decays away in about one month, filter samples were taken back to Laboratoire Magmas et Volcans in Clermont-Ferrand within a few days after collection. Untreated filters were analysed with a low-background noise alpha-beta counting unit (IN20 Canberra) following the procedure described in Gauthier et al. [21]. Repeated measurements were carried on over a month after collection in the field, each analytical cycle lasting 48 h (one cycle comprises eight 6-hour-long counting blocks that are ultimately averaged, the mean activity being considered as the “instantaneous” activity at the time t i + 24 h, where t i is the starting date and time of a given cycle). Both alpha and beta activities were simultaneously determined on filter samples. Alpha counts provide a direct measure of 210Po activity while beta counts correspond to the detection of 210Bi beta decay particles. Beta emissions of 210Pb cannot be directly measured because of their energies that are too low, so that 210Pb is measured via 210Bi one month after sampling when both isotopes have reached radioactive equilibrium [21]. Radionuclide activities on filter samples were determined by subtracting the detector background (electronic noise and some unblocked cosmic rays) and by taking into account the detector efficiency and an attenuation factor for alpha particles [25]. Initial activities at the time of sampling were then retrieved by fitting radioactive decay trend during the one-month period of analysis by using classical radioactivity laws.

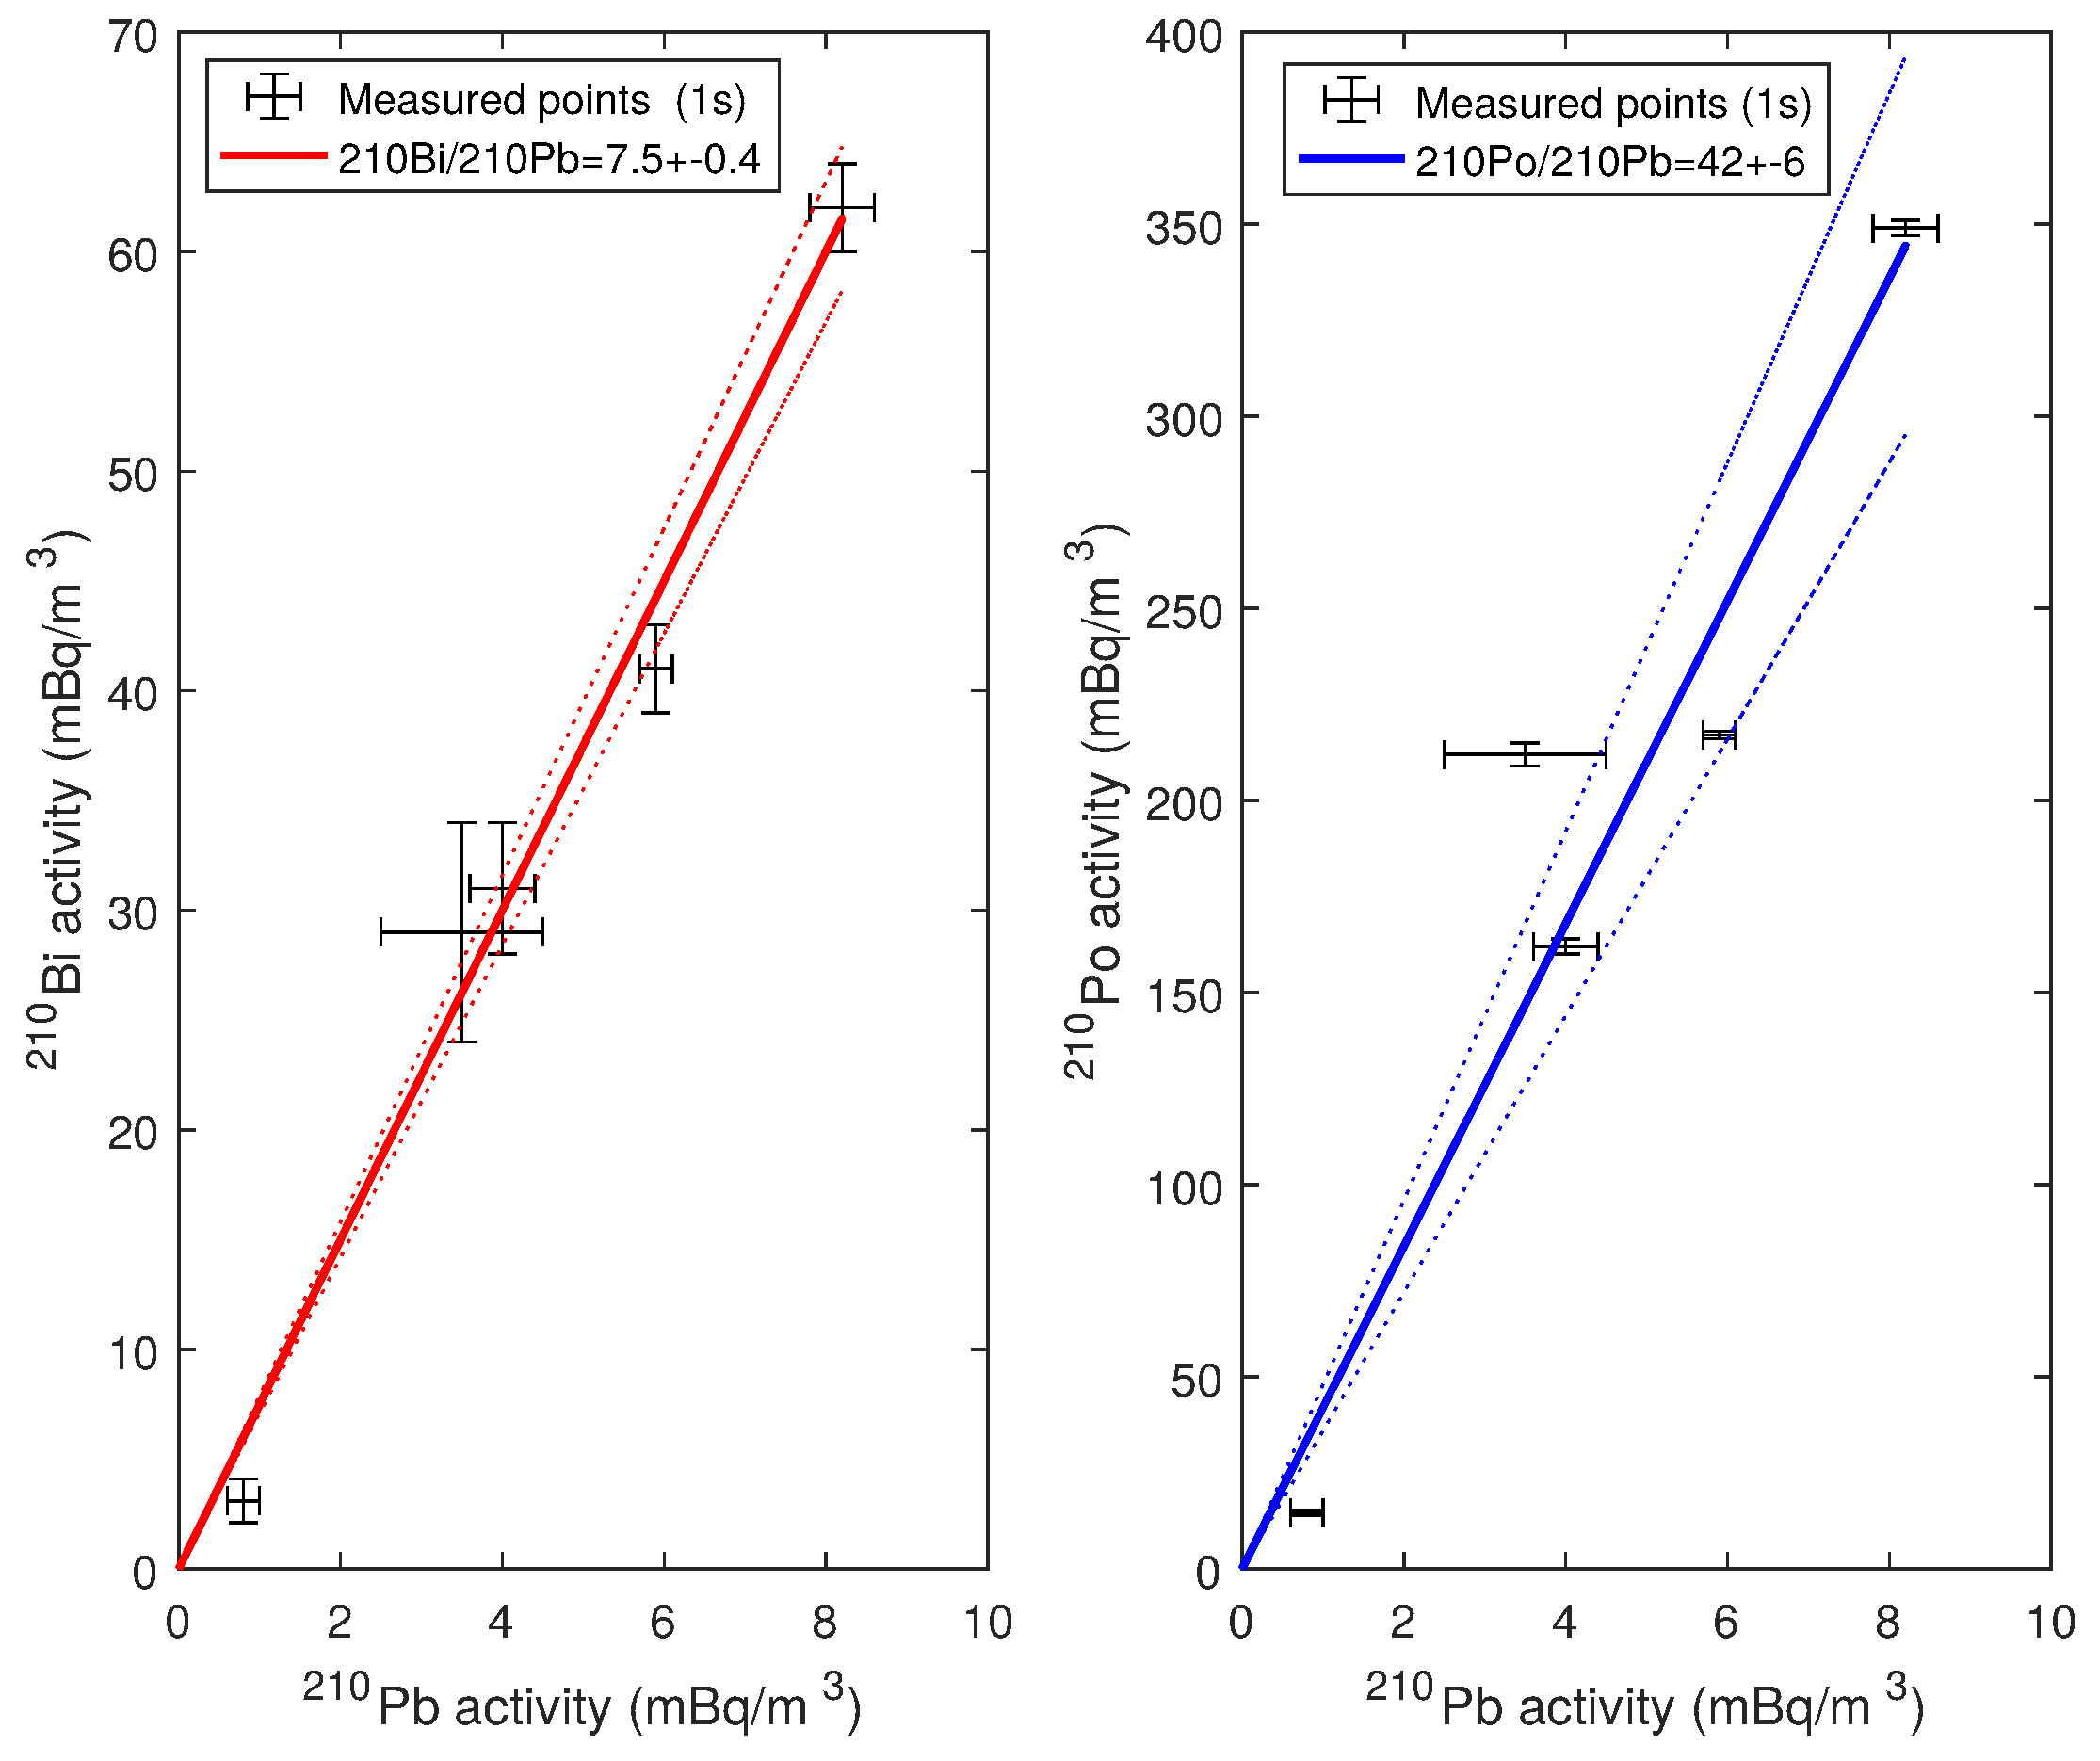
2.3. Analytical Results

Analytical results are reported in Table 1 along with 1- σ uncertainties based on the counting statistics. Uncertainties deriving from the variability of the volume of sampled plume are not propagated since they are quite difficult to estimate while working in the field. However, the three radionuclides are sampled and measured on the same filter and, hence, this uncertainty does not impact radionuclide ratios (i.e., radioactive disequilibria). In addition to volcanic aerosol samples, a sample of the atmospheric background at Mount Etna was collected in clear sky conditions, outside of the plume influence, close to the Sapienza touristic area. As expected, activities in the atmospheric background are below the detection limit for the three radionuclides. Considering the volume of atmosphere sampled for the blank, and the minimum detectable activity (depending on the duration of a counting cycle and on the instrument background noise) in both alpha and beta modes with the IN20 counter, both 210Pb and 210Bi detection limit can be quantified at 0.8 m Bq / m 3 and that of 210Po at 0.3 m Bq / m 3 . Although activities are below detection limits for samples TDF1 and TDF3, and similar to the bêta detection limit for sample TDF2, all other samples appear significantly enriched in 210Pb, 210Bi and 210Po compared to the atmospheric blank. As previously shown ([19], and references therein), this suggests that the plume of Mount Etna is considerably enriched in radionuclides over a standard atmosphere and that high-quality samples can be obtained at safe distances from the summit area. Figure 3 shows 210Bi (Figure 3a) and 210Po (Figure 3b) activities plotted against 210Pb activities for all aerosol samples. Activities follow linear trends passing through the origin, which are interpreted as dilution trends of the volcanic gas (considerably enriched in 210Pb, 210Bi and 210Po) into the atmosphere for which radionuclide activities are negligible. The two linear correlations in Figure 3 are well defined ( R 2 = 0.99 for 210Bi vs. 210Pb; R 2 = 0.91 for 210Po vs. 210Pb), which suggests that the dilution of volcanic gases in the atmosphere does not significantly affect their pristine isotopic signature within at least 1.5 km distance from the summit area. Furthermore, it was reported that radioactive disequilibria in gases released at summit craters significantly differ from those in gas emanations from eruptive vents along eruptive fissures [19]. Therefore, the well-defined linear correlations observed in Figure 3 suggest that the contribution of gases released at the eruptive fissure to the main plume is negligible or alternatively steady through time, which would be highly fortuitous. Samples collected in the diluted plume are thus taken to be representative of the chemistry of volcanic gases at the source. Radioactive disequilibria in the volcanic plume of the NSEC are retrieved by linear regression of the whole dataset at (210Bi/210Pb) = 7.5 ± 0.4 and (210Po/210Pb) = 42 ± 6 . These values are in fair agreement with those previously reported for Mount Etna’s summit craters, in the range 10–30 for (210Bi/210Pb) and between 20 and up to 90 for (210Po/210Pb) ([19], and references therein).

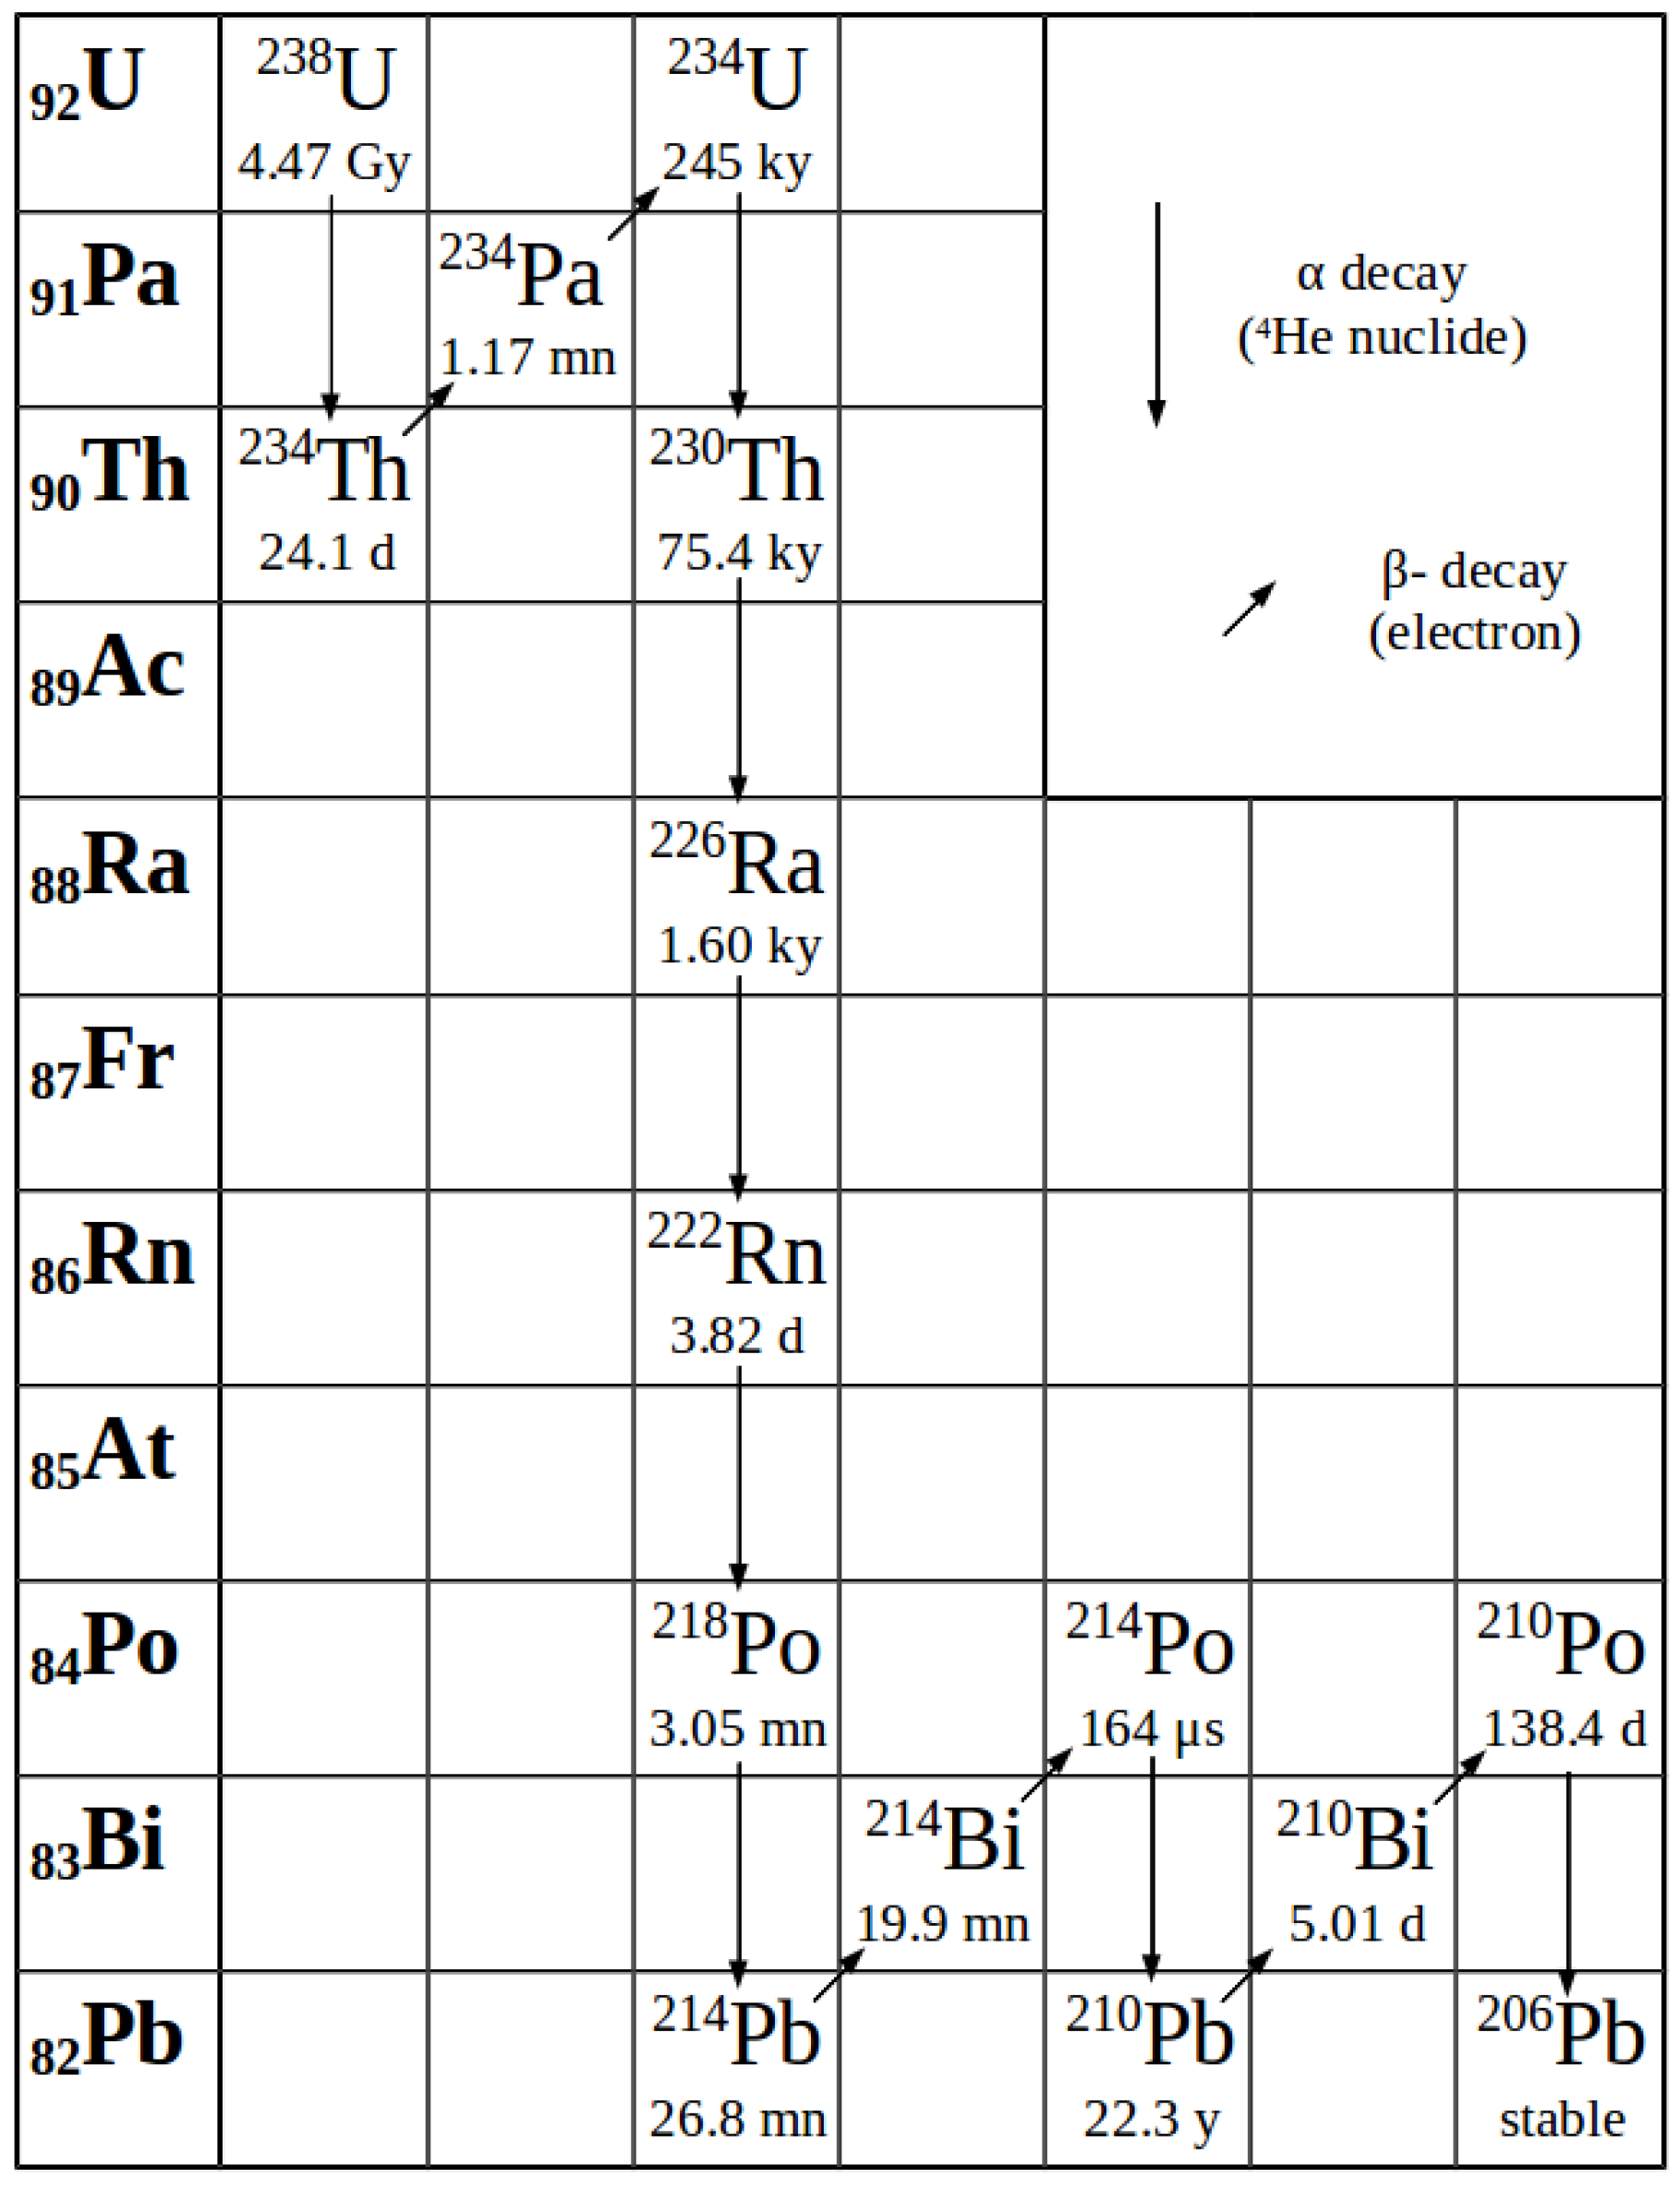
3. Modelling of Radionuclide Degassing and 210Pb-210Bi-210Po Radioactive Disequilibria in Volcanic Plumes

Lambert et al. [14] and then Gauthier et al. [15] linked 210Pb-210Bi-210Po radioactive disequilibria in volcanic gases to degassing processes. Although radioactive disequilibria in volcanic gases from Mount Etna have been successfully explained by the model of Lambert et al. [14], Gauthier et al. [15] showed that Lambert’s model can be used only if the magmatic vapour is released from a rapidly overturned batch of deep magma in radioactive equilibrium prior to degassing. This is due to the fact that the model proposed by Lambert et al. [14] neglects, in the degassing magma, the radioactive ingrowth of 210Bi and 210Po (both moderately to highly volatile at magma temperature) from their parent 210Pb, which is weakly volatile and mostly remains in the melt. If the magma residence time in the degassing reservoir is long enough for 210Pb to decay, then both 210Bi and 210Po atoms are regenerated in the melt. The longer is the residence time, the more efficient is the regeneration. Because 210Pb decay products have greater affinity for the gas phase than for the melt, they preferentially partition into the vapour phase according to their own volatility. When the magma residence time in the degassing reservoir increases, magmatic gases consequently become more and more enriched in the most volatile 210Po and, to a lesser extent, in the moderately volatile 210Bi over 210Pb [15]. By neglecting radioactive ingrowth within the degassing magma, Lambert et al. [14] considered that the ratio of two radionuclides in the magmatic vapour at the time of exsolution could reach a maximum value equal to the ratio of their emanation coefficients ϵ , the widely used parameter describing trace element volatility [14,26]. Gauthier et al. [15] showed that the ϵ ratio of two radionuclides corresponds instead to the minimum value for activity ratios in the magmatic vapour at the time of volatile exsolution. This minimum value is reached when magma residence time is negligible compared to 210Po half-life i.e., less than about 10 days. For increasing values of the magma residence time, activity ratios in the gas phase increase up to a theoretical value, which is defined by the ratio of the liquid–gas partition coefficients D for the considered radionuclides [15].
There is a broad agreement that the emanation coefficient of 210Po for basaltic systems (including Mount Etna) is close to 100%, suggesting that most of polonium atoms are transferred to the magmatic vapour upon degassing [22,27,28,29,30]. The emanation coefficient of lead in basaltic systems appears to be higher in calk-alkaline systems than in other geodynamical settings [21]. At Mount Etna, like at other arc-related basaltic volcanoes, it has a value of approximately 1.0 ± 0.5% [14,17,31,32]. Therefore, the minimum value for (210Po/210Pb) activity ratios in Mount Etna gases should be around 100, which has never been measured, excepted at the beginning of the 1992 eruption [19]. In particular, the ratio of 42 ± 6 we find in the May 2015 plume is far below this minimum theoretical value and cannot be explained by using the dynamic degassing model with realistic parameters for metal volatility [15]. In order to reproduce our observations, the degassing model would indeed require either polonium emanation coefficients lower than 50%, which is in strong disagreement with analyses of freshly erupted lavas at Mount Etna [22], or else lead emanation coefficients up to 3% or even more, which has never been reported.

3.1. 222Rn Enrichments in Volcanic Gases: Towards a New Degassing Model for Short-Lived Radionuclides

Recent studies have suggested that magmas having accumulated an 222Rn-rich gas phase may present significant 210Pb excesses over 226Ra [29,33,34,35,36]. Volcanic gases are also characterised, in some cases, by 210Pb/Pb ratios significantly higher than those measured in lavas [23]. Although the origin of these 210Pb enrichments in volcanic gases has not been fully understood, we tentatively assume that 210Pb excesses could result from radioactive decay of 222Rn atoms in the gas phase.
It is worth noting that, in the previously published degassing models [14,15], the radioactive decay of 222Rn was not taken into account. We present therefore a new degassing model that accounts for it. The conceptual framework of this new model matches that of Gauthier et al. [15]. Accordingly, we consider that volatile exsolution takes place in an open degassing reservoir, which has reached a dynamical and chemical steady-state. Dynamical steady-state implies that the degassing reservoir has a constant mass M (or volume V) through time. It means that any input flux ϕ 0 of deep undegassed magma (in radioactive equilibrium for 222Rn and its daughters) has to be balanced by a flux of gas ϕ G and a flux of lava ϕ L leaving the reservoir. Let α be the fraction of volatiles initially dissolved in the deep magma and ultimately released, the fluxes ϕ G and ϕ L can be written:
ϕ G = α ϕ 0 , ϕ L = ( 1 α ) ϕ 0 .
In such a steady-state reservoir, the replenishment rate is given by ϕ 0 / M . Its reciprocal, M / ϕ 0 , defines the magma residence time τ in the degassing reservoir. In such reservoir, the number of atoms N k , L of each radioactive isotope Ik (either 222Rn, 210Pb, 210Bi, 210Po, k depending on the position along the decay chain) in the degassing magma varies according to:
N k , L t = λ k 1 N k 1 , L λ k N k , L + ϕ 0 C k , 0 ϕ L C k , L ϕ G C k , G ,
where C k stands for the mass concentration of Ik either in the undegassed magma (index 0), the degassed lava (index L) or the gas phase (index G), and where λ k stands for the radioactive decay constant of Ik. From left to right, the right terms of Equation (2) correspond to the production of Ik by Ik−1 decay, the loss of Ik according to its own decay, the input of Ik from the undegassed magma entering the reservoir, the output of Ik by magma withdrawal and finally the output of Ik by degassing. This equation can be expressed in terms of activity per unit of mass by multiplying each member by λ k / M :
( I k ) L t = λ k ( I k 1 ) L λ k ( I k ) L + ϕ 0 M ( I k ) 0 ( 1 α ) ϕ 0 M ( I k ) L α ϕ 0 M ( I k ) G ,
where parentheses denote activity per unit of mass, and ϕ L and ϕ G have been replaced by their expression in Equation (1). With the assumption that the reservoir has also reached a chemical steady-state, which is justified for short-lived volatile isotopes [15], Equation (2) is equal to 0. By introducing a liquid gas partitioning coefficient D I k such as:
D I k = ( I k ) G ( I k ) L ,
the activity of any radionuclide I k in the gas phase may be obtained from Equation (3) such as:
( I k ) G = λ k ( I k 1 ) L + ( I k ) 0 τ λ k D I k + ( α + 1 α D I k ) 1 τ ,
Note that both liquid–gas partitioning coefficients D and emanation coefficients ϵ are linked through the following relationship [15]:
ϵ I k = 1 + 1 α α D I k 1 ,

3.2. Radioactive Disequilibria in Gases at the Time of Exsolution

3.2.1. Specific Case of 222Rn Exsolution

As shown by Equation (5), the activity of a radionuclide Ik in the gas phase depends on the activity of its precursor in the decay chain, which means that a precursor for 210Pb has to be taken into account so as to compute all other activities. All four radionuclides between 222Rn and 210Pb (218Po, 214Pb, 214Bi and 214Po) have half-lives of a few minutes at most (Figure 1), which appears very short compared to the expected residence time of the magma in the degassing reservoir. They can thus be neglected in the model and we consider here, mathematically speaking, that 210Pb is directly regenerated by 222Rn decay. In order to quantify 222Rn degassing efficiency Gauthier and Condomines [37] introduced a parameter f, ranging between 0 (no radon degassed) and 1 (total degassing of radon), and used this previous parameter to calculate 222Rn activity in the degassing melt at steady-state:
( 222 Rn ) L = ( 1 f ) ( 226 Ra ) L ,
with
( 226 Ra ) L = ( 226 Ra ) 0 1 α ,
since radium forms no volatile compounds in basaltic magmas [14]. Applying Equation (3) to the case of 222Rn, replacing ( 222 Rn ) L and ( 226 Ra ) L by their expression in Equations (7) and (8), respectively, and ϕ 0 / M by 1 / τ , we obtain:
( 222 Rn ) G = ( 226 Ra ) 0 f α 1 + τ λ Rn 1 α ,
Note that, in order to clarify notations, λ 222 Rn is written λ Rn , and other radioactivity constants are noted similarly. This relation suggests that significant excesses of 222Rn can be produced in the gas phase for long residence times. Providing that the escape time of gases is long enough (see Section 3.3), 222Rn atoms could then decay and act as a significant additional source of 210Pb in the gas phase.

3.2.2. 222Rn-210Pb-210Bi-210Po Fractionation upon Exsolution

210Pb, 210Bi, 210Po activities in the gas phase after exsolution can now be derived iteratively using Equation (5). Because short-lived 226Ra daughters are thought to be in radioactive equilibrium in deep magmas prior to degassing [37], the application of Equation (5) to 210Pb, taking into account the expression of ( 222 Rn ) L given by Equations (7) and (8) leads to:
( 210 Pb ) G = A 0 λ Pb 1 f 1 α + 1 τ λ Pb D Pb + ( α + 1 α D Pb ) 1 τ ,
where A 0 refers to the equilibrium activity of all nuclides.
The application of Equation (5) to 210Bi, replacing ( 210 Pb ) L by ( 210 Pb ) G / D Pb and using the expression of ( 210 Pb ) G given in Equation (10), leads to an expression of ( 210 Bi ) G . This expression is then used to determine ( 210 Po ) G , still using Equation (5). The obtained expressions are reproduced in Appendix A and, like Equations (9) and (10), they have the following form:
A 0 F ( τ , α , D Pb , D Bi , D Po , f ) ,
where F is a function of τ , α , f and D Pb , D Bi and D Po . Therefore, radioactive disequilibria ( 222 Rn / 210 Pb ) , ( 210 Bi / 210 Pb ) and ( 210 Po / 210 Pb ) do not depend on the magma initial activity but only on these six parameters.
For instance, dividing Equation (9) by Equation (10), ( 222 Rn / 210 Pb ) G may be expressed:
222 Rn 210 Pb G = f α 1 + τ λ Rn 1 α λ Pb 1 f 1 α + 1 τ λ Pb D Pb + ( α + 1 α D Pb ) 1 τ 1 ,
( 210 Bi / 210 Pb ) G and ( 210 Po / 210 Pb ) G are given by Equations (6) and (9) in Gauthier et al. [15].

3.3. Gas Phase Transfer towards the Surface: Radioactive Decay within Gas Bubbles

Activities of each radionuclide in the gas phase after a transfer time θ are noted ( I k ) G θ . Assuming that the gas phase behaves as a closed system as far as radionuclides are concerned, the activities after a transfer time θ can be obtained by solving the following system of coupled equations:
( 222 Rn ) G θ / θ = λ Rn ( 222 Rn ) G θ , ( 210 Pb ) G θ / θ = λ Pb ( 222 Rn ) G θ λ Pb ( 210 Pb ) G θ , ( 210 Bi ) G θ / θ = λ Bi ( 210 Pb ) G θ λ Bi ( 210 Bi ) G θ , ( 210 Po ) G θ / θ = λ Po ( 210 Bi ) G θ λ Po ( 210 Po ) G θ ,
with initial conditions ( I k ) G θ = 0 = ( I k ) G , where ( I k ) G are the expressions established above.
This system has been solved by Bateman [38] in its generalized formulation. The solution has also been formalized in an algebraic way e.g., [39]. This approach is more suitable for a numerical implementation and is thus chosen:
( 222 Rn ) G ( 210 Pb ) G ( 210 Bi ) G ( 210 Po ) G θ = M × e λ Rn θ 0 0 0 0 e λ Pb θ 0 0 0 0 e λ Bi θ 0 0 0 0 e λ Po θ × M 1 × ( 222 Rn ) G ( 210 Pb ) G ( 210 Bi ) G ( 210 Po ) G θ = 0 ,
where M and M 1 are matrices for which coefficients are only a function of radioactive constants λ k and are reproduced in Appendix B (Equations (A3) and (A4)). Because initial conditions have the form described by Equation (11), the solution described by Equation (14) also has the same form. Therefore, radioactive disequilibria in the gas phase after a given transfer time do not depend on the initial activity of Ik in the magma. Their expression are not reproduced here, but they can be explicited replacing M, M 1 , ( 222 Rn ) G , ( 210 Pb ) G , ( 210 Bi ) G and ( 210 Po ) G by their expressions provided before or in the appendix.

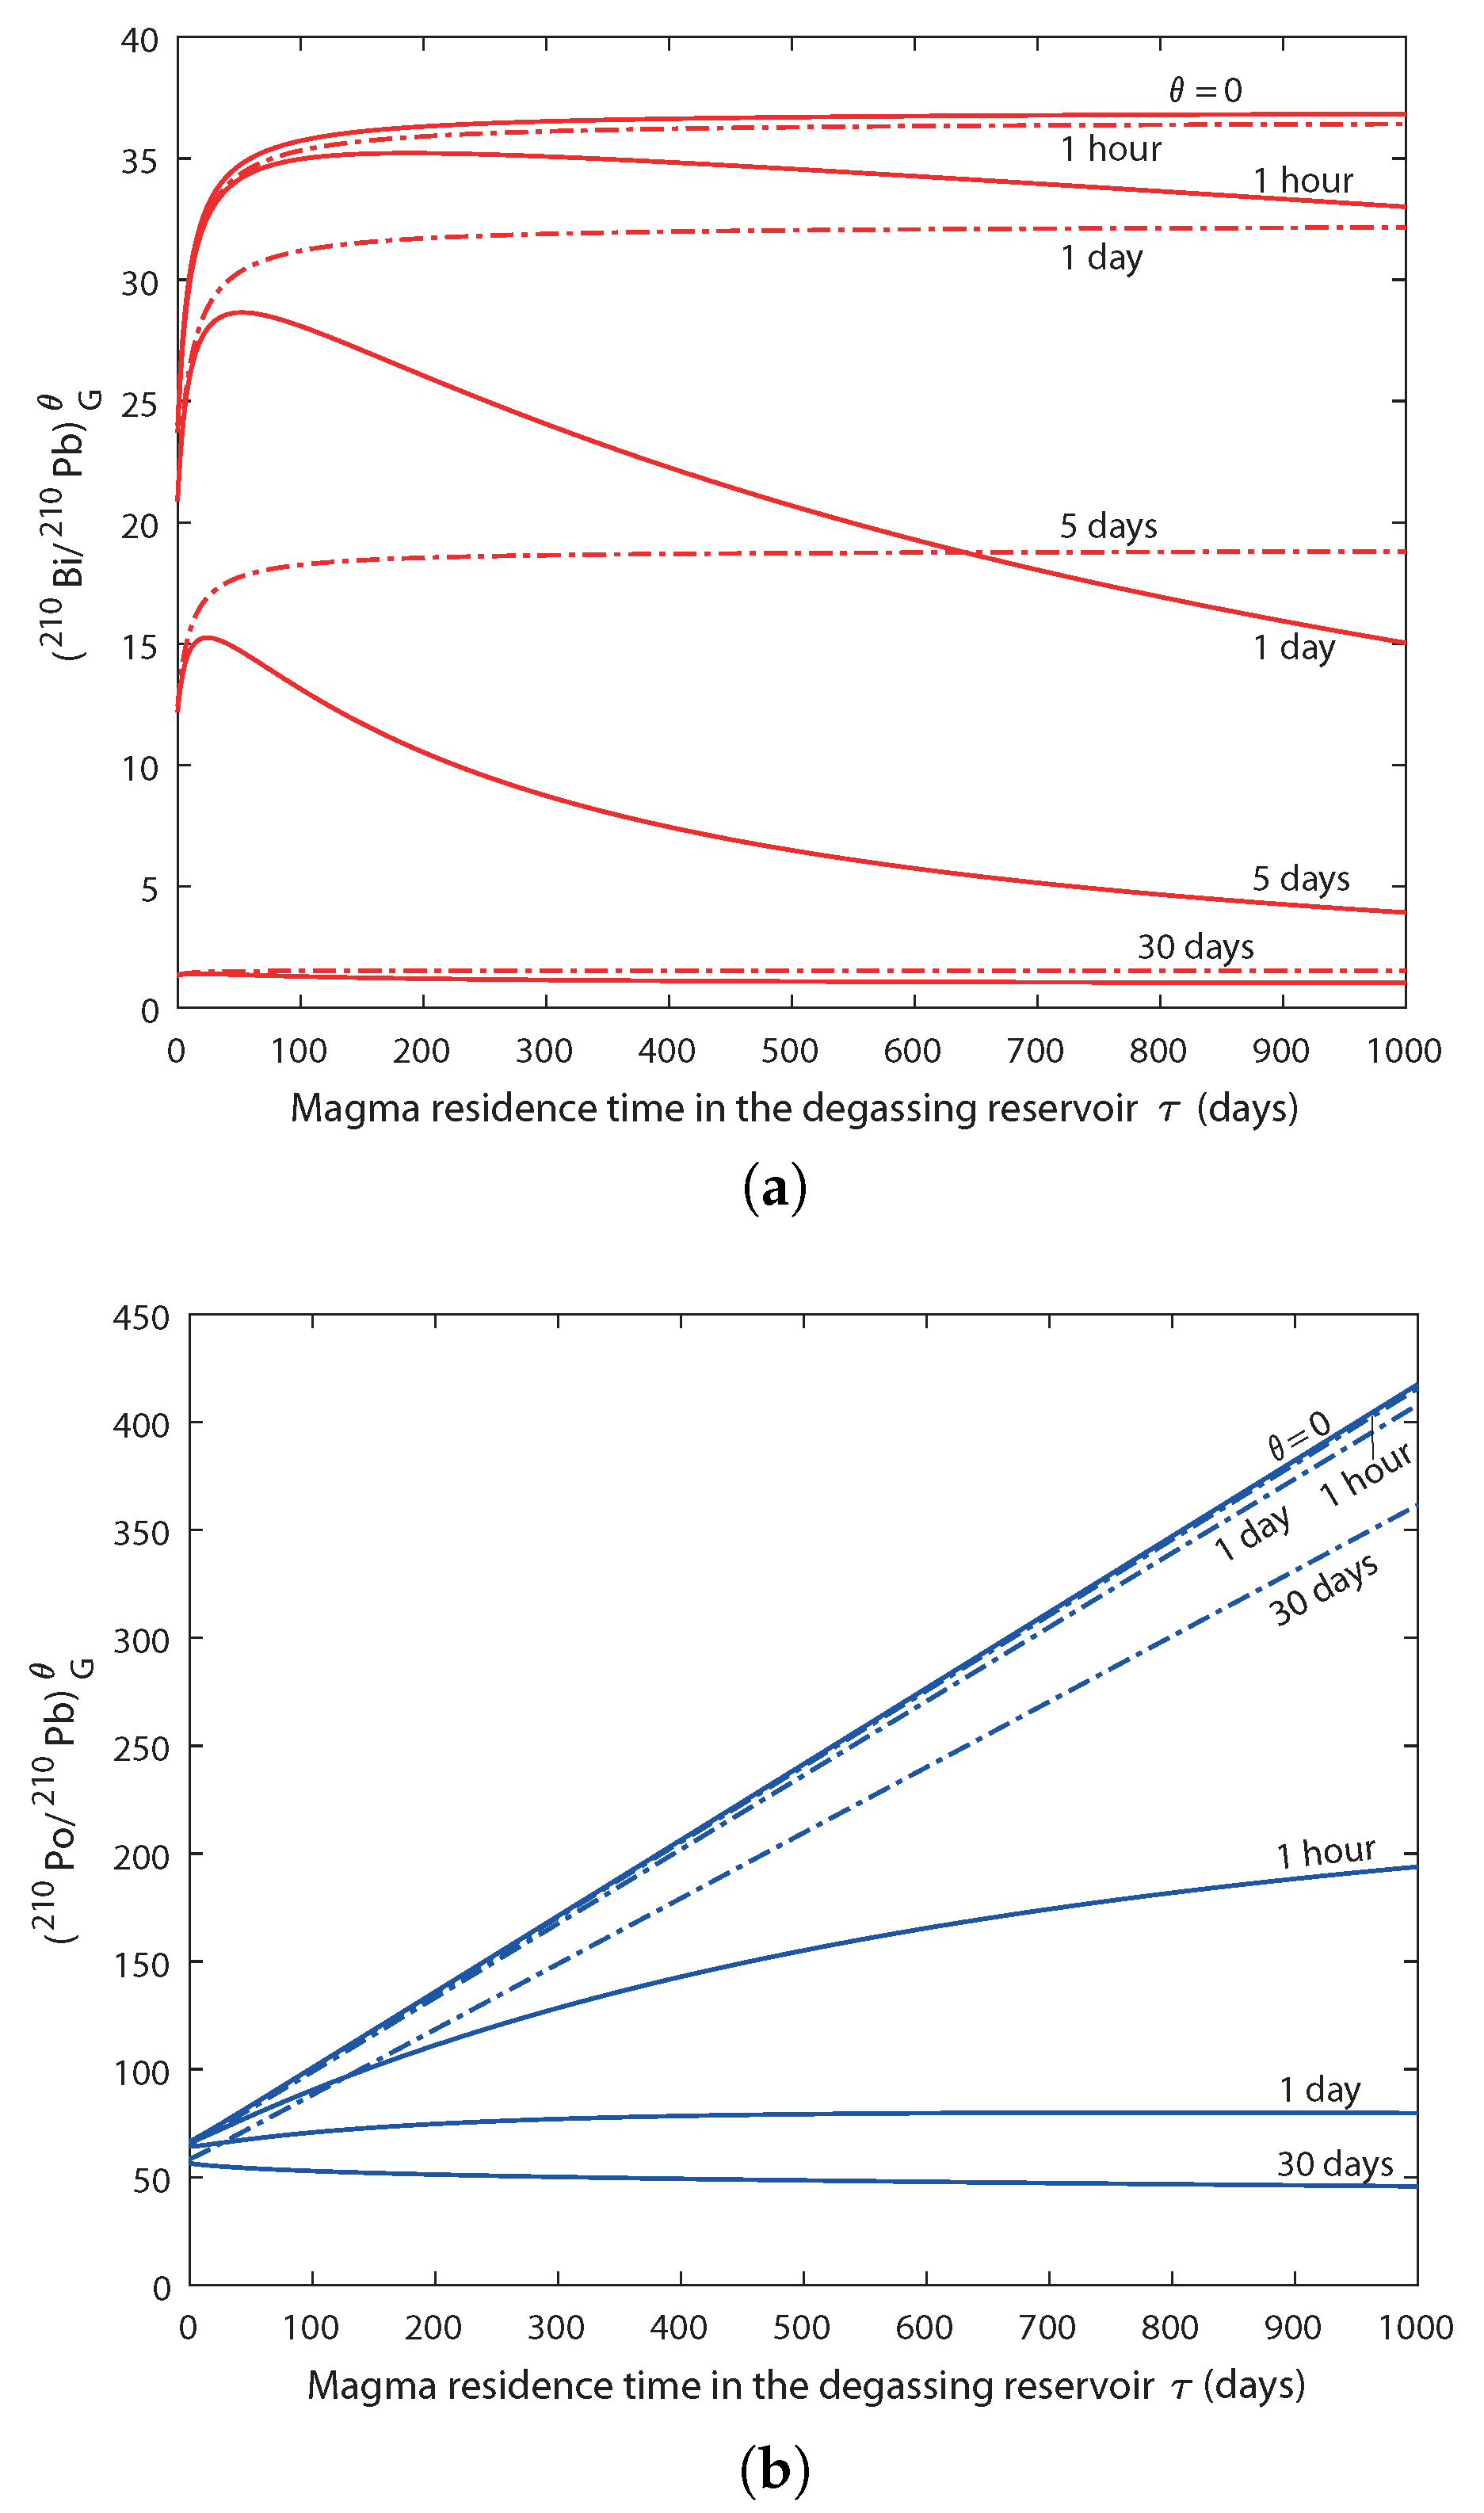
3.4. Results and Discussion

Radioactive disequilibria between 210Pb, 210Bi and 210Po in the gas phase according to our model are presented in Figure 4. Values of α , f and volatility for Pb, Bi and Po (D or equivalently ϵ ) are fixed using reasonable estimates from the literature ( α = 5 wt.%, f = 1 , ϵ Pb = 1.5 %, ϵ Bi = 36 %, ϵ Po = 100 %). The choice of these values, and their impact on the model predictions, are discussed later (see Section 4). Theoretical values of disequilibria are plotted against the residence time in the degassing reservoir for several values of the transfer time. These new results are systematically compared to radioactive disequilibria produced by the model of Gauthier et al. [15].
Radioactive disequilibrium (222Rn/210Pb) in the gas phase (not shown in Figure 4) upon exsolution ( θ = 0 ) dramatically increases with the residence time and can reach values as high as 1000 for residence times up to 100 days. Therefore, huge 222Rn enrichments can be generated because of the difference of gas-melt partitioning coefficients between 222Rn and its non-volatile precursor 226Ra. This prediction confirms the potential for important 210Pb ingrowth in the gas phase during its transfer.
Radioactive disequilibria (210Bi/210Pb) and (210Po/210Pb) (Figure 4) in the gas phase at the time of exsolution ( θ = 0 ) are identical between the two models, which was expected since 222Rn has no time to decay within gas bubbles. The observed trends have been explained by Gauthier et al. [15]: ( 210 Po / 210 Pb ) G significantly increases with the residence time τ , as a result of 210Po regeneration in the liquid phase of the degassing reservoir; ( 210 Bi / 210 Pb ) G also increases with τ but at a slower rate. This is because the regeneration of 210Bi by 210Pb decay in the liquid phase is not as important, which is due to the smaller difference of volatility between Pb and Bi than between Pb and Po.
In contrast, when the escape time of gases is not negligible ( θ > 0 ), our model predicts significantly lower (by a factor 2 or more) values than those derived from Gauthier et al. [15]. (210Bi/210Pb) activity ratio in the gas phase, as computed with the former model ([15], dashed lines in Figure 4a), decreases with increasing values of θ from 0 to 30 days owing to the short half-life of 210Bi. In about one month (6 times 210Bi half-life of 5.01 days), 210Bi is back to equilibrium with its parent 210Pb, leading to an activity ratio of 1. Our model suggests, however, that low values of ( 210 Bi / 210 Pb ) G can be produced for gas transfer time θ as short as a few days (solid lines, Figure 4a). This feature is explained by both the radioactive decay of 210Bi according to its own half-life and the radioactive decay of 222Rn within gas bubbles, which produces new 210Pb atoms. Accordingly, ( 210 Bi ) G θ decreases for increasing values of θ while ( 210 Pb ) G θ increases, leading to a faster decrease in the ( 210 Bi / 210 Pb ) G activity ratio. However, for longer transfer times (e.g., θ = 30 days), the two models produce again similar values close to the equilibrium ratio of 1, as expected since both 222Rn and 210Bi have similar half-lives (3.82 days and 5.01 days, respectively). In other words, the most important difference between the two models happens for magma residence times τ higher than a few hundred days (significant regeneration of 222Rn from 226Ra in the degassing melt and subsequent radon enrichments in the gas phase) and gas transfer times θ shorter than a few days (significant 222Rn-driven production of novel atoms of 210Pb within gas bubbles with limited return of 210Bi to radioactive equilibrium).
The same conclusion can be drawn regarding ( 210 Po / 210 Pb ) G activity ratios (Figure 4b). The effect of 222Rn decay is even more pronounced since the decrease in ( 210 Po ) G θ according to the half-life of 210Po (138.4 days) is rather limited for short transfer times θ . The radioactive decay of 222Rn thus strongly controls the magnitude of 210Pb-210Po radioactive disequilibria. For instance, for values of τ higher than 150 days, it can be seen that our degassing model produces ( 210 Po / 210 Pb ) G activity ratios at θ = 1 h lower than those derived from Gauthier et al. [15] for θ = 30 days.
These results highlight the need for taking 222Rn into account in dynamic degassing models. They also suggest that activity ratios in the gas phase as low as those measured in the plume of Mount Etna could be explained and modelled within this novel theoretical framework.

4. Model Application

It can be seen from Equations (11) and (14) that the model relies on two variables (i.e., the magma residence time τ and the gas transfer time θ ) as well as on five parameters:
  • the volatile weight fraction involved in the degassing process α ,
  • the fraction f of degassed radon [37],
  • the emanation coefficients ϵ of lead, bismuth and polonium (ultimately converted to gas-melt partitioning coefficients using Equation (6)).
Provided that the five parameters α , f, ϵ Pb , ϵ Bi , and ϵ Po can be estimated independently and the two ( 210 Po / 210 Pb ) G and ( 210 Bi / 210 Pb ) G activity ratios in the gas phase can be measured precisely, both τ and θ values can then be accurately determined from the model. However, these conditions are not necessarily met due to large analytical uncertainties on activity ratios and a broad range of values for emanation coefficients. Therefore, the mathematical system appears underdetermined. To overcome this difficulty, we choose to use a range of likely values for the five input parameters and the two variables, based on previous results for Mount Etna and other basaltic systems. Then, we perform a Monte Carlo type simulation (see Section 4.2 for more details on the methodology) in order to determine which τ and θ values (or ranges of values) can explain activity ratios measured in the volcanic plume.

4.1. Estimation of Input Paramaters

4.1.1. Volatile Weight Fraction α

The volatile weight fraction involved in the degassing process, α , controls the relative proportion of gas and liquid phases coexisting in the degassing reservoir. It is a key parameter because gaseous trace element compounds are too scarce to nucleate gas bubbles in the melt, and they need a major volatile species (e.g., H2O) to be flushed out of the magma [40]. The total volatile content of magmas is often estimated from volatile concentrations in melt inclusions trapped in crystals, assuming that these melt inclusions represent the deep undegassed magma. In magmatic systems, the main volatile species are, by decreasing order of importance, H2O, CO2, S-species (mostly SO2 in basaltic systems), HCl and HF. Since these species have different solubilities in basalts, the depth-related pressure of inclusion entrapment has to be considered in order to derive a reliable total volatile content dissolved in the magma prior to degassing. At Mount Etna, olivine-hosted melt inclusions have been studied for long by different authors e.g., [41,42]. Their studies yield to close estimates of the volatile weight fraction α in the range 4–5 wt.%. Such high volatile content appears to be characteristic of alkali-rich basaltic magmas like those of Etna [42]. In other geodynamical settings and especially at non-arc-related volcanoes, the total amount of dissolved volatile usually is much lower [2]. Nevertheless, it must be pointed out that the model still applies to these volcanoes, provided that α is carefully quantified.

4.1.2. Fraction of Degassed Radon f

The fraction of radon released upon magma degassing, f, is a major parameter of our model since it directly controls the magnitude of 222Rn enrichments in the gas phase and, subsequently, the radioactive ingrowth of 210Pb within gas bubbles. Very few data exist in the literature about radon degassing from basaltic magmas. Nevertheless, analyses of freshly erupted basalts and andesites [27,43] provide evidence for almost thorough radon degassing from erupting magmas. Further experimental studies [40,44] confirm that radon is entirely flushed out of mafic magmas upon degassing, provided that a major gas species can act as a carrier. Although f is most likely close to 1 at Etna, we use here a conservative estimate with f varying between 90% and 100%.

4.1.3. Volatilities of Lead, Bismuth and Polonium (Emanation Coefficients ϵ and Gas-Melt Partitioning Coefficients D)

The volatility of lead and bismuth is not so easy to assess since both elements are much less volatile than radon. Lead and bismuth, as many other heavy metals, are not volatile in their pure metallic form but are rather engaged in chemical compounds (halides or sulfates) that can be degassed at magma temperature. However, near-equilibrium values of (226Ra/210Pb) in erupted basaltic lavas ([35], and references therein) including Etnean basalts [45] suggest a minimal loss of 210Pb upon degassing and hence an emanation coefficient of lead of a few percents at most (1.5% according to [14]). Mather [26] computed a “volatility coefficient” (equivalent to a gas-melt partitioning coefficient) for lead using gas and lava data from Mount Etna, which is as low as 0.13. Using Equation (6) with α = 5 wt.%, it corresponds to an emanation coefficient of 0.7%. Therefore, we take ϵ Pb between 0.7 and 1.5% (corresponding to D Pb values in the range 0.13–0.37).
When the emanation coefficient of lead is known, Pennisi et al. [17] suggested to obtain ϵ Bi by scaling bismuth to lead with the ratio of their common stable isotopes according to:
ϵ Bi = 1 + 1 ϵ Pb ϵ Pb [ Pb ] G [ Pb ] L [ Bi ] L [ Bi ] G ,
where [X] represents concentration in lava (subscript L) and volcanic plume (subscript G). Using trace element analyses in both Etnean gas and erupted lava from Aiuppa et al. [32], we estimate ϵ Bi = 36 % . This value is in fair agreement with other estimates found in the literature in the case of Mount Etna: 45% in Lambert et al. [14]; 20% in Pennisi et al. [17]. A large range of variation of ϵ Bi (20–45%) is thus chosen according to these few estimates. It corresponds to partitioning coefficients D Bi in the range 4.75–19.6.
Almost nothing is known on the geochemical behaviour of polonium, apart from its affinity for the vapour phase. Because polonium has no stable isotope, its emanation coefficient cannot be calculated in the same way as bismuth. The value of ϵ Po must therefore be determined from analyses of freshly erupted basaltic lavas e.g., [27,28,29,30]. All these studies show that erupting lavas are almost entirely Po-depleted and concur to a value of ϵ Po close to 100%. At Etna, a similar method [22] suggested more incomplete polonium degassing, leading to an emanation coefficient as low as 80%. We thus use a range of ϵ Po between 80% and 100%, which is D Po > 100 .

4.2. Inversion of the Model

4.2.1. Methodology

In order to assess whether the presented model can explain the measured values in the plume of Mount Etna, the following system of two equations has to be solved for τ and θ :
210 Bi 210 Pb G τ , θ = 7.5 ± 0.4 , 210 Po 210 Pb G τ , θ = 42 ± 6 .
We prefer not to solve this system of theoretical equations for τ and θ since this would imply to know precisely each of the five parameters of the model ( α , f, and emanation coefficients) while they are not so well constrained. Instead, we prefer a Monte Carlo type simulation according to the following procedure:
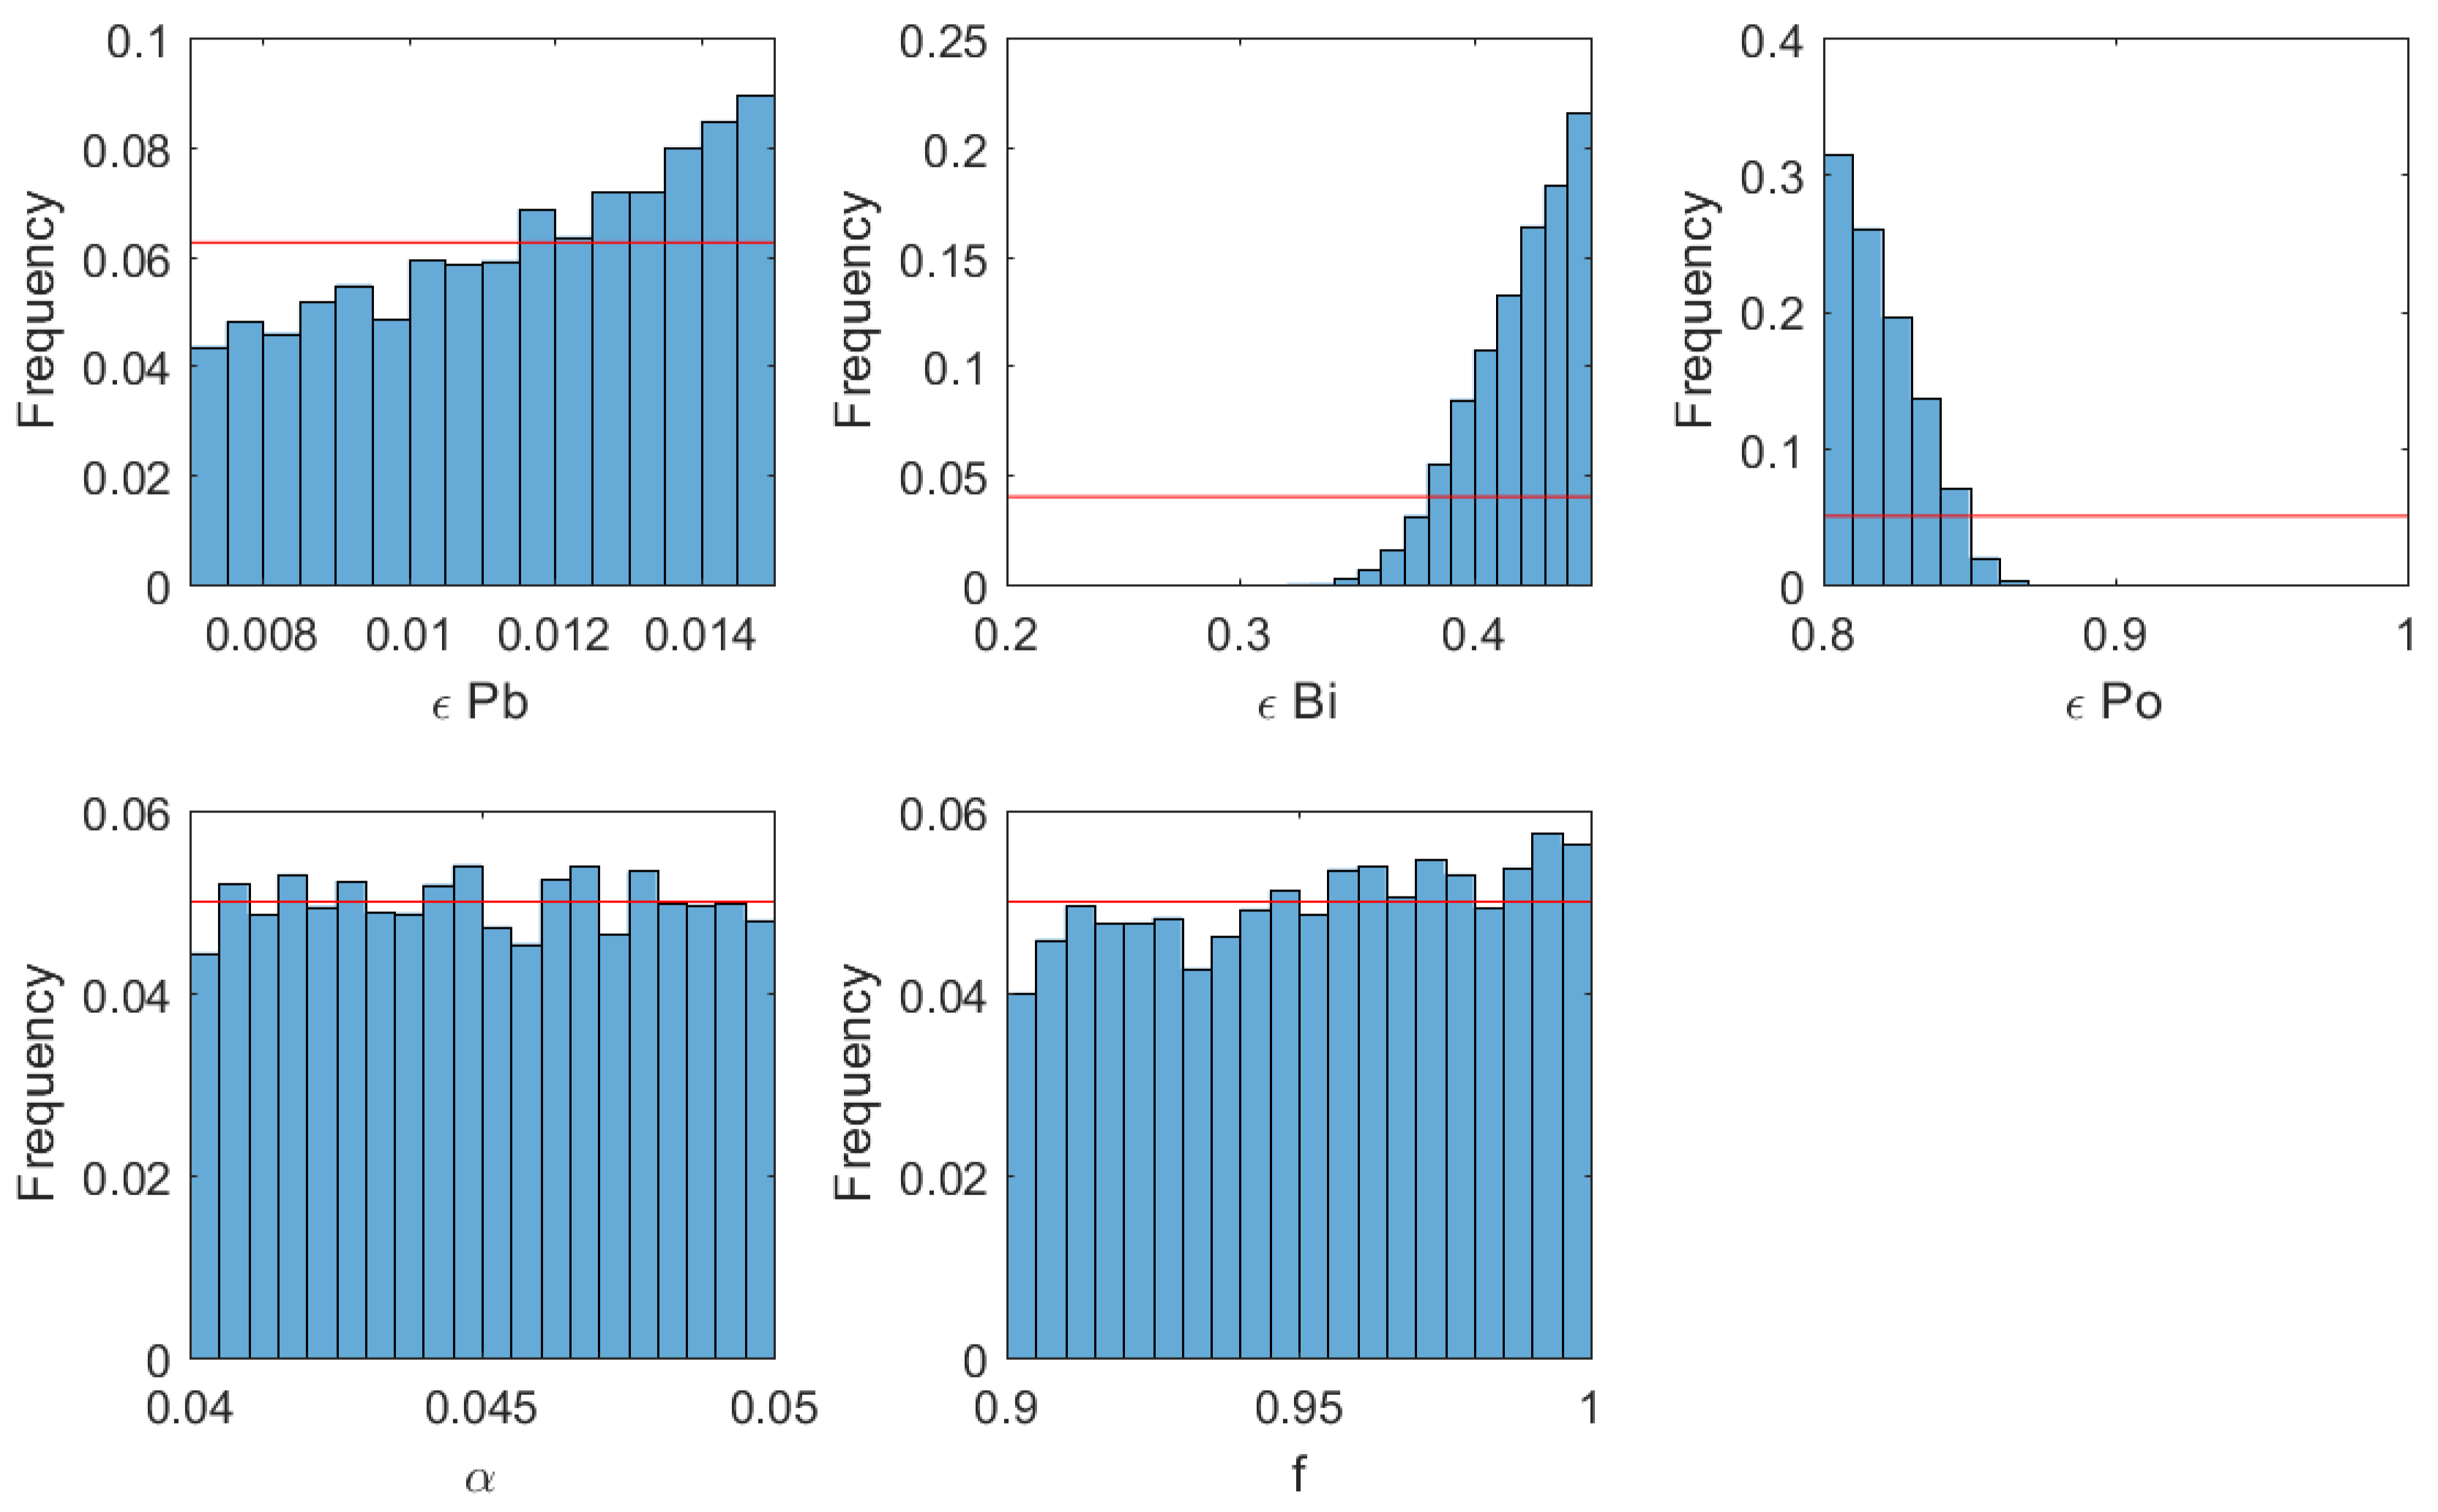
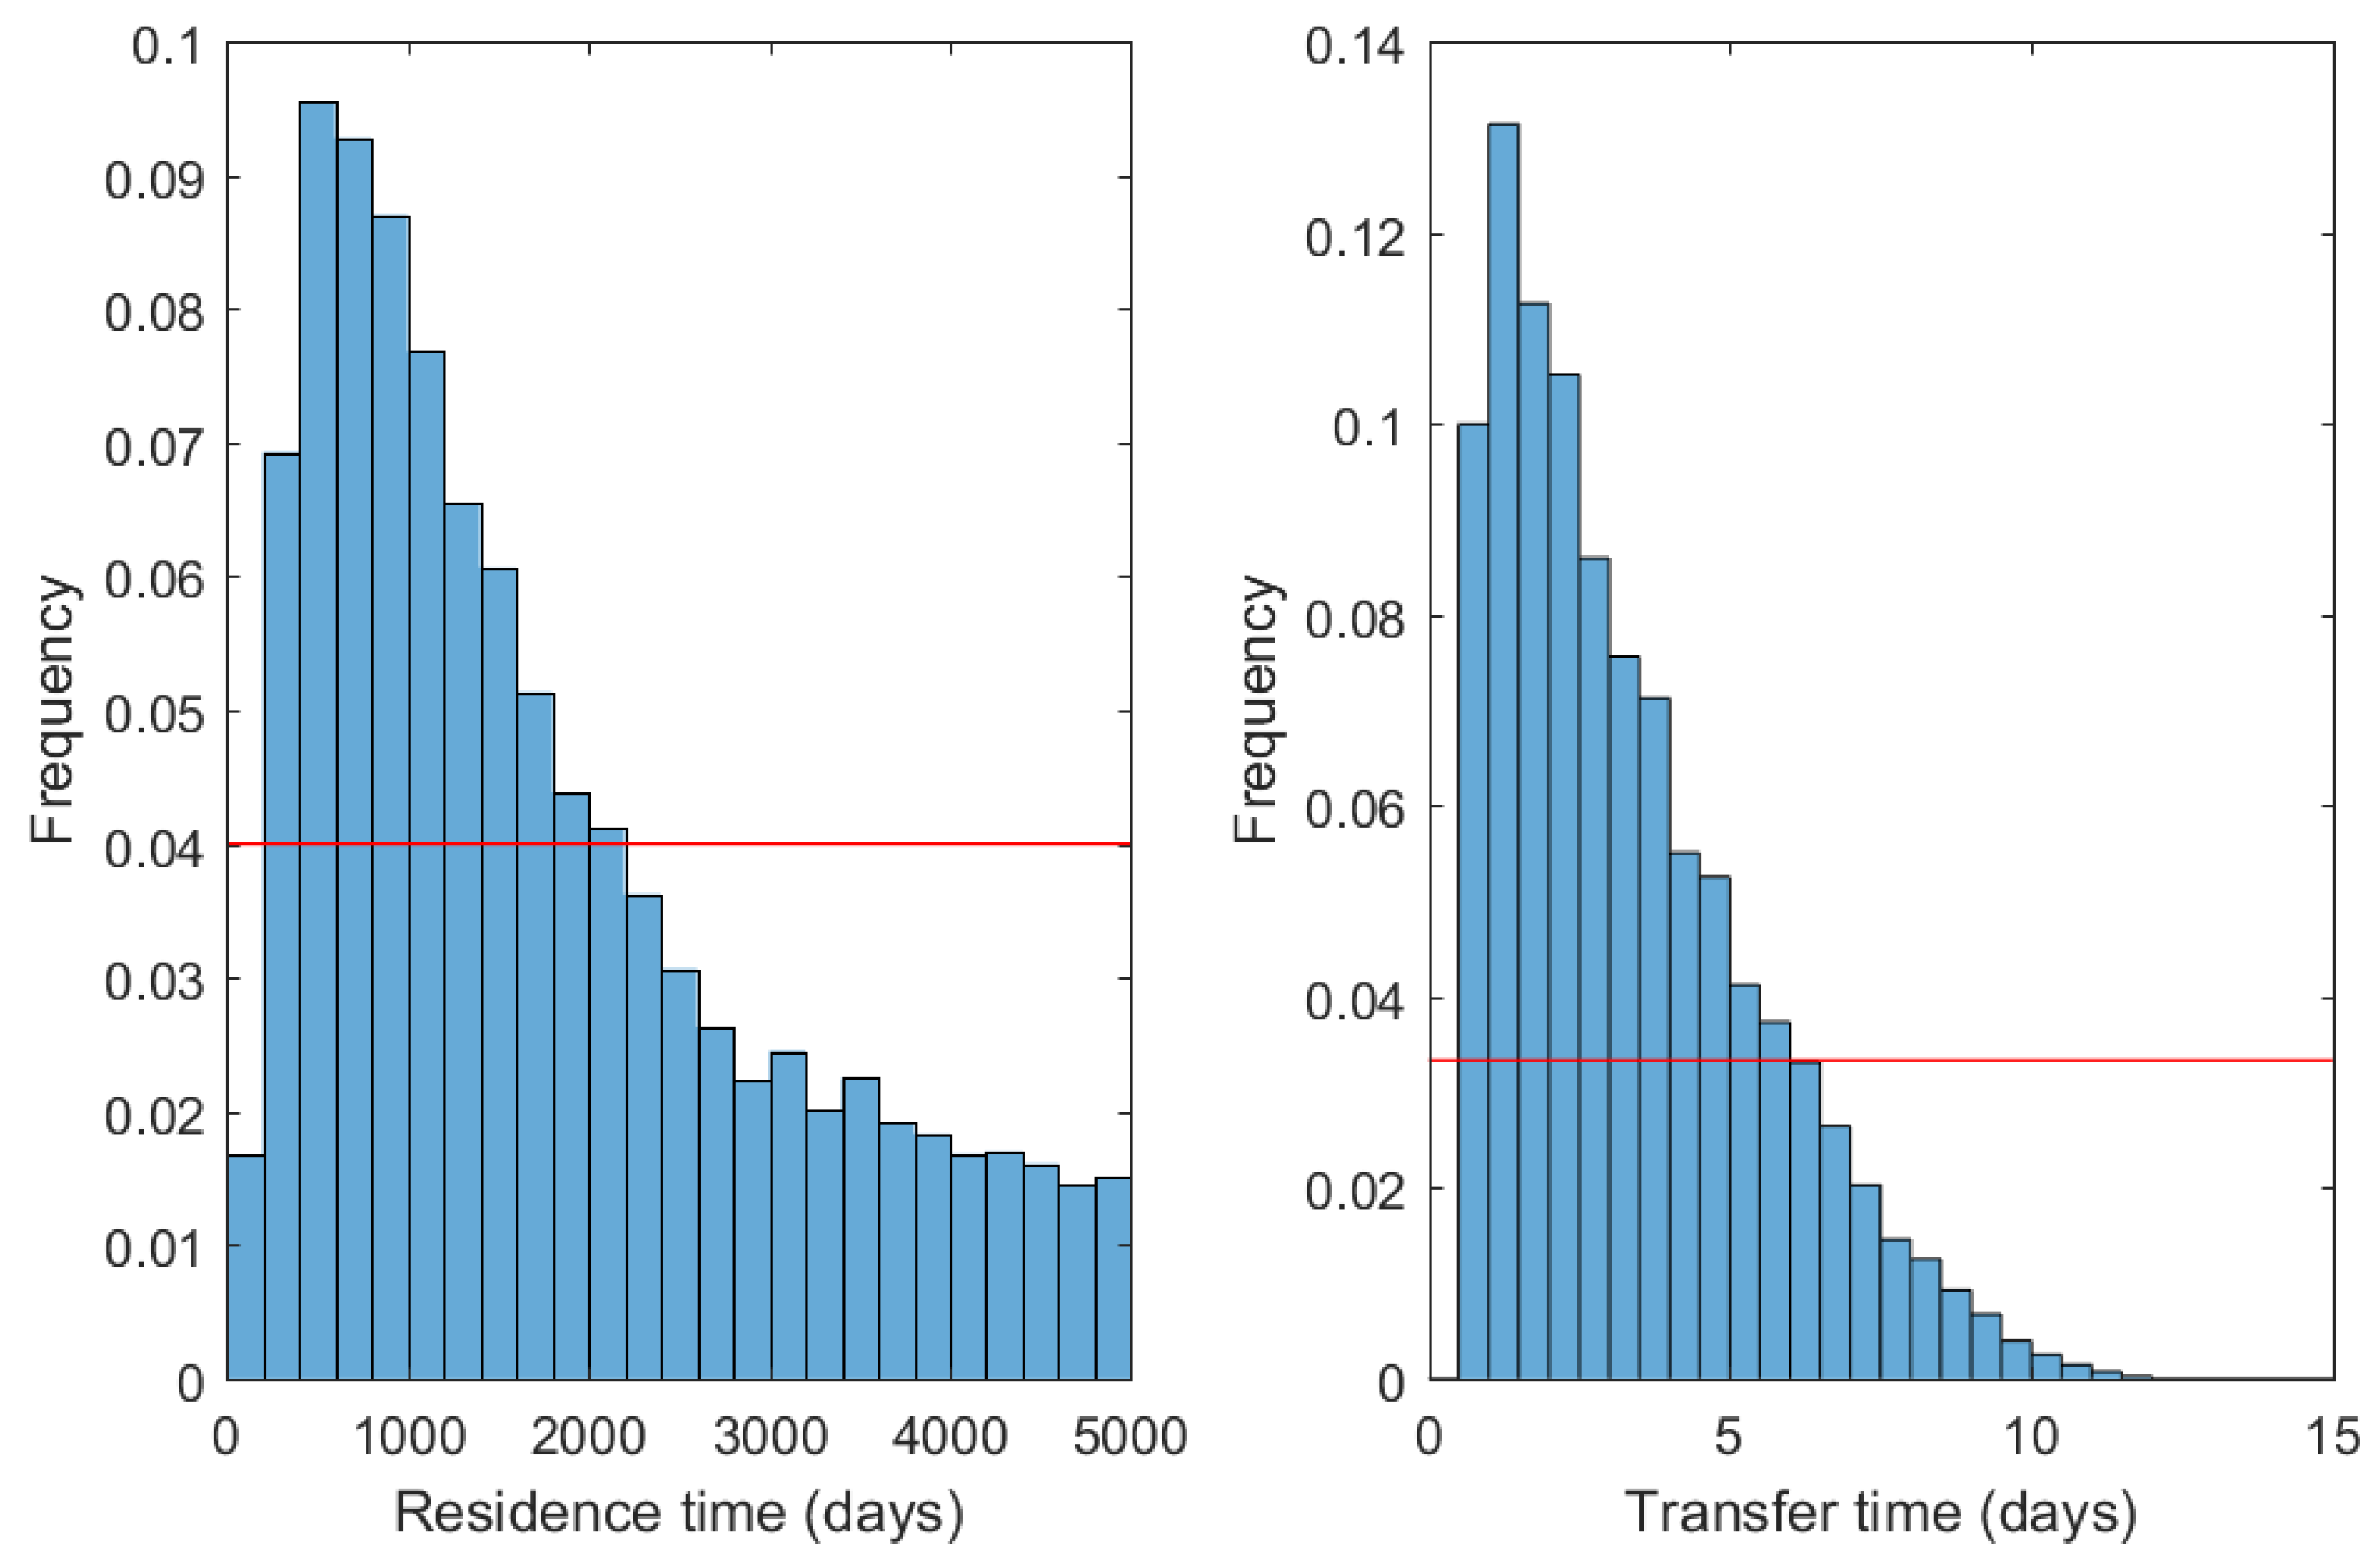
  • each parameter (see Table 2) is chosen randomly in its range of variation according to an uniform law.
  • the residence time τ and the transfer time θ are also chosen randomly (between 0 and 5000 days for τ , and between 0 and 15 days for θ ). The upper limit for τ is in agreement with the order of magnitude of Mount Etna magma residence time in shallow reservoirs: a few tens of years in Condomines et al. [45], one year in Armienti et al. [46]. The upper limit for θ is coherent with maximum estimates of the gas phase transfer time at Mount Etna [14].
  • radioactive disequilibria in the gas phase are computed according to the model equations.
  • if the computed values match the measured ones, then the set of parameters and the dynamic variables ( τ and θ ) are stored in a database.
  • these operations are repeated until a statistically relevant database (here 10,000 elements) is built. If enough combinations of parameters are simulated, the parameter space is sampled without any important gap.
The database is finally analysed using histograms or scatter plots (Figure 5, Figure 6 and Figure 7).

4.2.2. Discussion of Results and Implications for Magma Dynamics at Mount Etna

The model can explain the radioactive disequilibria measured in Mount Etna plume for many combinations of parameters. Regarding input parameters (Figure 5), flat distributions observed for α and f means that, in the frame of our model, all values tested are equally compatible with the measured disequilibria. It thus appears that these two parameters have a rather limited influence on the mathematical modelling when they vary across the assigned range of values. The same conclusion holds true for ϵ Pb although a significantly higher frequency is observed towards the highest values (1.1% < ϵ Pb < 1.5%). In contrast, non-flat distributions indicate that the capability of the model to reproduce measured disequilibria is very sensitive to both ϵ Bi and ϵ Po values, which are not constrained precisely enough. There is no satisfactory combination of parameters for ϵ Bi < 34 % and ϵ Po > 88 % . It suggests that (i) ϵ Bi might be as high as values reported by Lambert et al. [14] (45%); (ii) polonium degassing efficiency might be as low as reported by Le Cloarec et al. [22] (80%).
The histogram of the residence time values peaks between 500 and 1000 days but also extends to the maximum value of 5000 days (Figure 6). The histogram of the transfer time also peaks at low values (between 1 and 3 days) but shows instead that the computation produces no satisfactory results for θ > 12 days. From a statistical perspective, it is thus most likely that measured radioactive disequilibria in the gas plume of Mount Etna are best explained by dynamical parameters in the range 500–1000 days and 1–3 days for τ and θ , respectively. Nevertheless, all satisfactory dynamic parameters align roughly on an hyperbole (Figure 7), which is logical since residence time and transfer time tend to act on disequilibria in opposed ways (disequilibria increasing with τ and decreasing with θ ).
These two end-members have different geological implications. Because magma residence time is given by the relation τ = M / ϕ 0 , higher residence times are associated with larger degassing reservoirs. At open conduit volcanoes, the transfer time of gas is likely dependent on the depth where gas exsolution takes places. Thus, longer transfer times likely correspond to deeper degassing reservoirs. The first above-mentioned end-member (high τ and low θ ) is therefore associated with a large degassing reservoir stored at shallow depth. Such scenario appears unlikely since large magma bodies (> 1 k m 3 ) at very shallow depth (< 1 k m ) would tend to erupt immediately. The second end-member (low τ and high θ ) is instead associated with a smaller magma reservoir seated at a greater depth. Again, this appears unlikely as small volumes (< 10 6 m 3 ) of magma stored at several kilometres depth would not be able to drive the present-day eruptive activity of Mount Etna.
An estimate of the magma flux entering the degassing reservoir ϕ 0 can be calculated from the mean SO2 flux measured during the field campaign and the eruptive stage from 12 May to 16 May (5200 t / d ). Scaled to the sulfur content of Etnean basalts (0.3 wt.% in [42]), considering complete SO2 degassing and a magma density of 2700 k g / m 3 , we find ϕ 0 = 8.7 × 10 8 k g / d = 3.2 × 10 5 m 3 / d . Owing to the definition of the magma residence time, the volume of the degassing reservoir is merely given by V = ϕ 0 τ . Our estimate of ϕ 0 thus yields a volume of 0.15–0.30 k m 3 for a degassing reservoir having a residence time of 500–1000 days (peak values in Figure 6). A residence time of 5000 days (highest value tested in our simulation; Figure 6) would correspond to a reservoir volume of 1.5 k m 3 .
These estimates can be compared to the erupted volumes of lava during recent major eruptive events at Mount Etna. From 1995 to 2005, a cumulative volume of ca. 230 × 10 6 m 3 (dense-rock equivalent magma) has been erupted during major lava flow events [47]. These events are thought to be responsible for the complete discharge of the shallow (and degassing) plumbing system of the volcano [47] whose maximum storage capacity is thus 0.23 k m 3 . This value compares well with previous estimates of the shallow plumbing system of Etna derived from degassing budgets during the previous eruptive cycle (0.3–0.6 k m 3 , [4]) or geochemical considerations (0.5 k m 3 , [45]). The 0.15–0.30 k m 3 estimate derived from radioactive disequilibria in volcanic gases for τ = 500–1000 days thus appears more realistic than the 1.5 k m 3 end-member obtained for longer residence times.
The transfer time of gases produced by the simulation falls in the range 1–12 days. Considering a likely value of τ between 500 and 1000 days, the range for θ is reduced to 2–7 days (Figure 7). These values of a few days are in good agreement with previous determinations made for Etna [14], but they are significantly higher than those determined for the shallow (<100 m ) degassing system of Stromboli where gases escape the magmatic system in one hour or less [15]. Such gas transfer time cannot be easily quantified as a depth of degassing since the bubble ascent rate through the whole feeding system of Etna is mostly unknown. However, by analogy with Stromboli volcano which produces slightly more differentiated basaltic magmas, a transfer time of a few days could be tentatively related to an exsolution depth of a few kilometres at most. The bottom of the feeding system of Etna is often envisaged at a depth of about 5 km below sea level [47]. It thus appears that effective degassing-driven radionuclide fractionation takes place within the upper part of the magmatic system.

5. Conclusions

We carried out in 2015 a new survey of 210Pb-210Bi-210Po radioactive disequilibria in the plume of Mount Etna. Measured activity ratios in the gas phase are in good agreement with values previously reported in the literature for the volcano. However, they can not be explained by existing theoretical models accounting for radionuclide degassing.
The presence of 222Rn, ignored in previous models, in the exsolved magmatic gas phase is thought to play a major role on the 210Pb-210Bi-210Po systematics by producing 210Pb excesses in the gas phase during its transfer towards the surface. Here, this contribution has been modelled theoretically and it appears to produce radioactive disequilibria that can be twice as low as those predicted by the former degassing model of Gauthier et al. [15].
When applied to the case of Mount Etna, this novel degassing model can reproduce measured activity ratios. It strengthens the validity of our approach by underscoring the importance of 222Rn enrichments in producing 210Pb excesses in the gas phase. Precise quantification of magma dynamics (i.e., magma residence time τ and gas transfer time θ ) beneath active volcanoes through the use of our degassing model necessitates a sharp characterisation of the different input parameters, especially radionuclide emanation coefficients ϵ . Nevertheless, using a range of published estimates for ϵ values, we found that measured activity ratios in the plume of Mount Etna are most likely explained by a magma residence time in the degassing reservoir of 500–1000 days and a transfer time no longer than seven days. These figures correspond to a volume of degassing magma of about 0.15 k m 3 with an exsolution depth of no more than 5 km bsl. This volume of magma and its location in the shallowest part of the volcanic edifice suggests that most of the degassing process takes place within the shallow feeding system of Etna whose dynamics controls eruptive activity at the summit craters.
Further studies should now be devoted to direct measurements of 222Rn activity in diluted volcanic plumes in order to provide evidence of radon enrichments. It will have further implications, notably in better deciphering 210Pb-210Bi-210Po desequilibria in volcanic gases, including at basaltic volcanoes from other geodynamical settings.

Acknowledgments

This work was initiated in the frame of the MEDiterranean SUpersite Volcanoes (MED-SUV) project (funding from the European Union Seventh Framework Programme (FP7) under Grant agreement No. 308665). It was also part of EtnaPlumeLab-Radioactive Aerosols (EPL-RADIO) project funded by ENVRIplus project (EU Horizon 2020 research and innovation programme 498, grant agreement No. 654182). Département de Géosciences, Ecole Normale Supérieure, Laboratoire Magmas et Volcans (through the ANR DegazMag) and Observatoire de Physique du Globe de Clermont-Ferrand provided additional funding and support and are all acknowledged. This paper benefitted from comments from two anonymous reviewers who are greatly acknowledged. This is ClerVolc contribution No. 282.

Author Contributions

All authors equally contributed to data acquisition in the field either through direct sampling of volcanic aerosols, remote-sensing measurements, or logistic support. Luca Terray and Pierre-J. Gauthier conceived the study and designed the degassing model; sample analyses were carried out by Pierre-J. Gauthier and numerical simulations were ran by Luca Terray Furthermore, Luca Terray wrote the paper with the contribution of all authors.

Conflicts of Interest

The authors declare no conflict of interest.

Appendix A

Activities of 210Bi and 210Po in the gas phase are determined by following the procedure described in Section 3.2.2. Corresponding expressions are reproduced hereafter:
( 210 Bi ) G = λ Bi D Pb × λ Pb 1 f 1 α + 1 τ λ Pb D Pb + α + 1 α D Pb 1 τ ( A ) 0 + 1 τ ( A ) 0 × λ Bi D Bi + α + 1 α D Bi 1 τ 1 ,
( 210 Po ) G = λ Po D Bi λ Bi D Pb × λ Pb 1 f 1 α + 1 τ λ Pb D Pb + α + 1 α D Pb 1 τ ( A ) 0 + 1 τ ( A ) 0 λ Bi D Bi + α + 1 α D Bi 1 τ + 1 τ ( A ) 0 × λ Po D Po + α + 1 α D Po 1 τ 1 .

Appendix B

The system of equations describing the evolution in time of the activities in a decay chain is often referred to as Bateman equations. The solution of Bateman equations can be written using matrices [39]. This compact formalism is much more convenient to implement in a numeric code. Bateman equations solution is given by Equation (14). Two matrices (M and its inverse matrix M 1 ) appear in the equation. These matrices are equal to:
M = 1 0 0 0 λ Rn λ Pb λ Rn 1 0 0 λ Pb λ Bi λ Rn λ Rn λ Pb λ Rn λ Pb λ Bi λ Pb 1 0 λ Bi λ Po λ Rn λ Pb λ Bi λ Rn λ Rn λ Pb λ Rn λ Bi λ Po λ Pb λ Pb λ Bi λ Pb λ Bi λ Po λ Bi 1 ,
M 1 = 1 0 0 0 λ Rn λ Rn λ Pb 1 0 0 λ Rn λ Rn λ Bi λ Pb λ Pb λ Bi λ Pb λ Pb λ Bi 1 0 λ Rn λ Rn λ Po λ Pb λ Pb λ Po λ Bi λ Bi λ Po λ Pb λ Pb λ Po λ Bi λ Bi λ Po λ Bi λ Bi λ Po 1 ,
where λ Rn , λ Pb , λ Bi and λ Po are the radioactive decay constants of 222Rn, 210Pb, 210Bi and 210Po, respectively.

References

  1. Caltabiano, T.; Burton, M.; Giammanco, S.; Allard, P.; Bruno, N.; Mure, F.; Romano, R. Volcanic gas emissions from the summit craters and flanks of Mt. Etna, 1987–2000. In Mt. Etna: Volcano Laboratory; Wiley: Hoboken, NJ, USA, 2004; pp. 111–128. [Google Scholar]
  2. Wallace, P.J. Volatiles in subduction zone magmas: Concentrations and fluxes based on melt inclusion and volcanic gas data. J. Volcanol. Geotherm. Res. 2005, 140, 217–240. [Google Scholar] [CrossRef]
  3. Shinohara, H. Excess degassing from volcanoes and its role on eruptive and intrusive activity. Rev. Geophys. 2008, 46. [Google Scholar] [CrossRef]
  4. Allard, P. Endogenous magma degassing and storage at Mount Etna. Geophys. Res. Lett. 1997, 24, 2219–2222. [Google Scholar] [CrossRef]
  5. Bonaccorso, A.; Bonforte, A.; Currenti, G.; Negro, C.D.; Stefano, A.D.; Greco, F. Magma storage, eruptive activity and flank instability: Inferences from ground deformation and gravity changes during the 1993–2000 recharging of Mt. Etna volcano. J. Volcanol. Geotherm. Res. 2011, 200, 245–254. [Google Scholar] [CrossRef]
  6. Sharma, K.; Blake, S.; Self, S.; Krueger, A.J. SO2 emissions from basaltic eruptions, and the excess sulfur issue. Geophys. Res. Lett. 2004, 31, L13612. [Google Scholar] [CrossRef]
  7. Steffke, A.M.; Harris, A.J.; Burton, M.; Caltabiano, T.; Salerno, G.G. Coupled use of COSPEC and satellite measurements to define the volumetric balance during effusive eruptions at Mt. Etna, Italy. J. Volcanol. Geotherm. Res. 2011, 205, 47–53. [Google Scholar] [CrossRef]
  8. Schiano, P.; Clocchiatti, R.; Ottolini, L.; Busa, T. Transition of Mount Etna lavas from a mantle-plume to an island-arc magmatic source. Nature 2001, 412, 900–904. [Google Scholar] [CrossRef] [PubMed]
  9. Kazahaya, K.; Shinohara, H.; Saito, G. Excessive degassing of Izu-Oshima volcano: Magma convection in a conduit. Bull. Volcanol. 1994, 56, 207–216. [Google Scholar] [CrossRef]
  10. Stevenson, D.S.; Blake, S. Modelling the dynamics and thermodynamics of volcanic degassing. Bull. Volcanol. 1998, 60, 307–317. [Google Scholar] [CrossRef]
  11. Beckett, F.; Burton, M.; Mader, H.; Phillips, J.; Polacci, M.; Rust, A.; Witham, F. Conduit convection driving persistent degassing at basaltic volcanoes. J. Volcanol. Geotherm. Res. 2014, 283, 19–35. [Google Scholar] [CrossRef]
  12. Ferlito, C.; Coltorti, M.; Lanzafame, G.; Giacomoni, P.P. The volatile flushing triggers eruptions at open conduit volcanoes: Evidence from Mount Etna volcano (Italy). Lithos 2014, 184, 447–455. [Google Scholar] [CrossRef]
  13. Moretti, R.; Métrich, N.; Arienzo, I.; Renzo, V.D.; Aiuppa, A.; Allard, P. Degassing vs. eruptive styles at Mt. Etna volcano (Sicily, Italy). Part I: Volatile stocking, gas fluxing, and the shift from low-energy to highly explosive basaltic eruptions. Chem. Geol. 2017. [Google Scholar] [CrossRef]
  14. Lambert, G.; Le Cloarec, M.F.; Ardouin, B.; Le Roulley, J.C. Volcanic emission of radionuclides and magma dynamics. Earth Planet. Sci. Lett. 1985, 76, 185–192. [Google Scholar] [CrossRef]
  15. Gauthier, P.J.; Le Cloarec, M.F.; Condomines, M. Degassing processes at Stromboli volcano inferred from short-lived disequilibria (210Pb–210Bi–210Po) in volcanic gases. J. Volcanol. Geotherm. Res. 2000, 102, 1–19. [Google Scholar] [CrossRef]
  16. Lambert, G.; Bristeau, P.; Polian, G. Emission and enrichments of radon daughters from Etna volcano magma. Geophys. Res. Lett. 1976, 3, 724–726. [Google Scholar] [CrossRef]
  17. Pennisi, M.; Le Cloarec, M.F.; Lambert, G.; Le Roulley, J.C. Fractionation of metals in volcanic emissions. Earth Planet. Sci. Lett. 1988, 88, 284–288. [Google Scholar] [CrossRef]
  18. Le Cloarec, M.F.; Pennisi, M.; Ardouin, B.; Le Roulley, J.C.; Lambert, G. Relationship between gases and volcanic activity of Mount Etna in 1986. J. Geophys. Res. Solid Earth 1988, 93, 4477–4484. [Google Scholar] [CrossRef]
  19. Le Cloarec, M.F.; Pennisi, M. Radionuclides and sulfur content in Mount Etna plume in 1983–1995: New constraints on the magma feeding system. J. Volcanol. Geotherm. Res. 2001, 108, 141–155. [Google Scholar] [CrossRef]
  20. Allard, P.; Aiuppa, A.; Bani, P.; Métrich, N.; Bertagnini, A.; Gauthier, P.J.; Shinohara, H.; Sawyer, G.; Parello, F.; Bagnato, E.; et al. Prodigious emission rates and magma degassing budget of major, trace and radioactive volatile species from Ambrym basaltic volcano, Vanuatu island Arc. J. Volcanol. Geotherm. Res. 2016, 322, 119–143. [Google Scholar] [CrossRef]
  21. Gauthier, P.J.; Sigmarsson, O.; Gouhier, M.; Haddadi, B.; Moune, S. Elevated gas flux and trace metal degassing from the 2014–2015 fissure eruption at the Bárðarbunga volcanic system, Iceland. J. Geophys. Res. Solid Earth 2016, 121, 1610–1630. [Google Scholar] [CrossRef]
  22. Le Cloarec, M.F.; Lambert, G.; Le Guern, F.; Ardouin, B. Echanges de matériaux volatils entre phase solide, liquide et gazeuse au cours de l’éruption de l’Etna de 1983. Comptes-Rendus des Séances de l’Académie des Sciences. Série 2, Mécanique-Physique, Chimie, Sciences de l’univers, Sciences de la terre 1984, 298, 805–808. (In French) [Google Scholar]
  23. Le Cloarec, M.F.; Lambert, G.; Ardouin, B. Isotopic enrichment of 210Pb in gaseous emission from Mount Etna (Sicily). Chem. Geol. 1988, 70, 128. [Google Scholar] [CrossRef]
  24. Behncke, B.; Branca, S.; Corsaro, R.A.; Beni, E.D.; Miraglia, L.; Proietti, C. The 2011–2012 summit activity of Mount Etna: Birth, growth and products of the new SE crater. J. Volcanol. Geotherm. Res. 2014, 270, 10–21. [Google Scholar] [CrossRef]
  25. Geryes, T.; Monsanglant-Louvet, C. Determination of correction factors for alpha activity measurements in the environment (conditions of high dust loading). Radiat. Prot. Dosim. 2010, 144, 659–662. [Google Scholar] [CrossRef] [PubMed]
  26. Mather, T.A. Volcanoes and the environment: Lessons for understanding Earth’s past and future from studies of present-day volcanic emissions. J. Volcanol. Geotherm. Res. 2015, 304, 160–179. [Google Scholar] [CrossRef]
  27. Gill, J.; Williams, R.; Bruland, K. Eruption of basalt and andesite lava degasses 222Rn and 210Po. Geophys. Res. Lett. 1985, 12, 17–20. [Google Scholar] [CrossRef]
  28. Reagan, M.; Tepley, F.J.; Gill, J.B.; Wortel, M.; Hartman, B. Rapid time scales of basalt to andesite differentiation at Anatahan volcano, Mariana Islands. J. Volcanol. Geotherm. Res. 2005, 146, 171–183. [Google Scholar] [CrossRef]
  29. Sigmarsson, O.; Condomines, M.; Gauthier, P.J. Excess 210Po in 2010 Eyjafjallajökull tephra (Iceland): Evidence for pre-eruptive gas accumulation. Earth Planet. Sci. Lett. 2015, 427, 66–73. [Google Scholar] [CrossRef]
  30. Girard, G.; Reagan, M.K.; Sims, K.W.W.; Thornber, C.R.; Waters, C.L.; Phillips, E.H. 238U–230Th–226Ra–210Pb–210Po Disequilibria Constraints on Magma Generation, Ascent, and Degassing during the Ongoing Eruption of Kīlauea. J. Petrol. 2017, 58, 1199–1226. [Google Scholar] [CrossRef]
  31. Gauthier, P.J.; Le Cloarec, M.F. Variability of alkali and heavy metal fluxes released by Mt. Etna volcano, Sicily, between 1991 and 1995. J. Volcanol. Geotherm. Res. 1998, 81, 311–326. [Google Scholar] [CrossRef]
  32. Aiuppa, A.; Dongarrà, G.; Valenza, M.; Federico, C.; Pecoraino, G. Degassing of trace volatile metals during the 2001 eruption of Etna. In Volcanism and the Earth’s Atmosphere; Wiley: Hoboken, NJ, USA, 2003; pp. 41–54. [Google Scholar]
  33. Kayzar, T.M.; Cooper, K.M.; Reagan, M.K.; Kent, A.J. Gas transport model for the magmatic system at Mount Pinatubo, Philippines: Insights from (210Pb)/(226Ra). J. Volcanol. Geotherm. Res. 2009, 181, 124–140. [Google Scholar] [CrossRef]
  34. Condomines, M.; Sigmarsson, O.; Gauthier, P. A simple model of 222Rn accumulation leading to 210Pb excesses in volcanic rocks. Earth Planet. Sci. Lett. 2010, 293, 331–338. [Google Scholar] [CrossRef]
  35. Berlo, K.; Turner, S. 210Pb-226Ra disequilibria in volcanic rocks. Earth Planet. Sci. Lett. 2010, 296, 155–164. [Google Scholar] [CrossRef]
  36. Reagan, M.; Turner, S.; Handley, H.; Turner, M.; Beier, C.; Caulfield, J.; Peate, D. 210Pb-226Ra disequilibria in young gas-laden magmas. Sci. Rep. 2017, 7, 45186. [Google Scholar] [CrossRef] [PubMed]
  37. Gauthier, P.J.; Condomines, M. 210Pb–226Ra radioactive disequilibria in recent lavas and radon degassing: Inferences on the magma chamber dynamics at Stromboli and Merapi volcanoes. Earth Planet. Sci. Lett. 1999, 172, 111–126. [Google Scholar] [CrossRef]
  38. Bateman, H. The solution of a system of differential equations occurring in the theory of radioactive transformations. Proc. Camb. Philos. Soc. 1910, 15, 423–427. [Google Scholar]
  39. Moral, L.; Pacheco, A. Algebraic approach to the radioactive decay equations. Am. J. Phys. 2003, 71, 684–686. [Google Scholar] [CrossRef]
  40. Gauthier, P.J.; Condomines, M.; Hammouda, T. An experimental investigation of radon diffusion in an anhydrous andesitic melt at atmospheric pressure: Implications for radon degassing from erupting magmas. Geochim. Cosmochim. Acta 1999, 63, 645–656. [Google Scholar] [CrossRef]
  41. Métrich, N.; Allard, P.; Spilliaert, N.; Andronico, D.; Burton, M. 2001 flank eruption of the alkali- and volatile-rich primitive basalt responsible for Mount Etna’s evolution in the last three decades. Earth Planet. Sci. Lett. 2004, 228, 1–17. [Google Scholar] [CrossRef]
  42. Spilliaert, N.; Métrich, N.; Allard, P. S–Cl–F degassing pattern of water-rich alkali basalt: Modelling and relationship with eruption styles on Mount Etna volcano. Earth Planet. Sci. Lett. 2006, 248, 772–786. [Google Scholar] [CrossRef]
  43. Sato, K.; Sato, J. Estimation of gas-releasing efficiency of erupting magma from 226Ra–222Rn disequilibrium. Nature 1977, 266, 439–440. [Google Scholar] [CrossRef]
  44. Sato, K.; Kaneoka, I.; Sato, J. Rare-gas releasing experiments and Rn degassing from erupting magma. Geochem. J. 1980, 14, 91–94. [Google Scholar] [CrossRef]
  45. Condomines, M.; Tanguy, J.C.; Michaud, V. Magma dynamics at Mt Etna: Constraints from U-Th-Ra-Pb radioactive disequilibria and Sr isotopes in historical lavas. Earth Planet. Sci. Lett. 1995, 132, 25–41. [Google Scholar] [CrossRef]
  46. Armienti, P.; Pareschi, M.; Innocenti, F.; Pompilio, M. Effects of magma storage and ascent on the kinetics of crystal growth. Contrib. Mineral. Petrol. 1994, 115, 402–414. [Google Scholar] [CrossRef]
  47. Allard, P.; Behncke, B.; D’Amico, S.; Neri, M.; Gambino, S. Mount Etna 1993–2005: Anatomy of an evolving eruptive cycle. Earth-Sci. Rev. 2006, 78, 85–114. [Google Scholar] [CrossRef]
Figure 1. 238U decay chain. Half-lives are indicated beneath the symbol of the element. Minor embranchments are not reproduced.
Geosciences 08 00027 g001
Figure 2. Map of Mount Etna summital zone in 2012 (aerial photography from Italian Geoportal). CC stands for Central Craters (Voragine and Bocca Nuova), NEC for northeast Crater and NSEC for new southeast Crater. Sampling sites (TDF1, TDF2-3, TDF4 and TDF5-6, where TDF stands for Torre del Filosofo) are pointed on the map.
Geosciences 08 00027 g002
Figure 3. Volumic activities in the plume. Bars represent one sigma errors and are derived from the uncertainty of radioactivity analysis. Full lines represent the linear regression between the points and the origin, and dotted lines represent two sigma standard error on the slope of the regression trend.
Geosciences 08 00027 g003
Figure 4. Radioactive disequilibria (a) (210Bi/210Pb) and (b) (210Po/210Pb) in the gas phase versus magma residence time in the degassing reservoir according to the new model (plain lines) and according the model of Gauthier et al. [15] (dashed lines). Curves for several values of transfer time θ (0, 1 h, 1, 5 and 30 days) are drawn. Fixed parameters of the model are α = 5 wt.%, f = 1 , ϵ Pb = 1.5 % , ϵ Bi = 36 % et ϵ Po = 100 % .
Geosciences 08 00027 g004
Figure 5. Histograms of the model parameters ( α , f, ϵ Pb , ϵ Bi , ϵ Po ) for which the model can explain the measurements. The horizontal bar represents the uniform law used to generate random values. This line corresponds to the theoretical histogram that would be obtained for a parameter having no influence on the production of simulated results matching measured activity ratios. Its frequency is not relevant in itself and is merely equal to the reciprocal of the number of bars in the histogram.
Geosciences 08 00027 g005
Figure 6. Histograms of the dynamic parameters ( τ and θ ) for which the model can explain the measurements. The horizontal bar represents the uniform law used to generate random values. See the caption of Figure 5 for further details.
Geosciences 08 00027 g006
Figure 7. Scatter plot of the dynamic parameters ( τ versus θ ) for which the model can explain the measurements.
Geosciences 08 00027 g007
Table 1. 210Pb-210Bi-210Po radioactivity in Mount Etna plume. Sample names correspond to sampling sites as described in Figure 2. Activities are reported in mBq / m 3 with 1- σ uncertainties. “bdl” stands for below detection limit. Sampling starting time is expressed in local time.
SampleDate and timeVolume (m3)210Pb210Bi210Po
Atmospheric blank11/05/2015 12:003.9bdlbdlbdl
TDF112/05/2015 12:073.9bdlbdlbdl
TDF213/05/2015 11:046.60.8 ± 0.23.1 ± 114.6 ± 0.7
TDF313/05/2015 12:156.6bdlbdlbdl
TDF414/05/2015 10:511.73.5 ± 1.029 ± 5212 ± 3
TDF5A14/05/2015 11:383.94.0 ± 0.431 ± 3162 ± 2
TDF5B14/05/2015 11:383.08.2 ± 0.462 ± 2349± 2
TDF614/05/2015 12:316.65.9 ± 0.241 ± 2217 ± 1
Table 2. Ranges of value regarding each parameter for the simulation.
ParameterRangeReferences
α (wt.%)4–5Métrich et al. [41], Spilliaert et al. [42]
f0.9–1Gill et al. [27], Gauthier et al. [40], Sato and Sato [43], Sato et al. [44]
ϵ Pb (%)0.7–1.5Lambert et al. [14], Mather [26]
ϵ Bi (%)20–45Lambert et al. [14], Pennisi et al. [17]
ϵ Po (%)80–100Le Cloarec et al. [22], Gill et al. [27], Reagan et al. [28], Girard et al. [30]

