The Integrated System of Hydrological Forecasting in the Ussuri River Basin Based on the ECOMAG Model

 , ,
, ,  ,
,
Abstract
:1. Introduction
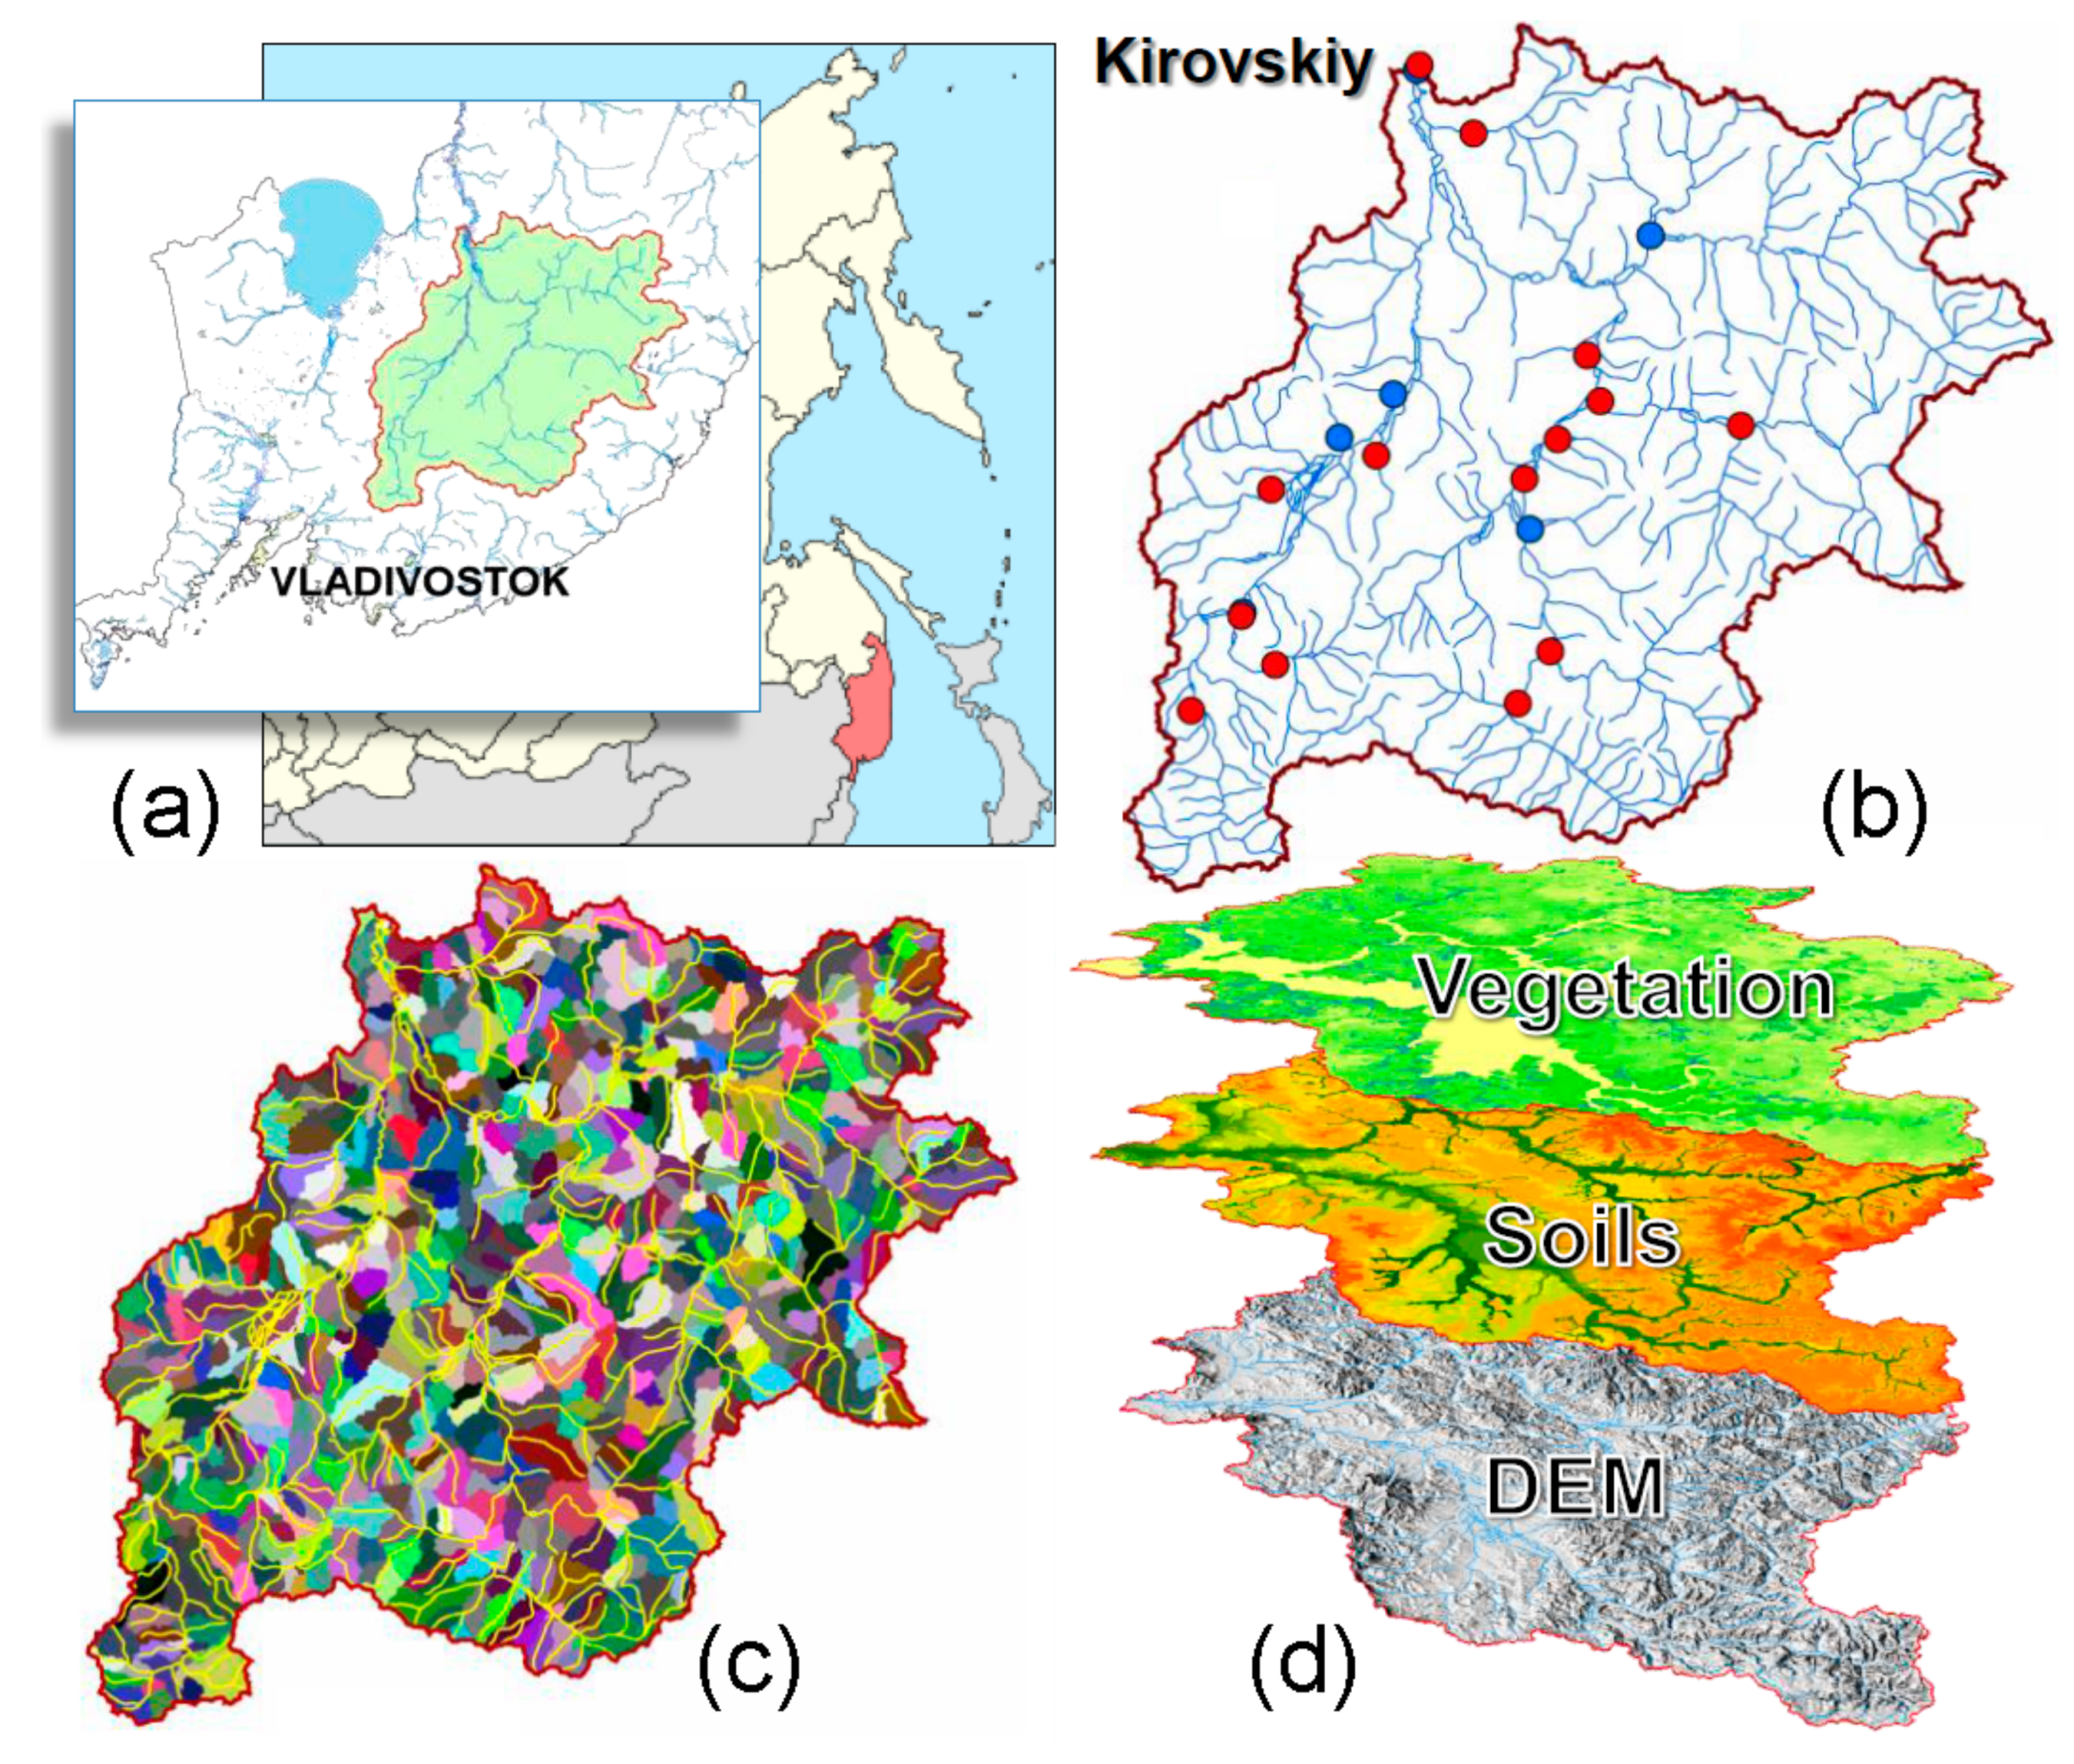
2. Case Study
3. Materials and Methods
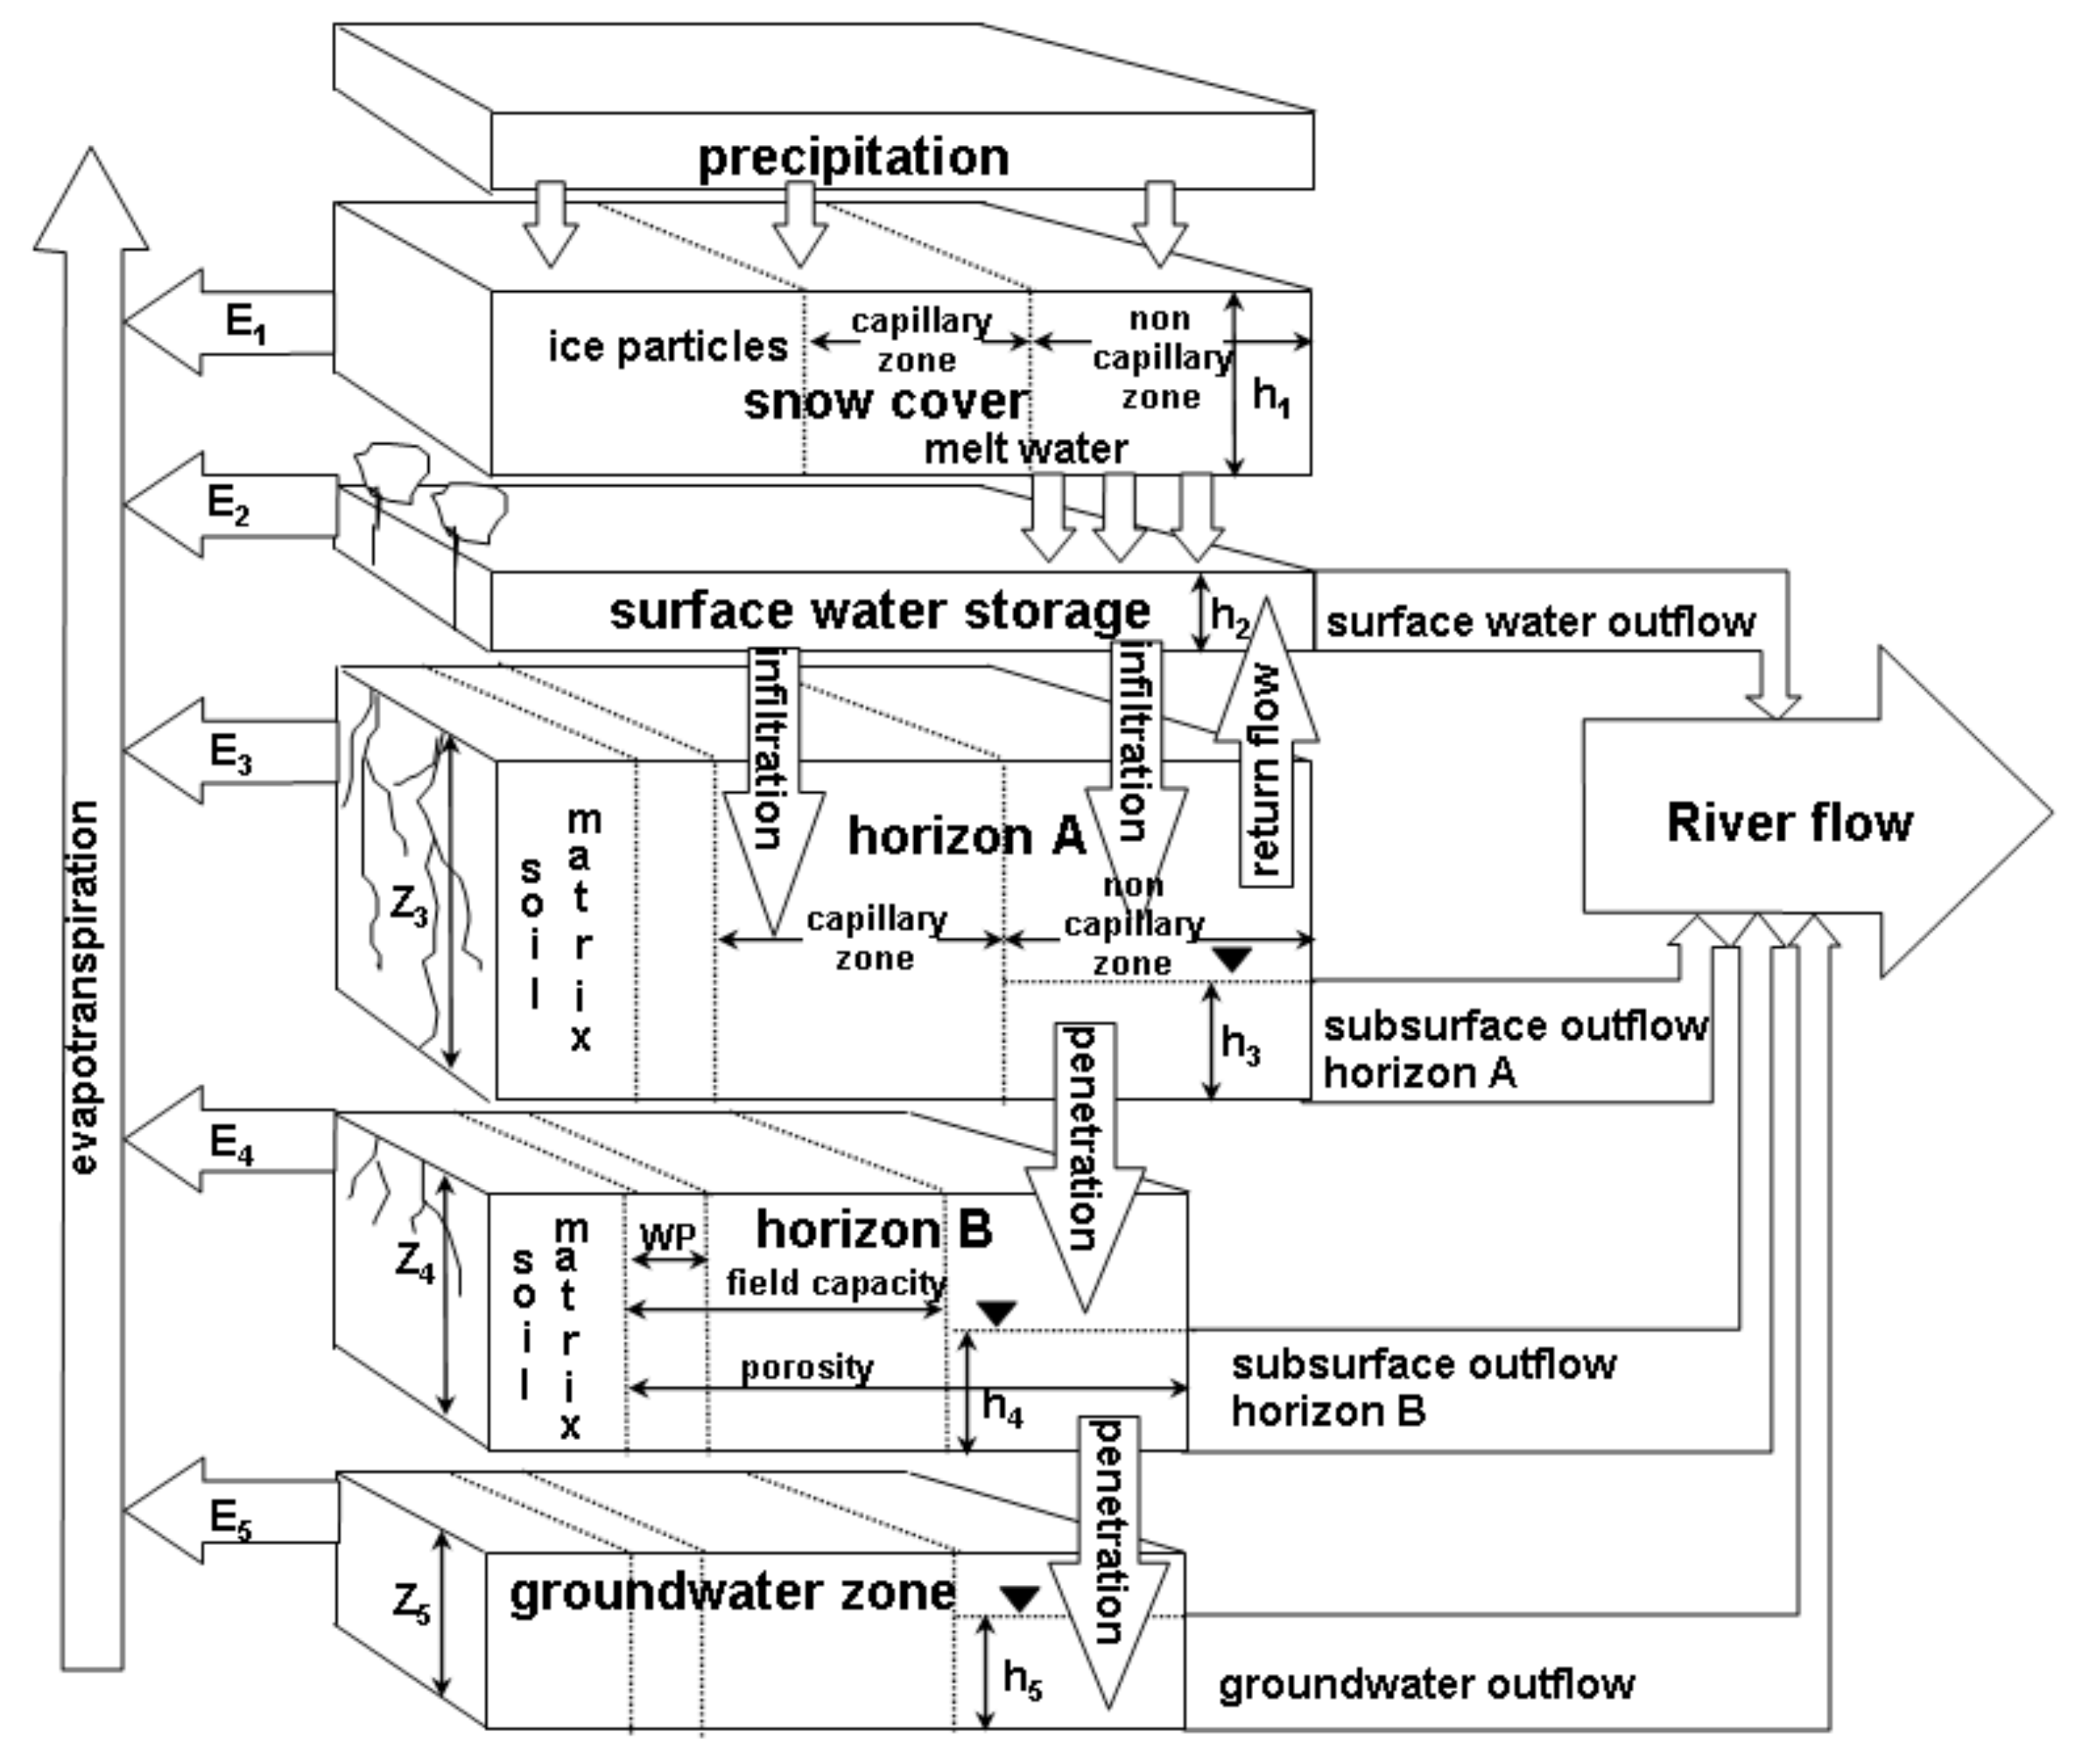
3.1. Information-Modeling Complex (IMC) ECOMAG
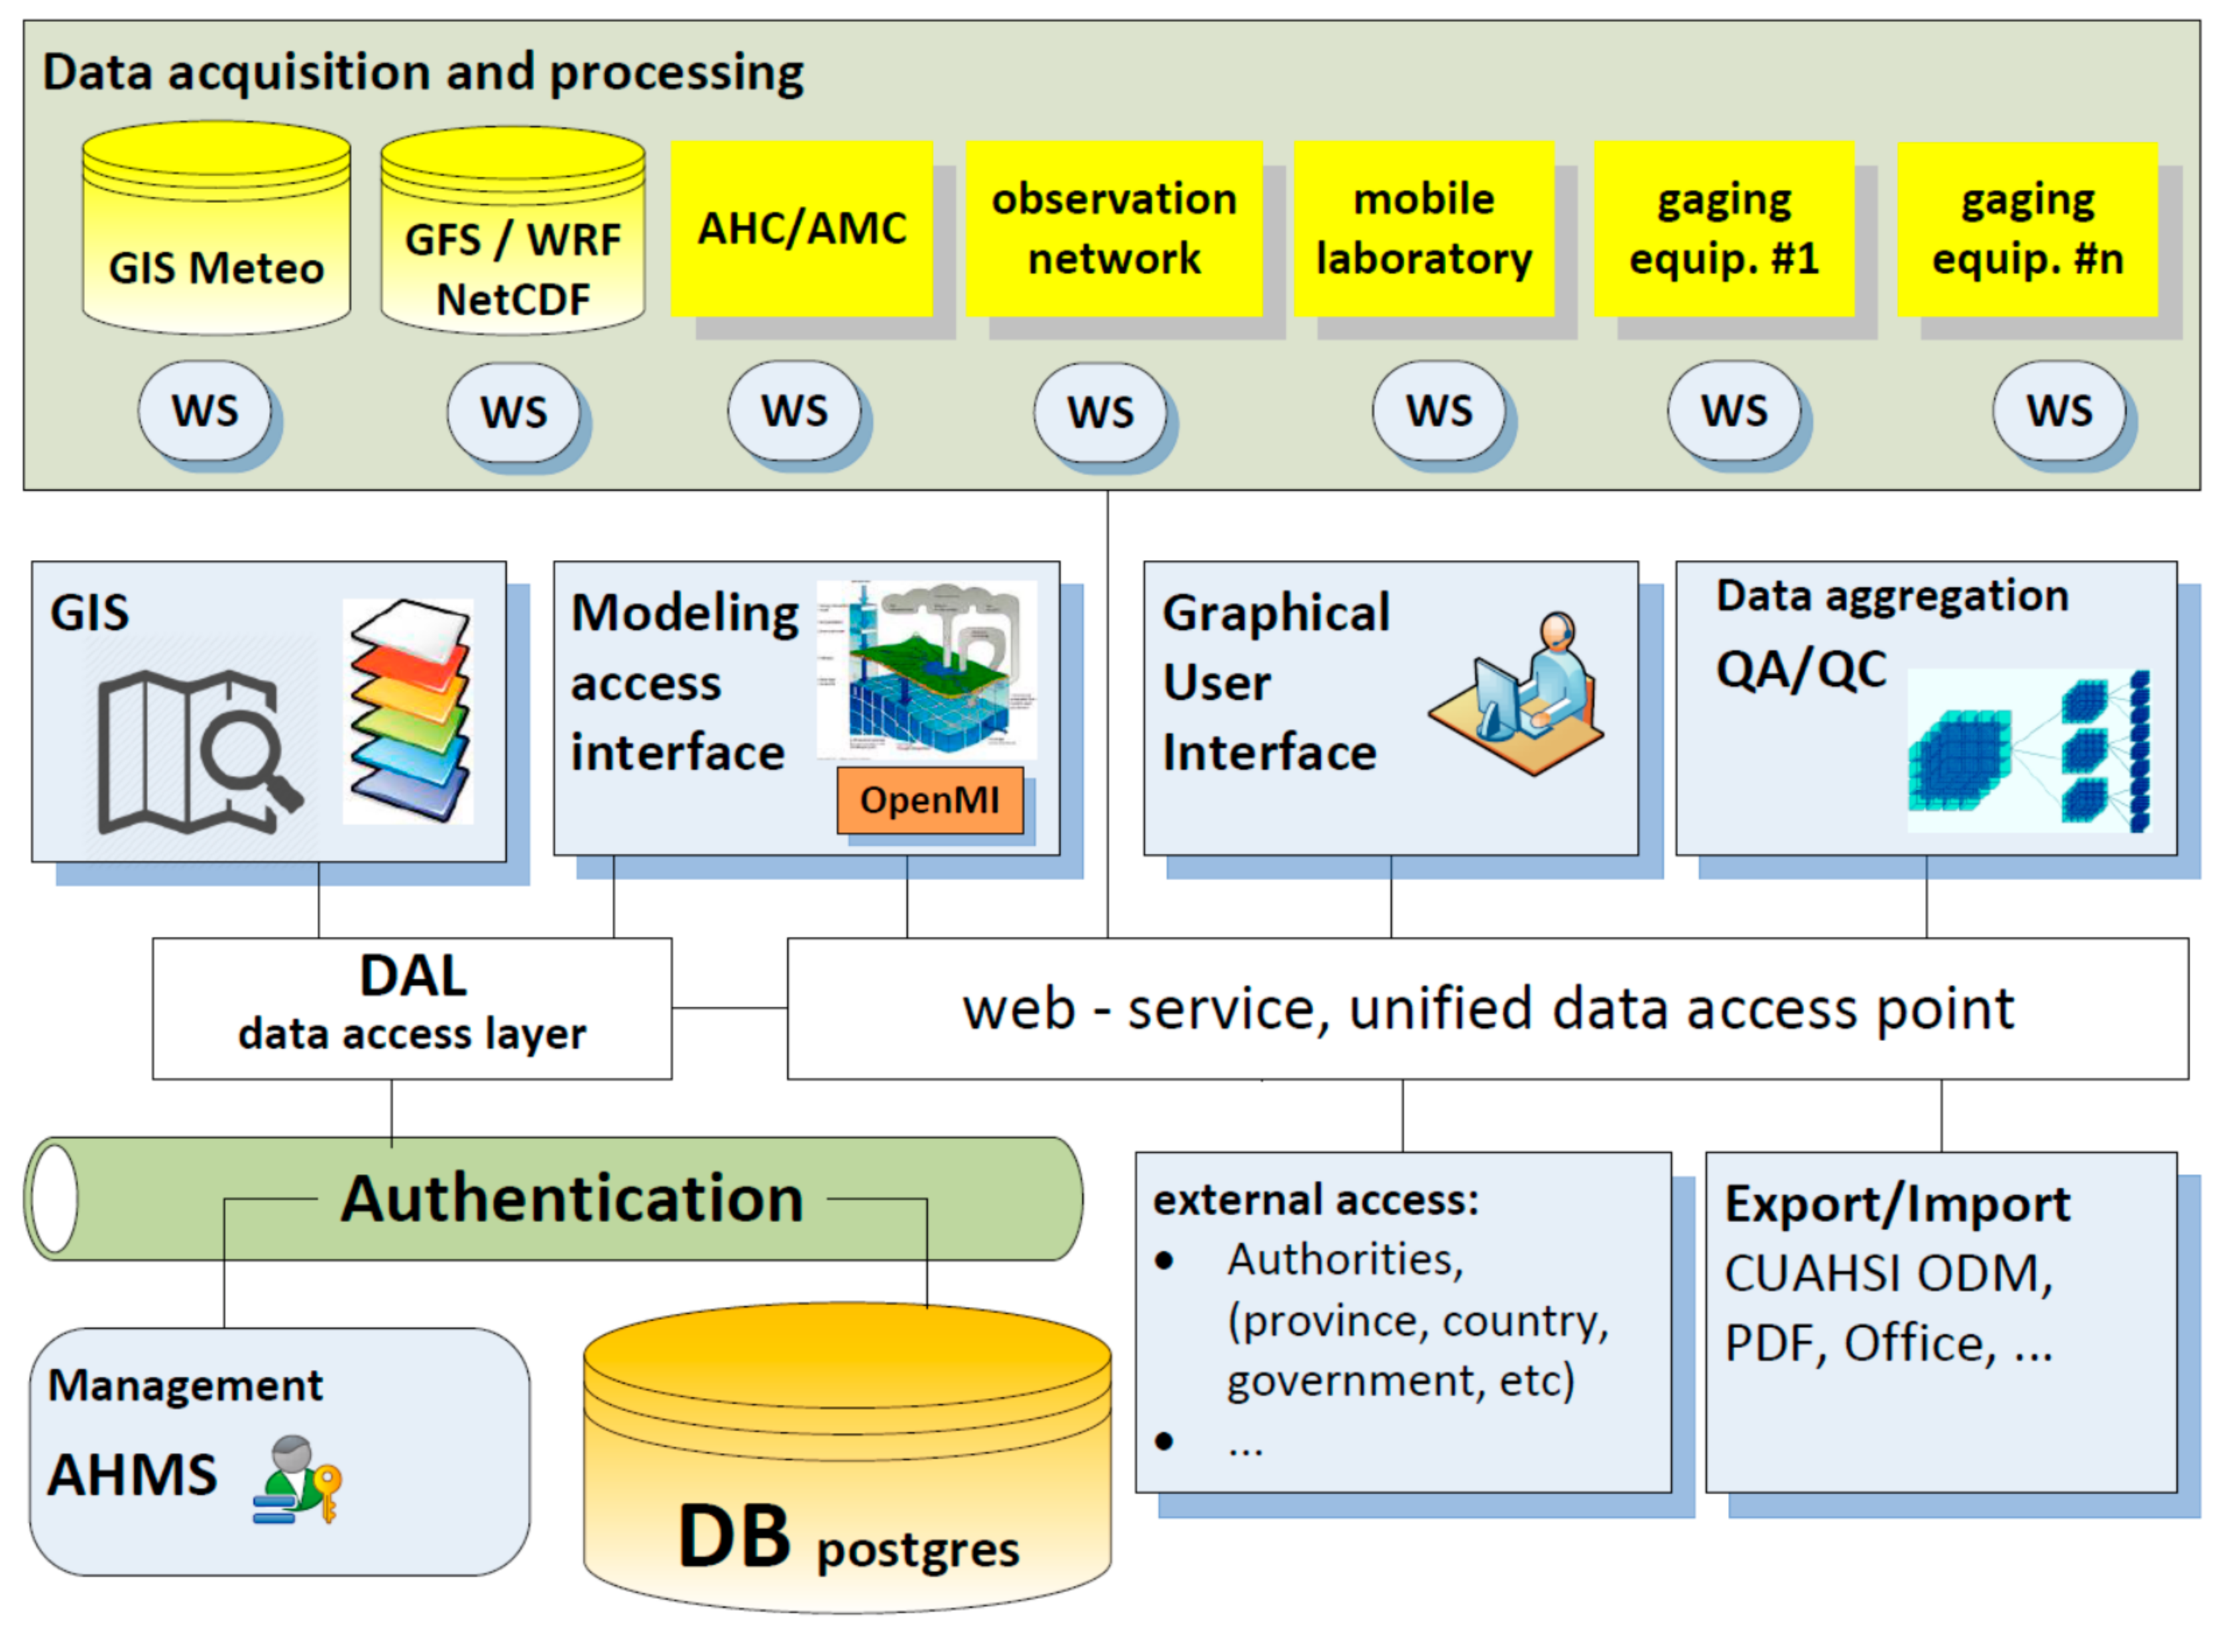
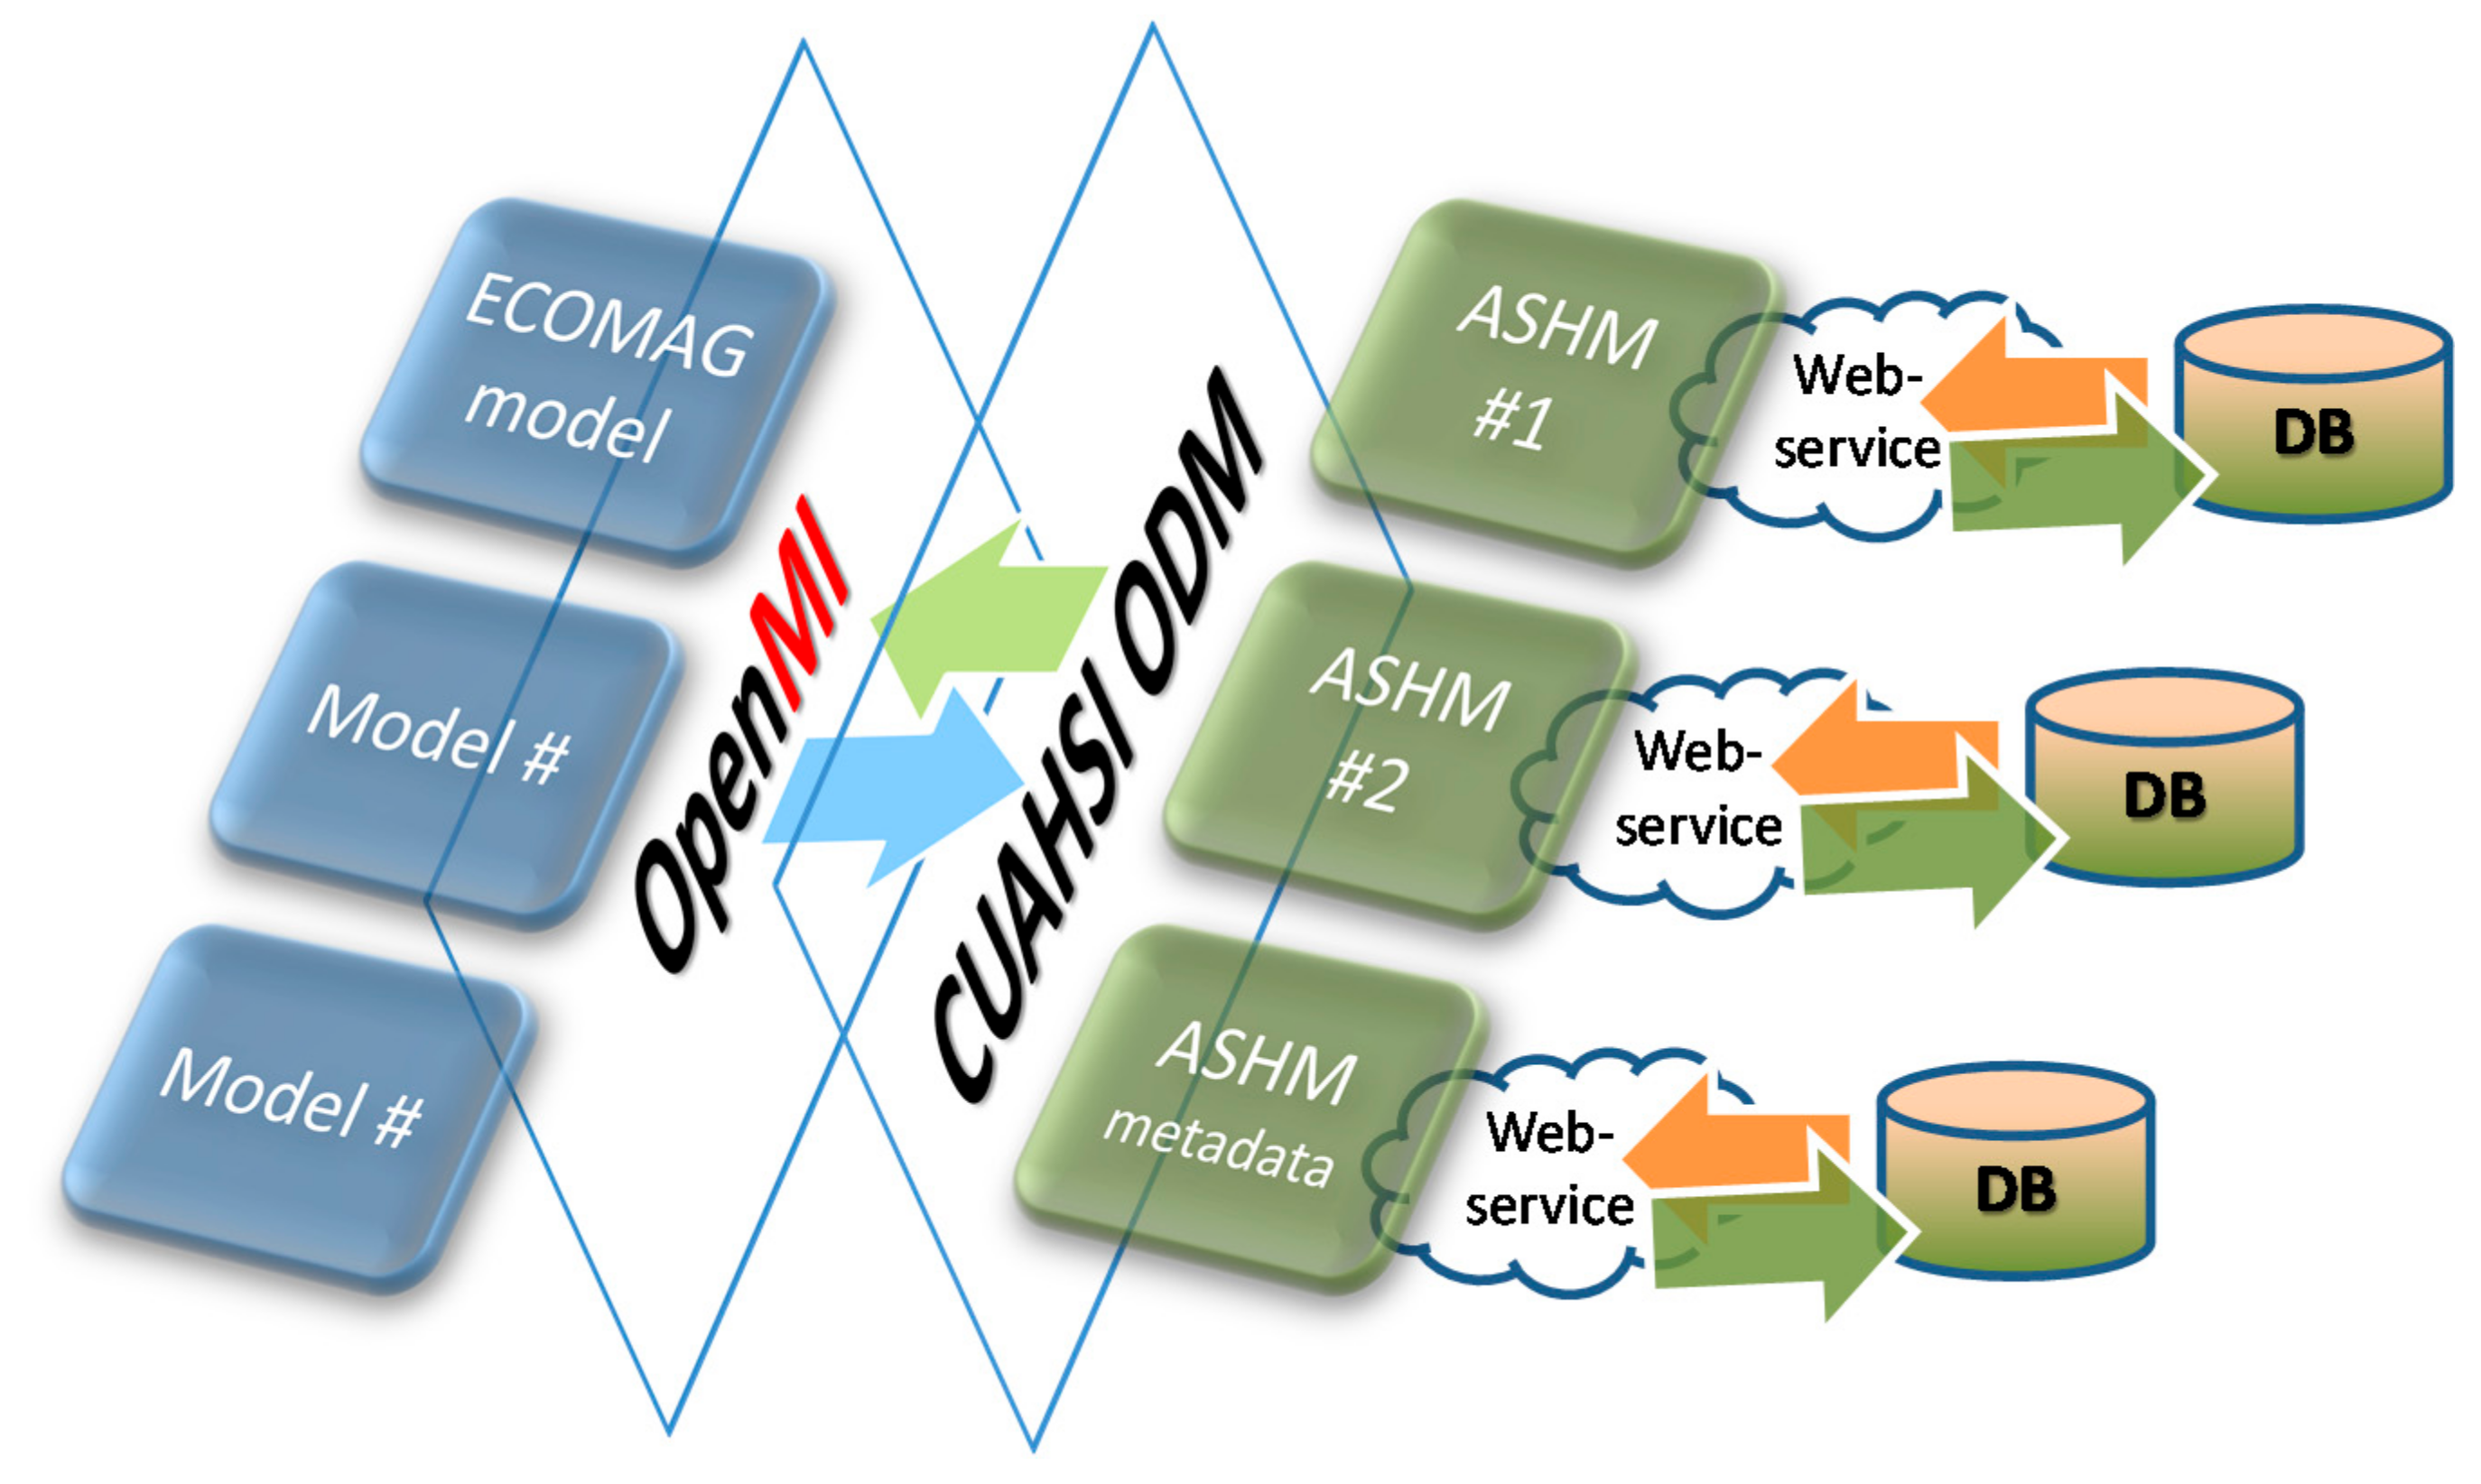
3.2. The Automated Hydrological Monitoring System (ASHM)
3.3. The ECOMAG Operational Scheme
4. Results and Discussion
4.1. Forecasting Scheme Performance Assessment Methodology
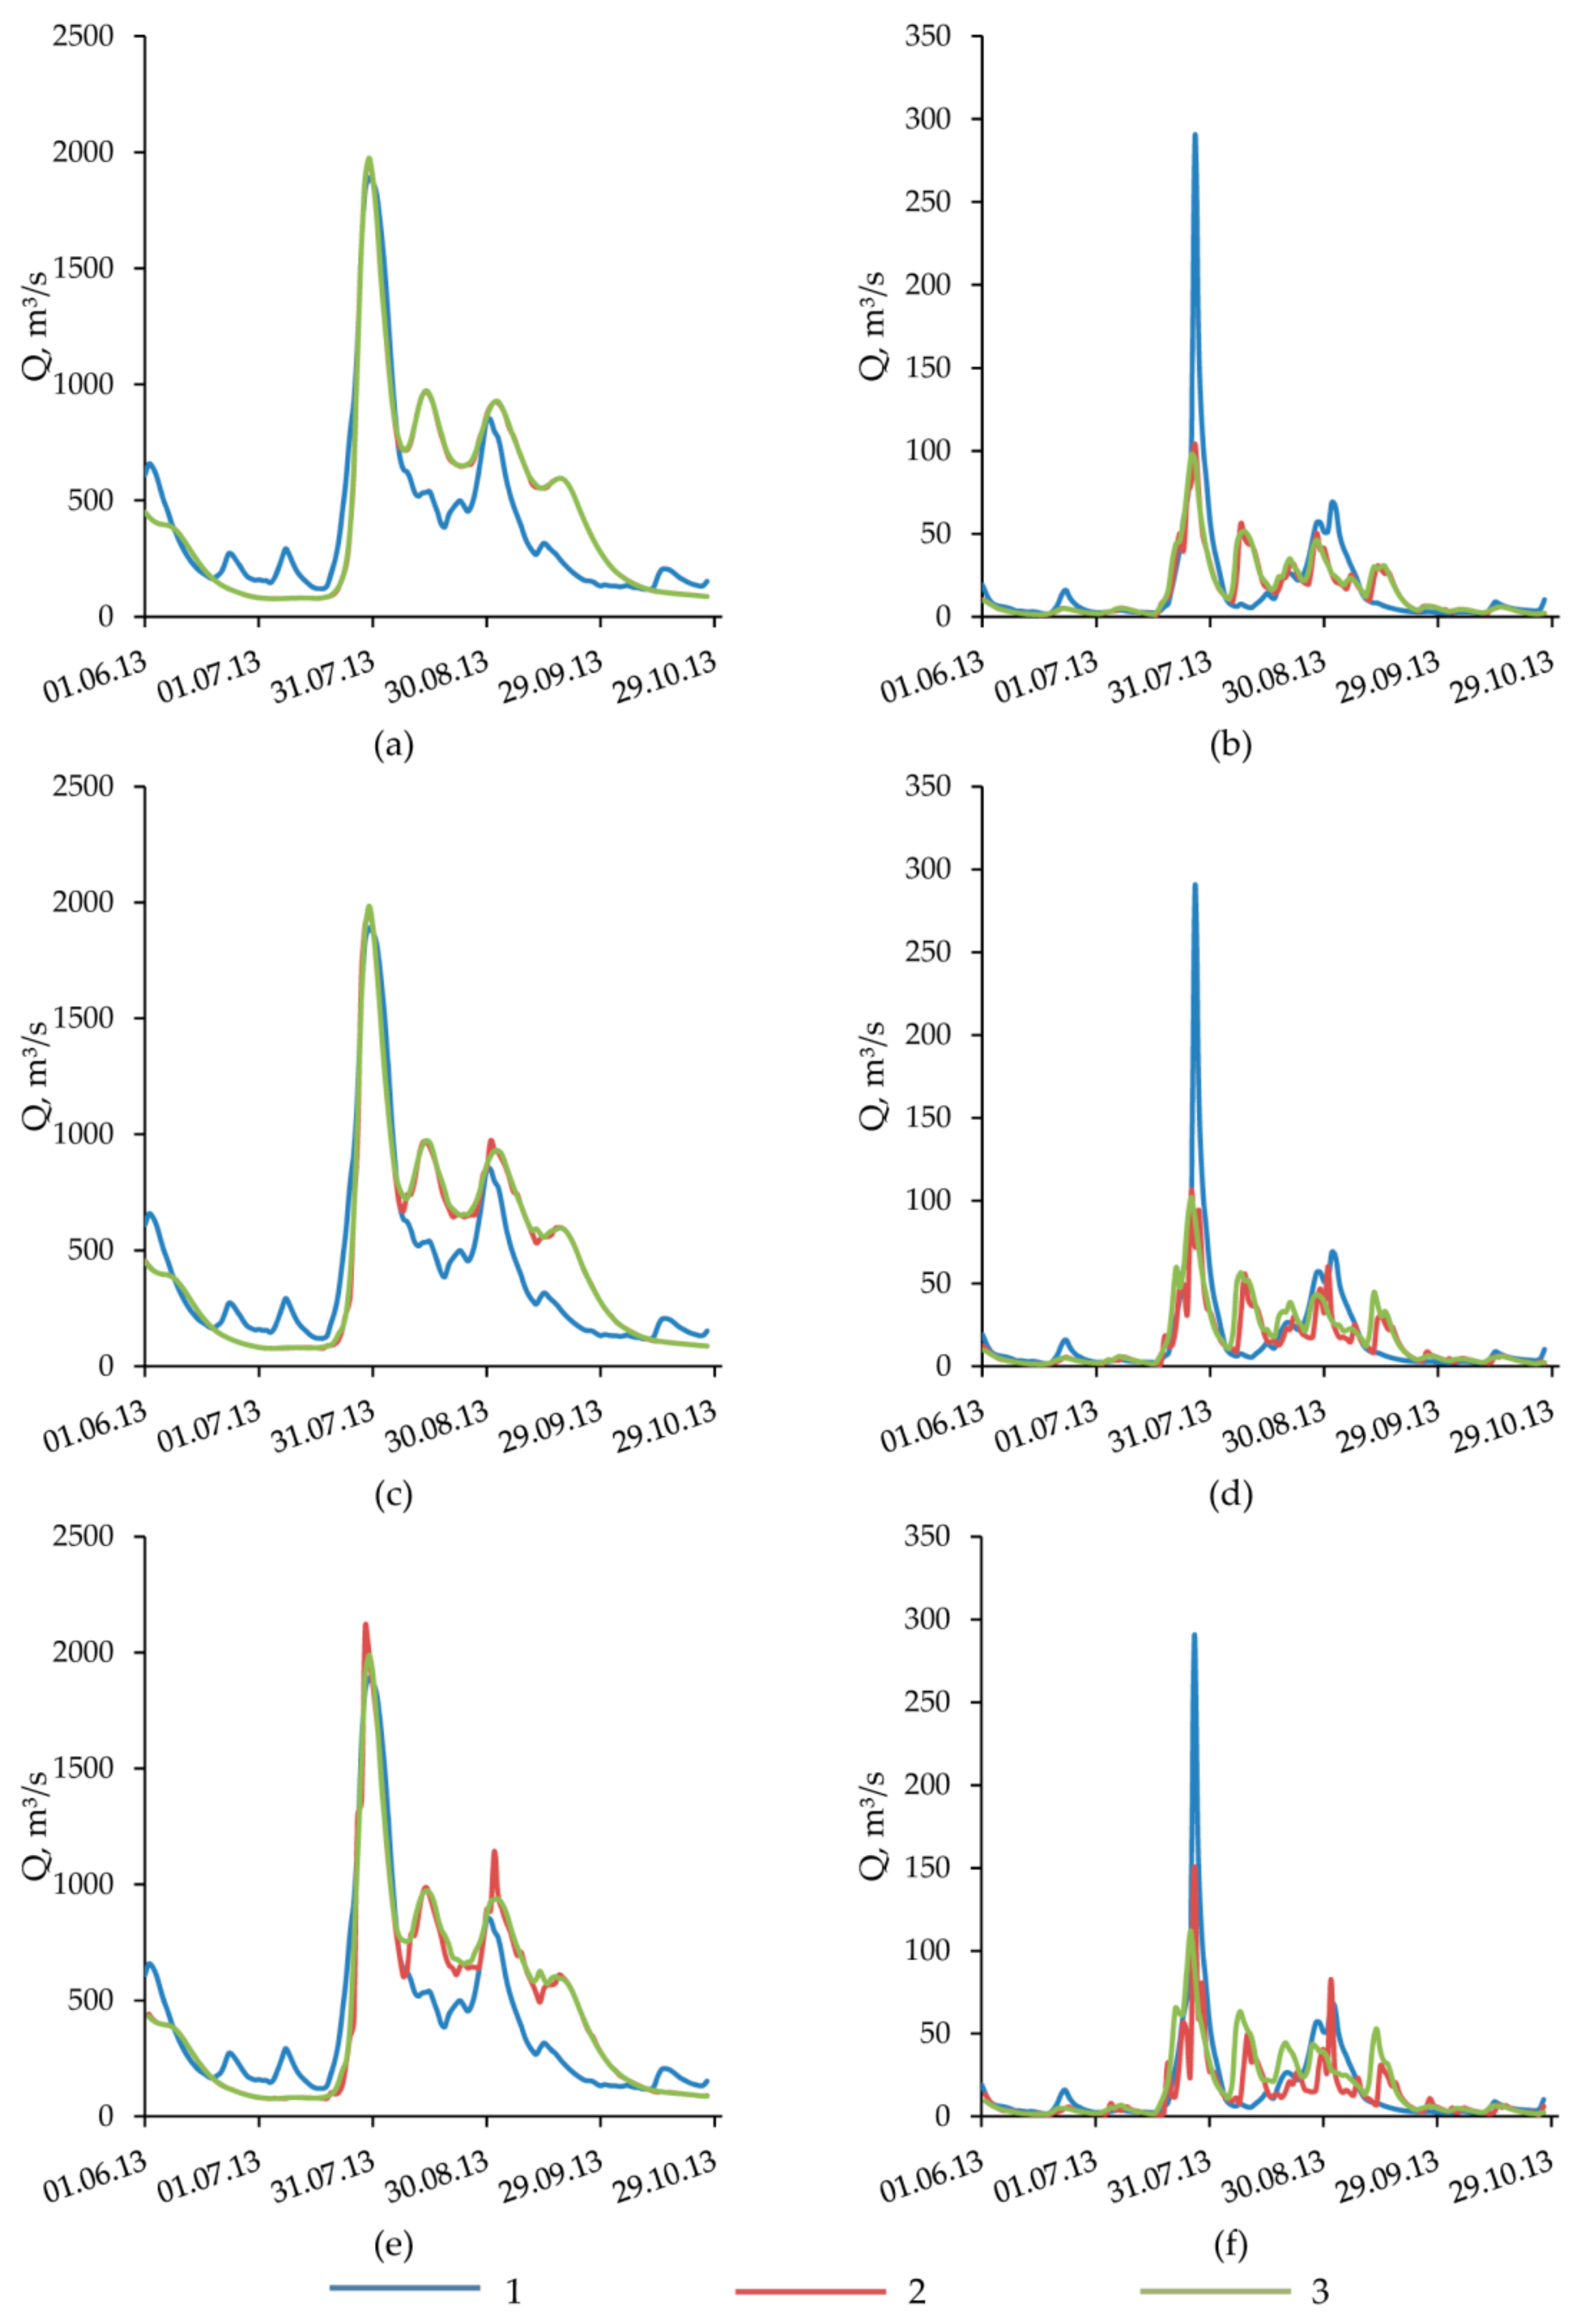
4.2. Short-Term Forecasts Verification for Extreme Rain Flood Events
5. Conclusions
Acknowledgments
Author Contributions
Conflicts of Interest
References
- Pagano, T.C.; Wood, A.W.; Ramos, M.-H.; Cloke, H.L.; Pappenberger, F.; Clark, M.P.; Cranston, M.; Kavetski, D.; Mathevet, T.; Sorooshian, S.; et al. Challenges of operational river forecasting. J. Hydrometeorol. 2014, 15, 1692–1707. [Google Scholar] [CrossRef]
- Molteni, F.; Buizza, R.; Palmer, T.N.; Petroliagis, T. The ECMWF ensemble prediction system: Methodology and validation. Q. J. R. Meteorol. Soc. 1996, 122, 73–119. [Google Scholar] [CrossRef]
- Barnier, B.; Siefridt, L.; Marchesiello, P. Thermal forcing for a global ocean circulation model using a three-year climatology of ECMWF analyses. J. Mar. Syst. 1995, 6, 363–380. [Google Scholar] [CrossRef]
- Skamarock, W.C.; Klemp, J.B.; Dudhia, J.; Gill, D.O.; Barker, D.M.; Wang, W.; Powers, J.G. A Description of the Advanced Research WRF Version 2; NCAR Technical Note NCAR/TN-468+STR; National Center for Atmospheric Research: Boulder, CO, USA, 2007. [Google Scholar]
- Takenaka, H.; Nakajima, T.Y.; Higurashi, A.; Higuchi, A.; Takamura, T.; Pinker, R.T.; Nakajima, T. Estimation of solar radiation using a neural network based on radiative transfer. J. Geophys. Res. 2011, 111. [Google Scholar] [CrossRef]
- Li, Z.C.; Chen, D.H. The development and application of the operational ensemble prediction system at national meteorological center. J. Appl. Meteorol. Sci. 2002, 13, 1–15. [Google Scholar]
- Ahlgrimm, M.; Forbes, R.M.; Morcrette, J.-J.; Neggers, R.A.J. ARM’s impact on numerical weather prediction at ECMWF. Meteorol. Monogr. 2016, 57, 28.1–28.13. [Google Scholar] [CrossRef]
- Jasper, K.; Gurtz, J.; Lang, H. Advanced flood forecasting in Alpine watersheds by coupling meteorological observations and forecasts with a distributed hydrological model. J. Hydrol. 2002, 267, 40–52. [Google Scholar] [CrossRef]
- Yucel, I.; Onen, A.; Yilmaz, K.K.; Gochis, D.J. Calibration and evaluation of a flood forecasting system: Utility of numerical weather prediction model, data assimilation and satellite-based rainfall. J. Hydrol. 2015, 523, 49–66. [Google Scholar] [CrossRef]
- Bugaets, A.N. Using the OpenMI standard for developing integrated systems of hydrological modeling. Russ. Meteorol. Hydrol. 2014, 39, 498–506. [Google Scholar] [CrossRef]
- Clematis, A.; D’Agostino, D.; Danovaro, E.; Galizia, A.; Quarati, A.; Parodi, A.; Rebora, N.; Bedrina, T.; Kranzlmueller, D.; Schiffers, M.; et al. DRIHM: Distributed Research Infrastructure for Hydro-Meteorology. In Proceedings of the 2012 7th International Conference on System of Systems Engineering (SoSE), Genova, Italy, 16–19 July 2012. [Google Scholar]
- Goodall, J.L.; Robinson, B.F.; Castronova, A.M. Modeling water resource systems using a service-oriented computing paradigm. Environ. Model. Softw. 2011, 26, 573–582. [Google Scholar] [CrossRef]
- Werner, M.; Schellekens, J.; Gijsbers, P.; van Dijk, M.; van den Akker, O.; Heynert, K. The Delft-FEWS flow forecasting system. Environ. Model. Softw. 2013, 40, 65–77. [Google Scholar] [CrossRef]
- Bugaets, A.N.; Gartsman, B.I.; Krasnopeev, S.A.; Bugaets, N.D. An experience of updated hydrological network data processing using the CUAHSI HIS ODM data management system. Russ. Meteorol. Hydrol. 2013, 38, 359–366. [Google Scholar] [CrossRef]
- Motovilov, Y.G.; Gottschalk, L.; Engeland, K.; Rodhe, A. Validation of a distributed hydrological model against spatial observations. Agric. For. Meteorol. 1999, 98, 257–277. [Google Scholar] [CrossRef]
- Gonchukov, L.V.; Lamash, B.E. The numerical prediction of hazardous weather phenomena in the north of Primorsky Krai. Vestn. FEB RAS 2010, 6, 17–23. [Google Scholar]
- Gregersen, J.B.; Gijsbers, P.J.A.; Westen, S.J.P. OpenMI: Open modelling interface. J. Hydroinform. 2007, 9, 175–191. [Google Scholar] [CrossRef]
- The Far East. The Surface Water Resources; Hydrometeorological publishing: Leningrad, Russia, 1972. [Google Scholar]
- The USSR Geological Map; The state scientific and technical PH publishing of the geology and protection of subsurface resources literature: Moscow, Russia, 1960. (In Russian)
- Bugaets, A.N.; Pschenichnikova, N.F.; Tereshkina, A.A.; Krasnopeev, S.M.; Gartsman, B.I.; Golodnaya, O.M.; Oznobikhin, V.I. Digital soil map of the Ussuri River basin. Eurasian Soil Sci. 2017, 50, 907–916. [Google Scholar] [CrossRef]
- The Far East. Physiographic Description; Soviet Academy of Sciences: Moscow, Russia, 1961. [Google Scholar]
- Motovilov, Y.G.; Bugaets, A.N.; Gartsman, B.I.; Fingert, E.; Kalugin, A.S.; Moreido, V.M.; Suchilina, Z. Sensitivity of hydrological response of a monsoon-dominated river basin to spatial resolution of precipitation and land surface data. In Proceedings of the EGU General Assembly Conference, Vienna, Austria, 23–28 April 2017. [Google Scholar]
- Horsburgh, J.S.; Tarboton, D.G.; Maidment, D.R.; Zaslavsky, I. A relational model for environmental and water resources data. Water Resour. Res. 2008, 44, W05406. [Google Scholar] [CrossRef]
- Gelfan, A.N.; Motovilov, Y.G.; Moreido, V.M. Ensemble seasonal forecast of extreme water inflow into a large reservoir. Proc. Int. Assoc. Hydrol. Sci. 2015, 369, 115–120. [Google Scholar] [CrossRef]
- Nash, J.E.; Sutcliffe, J.V. River flow forecasting through conceptual models part I—A discussion of principles. J. Hydrol. 1970, 10, 282–290. [Google Scholar] [CrossRef]
- Gartsman, B.I.; Gubareva, T.S. Forecast of the rainfall flood hydrograph on the Far East rivers. Russ. Meteorol. Hydrol. 2007, 32, 328–335. [Google Scholar] [CrossRef]
- Forecasts of the Surface Water Regimes. In Forecasting Service Manuals; Hydrometeorological Publishing: Leningrad, Russia, 1962.


| River-Gaging Station | Area (km2) | Applying the Statistical Correction | Calibration Sample (1989) | Verification Sample (2013) | ||||||||
|---|---|---|---|---|---|---|---|---|---|---|---|---|
| Forecast with Precipitation Grades | Forecast with WRF Data | |||||||||||
| Lead Time (Day) | ||||||||||||
| 1 | 2 | 3 | 1 | 2 | 3 | 1 | 2 | 3 | ||||
| Ussuri–Kirovskiy | 24400 | without | 1.64 | 0.95 | 0.70 | 1.10 | 0.64 | 0.49 | 1.09 | 0.63 | 0.49 | |
| with | 1.31 | 0.81 | 0.59 | 0.71 | 0.59 | 0.46 | 0.71 | 0.59 | 0.47 | |||
| Ussuri–Koksharovka | 9340 | without | 1.82 | 1.16 | 1.09 | 0.93 | 0.59 | 0.50 | 0.91 | 0.57 | 0.51 | |
| with | 1.16 | 0.67 | 0.57 | 0.75 | 0.61 | 0.55 | 0.77 | 0.61 | 0.55 | |||
| Arsenyevka-Yakovlevka | 5312 | without | 1.56 | 0.96 | 0.77 | 0.93 | 0.61 | 0.52 | 0.93 | 0.61 | 0.54 | |
| with | 0.99 | 0.69 | 0.72 | 1.06 | 0.88 | 0.62 | 0.93 | 0.61 | 0.52 | |||
| Ussuri–Novomikhaylovka | 5170 | without | 1.25 | 0.99 | 0.93 | 1.68 | 1.08 | 0.93 | 1.63 | 1.00 | 0.90 | |
| with | 0.75 | 0.57 | 0.55 | 0.86 | 0.82 | 0.77 | 0.91 | 0.81 | 0.75 | |||
| Pavlovka–Antonovka | 2670 | without | 1.84 | 1.05 | 0.90 | 1.09 | 0.82 | 0.78 | 0.98 | 0.83 | 1.06 | |
| with | 0.64 | 0.49 | 0.44 | 0.51 | 0.38 | 0.32 | 0.60 | 0.43 | 0.36 | |||
| Arsenyevka–Anuchino | 2480 | without | 0.92 | 0.75 | 0.77 | 0.74 | 0.52 | 0.49 | 0.71 | 0.53 | 0.54 | |
| with | 0.71 | 0.48 | 0.43 | 0.54 | 0.46 | 0.41 | 0.54 | 0.45 | 0.41 | |||
| Ussuri–Verkhnyaya Breevka | 1730 | without | 1.54 | 1.20 | 1.04 | 1.24 | 0.88 | 0.82 | 1.07 | 0.76 | 0.83 | |
| with | 0.87 | 0.78 | 0.72 | 0.70 | 0.67 | 0.63 | 0.86 | 0.63 | 0.58 | |||
| Izvilinka–Izvilinka | 1160 | without | 1.44 | 1.17 | 1.04 | 1.56 | 1.14 | 1.07 | 1.37 | 0.96 | 1.02 | |
| with | 0.77 | 0.71 | 0.68 | 0.71 | 0.70 | 0.69 | 0.89 | 0.68 | 0.65 | |||
| Krylovka–Krylovka | 1070 | without | 1.90 | 1.02 | 0.82 | 1.45 | 0.92 | 0.76 | 1.41 | 0.91 | 0.62 | |
| with | 0.73 | 0.51 | 0.68 | 1.11 | 0.84 | 0.69 | 1.20 | 0.85 | 0.70 | |||
| Arsenyevka–Vinogradovka | 940 | without | 0.68 | 0.63 | 0.61 | 0.79 | 0.62 | 0.59 | 0.81 | 0.73 | 0.63 | |
| with | 0.49 | 0.42 | 0.42 | 0.66 | 0.52 | 0.50 | 0.70 | 0.56 | 0.52 | |||
| Muraveyka–Grodekovo | 761 | without | 1.08 | 0.73 | 0.64 | 1.26 | 0.90 | 0.79 | 0.96 | 0.71 | 0.72 | |
| with | 0.53 | 0.45 | 0.44 | 0.49 | 0.51 | 0.52 | 0.48 | 0.41 | 0.40 | |||
© 2017 by the authors. Licensee MDPI, Basel, Switzerland. This article is an open access article distributed under the terms and conditions of the Creative Commons Attribution (CC BY) license (http://creativecommons.org/licenses/by/4.0/).
Share and Cite
Bugaets, A.; Gartsman, B.; Gelfan, A.; Motovilov, Y.; Sokolov, O.; Gonchukov, L.; Kalugin, A.; Moreido, V.; Suchilina, Z.; Fingert, E. The Integrated System of Hydrological Forecasting in the Ussuri River Basin Based on the ECOMAG Model. Geosciences 2018, 8, 5. https://doi.org/10.3390/geosciences8010005
Bugaets A, Gartsman B, Gelfan A, Motovilov Y, Sokolov O, Gonchukov L, Kalugin A, Moreido V, Suchilina Z, Fingert E. The Integrated System of Hydrological Forecasting in the Ussuri River Basin Based on the ECOMAG Model. Geosciences. 2018; 8(1):5. https://doi.org/10.3390/geosciences8010005
Chicago/Turabian StyleBugaets, Andrei, Boris Gartsman, Alexander Gelfan, Yury Motovilov, Oleg Sokolov, Leonid Gonchukov, Andrei Kalugin, Vsevolod Moreido, Zoya Suchilina, and Evgeniya Fingert. 2018. "The Integrated System of Hydrological Forecasting in the Ussuri River Basin Based on the ECOMAG Model" Geosciences 8, no. 1: 5. https://doi.org/10.3390/geosciences8010005