Article

Multibeam Bathymetric Investigations of the Morphology and Associated Bedforms, Sulina Channel, Danube Delta

NIRD GEOECOMAR, 23-25 Dimitrie Onciul Street, RO-024053 Bucharest, Romania
*
Author to whom correspondence should be addressed.
Geosciences 2018, 8(1), 7; https://doi.org/10.3390/geosciences8010007
Submission received: 31 October 2017 / Revised: 25 December 2017 / Accepted: 26 December 2017 / Published: 2 January 2018

Abstract

:
In the Danube Delta, on the Sulina branch, the morphology, sediment, and bedform characteristics were investigated. Three-dimensional (3D) bathymetry, flow velocity, suspended-load concentration, and liquid and solid discharge data were acquired throughout several cross sections along the Sulina channel, in order to investigate the distribution of water and sediment discharges and their influence against the river bed. A single observation (in February 2007) was made regarding the geometry, sediment composition, and hydraulic conditions under which the dunes grew and degenerated. The investigation focuses here mostly on the geometrical parameters of these bedforms, such as height, length, as well as grain size characteristic of the sediment and water dynamics. Based on in-site measurements, different hydraulic parameters were calculated, such as bed shear stresses and Reynolds number. During the field campaign, the measured water mean velocity was from v = 0.22–1.13 m∙s−1. At the same time, the measured range of shear stresses within the dune field formation was from τ0 = 2.86 N·m−2 (on the cutoffs) to 8.62 N·m−2 (on the main channel). It was found that the correlation between height (H) and length (L) of the Sulina branch dunes describes the formula: H = 0.093L0.5268. The bedforms of the Sulina channel are, in general, developed in fine sand (D50 between 0.06 and 0.35 mm).

1. Introduction

Bedforms are the result of the interaction of the flow, sediment transport, and bed morphology [1,2,3,4]. Multibeam measurements offer a very detailed description of the fluvial channel and a detailed characterization of the morphologic processes and dynamic interpretation can be performed. Recent technological developments, particularly multibeam sonar bathymetry mapping methods and advances in sediment dynamics instrumentation [5,6,7,8,9,10,11,12], have enabled higher resolution studies of the morphology of sand ridges, and the quantification of the migration of bedforms and the hydrodynamic and sediment transport processes that cause this migration [11]. The fluvial environment was investigated by many authors in order to describe the bed morphology and bedforms migration [5,8,9,10,13]. Many studies of the bedforms classification, behaviour, and evolution can be found in the literature [14,15,16,17,18,19,20,21]. Bedform geometry is shown to be influenced by transport stage [20,21,22], by sediment concentration in flow [23], and is dependent on how sediment is transported by flow [5,24].
Best [25] completed a large synthesis of existing works on dunes. His review paper summarizes the principal features of mean and turbulent flow over alluvial sand dunes. Numerical simulations on dune evolution and dune migration are also available [6,26,27,28]. Using van Rijn’s classification [20] on the Yangtze River, Chen et al. [16] measured dunes with maximum length of 300 m and up to 8 m in height. Small dunes were found by [15] on the Rhine River (L = 10–96 m and H = 0.3–1.4 m) and [29] on the Raba River (Poland) (L = 0.04–1.46 m and H= 0.04–0.12 m). Extremely large dunes with heights of the order of 7 m and lengths of the order of 500 m have been observed in the Rio Parana River (Argentina) at water depths of about 25 m, velocities of about 2 m/s, and bed material sizes of about 0.3 mm [20]. There is no information about dunes that are higher than 8–9 m, except in the Mississippi River [30].
This paper reports and analyses data on the morphological and sedimentary processes at work in a regulated channel, the Sulina branch, in the middle distributary of the Danube Delta. The multibeam technology was used in order to analyse dune dynamics in the study area. The objectives of the presented work are to: (1) understand sediment dynamics in a regulated channel; (2) describe the bedform characteristics of the Sulina channel in the Danube Delta; and, (3) assess the relationship between the bedforms and channel morphology.

2. Regional Setting

Fieldwork was carried out on the Danube Delta. With a mean annual water discharge of 1262 m3·s−1 and mean annual suspended sediment flux of 183 kg·s−1, the Sulina channel is the middle branch of the Danube Delta, downstream of the main contributor of fresh water and sediment into the Black Sea, the Danube River. The Sulina branch starts from a bifurcation of the Tulcea distributary, at Ceatal St. George (M34) (Figure 1), and carries about 20% of the water discharge and suspended sediment discharge of the Danube [31,32].
From the Ceatal St. George, the Sulina distributary flows eastward 71.7 km (present-day length, including the 8 km of jetties at the mouth of the arm) towards the Black Sea. The Sulina distributary present-day physiography results from a large cut-off programme carried out during the 1868–1902 interval by the European Danube Commission and will be discussed below.
The Sulina meander belt cut-off programme was fulfilled during 1858–1902 period. The works enabled the navigation of deep shallow-draft ships on the old Sulina arm, channelled a distance of 71 km (of the initial 83 km length) [33], which induced an enlargement of water discharge in the distributary from 7–9% of the total Danube discharge in 1860 to almost 15% in 1928 and currently about 20% [34,35] (Figure 2). The shortening (that caused a steeper slope of the distributary) and deepening of the river channel radically changed the hydrological regime of the Danube Delta by increasing the water discharge of the Sulina arm [31,35,36]. Most of the meander belts of the former Sulina distributary were closed by dykes; only a few remained connected to the main Sulina branch channel (such as the Maliuc meander, connected to Sulina channel at Mile 23.7, and the “Big M” meander belt, connected at Mile 13.5 and at Mile 8.4).
The regulation works of the Sulina channel consisted in the construction of 167 submerged groins and the protection of the banks with rock blocks (along 91.8 km) [37]; these structures had directly influenced the sediment transit and the local hydro-morphological processes.
The most complex zone is located at the bifurcation area (knot Ceatal St. George). Here, the asymmetry of the channel (erosion on the right bank) is influenced by the local variables: the asymmetrical shape of the Tulcea channel upstream the bifurcation (at Mile 34) with the highest depths located on the left bank (19–20 m), the presence of a hydraulic dune (360 m length) influencing the downstream current direction to the Sulina distributary, the high value of the diversion angle formed by Sulina branch at the bifurcation (around 140°), the reduced width of the Sulina channel (around 100 m width) and the steep slope (2.81 m·km−1, calculated on 1000 m length).
To obtain a detailed analysis, in this study, the Sulina channel was divided into three reaches (A–C, Figure 1), reach A from Mile 34 to Mile 19, reach B from Mile 19 to Mile 8, and reach C from Mile 8 to the branch mouth.

3. Materials and Methods

Combined measurements (bathymetrical, hydrological, and sedimentological surveys) were collected during a field campaign at the middle of February 2007. During the measurements (13–21 February 2007), the Sulina branch flow was ~1330 m3·s−1, and the water flow discharge remained almost constant (variations of the water level stage between 1 and 4 cm at Sulina gauge station). Reported water depths are in local values, while river stages are reported for the Sulina gauge station, and mainly represent medium to high flows.

3.1. Bedform Mapping

Multibeam sonar bathymetry data were collected along the Sulina channel during the field campaign on NIRD GeoEcoMar’s RV ISTROS, equipped with an ELAC Nautik SeaBeam 1050D multibeam bathymetric system. The 180-kHz sounder of the ELAC 1050D contained 126 beams that were arrayed over an arc of 153°. The swath of seafloor covered on each survey line was typically eight to nine times water depth. Navigation was by Differential Global Positioning System, providing positional accuracy <1 m. Sound velocity profiles through the water column were measured periodically during the surveys and were applied to the data to reduce refraction errors. The depth data were inspected and erroneous values removed using the software packages HDP Post/FLEDERMAUS.

3.2. Particle Size Analysis of Bed Surface Materials

Bottom samples were collected with a grab sediment sampler, along 7 transects on the Sulina channel and two transects on the Tulcea (M34) and St. George branches (Km 108) (at the bifurcation). Depending on the channel width, one to three samples were taken (right bank, centre, and left bank) at each transect, totalling 16 samples, of which 10 sampling sites correspond to the Sulina branch. Grain size was measured for all of the sediment samples with a Mastersize 2000E diffractometer for silt and clay and the particles over 1.25 mm were separated by sieving.

3.3. Hydrodynamics (ADCP)

Data were collected with using a poweredboat-mounted acoustic Doppler current profiler (ADCP, RiverSurveyor 500 kHz, manufactured by SonTek), equipped with a vertical single-beam echo sounder (Ceeducer Bruttour International, working at a frequency of 200 MHz and accuracy 0.5% of measuring values), for measurement of the cross-sections bathymetry. During the field campaign, 11 transverse ADCP profiles were systematically completed at relevant cross-sections along the Sulina branch, and two transect on the Tulcea (M34, P8) and St. George branches (Km 108, P6) (at the bifurcation) (Figure 1): at the entrance (P7, P9, and P10), in the middle of the meander “Big M” (P11A, P11C, and P11B), around the exit of the meander “Big M” (C3A, C3B, and C3C), and around the downstream sector of the branch (P12 and C2A). The marks A, B, and C describe the position of each profile in the sector: location on the upstream channel (A), on the former meander (C), and on the downstream channel (B). The bathymetry, water velocity, and discharge data provided by the three beams were handled by means of Sontek River Surveyor software (version 4.6, Sontek, San Diego, CA, USA).
Analyses of the seabed samples, seabed photos and velocity profiles provided information on the distribution and variation of surficial sediment grain size, and shallow sub-surface sedimentary structures across the river bed.

4. Results

4.1. Bedforms Classification

Bedforms are relatively dynamic sediment storage bodies that occur in the channel and are scaled to flow depth [14]. Figure 3 shows the basic definitions of the bedform dimensions (after [38]). In this paper, the length of the dune is equal to the distance between two successive troughs.
The classification of bedforms depends on different river systems. In the literature, various bed-form classification methods for sand beds are presented [14,20,38,39]. Here, we adopt van Rijn’s classification as ripples, megaripples, and dunes. Ripples are defined as primary bedforms (length, L < 0.6 m, H < 0.7 mm), with heights up to a few centimetres and dunes can be used for all forms longer than about 1 m. In the Sulina channel, ripples are indiscernible due to limited instrument resolution; hence, they are considered as flat beds.
Megaripples are defined as the bedforms with similar length to water depth [20]. Water depth of the Sulina Channel ranges from 16 to 19 m, with a maximum in the dredged area of 27 m, so we adopt a relatively lower value of water depth as the length of a megaripple. Here, we define megaripples with L < 30 m and H < 1 m. Megaripples were identified all along the Sulina distributary. They represent the most common bedform of the study area. Megaripples were measured as primary independent forms (Figure 4a), such as secondary superimposed bedforms on small and large dunes (Figure 4b,c). Megaripples dimensions are situated between 1 < L > 30 m and 0.5 < H > 1 m.
Dunes are larger structures formed by the increased speed of the current. In the Sulina channel, there are two distinct populations of dunes: “small” dunes, with lengths of several metres (even hundreds) and heights of several centimetres (up to 1.5 m) (Figure 4b), and “large” dunes, with lengths of several hundred metres and heights of several metres (more than 1.5 m) (Figure 4c).
Our results show that multiples small dunes with heights between 1 < H > 1.5 m and lengths between 20–30 < L > 400 m are located all along the Sulina channel area (M33, 30, 25, 8). Beyond these limits, megaripples and flat beds prevail. Most large dunes occur in Reach A; large dunes are typically > 500 m in L and between 3–5 m in H (Reach A at M32, 30, 29, 28, 21). Flat beds and megaripples prevail in the channel with low water surface slope (< 0.016 m·km−1) (Reach B). Megaripples are superimposed on most large and small dunes. Along the Sulina channel, bedform geometry is asymmetrical.

4.2. Bed Material Grain Sizes

On the basis of the Udden-Wentworth particle size scale, the bed materials that were collected in 2007 were fine sand with D50 particle size range between 0.006–0.35 mm (7.27 − 1.48 Φ), (Table 1). Higher sorting (σ), ranging between 0.25 and 0.87, reflects the operation of strong currents on bed material [37]. Low density coarse particles that were collected consisted of shell detritus from freshwater bivalve’s fragments.

4.3. Morphology of the Sulina Channel

(A) Sinuous upstream sector between M34 and M19 is marked by the upstream bifurcation of Tulcea branch (at the knot Ceatal St. George). Along this sector, the banks are partially protected with rock blocks and concrete structures. The channel width range between 98 and 134 m, and the depths between 10 and 19.8 m (local depths) (Table 2). The longitudinal profile is heterogeneous, with alternation of erosional and depositional areas, as an effect of the groins presence. Bedforms have been identified along this sector, megaripples, small dunes, and dunes. Small dunes are typically 15–30 m in L and 1–2 m in H, and large dunes are typically 30–100 m in L and 1–2 m in H.
(B) The middle sector of the “Big M” meander (between M19 and M8). At present, the connection with the former meander is located at the confluences with the channel named “Old Danube” at M13.5 and M8.5. This sector of the Sulina branch is rectilinear, with widths between 103 and 136 m and depths between 10 and 14 m (Table 2). The maximal depth values are located on the sand excavation areas (maximum depth of 27 m). The bed slope is 0.185 m·km−1; the banks are partially protected with rocks and concrete walls; some natural banks are located between M10 and M8. Generally, the channel has symmetrical shape along this sector; some exceptions are located between M19 and M14, where dredging areas were identified on the three-dimensional (3D) bathymetrical maps. These dredged areas are surely older; at the bed surface, many bedforms (megaripples type) are identified. Small bedforms occur in Reach B, megaripples and small dunes mainly located in the excavating areas (H between 15 and 25 cm and L between 15 and 35 m).
(C) The downstream reach between Mile 8 and the Sulina channel mouth (HM 40) is dominated by a channel sinuosity between M7 and M3 that produce the migration of the thalweg from the right bank (at M7) to the left bank (at M6 and M5). The channel width varies between 100 and 143 m and the depths between 10.7 and 19.70 m (Table 2). The banks are in a natural state; small isolate concrete structures are present on both the banks. Starting with M5 downstream, the fluvial flow is interacting with the marine currents; the contact between the salt and freshwater produces the attenuation of bedforms dimension (maximum 1 m in H and 10–20 m in L) and the change of their direction as longitudinal bedforms.

5. Discussion

5.1. Event-Scale Morphodynamical Analysis

Local morphodynamical processes during the 2007 survey were analysed through two geomorphological parameters: the specific stream power, indicating the stream ability to adjust its channel morphology [40], and the boundary shear stress, indicating the flow capacity to mobilize sediment from the bed as suspended-load or bedload.
Morphodynamical activity is generally assessed by the specific stream power (ω) expressed by Equation (1), as an indicator for the river transport capacity [41]:
ω = Ω/B (W·m−2)
where B is the bankful channel width and Ω is the stream power, obtained from Equation (2):
Ω = ρ g Q S (W·m−1)
where the representative discharge Q (m3·s−1) is usually taken as the bankful discharge Qbf. In the present analysis, the discharge gauged by ADCP for each channel was taken as the representative discharge. As for bed shear stress estimates (see below), the calculated energy slope S is 0.053 m·km−1.
Sectors with high specific stream power (above 10.23 W·m−2) were found at the bifurcation area (P7) because of low width and steep slope (Table 3). Along the channel, stream power values were logically much lower because of the lower slope and longer length (between 10.23 and 5.19 W·m−2). Values below 1 W·m−2 were located on the natural channel of the “Big M” (P11C and C3C), related to the very slow currents of the former meanders.
The mean bed shear stress (τ0) corresponds to the unit tractive force exerted on the bed [42] following the Equation (3):
τ0 = ρ g R S (N·m−2)
where ρ is the fluid density (1000 kg·m−3 for sediment-free water), g is the gravitational acceleration (9.81 m·s−2), R is the hydraulic radius (m), and S is the water energy slope (m·m−1) (i.e., S = 0.053 m·km−1).
The mean bed shear stress (τ0) values were generally in good agreement with the stream power values. The shear stress is significantly higher along the main channel (E1/F1). In the former meander, shear stress values are dramatically lower (between 6.53 and 8.62 N·m−2 on the profiles P9, P10, P11A, P11B, C3A, C3B, P12, and C2A) and decrease on the former meander “Big M” (between 2.86 and 3.06 N·m−2). The maximum value (of 10.41 N·m−2) is located at the bifurcation area (P7).
The results offer a more continuous view of the variability in the erosion capacity along main channels, especially at the bifurcation area.

5.2. Sedimentary Dynamic

The conditions necessary to initiate sediment motion are a function of the characteristics of the sediment (density, size, packing, sorting, shape, etc.), the fluid (density and viscosity), and the flow conditions (average velocity) [43].
A number of empirical graphical relationships have been proposed in an effort to define the threshold conditions. These have been cast in the form of a critical velocity (u*) or a critical shear stress (τc) that are related to some sediment parameters, and have taken the form of equations or graphs. Many of these have been reviewed by others [33,44,45].
The most frequently used graphs are those of Hjulström [46,47] and Shields [48]. Some of the necessary parameters were extracted from the ADCP data (mean velocity, maximum depth, discharge). Two velocities were used: the profile mean velocity (v) and the critical velocity (u*), calculated following the Equation (4) [49]:
u* = √τ0w
where τ0 is the unit tractive force exerted on the bed and ρw is the fluid density (1000 kg·m−3).
The knowledge of shear stresses value is crucial when talking about sand-gravel grains movement, which is directly connected with subaquatic dunes formation. After analysing hydrodynamic forces, one can calculate the Shields parameter (5), also known as non-dimensional shear stresses [48,50], obtained from the Equation (5):
θc = τcr [g∙(ρs − ρw)∙D]−1
where θc is a critical value for a given size fraction (D), ρs − ρw is the exerted density (1.65 tones m−1), g is the gravitational acceleration (9.81 m·s−2), D is the mean (in mm), and τcr is the critical shear stress.
The critical bed shear stress (τcr) is calculated with the Equation (6):
τcr = Ps∙[(ρs − ρw)∙D]−1
where Ps correspond to the depth and D is the mean size of the sediment (D50 in mm). After [51], the bed sediment moving is when τc exceeds 0.047.
On Shields diagram, θc is related to grain Reynolds number (Re*), defined by the Equation (7) [52]:
Re*= (u*∙D)∙υ−1
where υ is the kinematic fluid viscosity expressed in m2·s−1.
Shields diagram (1936). Shields (1936) plotted the dimensionless shear stress against the dimensionless particle Reynolds number. The distribution of points in Figure 5 allows for the identification of the sediment transport mode on the Sulina channel and at the bifurcation knot (on St. George and Tulcea branches). The transport processes (which can be interpreted such as erosion) dominate the Sulina and Tulcea branches; despite, on the St. George branch the Shields parameter is situated in the suspension area. One sample of the Sulina channel is situated in the suspension area; this point was collected from the compacted clay bed of the channel.
Hjulström Diagram (1935). Hjulström (1935) related critical velocity to particle dimension, and thus separates the erosion/transport and deposition boundaries [49]. On this diagram (Figure 6) all of the samples are plotted in the transport area, except for a few samples that are situated near the suspension limit (samples collected from the “Big M” meander). According to the results, the Sulina channel has erosive capacity, with the sedimentary load being provided through riverbed erosion.
Shields and Hjulström diagram have become an important reference to predict the erosion and transport conditions of a water course. Both demonstrate that sand erosion needs a lower velocity to cause erosion; however, a much bigger erosional force is required in the silt and clay domain. It seems that the sediments of the Sulina channel were eroded from the bed or from settled sediments, previously transported by the current. The Shields and Hjulström diagram confirm that the Sulina channel is dynamic and still has erosion capacity.

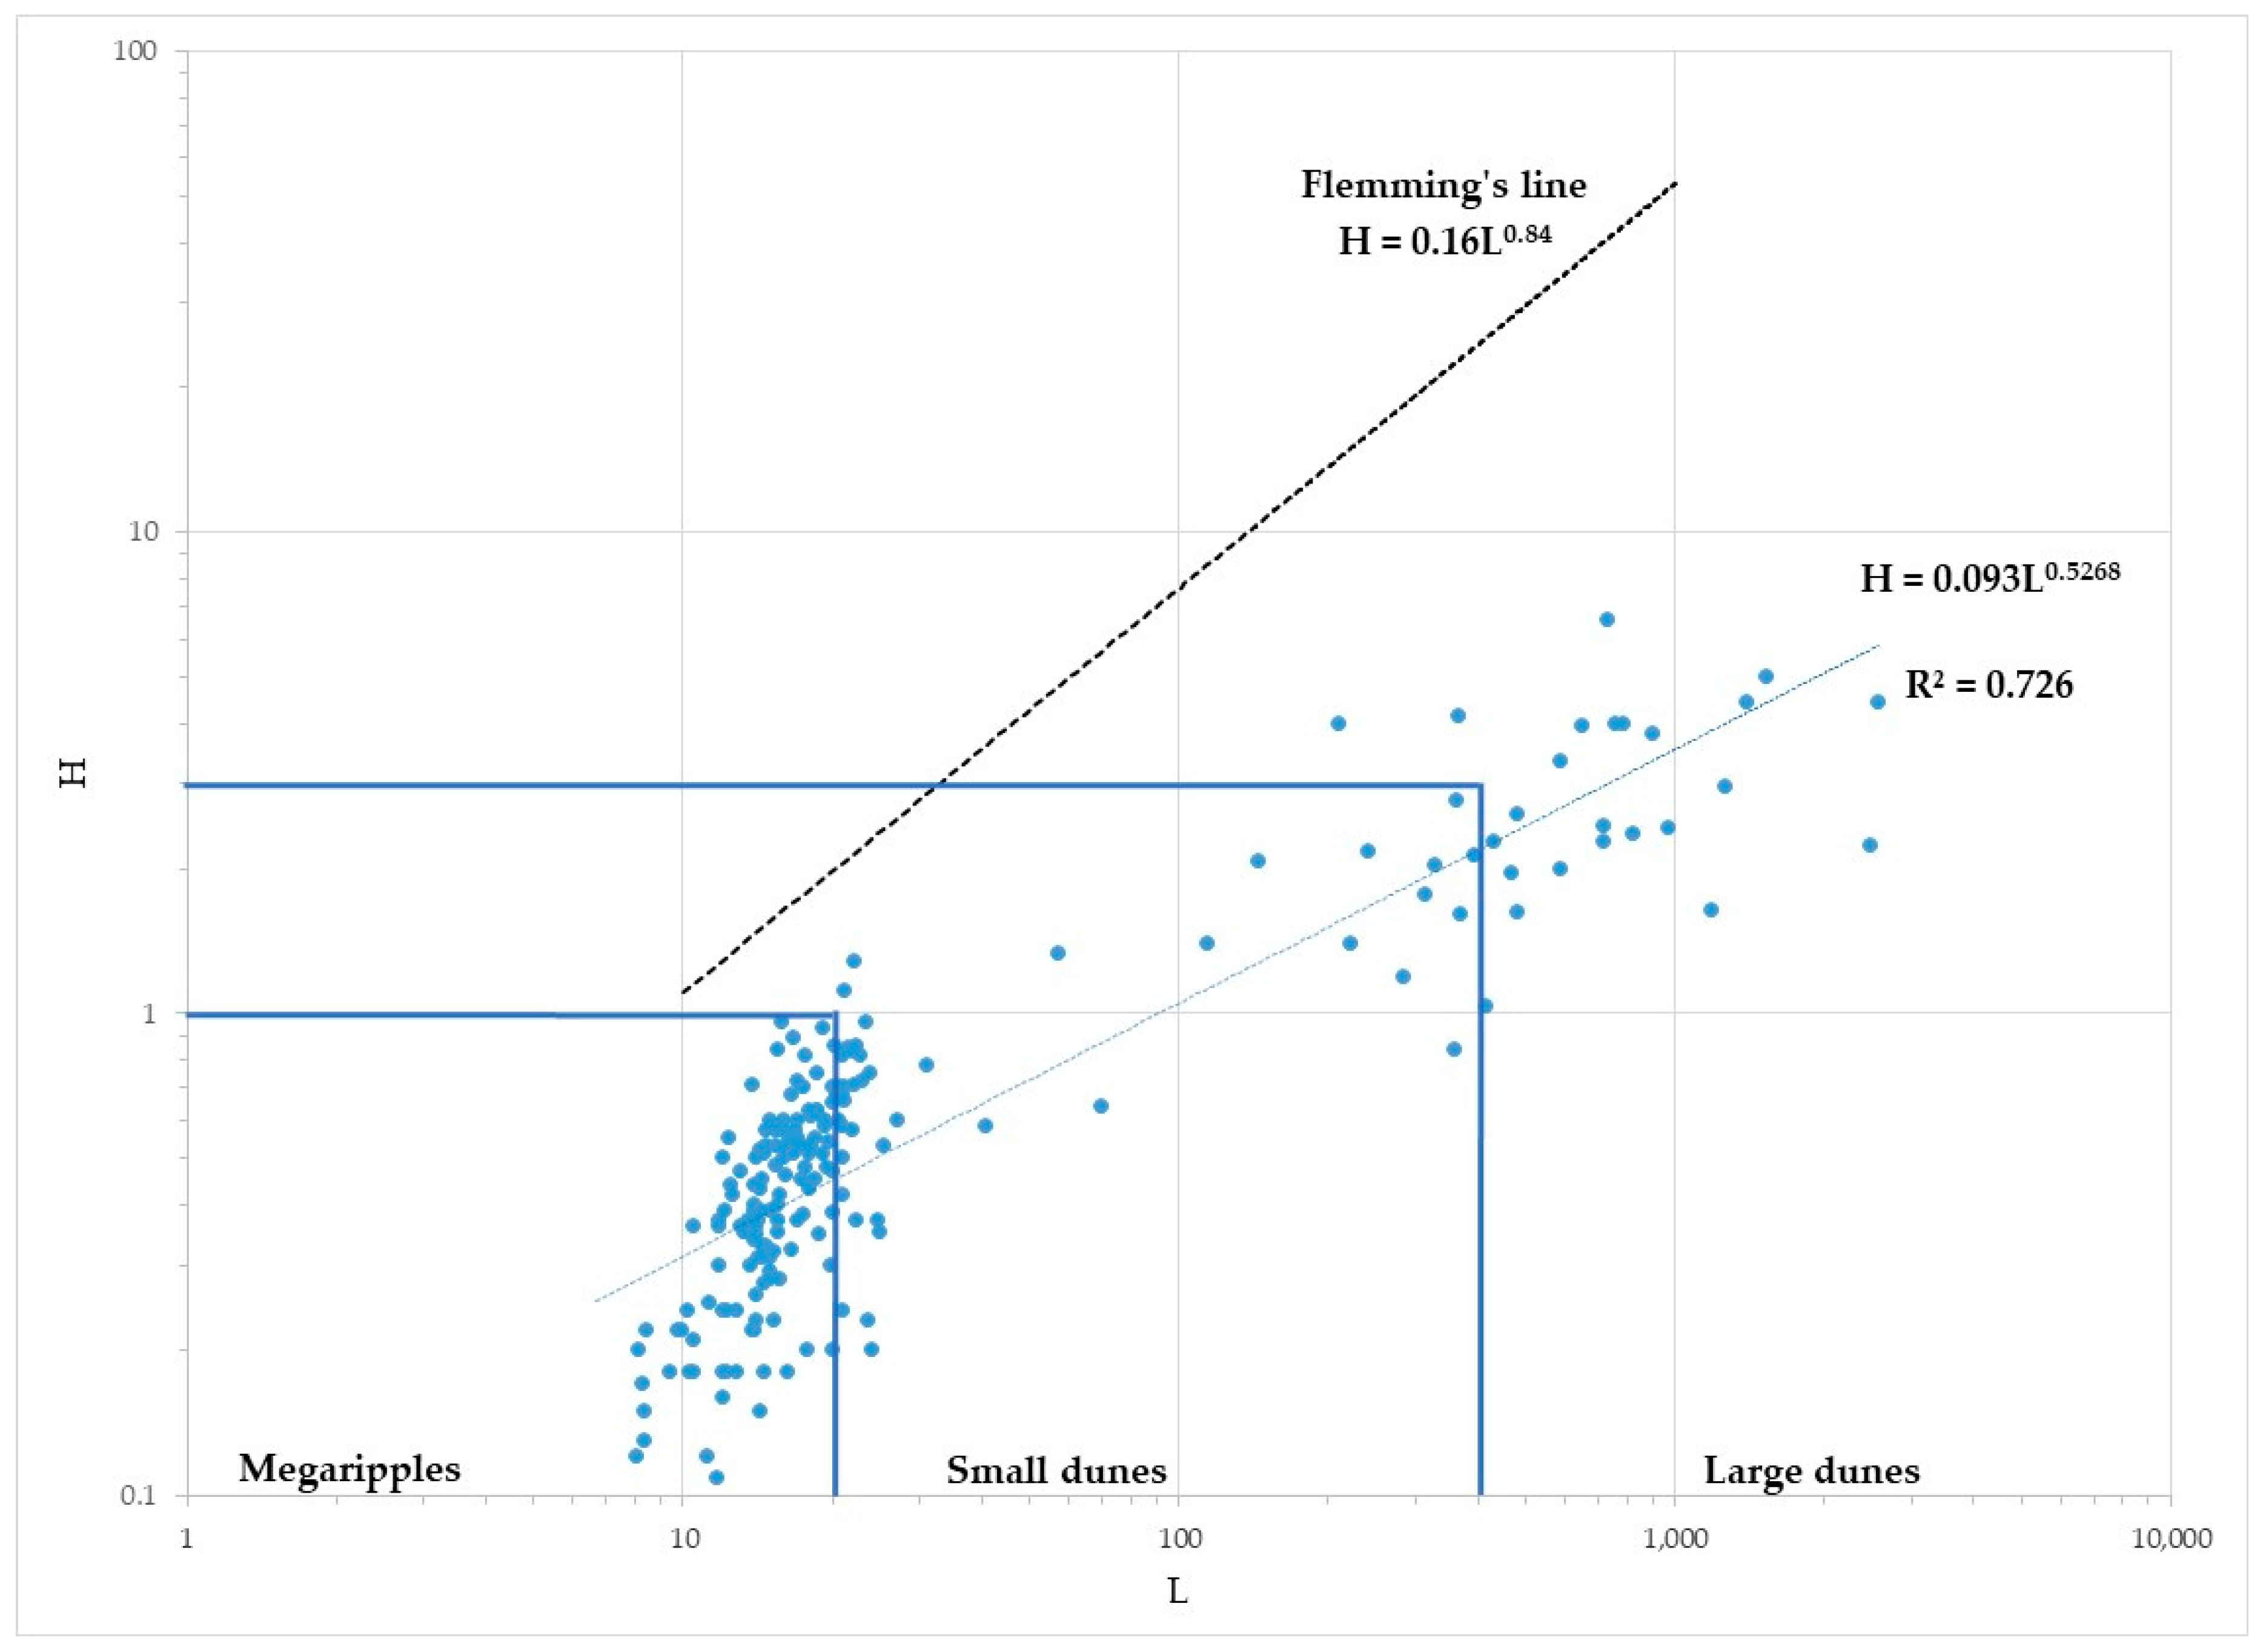
5.3. Flemming Empirical Relation

This study applies a model to evaluate the bedforms in the Sulina channel, as proposed by Flemming [14,53,54]. Flemming suggested that the heights and lengths of the bedforms are related to each other, and that they conform to the following form of power law relationship: H = 0.068 L0.81 [53,54], with the maximum height being defined by another expression, H = 0.16 L0.84 [37,53,54].
The latter equation represents a steepness values between 0.08 and 0.1. Furthermore, it has been demonstrated that dunes with H/L ratios <0.06 are non-equilibrium bedforms or represent an equilibrium adjustment of the bed form [15,50].
Using the Flemming empirical relation, we estimated the correlation between L and H for a number of >150 bedforms of the Sulina channel. Figure 7 shows a semi-log plot of the distribution of lengths and heights of the measured bedforms, with marked H-L lines for each datum, which were obtained by polynomial curve fitting.
For our reach (Figure 7), the maximum height is situated at H = 0.093L0.5268, with R2 = 0.7266. The results show that the bedform steepness are below Flemming’s (1988, 2000) maximum H-L line. The relation H/L is situated for all the considered cases below 0.06 (between 0.001 and 0.58); which suggests that all of the bedforms of the Sulina channel were not in equilibrium. They represent old bedforms developed in prior hydrological conditions.
Aberle et al. [55] noted that, among other problems, one of the major challenges that need further research is to improve our understanding of non-equilibrium bedforms. According to the author, the equilibrium bedforms appear solely in laboratories or man-made canals, while non-equilibrium bedforms develop in both natural rivers and artificial open channels [37].
Extensive research has been conducted on dunes as a particular type of bed form. Bridge and Best [56] presented preliminary results from an experimental study of the interaction between turbulence, sediment transport, and bedforms dynamics over the transition from dunes to upper stage plane beds. All of the observed bedforms had a mean length of 0.7–0.8 m. Chen et al. [16] described bedform characteristics in the mid-lower Changjiang River. The authors distinguished four types of bedforms, including flat bed, megaripple, small dune, and large dune, mostly in equilibrium with present flow conditions; only the large bedforms were relicts of the previous large discharges. Coleman and Nikora [57] define the important characteristics of a dune-covered bed, including lengths, shapes, and their statistical nature. Bialik et al. [37] successfully used the ADCP to study the interaction between the dynamics of bed-load sediment, dunes, and flow velocities for the Wilga River (Poland). Li and King [11] used seabed sampling, sidescan/seismic surveys, and seabed instrumentation measurements to characterize the surficial geology and morphology of offshore sand ridges on Sable Island Bank, Scotian Shelf, and to evaluate the relationship between sand ridge morphology, migration and the storm processes on this storm-dominated outer shelf bank. They found an average height of 4.3 m and wavelength of 1.5 km.

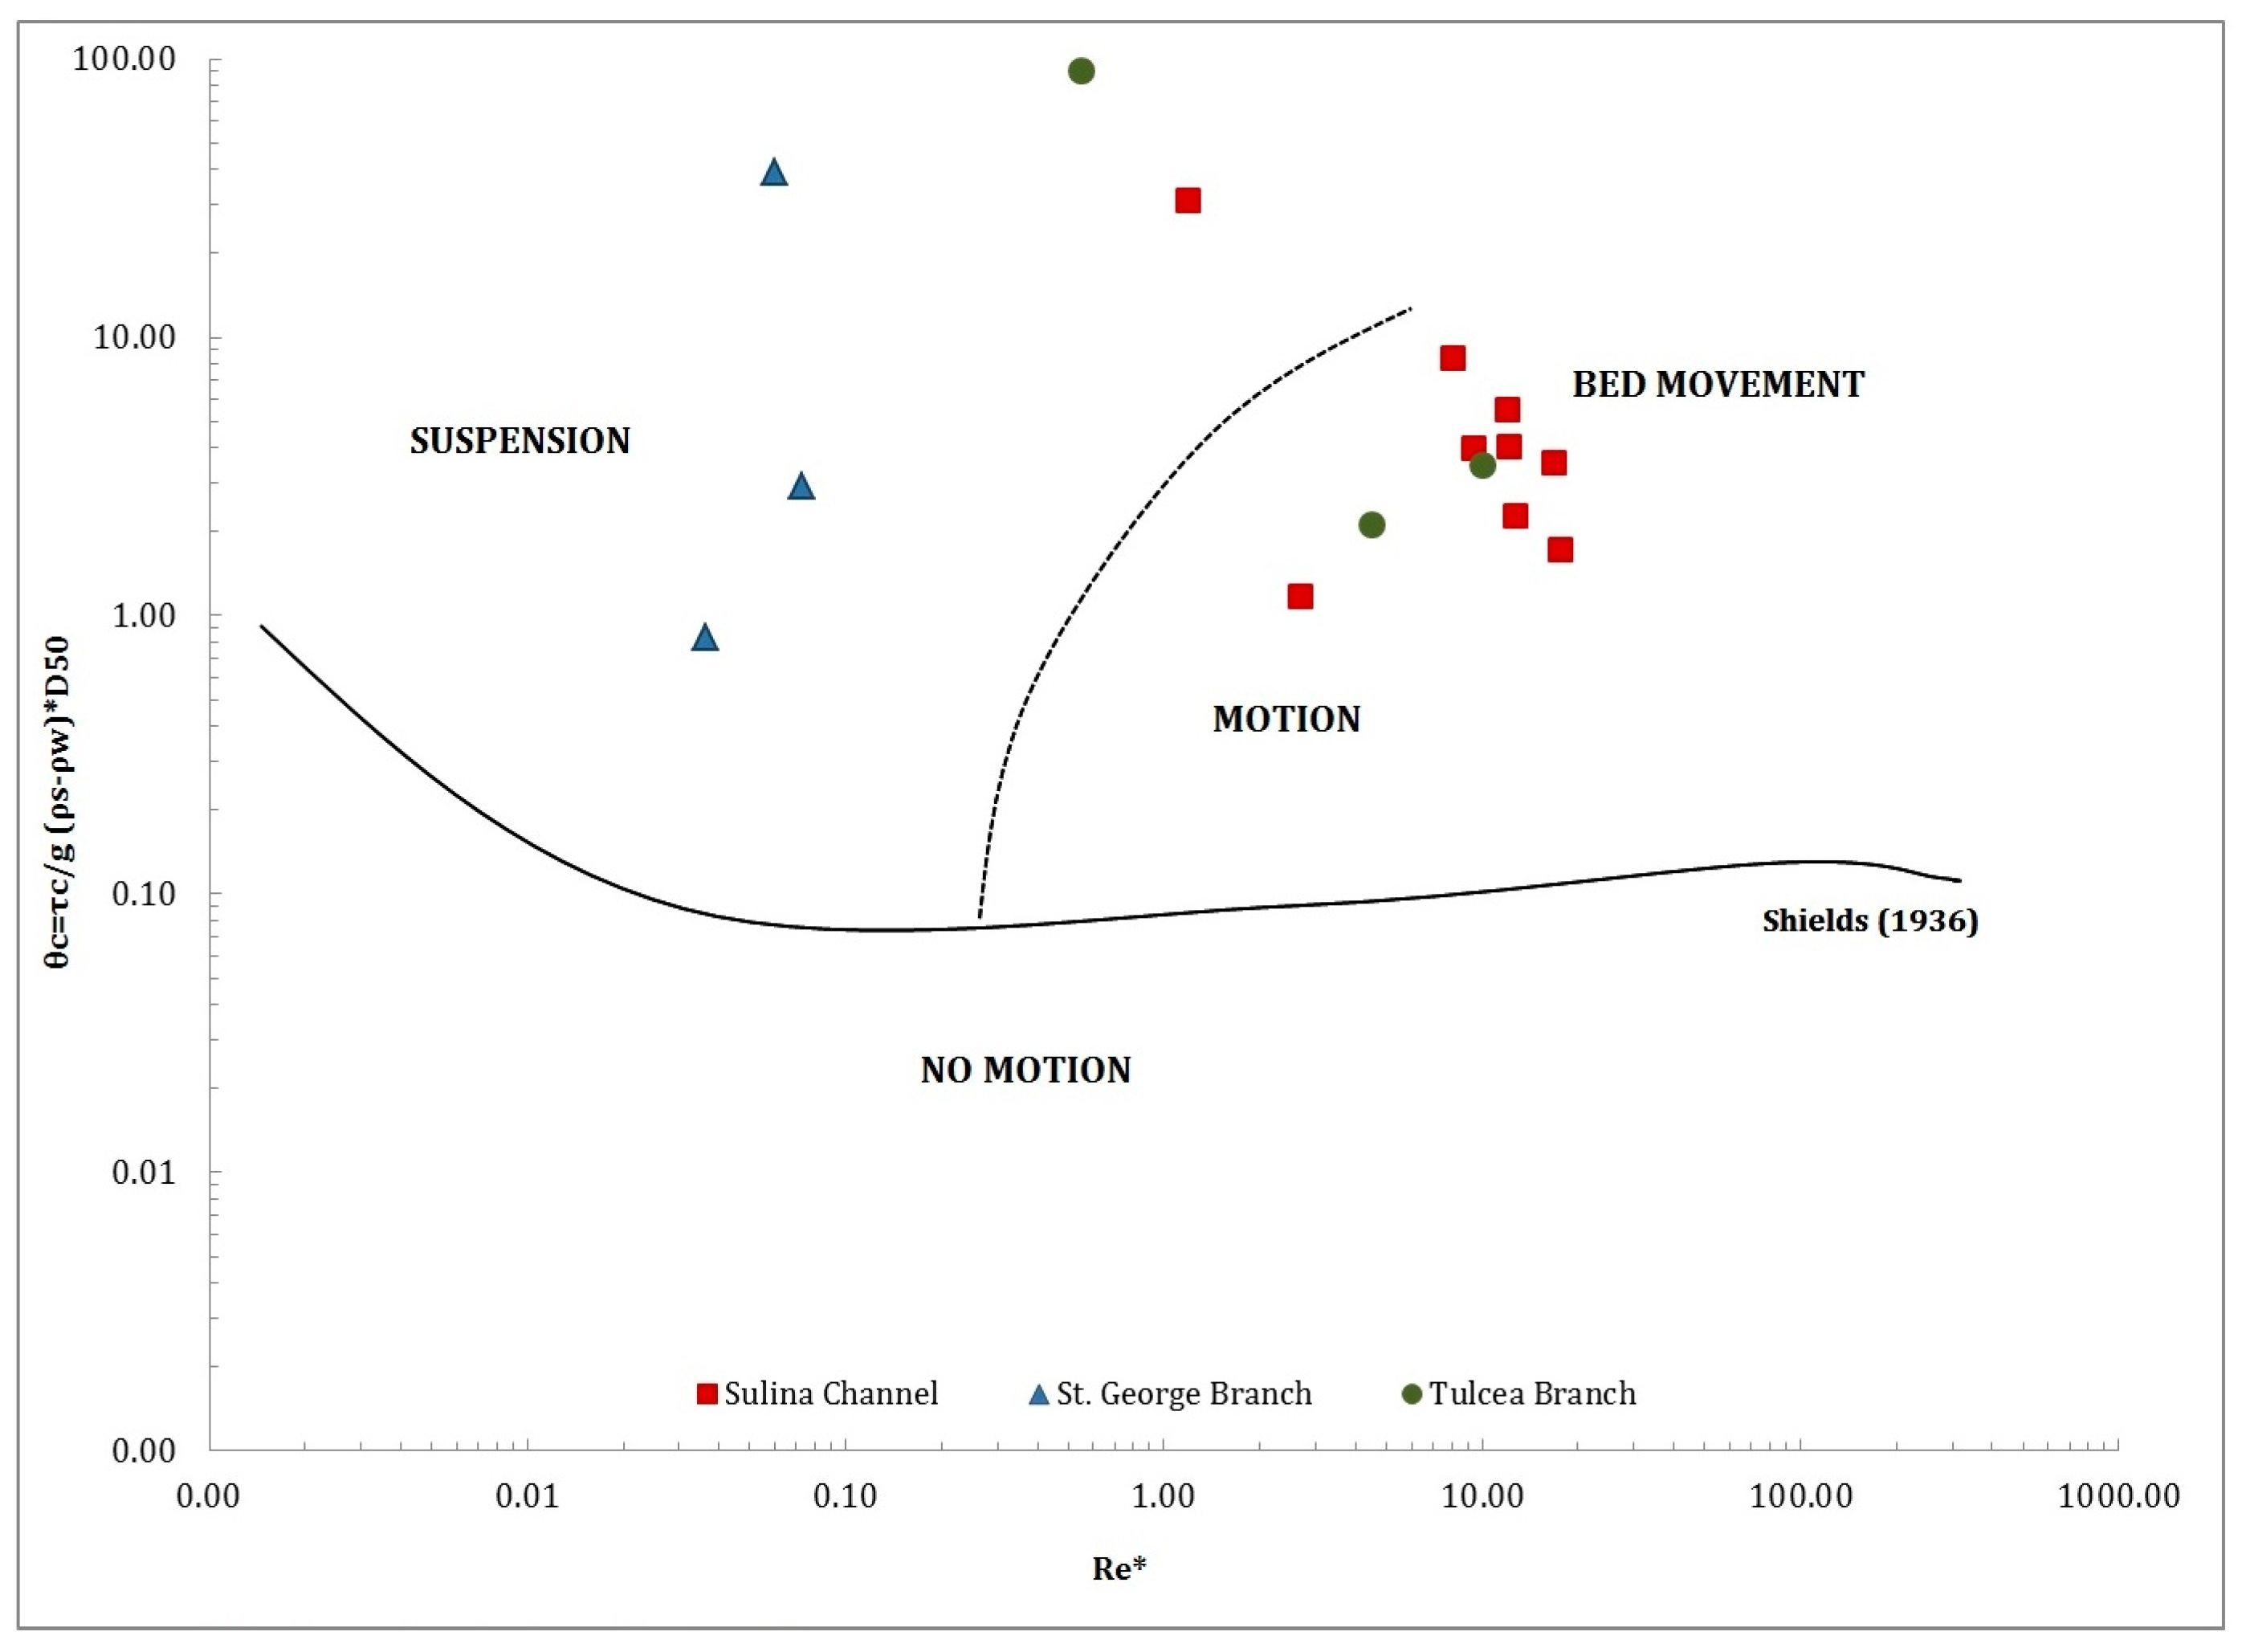
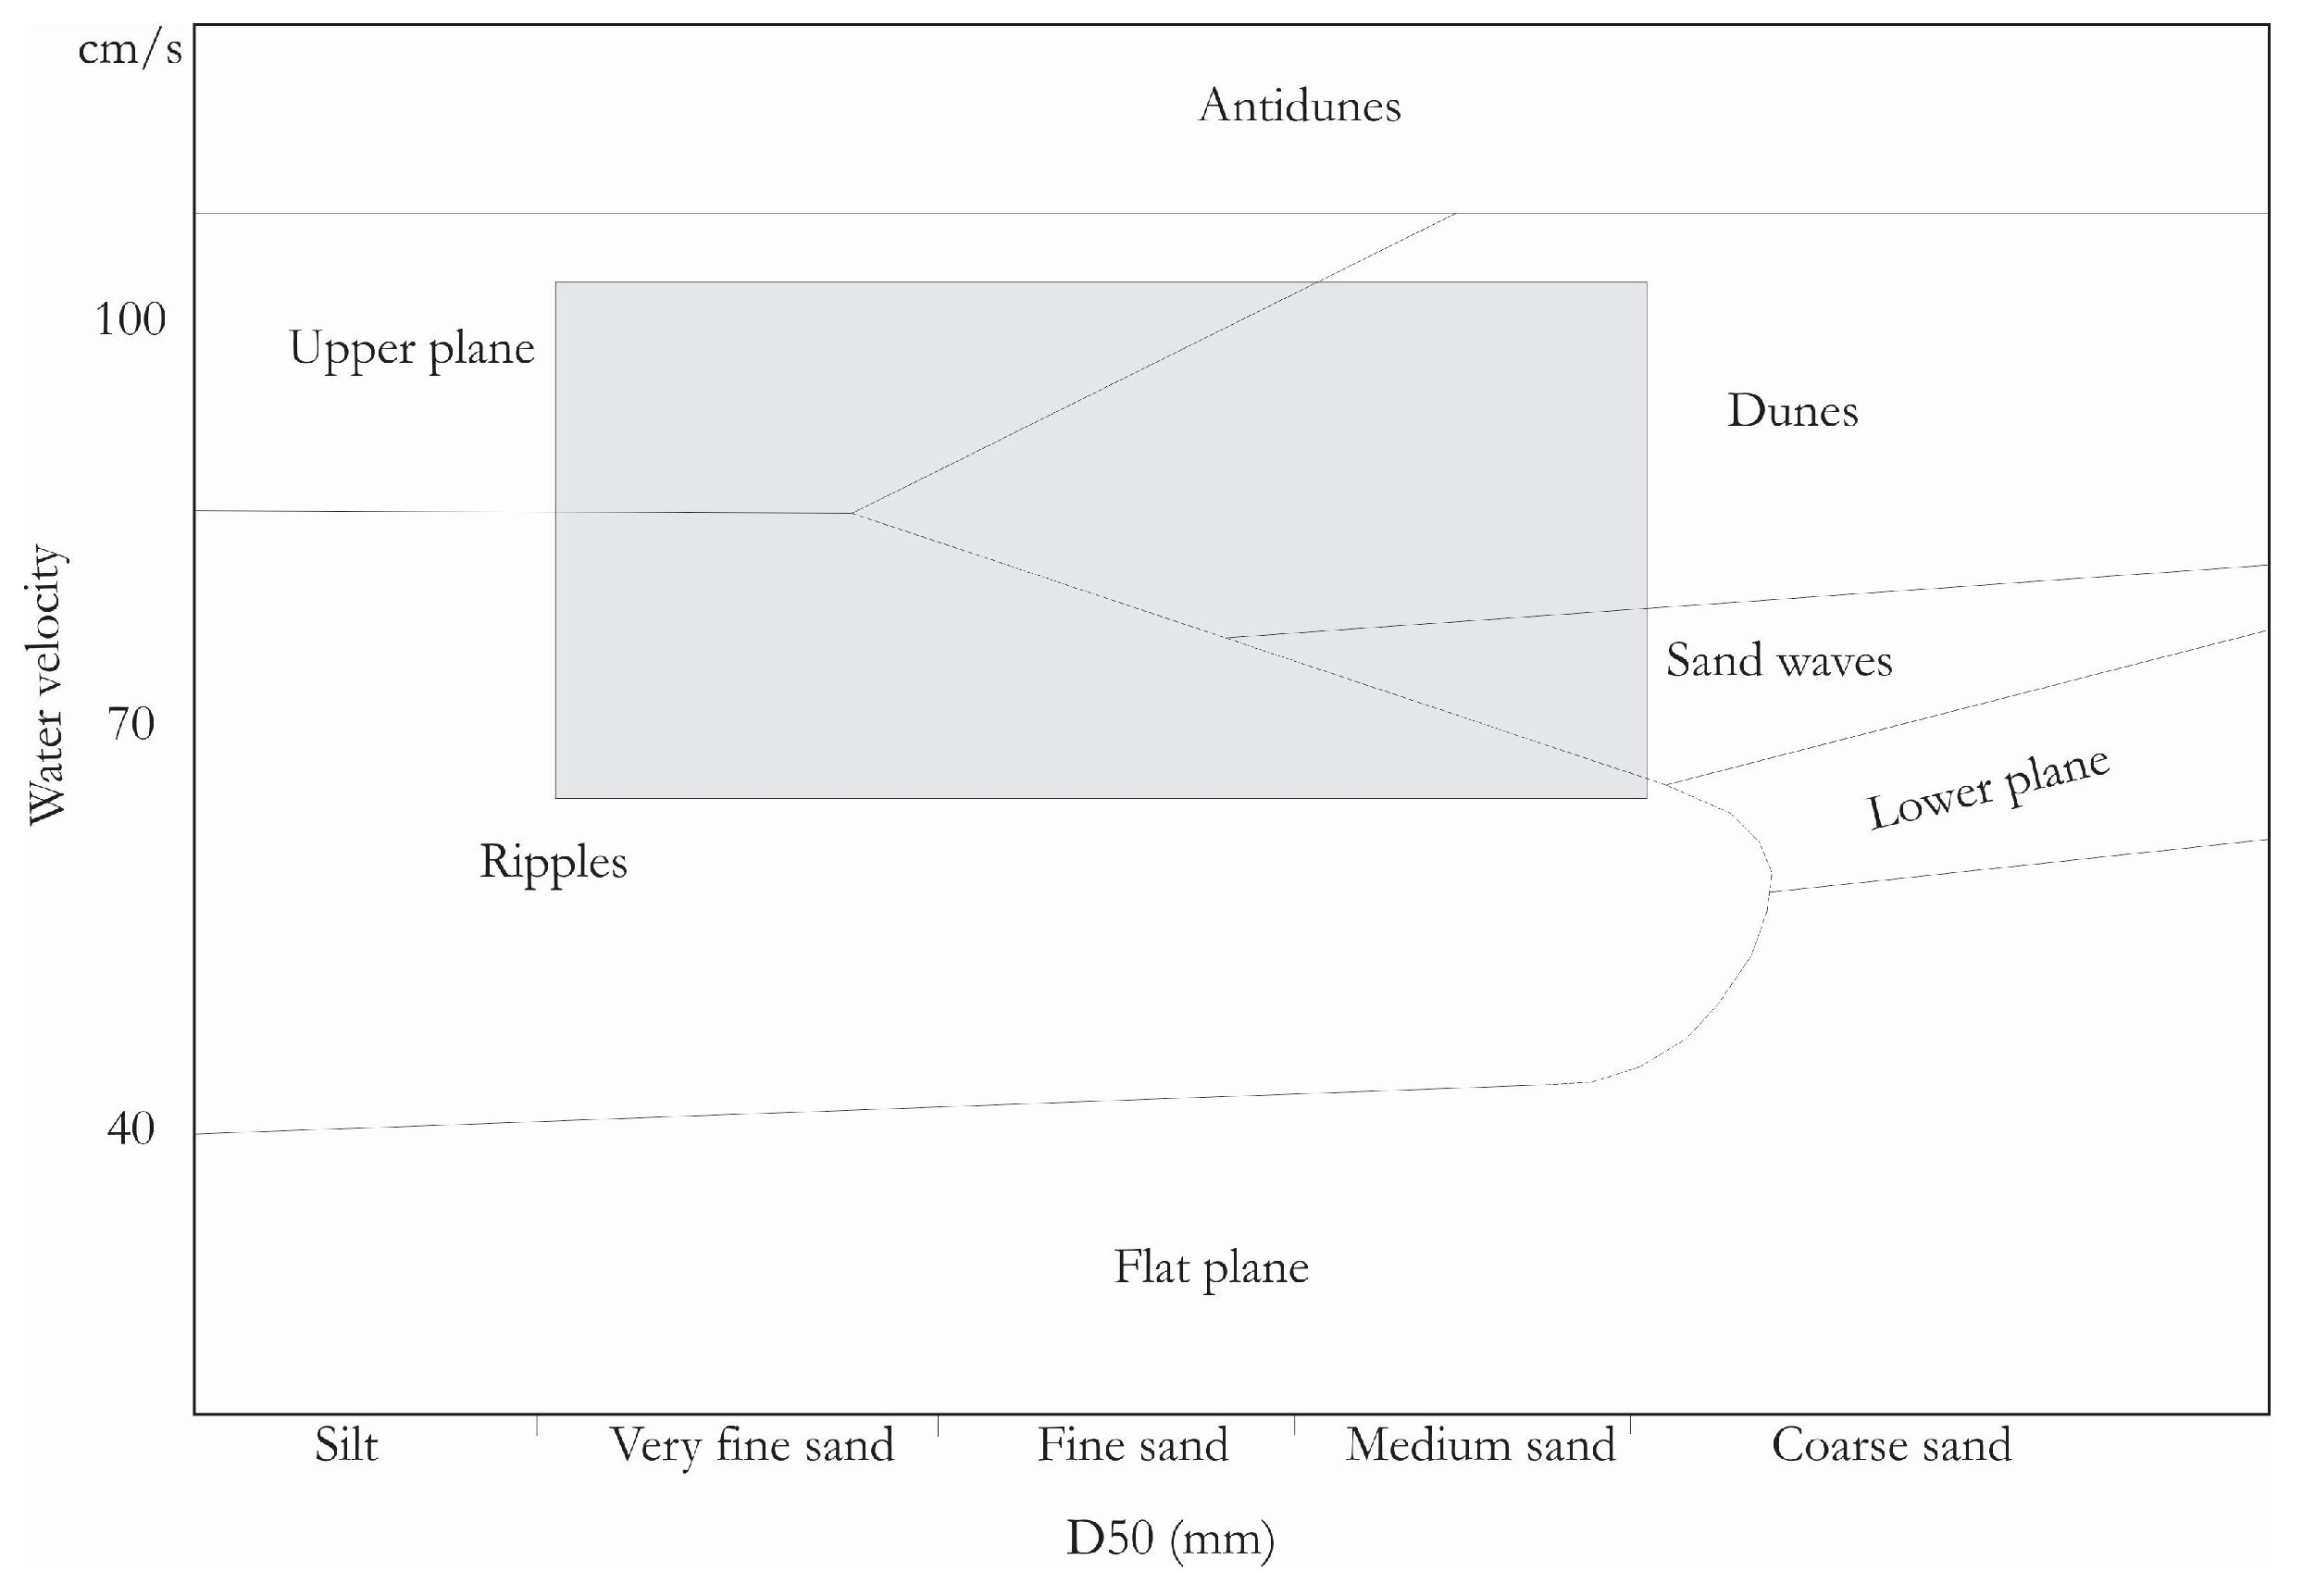
5.4. Southard Diagram

It is known that the bedform shape and dimension are in relation with the current velocity, as a main factor, but also with the particles dimensions [19,58] (Figure 8).
On the Southard diagram (1975), the Sulina channel cover a large and various domain covering micro-forms, such as ripples and megaripples, but also small and large dunes and superior flat bed, composed by fine, medium, and very fine sand (D50 between 0.06 and 0.35 mm).
It is clear that except for the very small forms (<0.1–0.2 m, defined such as flatbed), the other bedforms that were identified on the Sulina channel were created under previous hydrological conditions. Measured large and small dunes were not in equilibrium; they are remodelled by the present flow. For the small bedforms, the reaction time to the flow regime is changing rapidly, while the large bedforms need a longer period to move and change their shape, even when the hydrological conditions are different [24,59,60].

5.5. Anthropic Influences on the Bedforms Evolution

At the base of the small and large dune formations on the Sulina channel, the main factor (water flow intensity) combines with other local anthropically influenced factors, such as bed morphology or river construction (groins, dykes). Unfortunately, the effect of each factor cannot be quantified. Depending on their location in the riverbed, the effect of the groins on sedimentary transit varied through the channel. We identified two types of general situations: (a) erosion located around the groins and (b) sediment accumulations in the spaces between groins.
(a) This situation is quite often identified on the 3D bathymetry of the Sulina channel. In many cases, the areas with groins surrounding by bed erosion are overlapped on the sinuosities of the bed and the local morphological conditions have diminished, cancelled, or even reversed the purposed positioning of the groin. Generally, the eroded sedimentary material is accumulated downstream as small or large dunes. Such areas have been identified on 3D bathymetric maps close to miles 34, 33, 29, 29.8, 27, 22, 21, 7, 5, and 4.5 overlapping on the sinuous areas of the channel.
Figure 9 shows the area of the Sulina channel bifurcation, close to Ceatal St. George, (between M34 and M33). Here, the groin, situated in the right bank (on the concavity zone of the sinuosity) did not diminish the erosion tendency specific to a concave bank (Figure 9). The eroded sediments from the bed are accumulated downstream on the opposite bank in the form of a dune of approximately 350 m in length and 2.8 m in height. It is possible that this dune will also be formed by sediment eroded locally, from the right bank. Its asymmetrical shape shows that it moves downstream to the first obstacle in the bed, which is a groin at M33 + 470 m.
Downstream, in the left bank a new erosion area is located between two successive groins. Here, the erosion created a circular morphological shape (due to turbidity currents) and the maximum depth in the eroded area is 20 m while the depth at the centre of the channel is approximately 13.3–14 m. The eroded sediments are deposited immediately downstream as a dune is located in the central area of the channel. This creates a succession of erosion-accumulation areas, but unfortunately, without the desired effect of the groin positioning, to divert the current to the centre of the channel by sedimentation of the zones between the groins.
(b) Along the Sulina channel, there have been many sectors identified where the groins have reached their intended purpose, the accumulation of sediments and the release of the central channel. Examples are evident at the miles 20, 14, 8, where sedimentary accumulations can be observed in the space between the groins. In Figure 10, we extract from the bathymetric map a sector in the M8 area. The cross-sections of the bed show that sedimentary deposits are located in the left bank, in the area between the groins.

6. Conclusions

Multibeam bathymetry was able to highlight morphological forms that were difficult or even impossible to identify on the classical bathymetrical maps. This type of investigation had accurately described the bed shape of the Sulina channel at the time of measurements, in February 2007, under hydrological conditions of medium to high waters.
Built more than a century ago, the groins are still impacting the Sulina channel. Depending on the location in the channel, the sedimentary transit was modified. Two types of general situations have been identified: sediment accumulations in the spaces between the groins and erosion located around the groins.
Four types of bedforms are distinguished, including flat bed, megaripple, and small and large dune, and there is a good exponential correlation between H and L of all bedforms. The application of the equation proposed by [53,54] showed that during the measurements at the water discharge of about 1330 m3·s−1, the bedforms (small and large dunes) were below the maximum evolution limit. The ratio of their height and length below 0.06 (between 0.001 and 0.058) demonstrates that the bedforms measured in the Sulina channel were not in dynamic equilibrium. They are bedforms developed and matured during previous hydrological conditions, and were undergoing remodelling at the time of our measurement. However, the megaripples that were identified in the bed as singular primary forms, or overlapping the dunes (as secondary forms), were quite large in size near the maximum limit of evolution. It is clear that under medium-water hydrological conditions, the Sulina channel has the competence to develop only minor bedforms, the large ones being partly re-mobilized.

Acknowledgments

This work was supported by The National Research and Development Institute for Marine Geology and Geoecology—GEOECOMAR (Consultancy Contract, Beneficiary: DHV consultancy & engineering, Contract No. 1/07/02.2007: “Consultancy services for Feasibility study and design of Sulina Channel bank protection”.

Author Contributions

This research was carried out in collaboration between all authors. All four authors participated in sample collection, sample analysis, data interpretation, as well as preparation of the manuscript. All authors read and approved the final manuscript.

Conflicts of Interest

The authors declare no conflict of interest.

References

  1. Ashworth, P.J.; Best, J.L.; Roden, J.E.; Bristow, C.S.; Klaassen, G.J. Morphological evolution and dynamics of a large, sand braid-bar, Jamuna River, Bangladesh. Sedimentology 2000, 47, 533–555. [Google Scholar] [CrossRef]
  2. Gupta, A. Large rivers. Geomorphology 2002, 44, 173–174. [Google Scholar] [CrossRef]
  3. Syvitski, J.P.M.; Vorosmarty, C.J.; Kettner, A.J.; Green, P. Impact of humans on the flux of terrestrial sediment to the global coastal ocean. Science 2005, 308, 376–380. [Google Scholar] [CrossRef] [PubMed]
  4. Yang, S.; Zhao, Q.; Belkin, I.M. Temporal variation in the sediment load of the Changjiang river and the influence of human activities. J. Hydrol. 2002, 263, 56–71. [Google Scholar] [CrossRef]
  5. Amiri-Simkooei, A.R.; Snellen, M.; Simons, D.G. Riverbed sediment classification using multibeam echo-sounder backscatter data. J. Acoust. Soc. Am. 2009, 126, 1724–1738. [Google Scholar] [CrossRef] [PubMed]
  6. Baghlani, A.; Talebbeydokhti, N.A. Mapping Technique for Numerical Computations of Bed Evolutions. Appl. Math. Model. 2007, 31, 499–512. [Google Scholar] [CrossRef]
  7. Courtney, R.C.; Fader, G.B.J. A new understanding of the ocean floor through multibeam mapping. In Sci. Rev. 1992 and 1993; Fiander, A., Ed.; Department of Fishieries and Oceans, Bedford Institute of Oceanography: Dartmouth, NS, Canada, 1992; pp. 9–14. [Google Scholar]
  8. Eleftherakis, D.; Amiri-Simkooei, A.R.; Snellen, M.; Simons, D.G. Improving riverbed sediment classification using backscatter and depth residual features of multi-beam echo-sounder systems. J. Acoust. Soc. Am. 2012, 131, 3710–3725. [Google Scholar] [CrossRef] [PubMed]
  9. Goff, J.A.; Orange, D.L.; Mayer, L.A.; Hughes Clarke, J.E. Detailed investigation of continental shelf morphology using a high-resolution swath sonar survey: The Eel margin, northern California. Mar. Geol. 1999, 154, 255–269. [Google Scholar] [CrossRef]
  10. Huizinga, R.J. Bathymetric surveys at highway bridges crossing the Missouri River in Kansas City, Missouri, using a multibeam echo sounder, 2010. In USA Geological Survey Scientific Investigations Report; U.S. Geological Survey: Reston, VA, USA, 2010; p. 60. [Google Scholar]
  11. Li, M.Z.; King, E.L. Multibeam bathymetric investigations of the morphology of sand ridges and associated bedforms and their relation to storm processes, Sable Island Bank, Scotian Shelf. Mar. Geol. 2007, 243, 200–228. [Google Scholar] [CrossRef]
  12. Wright, L.D. Benthic boundary layers of estuarine and coastal environments. Rev. Aquat. Sci. 1989, 1, 75–95. [Google Scholar]
  13. Urgeles, R.; Canals, M.; Baraza, J.; Alonso, B.; Masson, D. The most recent megaslides on the Canary Islands: The El Golfo debris avalanche and the Canary debris flow, West Hierro Island. J. Geophys. Res. 1997, 102, 20305–20323. [Google Scholar] [CrossRef]
  14. Ashley, G.M. Classification of large-scale subaqueous bedforms: A new look at an old problem. J. Sediment. Petrol. 1990, 60, 160–172. [Google Scholar]
  15. Carling, P.A.; Gölz, E.; Orr, H.G.; Radecki-Pawlik, A. The morphodynamics of fluvial sand dunes in the River Rhine near Mainz, Germany. I. Sedimentology and morphology. Sedimentology 2000, 47, 227–252. [Google Scholar] [CrossRef]
  16. Chen, J.; Wang, Z.; Li, M.; Wei, T.; Chen, Z. Bedform characteristics during falling flood stage and morphodynamic interpretation of the middle–lower Changjiang (Yangtze) River channel, China. Geomorphology 2012, 147, 18–26. [Google Scholar] [CrossRef]
  17. Nemeth, A.A.; Hulscher, S.J.M.H.; van Damme, R.M.J. Modelling offshore sand wave evolution. Cont. Shelf Res. 2007, 27, 713–728. [Google Scholar] [CrossRef]
  18. Song, T.; Graf, W.H. Velocity and turbulence distribution in unsteady open-channel flows. J. Hydraul. Eng. 1996, 122, 141–154. [Google Scholar] [CrossRef]
  19. Southard, J.B.; Boguchwal, L.A. Bed configurations in steady unidirectional water flow. Part 2. Synthesis of flume data. J. Sediment. Res. 1990, 60, 658–679. [Google Scholar] [CrossRef]
  20. Van Rijn, L.C. Sediment Transport, Part III: Bed Forms and Alluvial Roughness. J. Hydraul. Eng. 1984, 110, 1733–1754. [Google Scholar] [CrossRef]
  21. Van Rijn, L.C. Principles of Sediment Transport in Rivers, Estuaries and Coastal Seas; Aqua Publications: Amsterdam, The Netherland, 1993; p. 715. [Google Scholar]
  22. Guy, H.P.; Simons, D.B.; Richardson, E.V. Summary of Alluvial Channel Data from Flume Experiments, 1956–61; US Government Printing Office: Washington, DC, USA, 1966; pp. 1–96.
  23. Wan, Z. Bed material movement in hyperconcentrated flow. J. Hydraul. Eng. 1985, 111. [Google Scholar] [CrossRef]
  24. Kostaschuk, R.; Best, J. Response of sand dunes to variations in tidal flow: Fraser Estuary, Canada. J. Geophys. Res. 2005, 110, F04S04. [Google Scholar] [CrossRef]
  25. Best, J. The Fluid Dynamics of River Dunes: A Review and Some Future Research Directions. J. Geo-Phys. Res. 2005, 110, F04S02. [Google Scholar] [CrossRef]
  26. Giri, S.; Shimizu, Y. Numerical Computation of Sand Dune Migration with Free Surface Flow. Water Resour. Res. 2006, 42, W10422. [Google Scholar] [CrossRef]
  27. Shimizu, Y.; Giri, S.; Yamaguchi, S.; Nelson, J. Numerical Simulation of Dune––Flat Bed Transition and Stage––Discharge Relationship with Hysteresis Effect. Water Resour. Res. 2009, 45, W04429. [Google Scholar] [CrossRef]
  28. Toniolo, H. Bed Forms and Sediment Characteristics along the Thalweg on the Tanana River near Nenana, Alaska, USA. Nat. Resour. 2013, 4, 20–30. [Google Scholar] [CrossRef]
  29. Redechi-Pawlik, A.; Ksiazek, L. The morphology and morphodunamics of sand-gravel subaquatic dunes: The raba River estuary, Poland. Georeview 2012, 21, 8–32. [Google Scholar] [CrossRef]
  30. Harbor, D.J. Dynamics of bedforms in the lower Mississippi River. J. Sediment. Res. 1998, 68, 750–762. [Google Scholar] [CrossRef]
  31. Bondar, C.; Panin, N. The Danube Delta Hydrologic Database and Modeling. Geo-Eco-Marina 2000, 5, 5–52. [Google Scholar]
  32. Oaie, G.; Secrieru, D.; Bondar, C.; Szobotka, S.; Duţu, L.; Stănescu, I.; Opreanu, G.; Duţu, F.; Pojar, I.; Manta, T. Lower Danube River: Characterization of sediments and pollutants. Geo-Eco-Marina 2015, 21, 19–34. [Google Scholar]
  33. Bogardi, J.L. Fluvial Sediment Transport. In Advances in Hydroscience; Chow, V.T., Ed.; Academic Press: New York, NY, USA, 1972; Volume 8, pp. 183–259. [Google Scholar]
  34. Panin, N. The Danube Delta. Geomorphology and Holocene evolution: A Synthesis. Géomorphol. Relief Process. Environ. 2003, 4, 247–262. [Google Scholar] [CrossRef]
  35. Panin, N.; Overmars, W. The Danube Delta evolution during the Holocene: Reconstruction attempt using geomorphological and geological data, and some of the existing carthographic documents. Geo-Eco-Marina 2012, 18, 75–110. [Google Scholar]
  36. Panin, N. Danube Delta: Geology, Sedimentology, Evolution. Association des sédimentologistes français, maison de la Géologie: Paris, France, 1999; p. 66. [Google Scholar]
  37. Bondar, C.; Papadopol, A. Evoluţia albiei Canalului Sulina. Transp. Auto Navale Si Aeriene 1972, 2, 144–147. [Google Scholar]
  38. Bialik, R.J.; Karpiński, M.; Rajwa, A.; Luks, B.; Rowiński, P.M. Bedform Characteristics in Natural and Regulated Channels: A Comparative Field Study on the Wilga River, Poland. Acta Geophys. 2014, 62, 1413–1434. [Google Scholar] [CrossRef]
  39. Nikora, V.I. Methods for quantitative description of channel bed-forms. In Erosional and Channel Processes in Various Climatic Conditions; Moscow University: Moscow, Russia, 1987; pp. 327–328. [Google Scholar]
  40. Biedenharn, D.S.; Thorne, C.R.; Watson, C.C. Recent morphological evolution of the Lower Mississippi River. Geomorphology 2000, 34, 227–249. [Google Scholar] [CrossRef]
  41. Bagnold, R.A. An approach to the sediment transport problem from general physics. U.S. Geol. Surv. Prof. Pap. 1966, 422, 1–37. [Google Scholar]
  42. Hickin, E.J. River Geomorphology; Wiley: New York, NY, USA, 1995; p. 255. [Google Scholar]
  43. Miller, M.C.; Mccave, I.N.; Komar, P.D. Threshold of sediment motion under unidirectional currents. Sedimentology 1977, 24, 507–527. [Google Scholar] [CrossRef]
  44. Gessler, J. Beginning and Ceasing of Sediment Motion. In River Mechanics; Shen, H.W., Ed.; Colorado State University: Fort Collins, CO, USA, 1971; ISBN1 0521529700. ISBN2 9780521529709. [Google Scholar]
  45. Graf, W.H. Hydraulics of Sediment Transport; McGraw-Hill Book Co.: New York, NY, USA, 1971. [Google Scholar]
  46. Hjulström, F. Studies in the morphological activity of rivers as illustrated by the river Fyris. Geol. Inst. Univ. Uppsala Bull. 1935, 25, 221–528. [Google Scholar]
  47. Hjulström, F. Transportation of Detritus by Moving Water. In Recent Marine Sediments, a Symposium; Trask, P.D., Ed.; Society of Economic Paleontologists and Mineralogists: Tulsa, OK, USA, 1939; pp. 5–31. [Google Scholar]
  48. Shields, A. Application of Similarity Principles and Turbulence Research to Bed-Load Movement; California Institute of Technology: Pasadena, CA, USA, 1936. [Google Scholar]
  49. Bravard, J.P.; Petit, F. Les Cours d’eau, Dynamique du Système Fluvial; Armand Collin/Masson: Paris, France, 1997; p. 221. (In French) [Google Scholar]
  50. Allen, J.R.L. Sedimentary Structures: Their Character and Physical Basis; Elsevier: New York, NY, USA, 1984; p. 1256. [Google Scholar]
  51. Meyer-Peter, E.; Müller, R. Formulas for Bed Load Transport; IAHR: Madrid, Spain, June 1948. [Google Scholar]
  52. Martin Lin, C.Y. Bedform Migration in Rivers; Simon Fraser University: Burnaby, BC, Canada, 2011. [Google Scholar]
  53. Flemming, B.W. Zur Klassifikation subaquatischer, strömungstransversaler Transportkörper. Boch. Geol. Geotech. Arb. 1988, 29, 93–97. (In German) [Google Scholar]
  54. Flemming, B.W. The Role of Grain Size, Water Depth and Flow Velocity as Scaling Factors Controlling the Size of Subaqueous Dunes. In Marine Sandwave Dynamics; Trentesaux, A., Garlan, T., Eds.; University of Lille: Lille, France, 2000; pp. 55–61. [Google Scholar]
  55. Aberle, J.; Nikora, V.; Henning, M.; Ettmer, B.; Hentschel, B. Statistical characterization of bed roughness due to bed forms: A field study in the Elbe River at Aken, Germany. Water Resour. Res. 2010, 46, W03521. [Google Scholar] [CrossRef]
  56. Bridge, J.S.; Best, J.L. Flow, Sediment transport and bedform dynamics over the transition from dunes to upper-stage plane beds: Implication for the formation of planar laminae. Sedimentology 1988, 35, 753–763. [Google Scholar] [CrossRef]
  57. Coleman, S.E.; Nikora, V.I. Fluvial dunes: Initiation, characterization, flow structure. Earth Surf. Process. Landf. 2011, 36, 39–57. [Google Scholar] [CrossRef]
  58. Southard, J.B. Bed configuration. In Depositional Environments as Interpreted from Primary Sedimentary Structures and Stratification Sequences; Harms, J.C., Southard, J.B., Spearing, D.R., Walker, R.G., Eds.; SEPM Short Course No. 2; SEPM Society for Sedimentary Geology: Dallas, TX, USA, 1975. [Google Scholar]
  59. Giri, S.; Van Vuren, S.; Ottevanger, W.; Sloff, K. A Preliminary Analysis of Bedform Evolution in the Waal during 2002–2003 Flood Event Using Delft3D. In Marine and River Dune Dynamics; Best, J., Ed.; University of Leeds: Leeds, UK, 2008; pp. 141–148. [Google Scholar]
  60. Kostaschuk, R.; Villard, P. Flow and sediment transport over large subaqueous dunes: Fraser River, Canada. Sedimentology 1996, 43, 849–863. [Google Scholar] [CrossRef]
Figure 1. General map of the Sulina branch—separation of three sectors: upstream reach between M34 and M19 (A); “Big M” meander (between M19 and M8) (B) and downstream reach between M8 and mouth (C) with the investigation profiles.
Geosciences 08 00007 g001
Figure 2. Cut-off works of the Sulina distributary meander belts between 1868 and 1902 [36].
Geosciences 08 00007 g002
Figure 3. Definition diagram of basic dune characteristics, including height (H), length (L), and slope (β) [38].
Geosciences 08 00007 g003
Figure 4. (a) Primary megaripples located at M26; (b) Superimposed megaripples located on a small dune at M1; and, (c) Large dune located at M32 with several superimposed megaripples.
Geosciences 08 00007 g004
Figure 5. Shields Diagram.
Geosciences 08 00007 g005
Figure 6. Hjülström Diagram.
Geosciences 08 00007 g006
Figure 7. Bedform morphology: Height-length correlation for the measured bedforms of Sulina channel (n = 150) and comparison with the dune function of Flemming [53,54].
Geosciences 08 00007 g007
Figure 8. Diagram of bedforms related to the water flow and the sediment dimensions (in grey the domain covered by the Sulina channel bedforms) (after [58]).
Geosciences 08 00007 g008
Figure 9. Erosion zone located between successive groins at M34 and M33.
Geosciences 08 00007 g009
Figure 10. Sediments accumulations located between groins at M8 and M7.
Geosciences 08 00007 g010
Table 1. Textural characteristics of collected sediments.
SamplesGranulesSandSiltClayShepard ClassificationD50 Φ
%%%%
P6 0160.0016.8946.6236.49Clayey silt6.62
P6 0170.00100.000.000.00Sand2.31
P6 0180.0092.714.312.97Sand2.88
P7 0190.00100.000.000.00Sand2.49
P7 0200.004.3769.5326.10Clayey silt6.13
P7 02117.9379.471.151.45Sand−0.36
P8 0220.004.5265.1830.30Clayey silt6.71
P8 0230.00100.000.000.00Sand2.89
P8 0240.00100.000.000.00Sand2.35
P9 0260.00100.000.000.00Sand2.26
P9 0270.00100.000.000.00Sand1.86
P10 0280.007.2752.3740.35Clayey silt7.27
P11A 0290.003.4774.1022.43Clayey silt5.47
P11B 0300.00100.000.000.00Sand1.48
P12 0310.00100.000.000.00Sand1.93
C2A 0320.00100.000.000.00Sand1.89
Table 2. Main hydrodynamics parameters for the analysed reaches of the channel.
ReachWidthDepthWater Energy SlopeMean Velocity
mmm·km−1m·s−1
Reach A98.00–134.0010.00–19.800.0630.80
Reach B103.00–136.0010.00–27.000.0510.98
Reach C100.00–143.0010.70–19.700.0470.74
Table 3. Values of ω and τ0 in the investigated cross-sections.
Morphodynamic Parameters ω and τ0 P7P9P10P11AP11CP11BC3AC3CC3BP12C2A
ω (W·m−2)10.236.796.178.641.018.155.190.805.195.537.06
τ0 (N·m−2)10.418.627.557.603.066.537.702.868.117.457.47

