Precious Metal Enrichment at the Myra Falls VMS Deposit, British Columbia, Canada
by
Daniel Marshall
1,*, 
Carol-Anne Nicol
1,
Robert Greene
1,
Rick Sawyer
2,
Armond Stansell
2 and
Ross Easterbrook
3 1
Earth Sciences, Simon Fraser University, Burnaby, BC V5A 1S6, Canada
2
Nyrstar Mining, Campbell River, BC V9W 5E2, Canada
3
Coeur Mining, Chicago, IL 60603, USA
*
Author to whom correspondence should be addressed.
Geosciences 2018, 8(11), 422; https://doi.org/10.3390/geosciences8110422
Submission received: 30 October 2018
/
Revised: 12 November 2018
/
Accepted: 13 November 2018
/
Published: 15 November 2018
(This article belongs to the Special Issue Magmatic-Hydrothermal Ore Deposits)
Abstract
:Gold, present as electrum, in the Battle Gap, Ridge North-West, HW, and Price deposits at the Myra Falls mine, occurs in late veinlets cutting the earlier volcanogenic massive sulphide (VMS) lithologies. The ore mineral assemblage containing the electrum comprises dominantly galena, tennantite, bornite, sphalerite, chalcopyrite, pyrite, and rarely stromeyerite, and is defined as an Au-Zn-Pb-As-Sb association. The gangue is comprised of barite, quartz, and minor feldspathic volcanogenic sedimentary rocks and clay, comprised predominantly of kaolinite with subordinate illite. The deposition of gold as electrum in the baritic upper portions of the sulphide lenses occurs at relatively shallow water depths beneath the sea floor. Primary, pseudosecondary, and secondary fluid inclusions, petrographically related to gold, show boiling fluid inclusion assemblages in the range of 123 to 173 °C, with compositions and eutectic melt temperatures consistent with seawater at approximately 3.2 wt % NaCl equivalent. The fluid inclusion homogenization temperatures are consistent with boiling seawater corresponding to water depths ranging from 15 to 125 m. Slightly more dilute brines corresponding to salinities of approximately 1 wt % NaCl indicate that there is input from very low-salinity brines, which could represent a transition from subaqueous VMS to epithermal-like conditions for precious metal enrichment, mixing with re-condensed vapor, or very low-salinity igneous fluids.
1. Introduction
The Myra Falls (MF) polymetallic volcanogenic massive sulphide (VMS) deposit is located on Vancouver Island within a series of middle to late Devonian Sicker Group volcanogenic rocks (Figure 1). This deposit best fits a Kuroko-type or bimodal-felsic model [1]. While parts of the mine average over 4 g of gold per metric ton of ore, the overall proven mineral reserves for gold grade for the entire mining operation averaged 1.60 and 1.69 g/t in 2017 and 2016, respectively. The precious metal production at Myra Falls is of significant economic importance, with an annual production of approximately 6000 and 240,000 troy ounces of gold and silver, respectively [2].
Gold typically occurs in VMS deposits in four ways: (i) Au-Zn-Pb-Ag-Sb barite association, (ii) Au-Cu-Bi-Co association, (iii) Au-enriched, base metal-poor massive pyrite, (iv) Au-rich deposits that have been supergene-altered [3]. The Au-Zn-Pb-Ag-Sb barite and Au-Cu associations have been better documented, having been observed in both ancient VMS deposits [4] and active black smoker deposits [5].
The Au-Zn-Pb-Ag-Sb barite assemblage is generally found concentrated near the top of massive sulphide lenses, with significant Au concentrations present in the overlying massive barite zones [3], often associated with siliceous cap rocks. The enrichment of Au at the top of the deposit is due to the metal zonation refinement by sustained circulation of hydrothermal fluids through the underlying volcanic pile [4]. Gold is leached from the base and center of the massive sulphide lens and then re-precipitated at the top of the deposit. Au located in the massive barite zone often lacks a close association with pyrite [6]. Gold in the upper portions of the deposit is believed to be transported predominantly by thio complexes (especially Au(HS)2−) at low temperatures (150–250 °C), in near-neutral (pH > 3.5) hydrothermal fluids, with lesser amounts of transport taking place via gold chloride complexes. Deposition occurs when these fluids mix with seawater, causing oxidation, an increase in pH, and most importantly, a decrease in aH2S. The activity of H2S is mainly reduced by the deposition of metallic sulphide minerals and dilution [4]. Feldspar-bearing alteration assemblages, possibly containing albite and celsian gangue, are commonly associated with the Au-Zn-Pb-Ag-Sb barite assemblage [3]. Although gold at MF also occurs to a lesser extent in Au-enriched, base metal-poor massive pyrite lenses, the Au-Zn-Pb-Ag-Sb association is the dominant mode of gold occurrence at MF and the focus of this study. To this end, we concentrate on the detailed petrography of the gold/electrum bearing veinlets to establish the exact paragenesis of precious metal enrichment, including detailed fluid inclusion petrography directly relating fluids to precious metal enrichment, water depth, and tectonic setting.
2. Regional and Local Geology
The Myra Falls deposit is located within the Paleozoic Sicker Group, which constitutes the basement of the Wrangellia terrane and Vancouver Island [7]. The Sicker Group is overlain unconformably by the Permian Buttle Lake Group limestones and younger rocks. Rocks of the Wrangellia terrane are generally metamorphosed to greenschist facies, with some amphibolite-facies contact-metamorphic zones near the Jurassic Island intrusive rocks [8].
The Sicker Group volcanic rocks are exposed in several anticlinal zones on Vancouver Island, such as the Buttle Lake, Cowichan, Nanoose, and West Coast uplifts [7,8]. The Sicker Group is divided into four formations. The Price Formation is stratigraphically the lowest and the footwall of the HW and Battle orebodies (Figure 2). It consists of andesitic volcanic and volcaniclastic rocks that were deposited directly on the seafloor. The contact with the overlying Myra Formation, host to the orebodies, involves a transition from andesitic volcanic to rhyolitic volcaniclastic rocks.
The Myra Formation is a succession of rhyolitic, andesitic, and basaltic volcanic and sedimentary rocks, containing all of the ore bodies at MF. The HW and Battle deposits are found within its basal unit, the HW horizon. The HW horizon consists of coarse-grained rhyolitic volcaniclastic rocks, sandstones, and mudstones overlain by massive porphyries. The HW and Battle orebodies are mostly found in volcaniclastic rocks near the base of the HW horizon. They are massive to semimassive tabular sulphide lenses, with main ores of chalcopyrite, sphalerite, pyrite, and galena. Some bornite and tetrahedrite, as well as accessory chalcocite, colusite, and gold are also present. The HW horizon also hosts zones of semimassive sulphides above the Battle and HW deposits. These are high in sphalerite, galena, and barite, but low in pyrite. The sulphide lenses are zoned vertically and laterally and accompanied by silicification of the host rocks. Overlying the HW horizon are thick hanging-wall andesites, which are conformably overlain by a unit of volcaniclastic, felsic volcanic, and sedimentary rocks. The Lynx-Myra-Price orebodies are hosted within this unit.
The Myra Formation is overlain by the Thelwood Formation, which is a laminated mudstone interbedded with volcaniclastic rocks and mafic sills. The Thelwood Formation is overlain conformably by the Flower Ridge formation, a package of amygdaloidal basaltic flows and volcaniclastic rocks, tuffaceous siltstones, wackes, and argillites [8].
The Myra Falls area was affected by five separate deformation events, which have influenced the formation and distribution of the orebodies. First, pre-Permian event D1 caused northwest-trending folding [7]. Early to Mid-Jurassic [7] folding, event D2, resulted in localized shear zones and reactivated F1 folds [8]. Steep, conjugate strike-slip faults and bedding-parallel thrust faults and shears resulted from event D3 [7,8], normal faults from event D4, and large thrust faults and steep, west- to west-northwest-striking sinistral strike-slip faults from event D5 [8].
3. Analytical Methods
3.1. Sampling
Given the four possible modes of gold/electrum occurrence in VMS deposits, samples were taken from a number of locations within the mine, dominantly from drill core where visible gold occurred and from hand samples collected underground. These samples were selected to optimize the study of the petrographic relationship between gold, other ore, gangue, and alteration minerals. Bearing in mind that gold is relatively rare, this did limit our ability to collect numerous samples of petrographic relevance. Areas within the mine sampled either from active stopes, existing samples or drill core included Battle Gap, Ridge Northwest, HW North Slope, HW South Flank, HW stringer zone, Marshall, and Price (Figure 2).
3.2. Electron Microprobe Mineral Composition Data
Selected doubly-polished plates and polished thin sections containing gold compounds underwent in-situ electron microprobe analysis of the electrum. Electron microprobe analyses of electrum were performed at Carleton University using an automated 4-spectrometer Camebax MBX electron probe using the wavelength dispersive x-ray (WDX) analysis method. Operating conditions were an accelerating potential of 15 kilovolts (kv) and a beam current of 20 nanoamperes (nA). Counting times were up to 50 s or 40,000 accumulated counts. X-ray lines were chosen to minimize or eliminate possible elemental interferences. Raw x-ray data were converted to elemental weight % via the Cameca PAP matrix correction program. For the elements considered, the following standards, X-ray lines, and crystals were used: Au80Ag20, Au Lα; Ag80Au20, Ag Lα; Chalcopyrite, Cu K α; Stibnite, Sb Kα; Cinnabar, Hg Kα.
3.3. Raman Spectroscopic Analyses
Raman spectroscopic identification of the accidental inclusions (minerals) within fluid inclusions was performed on a Renishaw inVia Raman spectrometer equipped with a laser of 200 mW and 785 nm and Olympus BX41 optical microscope. Spectra were collected from 500 to 3000 cm−1 in non-confocal mode at room temperature. Areas of the individual gas peaks were parsed for gas abundances for CO2, CH4, N2, and H2S, and none of these gases were found in any of the inclusions analysed in this study.
3.4. Fluid Inclusion Microthermometric Measurements
For this study, 46 primary fluid-inclusion doubly-polished plates dominated by quartz and barite in textural equilibrium with gold-bearing veins were targeted. Initial petrographic work was completed in order to identify different fluid inclusion assemblages in both quartz and barite. Fluid inclusion measurements were performed with a Linkam THMS-G 600 heating-freezing stage attached to an Olympus BX51 microscope equipped with 5, 10, 50, and 100× long working distance Olympus objectives. The stage is capable of measurements in the range of −190 to +400 °C. Prior to collecting the heating and cooling measurements, the stage was calibrated with two synthetic fluid inclusion standards. The first standard yields phase transitions for pure H2O at 0.0 and 374.1 °C. The second standard comprises H2O-CO2 fluid inclusions and is used to calibrate the stage at −56.6 °C to the melting of solid CO2. The stage was periodically tested against the standards and results were always within ±0.2 °C for the two lowest temperature phase transitions and within ±2.0 °C for the higher temperature phase transition.
4. Gold Veinlet Petrology
This study comprised the petrographic analysis of 93 samples. From these samples, 14 containing gold in a polished thin section were specifically targeted to determine mineral assemblages pre- and syn-gold mineralization. In the bulk of our samples, gold occurred in thin anastomosing to discontinuous veinlets crosscutting the primary VMS mineralization (Figure 3) and barite cap rock (Figure 4). Paragenesis for the deposit is complicated by numerous volcanic depositional events and numerous deformational and subsequent alteration events [8]. However, the gold-bearing veinlets are very late in the deposit paragenesis (Figure 5), and cross cut all of the typical sub- and seafloor sulphide mineralization [10] associated with VMS deposits [1], including barite/silica cap rocks [8,10]. Gold grains, up to 4 mm in size, are commonly visible in the veinlets, and contemporaneous with subsets of the overall mineral assemblage of quartz, barite, sphalerite, galena, bornite, tennantite, chalcopyrite, pyrite, and rarely stromeyerite. Trace amounts of covellite, chalcocite, acanthite, and native silver have also been reported at MF, but were not observed in the veinlets in our study. Grain sizes for the vein sulphides, barite, quartz, and tennantite measure up to 1 cm. Quartz within the veinlets is subhedral to rarely euhedral (Figure 4) and has been used to delineate pseudo-secondary fluid inclusions directly related to veinlet formation and gold precipitation. The euhedral and subhedral textures are indicative of open space filling, as are minor amounts of brecciation, forming an anastomosing veinlet network.
The wall rock to the veinlets are typical VMS assemblages comprising variable amounts of plagioclase and less potassic feldspars, quartz, sulphides, minor sulphosalts, chlorite, epidote, tremolite, barite, and clays (kaolinite with subordinate illite). The feldspars present in the wall rock are primary igneous feldspars and show minor alteration to epidote. Chlorite and tremolite are interpreted to be the result of total alteration of primary igneous mafic minerals. We interpret the epidote, chlorite, tremolite, and some quartz to be a consequence of normal synvolcanic hydrothermal processes [1] during typical VMS paragenesis. The sulphides and rarely observed sulphosalts in the wall rocks are disseminated. They are interpreted to be dominantly related to primary VMS mineralization, but some minor recrystallization and/or precipitation may have occurred during the veinlet formation. Barite is abundant in the wall rock to the veinlets, and crystals may range up to 2.5 cm. Alteration of the wall rock proximal to the veins is dominantly silicification, and relicts and pseudomorphs of barite are present. Generally, there is an alteration halo of silicification and quartz recrystallization surrounding the veinlets (Figure 4). Barite occurs more distally to the veinlets and is often growth-zoned with relict crack seal trails of fluid inclusions. In some cases, silicification of the barite preserves the growth zones and crack seal textures, while in other samples crack seal textures occur in the silicified wall rock and quartz alteration haloes. We interpret this as continued co-precipitation of quartz and barite (Figure 5) in the wall rock during veinlet formation.
The electrum at Myra Falls is dominantly Au. Silver contents range throughout the deposit from approximately 30 to 35 wt % Ag. There are trace amounts of copper, with no detectable antimony or mercury (Table 1). The nugget effect greatly dictates local Au grades, with the electrum generally ranging from micron-sized to a few millimeters, averaging less than a millimeter. The electrum is generally inclusion-free, with occasional inclusions of quartz, barite, tennantite, sphalerite, and galena.
5. Fluid Inclusions
A total of 31 doubly-polished plates were examined in this study. A great deal of effort was expended to produce doubly-polished plates containing visible gold. Of the 31 samples, only 7 with visible gold survived the grinding and polishing process. This fluid inclusion study concentrated exclusively on the fluid inclusions petrographically related to the gold veinlets and the associated alteration halos. The measured fluid inclusions were hosted in the quartz or barite of the veinlets or their associated alteration haloes. Reconnaissance work on the larger number of samples revealed two populations of fluid inclusions: population one (P1) is comprised of low-salinity two-phase liquid and vapor (L + V) fluid inclusions (FIs), and a more rarely observed second population (P2) is comprised of three-phase FIs. P2 is represented at room temperature by an aqueous phase, carbonic liquid, and vapor phases. Both populations were identified in an earlier study [11], while a later study [8] only reported P1. Our observations for the P2 FIs indicate that they are of secondary or indeterminate origin; thus, we concur with an earlier study [11] that the origin of these inclusions is unclear and they are not representative of the overall hydrothermal system. We found no petrographic evidence that links them to gold and interpret them as later and definitely not related to the precipitation of gold in the gold-bearing veinlets; thus, no further study of the P2 fluids was pursued. Although both earlier studies reported primary, pseudosecondary, secondary, and indeterminate P1 fluid inclusions relative to base-metal VMS-type mineralization, the exact timing of these fluids relative to the late gold-bearing veinlets in this study is unclear.
P1 was studied as a fluid inclusion assemblage (FIA), permitting the interpretation of individual FIAs as contemporaneous [12]. FIAs were identified as primary, pseudosecondary, or secondary based on the presence of growth zones or overgrowths in the quartz and barite. The pseudosecondary inclusions were identified as FIs occurring along individual healed fractures within a single crystal with both ends of the fracture terminated by a growth zone. Additionally, P1 is subdivided into mixtures of a two-end member system ranging from vapor-dominant (P1V) FIs to the more prevalent liquid-dominant (P1L) FIs. Fluid inclusion dimensions range up to 12 microns in length, but average 4 microns. Due to the small size of the FIs, it was not possible to measure ice melting or liquid homogenization temperatures in the P1V end members. The presence of both liquid- and vapor-rich FIs within the same FIA is strong but not conclusive evidence of boiling. Further evidence to support our interpretation of boiling is presented below, based on fluid compositions and specific formational models for VMS deposits. Phase observations in the P1L FIs are shown in Table 2. In general, the freezing behavior upon cooling from room temperature results in the nucleation of ice between −42.3 to −28.3 °C. No further phase changes are observed upon cooling to −140 °C. In most cases, the bubble disappears upon ice nucleation, with the vapor likely residing in the many cracks within the ice; occasionally, some vestiges of the bubble remain visible in the ice. Ice nucleation generally imparts a darkening to the FIs, and this is interpreted as light refraction at ice-vapor interfaces within the inclusion. Heating of the FIs from −140 °C results in first melting temperatures over the range −28.1 to −21.5 °C. This is marked by the disappearance of the darkening due to liquid replacing vapor in the cracks within the ice. Further heating results in final ice-melting temperatures in the range of −3.4 to −0.7 °C. Continued heating results in a gradual decrease in the vapor bubble volume until total homogenization into the vapor in the temperature range of 119.5 to 172.8 °C. The microthermometric data for all the FIAs hosted in barite and quartz are shown in Figure 6. Measurement of the ice-melting temperatures was complicated by the presence of hydrohalite (NaCl·2H2O), which is metastable above the melting temperature and prevents the reappearance of the vapor bubble. The vapor phase was commonly metastably absent and difficult to impossible to nucleate in a number of fluid inclusions despite extended periods of freezing in liquid nitrogen or cooling in a refrigerator for days. Femtosecond-laser excitation has proven useful in nucleating meta-stable vapor bubbles in some fluid inclusions [13], but was deemed beyond the scope of this study, as the ice-melting temperatures could be measured in the absence of the vapor phase in some of our larger fluid inclusions, and was consistent with fluid inclusions within the same FIAs that were able to nucleate vapor bubbles. Fluid inclusions in barite were especially affected by the absence of the vapor bubble, as it hinders ice-melting measurements in small fluid inclusions where the ice itself is not readily visible.
6. Discussion and Conclusions
The primary, pseudosecondary, and secondary FIs related to the gold veinlets and associated alteration haloes (Figure 4) yield salinities in the range of −3.4 to −0.7 °C, corresponding to salinities of 1.2 to 5.6 wt % NaCl equivalent [14]. These salinities overlap with the theoretical salinities for seawater at approximately 3.2 wt % NaCl equivalent, and eutectic temperatures (Table 2) are also consistent with published seawater compositions and microthermometric data [15,16]. Homogenization temperatures range from 119.5 to 172.8 °C and were plotted on a depth vs. boiling curve (Figure 7) for seawater [17]. We reiterate that the FIAs show strong petrographic evidence of boiling. Likewise, the presence of open-space filling textures of vein quartz and minor brecciation within the veins complements the fluid inclusion evidence of boiling; thus, the measured FIs are consistent with seawater boiling at water depths of 15 to 125 m. Generally, VMS mineralization is constrained to water depths ranging between 700 and 2000 m [18]. This model of gold precipitation at very moderate depths and pressures is consistent with the gold-bearing veinlets being one of the last events overprinting the primary VMS formation (Figure 3, Figure 4 and Figure 5), as the thicknesses of the volcanic sequences increase and/or tectonics brings the seawater volcanic rock interface to increasingly shallower water depths (Figure 8) as per Reference [19]. Interestingly, the gold-bearing veinlets and associated alteration haloes, although generated by boiling seawater at shallow water depths, could occur at the seawater-rock interface or below under a maximum hydrostatic pressure corresponding to water depths listed above. Additionally, due to the dilute salinities, lower than those of seawater in some cases, we postulate that the gold-bearing veinlets could occur in the near-shore terrestrial environment at depths within heated saltwater intrusions into the terrestrial meteoric water table (Figure 8). This occurs as the volcanic system emerges from the sub-aqueous (VMS) to the sub-aerial (epithermal) environment and shows transitional features, such as epithermal vein mineralogy, nascent comb-textured quartz, and clay alteration of kaolinite and illite, typical of epithermal alteration. This mixing of seawater with non-saline meteoric groundwater would produce diluted seawater brines and mark the transition from a VMS to an epithermal environment [20].
This model of seafloor or sub-seafloor boiling, veining, and gold deposition is consistent with previous research on gold in VMS systems [5,18,21], with gold concentration occurring via a process of seawater interacting with thick volcanic sequences of massive sulphides via cooling and/or boiling, increasing the relative solubility of gold in the fluid until reaching saturation and precipitation, as per Reference [5]. This is also consistent with the mineralogy observed within the veinlets and the associated alteration haloes being enriched in tennantite, bornite, and barite, typical of more sulphur-poor or oxygen-rich fluids.
This shallow-water model for gold precipitation may initially seem to oppose the greater water depths formerly proposed for the Myra Falls VMS deposit [7,8,11]. However, we deem the two interpretations complementary, as the initial volcanic sequences, which later become host-rock to the gold-bearing veinlets, are deposited earlier at greater water depths, with gold precipitation occurring later in the sequence, as the system is uplifted via tectonics related to arc formation in an emergent arc system, which is common in Kuroko-type VMS deposits. This may also explain the dichotomy of proposed water depths for some other deposits, such as Eskay Creek, ranging from shallow to sub-aerial [22] to over 1500 m of water depth [23].
As discussed previously, there is also gold enrichment in pyrite-rich horizons in the Myra Falls system. It is presently unclear whether a model of nascent gold-bearing veinlet fluids, perhaps active along grain boundaries with fluid flow rates insufficient to generate specific veinlets and alteration, may be responsible for gold enrichment in the pyrite horizons. However, the lack of visible gold, barite, tennantite, bornite, and silica in these horizons favors a model for the Myra Falls pyrite-rich horizons different from our proposed veinlet model for gold enrichment.
The proposed model of gold-bearing veinlets in emergent VMS systems has some implications for exploration, as there may be subtle gold enrichments not yet identified in VMS systems that display continued development into increasingly shallower water systems, especially those with evidence of the sub-aqueous to sub-aerial transition.
Author Contributions
Conceptualization, D.M. and R.S.; Data curation, D.M., C.-A.N., R.G., A.S., and R.E.; Formal analysis, D.M., C.-A.N., and R.G.; Funding acquisition, D.M. and R.S.; Investigation, D.M., C.-A.N., A.S., and R.E.; Methodology, D.M., C.-A.N., R.G., and A.S.; Project administration, D.M. and R.S.; Resources, R.E.; Supervision, D.M.; Validation, R.G., A.S., and R.E.; Writing—original draft, D.M.; Writing—review & editing, D.M., C.-A.N., and A.S.
Funding
Natural Sciences and Engineering Research Council of Canada: 1889803.
Acknowledgments
Financial support for part of this project was provided by NSERC and Nyrstar grants to DM. Thanks are due to Nyrstar staff, especially Lorri Cummings, for invaluable assistance with underground and drill core sampling, and access to the mine’s geochemical database. Three very thorough reviews by anonymous reviewers greatly improved an earlier version of this manuscript.
Conflicts of Interest
The authors declare no conflict of interest.
References
- Galley, A.G.; Hannington, M.D.; Jonasson, I.R. Volcanogenic massive sulphide deposits. In Mineral Deposits of Canada: A Synthesis of Major Deposit-Types, District Metallogeny, the Evolution of Geological Provinces, and Exploration Methods; Goodfellow, W.D., Ed.; Geological Association of Canada, Mineral Deposits Division: St. John’s, NL, Canada, 2007; pp. 141–161. [Google Scholar]
- Nyrstar. Annual Report 2016. Available online: https://www.nyrstar.com/~/media/Files/N/Nyrstar/shareholder-meetings/english/2017/10-nyrstar-2016-annual-report-english-.pdf (accessed on 7 September 2018).
- Huston, D.L. Gold in volcanic-hosted massive sulfide deposits: Distribution, genesis, and exploration. Rev. Econ. Geol. 2000, 13, 401–426. [Google Scholar]
- Huston, D.L.; Large, R. A chemical model for the concentration of gold in volcanogenic massive sulphide deposits. Ore Geol. Rev. 1989, 4, 171–200. [Google Scholar] [CrossRef]
- Hannington, M.D.; Scott, S. Sulfidation equilibria as guides to gold mineralization in volcanogenic massive sulfides: Evidence from sulfide mineralogy and the composition of sphalerite. Econ. Geol. Bull. Soc. 1989, 84, 1978–1995. [Google Scholar] [CrossRef]
- Huston, D.L.; Bottrill, R.S.; Creelman, R.A.; Zaw, K.; Ramsden, T.R.; Rand, S.W.; Gemmell, J.B.; Jablonski, W.; Sie, S.H.; Large, R.R. Geologic and geochemical controls on the mineralogy and grain size of gold-bearing phases, eastern Australian volcanic-hosted massive sulfide deposits. Econ. Geol. 1992, 87, 542–563. [Google Scholar] [CrossRef]
- Jones, S.; Gemmell, J.B.; Davidson, G.J. Petrographic, geochemical, and fluid inclusion evidence for the origin of siliceous cap rocks above volcanic-hosted massive sulfide deposits at Myra Falls, Vancouver Island, British Columbia, Canada. Econ. Geol. Bull. Soc. 2006, 101, 555–584. [Google Scholar] [CrossRef]
- Jones, S.; Berry, R.; Sinclair, B. Multiple deformation episodes at Myra Falls volcanic-hosted massive sulfide camp, central Vancouver Island, British Columbia, Canada. Can. J. Earth Sci. 2006, 43, 1711–1732. [Google Scholar] [CrossRef] [Green Version]
- Chong, A.; Becherer, M.; Sawyer, R.; Wastenays, H.; Baldwin, R.; Bakker, F.; McWilliams, I. Massive Sulphide Deposits at Myra Falls Operations, Vancouver Island, British Columbia. Available online: http://www.empr.gov.bc.ca/mining/geoscience/publicationscatalogue/geofiles/documents/gf2006-07.pdf (accessed on 30 October 2018).
- Sinclair, B. Geology and Genesis of the Battle Zone VHMS Deposits, Myra Falls District, British Columbia, Canada. Ph.D. Thesis, Univerisity of Tasmania, Tasmania, Australia, 2001; p. 387. [Google Scholar]
- Barrett, T.J.; Sherlock, R.L. Volcanic stratigraphy, lithogeochemistry and seafloor setting of the H-W massive sulfide deposit, Myra Falls, Vancouver Island, British Columbia. Explor. Min. Geol. 1996, 5, 421–458. [Google Scholar]
- Goldstein, R. Petrographic analysis of fluid inclusions. In Fluid Inclusions: Analysis and Interpretation; Samson, I., Anderson, A., Marshall, D., Eds.; Mineralogical Association of Canada: Ottawa, ON, Canada, 2003; Volume 32, pp. 9–53. ISBN 0921294328. [Google Scholar]
- Kruger, Y.; Stoller, P.; Ricka, J.; Frenz, M. Femtosecond lasers in fluid-inclusion analysis: Overcoming metastable phase states. Eur. J. Mineral. 2007, 19, 693–706. [Google Scholar] [CrossRef]
- Bodnar, R.J. Introduction to aqueous-electrolyte fluid inclusions. In Fluid Inclusions: Analysis and Interpretation; Samson, I., Anderson, A., Marshall, D., Eds.; Mineralogical Association of Canada: Ottawa, ON, Canada, 2003; Volume 32, pp. 81–100. ISBN 0921294328. [Google Scholar]
- Nelson, K.H.; Thompson, T.G. Deposition of salts from seawater by frigid concentration. J. Marine Res. 1954, 13, 165–182. [Google Scholar]
- Crawford, M.L. Phase equilibria in aqueous fluid inclusions. In Fluid Inclusions: Applications to Petrology; Hollister, L.S., Crawford, M.L., Eds.; Mineral Association of Canada: Ottawa, ON, Canada, 1981; Volume 6, pp. 75–100. [Google Scholar]
- Butterfield, D.A.; Massoth, G.J.; McDuff, R.E.; Lupton, J.E.; Lilley, M.D. Geochemistry from hydrothermal fluids from Axial Seamount Hydrothermal Emissions Study vent field, Juan de Fuca Ridge: Subseafloor boiling and subsequent fluid-rock interaction. J. Geophys. Res. 1990, 95, 12895–12921. [Google Scholar] [CrossRef]
- Monecke, T.; Petersen, S.; Hannington, M.D. Constraints on water depth of massive sulfide formation: Evidence from modern seafloor hydrothermal systems in arc-related settings. Econ. Geol. 2014, 109, 2079–2101. [Google Scholar] [CrossRef]
- Hannington, M.D.; Bleeker, W.; Kjarsgaard, I. Sulfide mineralogy, geochemistry and ore genesis of the Kidd Creek deposit: Part II. The bornite zone. In The Giant Kidd Creek Volcanogenic Massive Sulfide Deposit, Western Abitibi Subprovince, Canada; Hannington, M.D., Barrie, C.T., Eds.; Society of Economic Geologists: Littleton, CO, USA, 1999. [Google Scholar]
- Hannington, M.D.; Poulsen, K.H.; Thompson, J.F.H.; Sillitoe, R.H. Volcanogenic gold in the massive sulfide environment. Rev. Econ. Geol. 1997, 8, 325–356. [Google Scholar]
- Heinrich, C.A.; Driesner, T.; Stefánsson, A.; Seward, T.M. Magmatic vapour contraction and transport of gold from the porphyry environment to epithermal ore deposits. Geology 2004, 32, 761–764. [Google Scholar] [CrossRef]
- Nadaraju, G. Triassic-Jurassic Biochronology of the Iskut River Map Areas, Northwestern British Columbia. Master’s Thesis, University of British Columbia, Vancouver, BC, Canada, 1993. [Google Scholar]
- Sherlock, R.; Roth, T.; Spooner, E.; Bray, C. Origin of the Eskay Creek precious metal-rich volcanogenic massive sulfide deposit: Fluid inclusion and stable isotope evidence. Econ. Geol. 1999, 94, 803–824. [Google Scholar] [CrossRef]
Figure 1.
Regional geological map showing the major lithological units at the Myra Falls mine. Inset figure shows the location of the mine within Canada.
Figure 1.
Regional geological map showing the major lithological units at the Myra Falls mine. Inset figure shows the location of the mine within Canada.

Figure 2.
Schematic cross section showing the relative positions of the different ore bodies within the Myra Falls mine (after [9]). All ore bodies occur within the Myra Formation.
Figure 2.
Schematic cross section showing the relative positions of the different ore bodies within the Myra Falls mine (after [9]). All ore bodies occur within the Myra Formation.

Figure 3.
Photomicrograph showing an anastomosing veinlet, contiguous with the veinlet in Figure 4, illustrating the crosscutting relationships between the later veinlet chalcopyrite (cp), galena (ga), gold (au), and quartz (q), and the primary VMS mineralization locally dominated by sphalerite (sp). Sample RG14-21B.

Figure 4.
Composite photomicrographs of the alteration halo surrounding the gold-bearing veinlets and fluid inclusions. The main image, taken under simultaneous plane-polarized transmitted and reflected light, shows the barite-rich wall rock (wr) and quartz dominated alteration halo (ah) surrounding the veinlet. The veinlet assemblage comprises tennantite (tn), galena (ga), sphalerite (sp), chalcopyrite (cp), and gold/electrum (au). The inset image shows the magnified region delineated by the orange rectangle, in plane-polarized light, comprising a trail of “boiling” pseudosecondary two-phase (liquid + vapor) fluid inclusions hosted within a quartz (q) crystal lining the walls of the veinlet. The two central fluid inclusions from population P1L represent the liquid portion of the boiling fluid, while the two outer fluid inclusions are from population P1V and represent the conjugate vapor inclusions of the boiling system. Sample RG14-21B, inset field of view is approximately 50 microns wide.

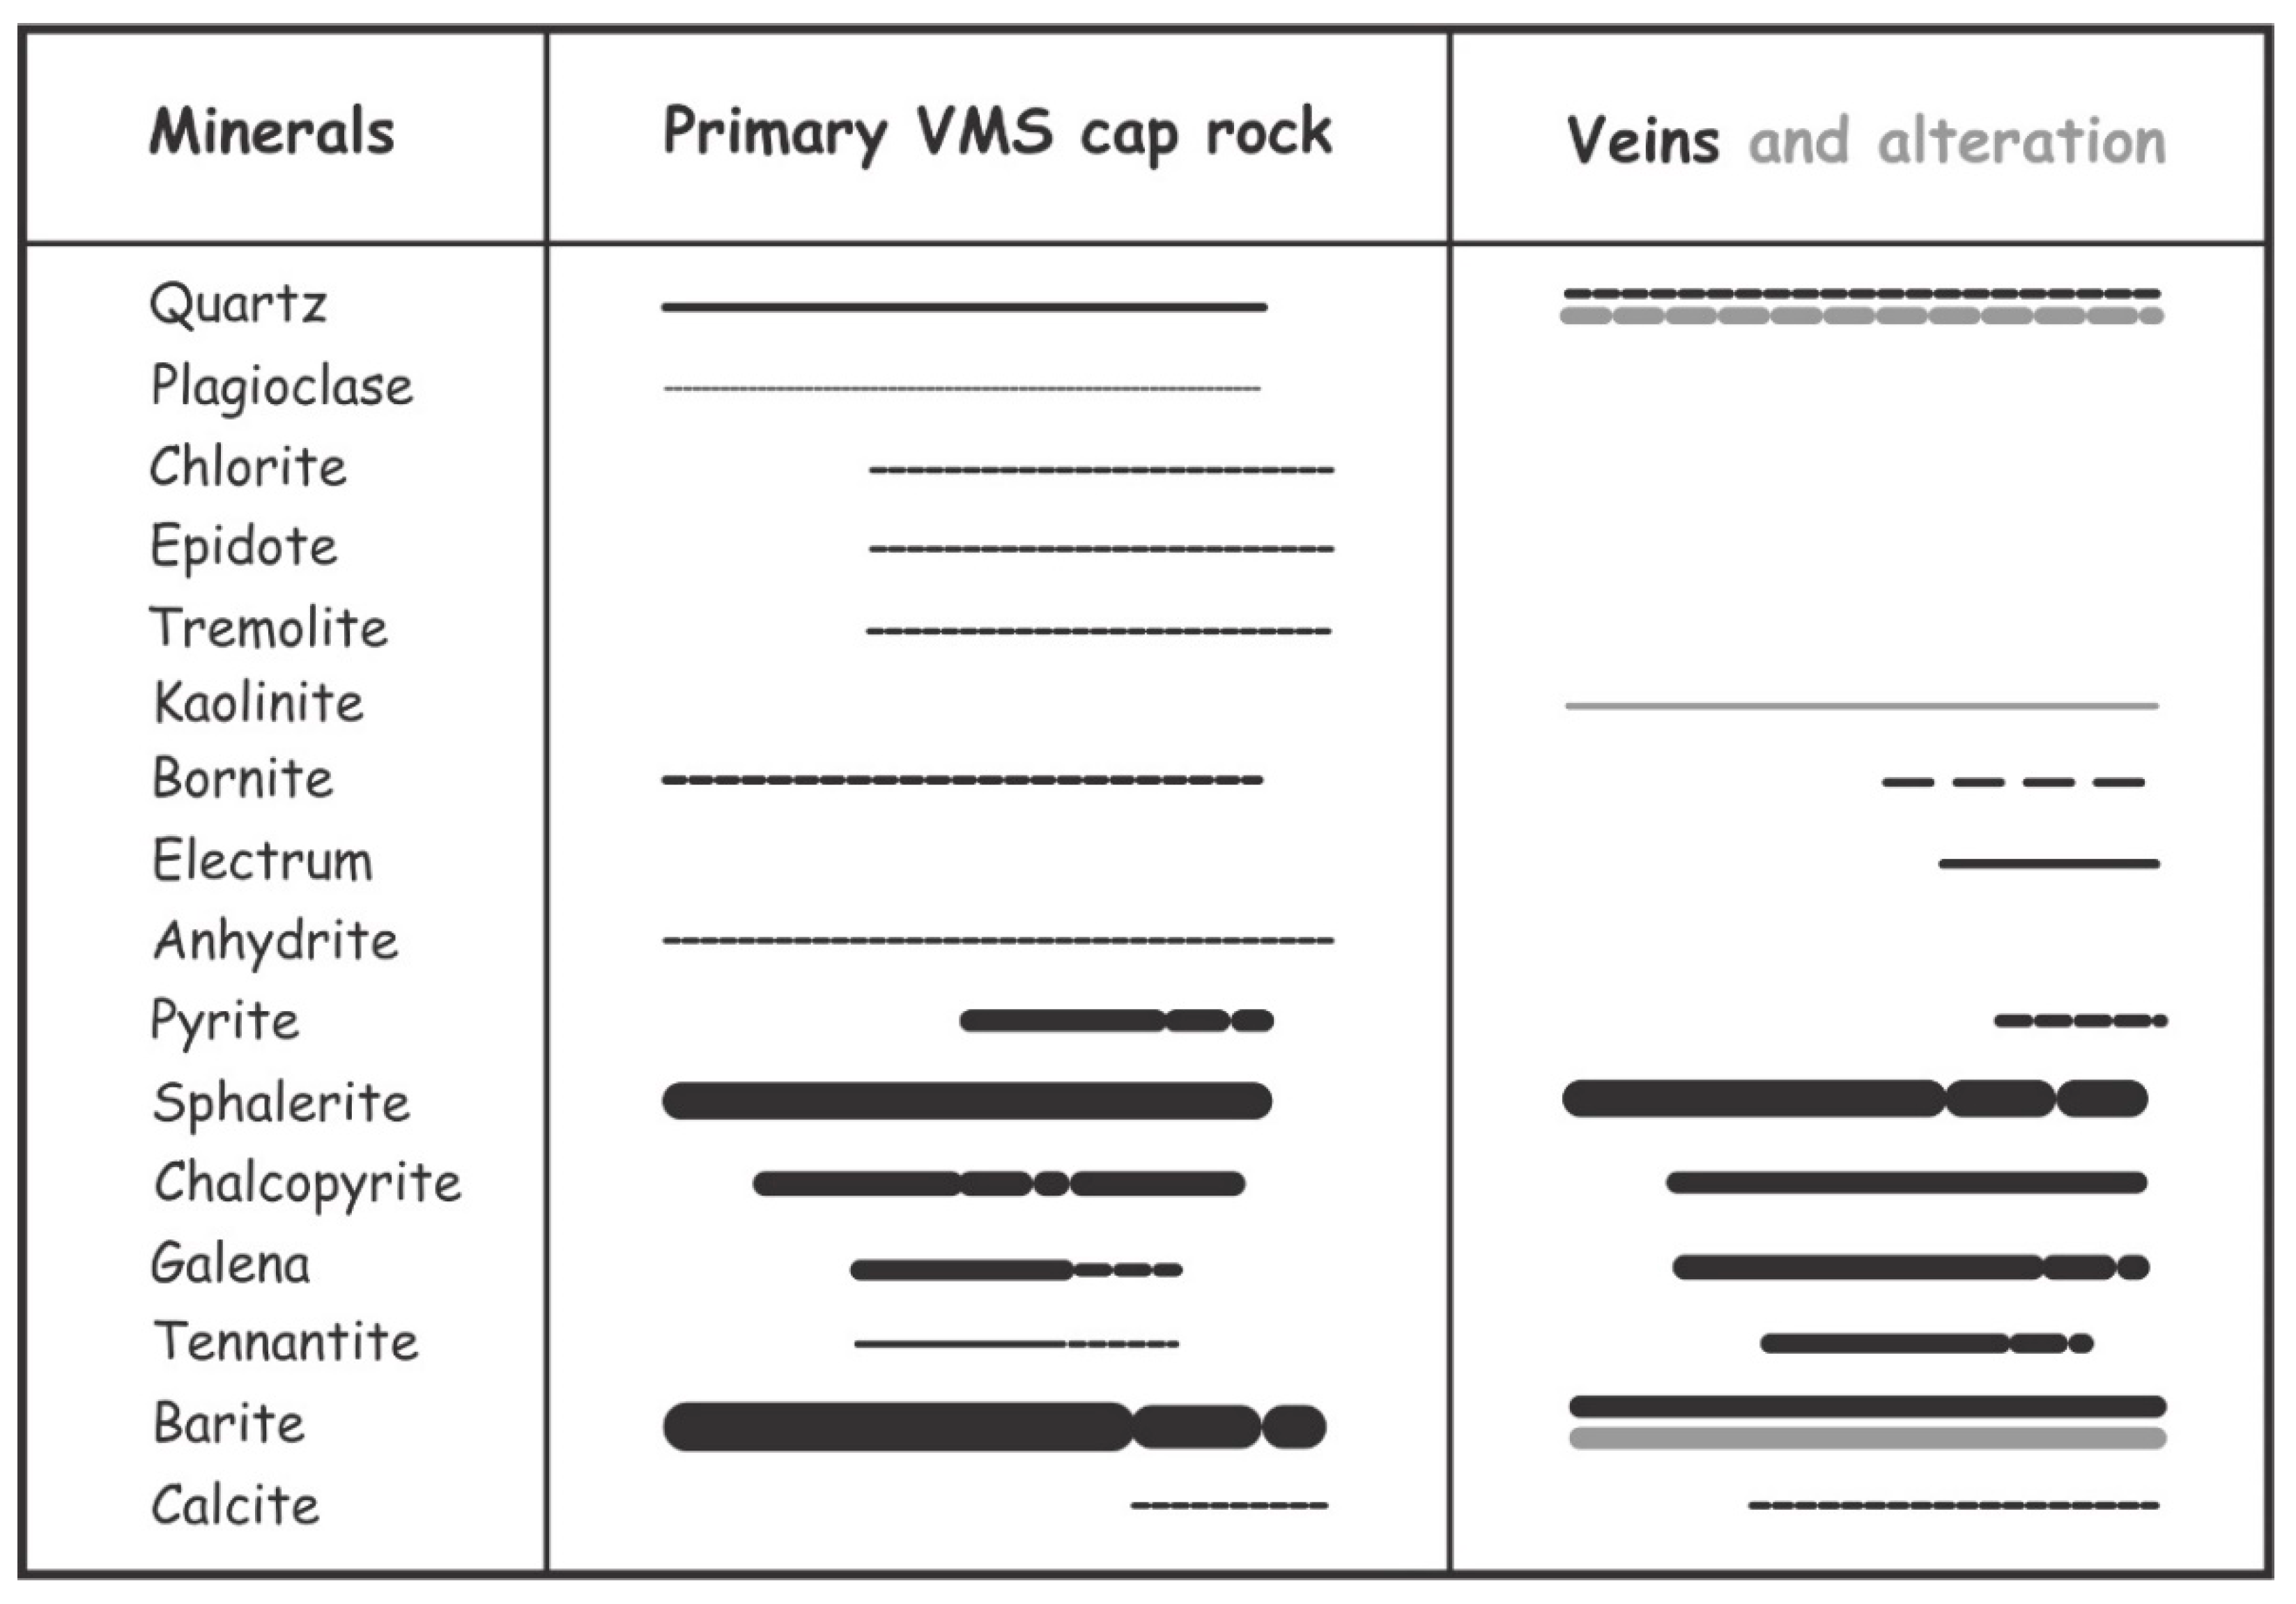
Figure 5.
Paragenesis diagram showing the relative geochronology of the various mineral phases for the Myra Falls mine. Vein alteration minerals are shown in grey. The width of the bars is indicative of the relative mineral abundance. The dashes indicate waning or intermittent precipitation.
Figure 5.
Paragenesis diagram showing the relative geochronology of the various mineral phases for the Myra Falls mine. Vein alteration minerals are shown in grey. The width of the bars is indicative of the relative mineral abundance. The dashes indicate waning or intermittent precipitation.

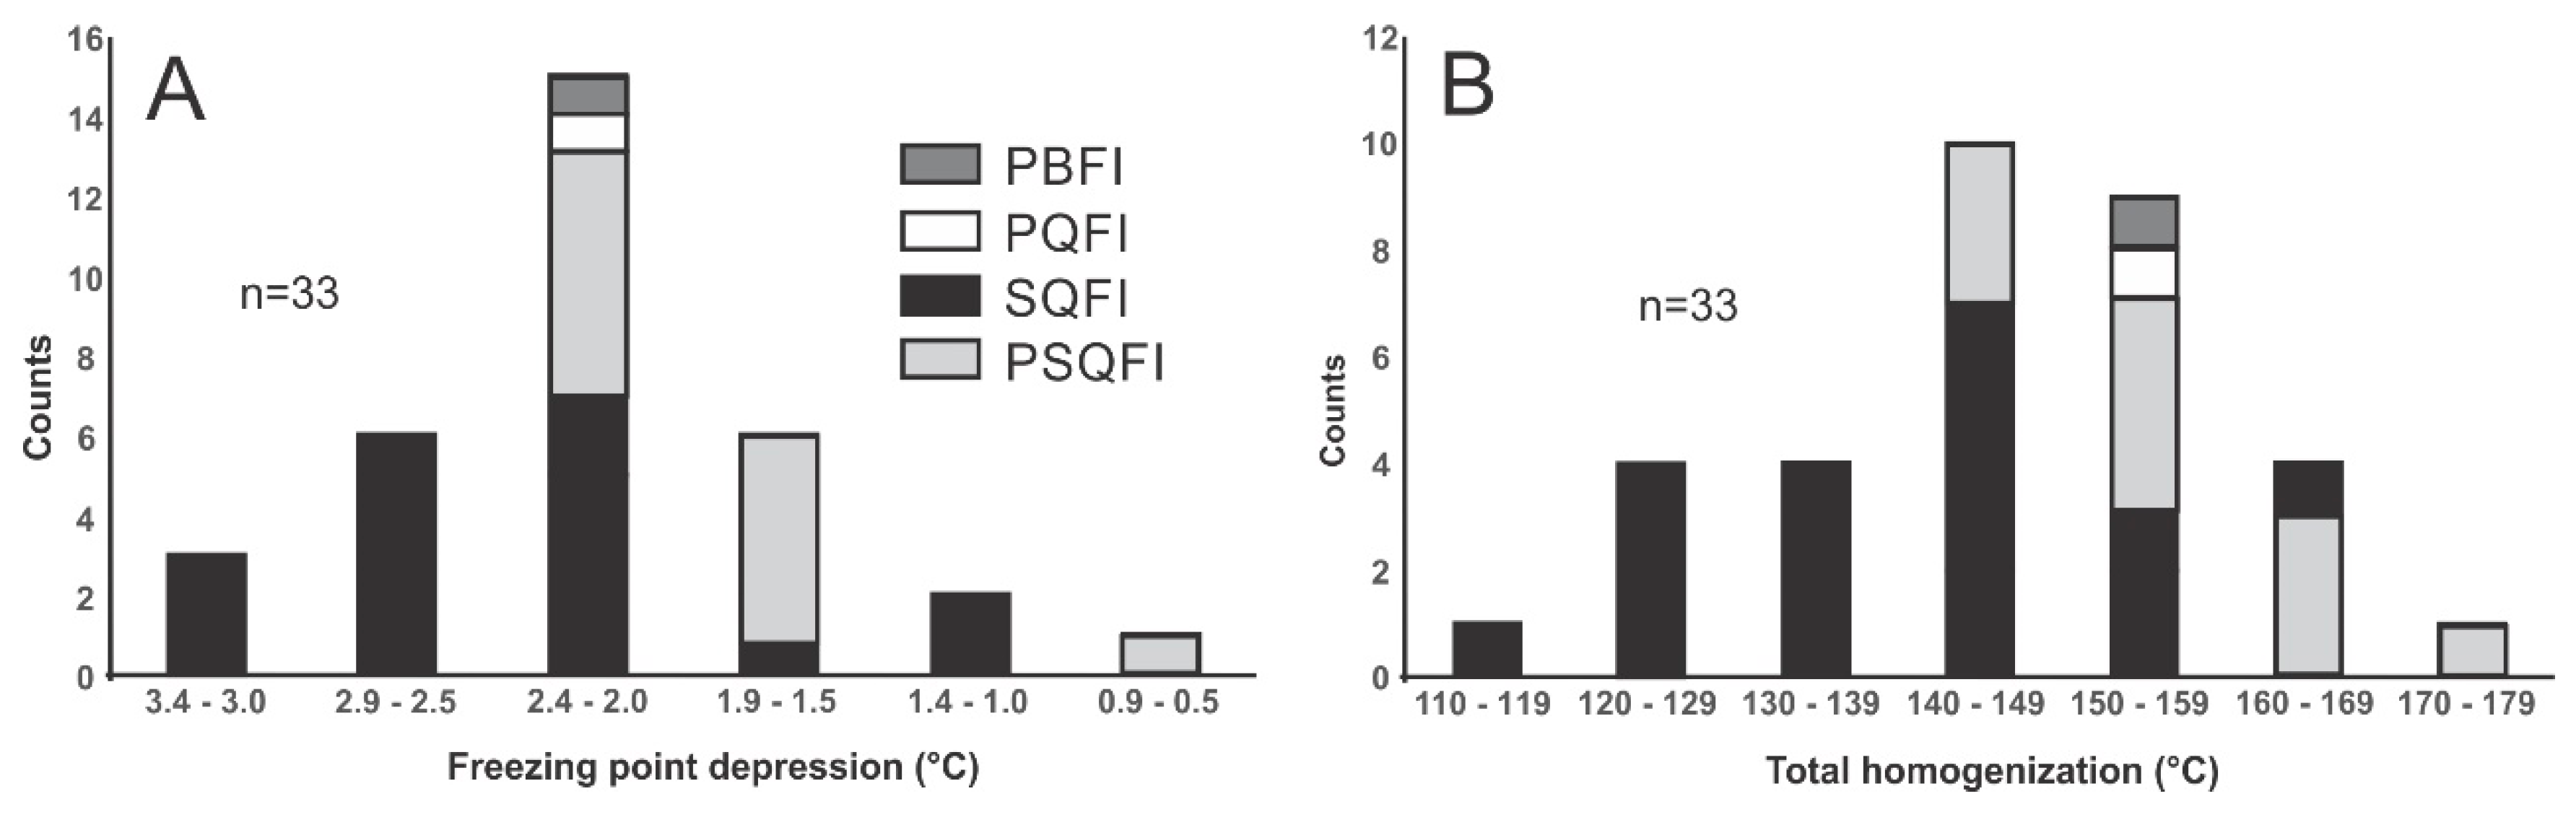
Figure 6.
Histograms of the freezing point depression (A) and total homogenization (B) temperatures for the primary, secondary, and pseudosecondary two-phase (liquid + vapor) fluid inclusions (Table 2). PBFI = primary barite-hosted fluid inclusion, PQFI = primary quartz-hosted fluid inclusion, SQFI = secondary quartz-hosted fluid inclusion, PSQFI = pseudosecondary quartz-hosted fluid inclusion.

Figure 7.
Temperature versus water depth boiling curve for seawater. Fluid inclusion homogenization temperatures (Table 2) superimposed on the seawater boiling curve data from Reference [17]. The expanded inset shows that homogenization temperatures are consistent with boiling seawater at depths ranging approximately between 15 and 125 m. Red and blue crosses represent the secondary and pseudosecondary fluid inclusions, respectively.

Figure 8.
Schematic of volcanic rocks (green), subvolcanic intrusions (pink), and massive sulphides (black) of a VMS system evolving from seawater-dominated circulation cells in the sub-aqueous environment to the epithermal environment dominated by meteoric water circulation cells (dashed curves) overprinting the original VMS mineralization. Modified from Reference [19].


Table 1.
Electron microprobe (wt %) data for electrum.
| Sample RG14-29 | Au | Ag | Cu |
|---|---|---|---|
| Spot-1 | 67.823 | 31.906 | 0.028 |
| Spot-2 | 69.042 | 31.43 | 0.044 |
| Spot-3 | 67.345 | 32.004 | 0.014 |
| Spot-4 | 65.096 | 33.832 | 0.026 |
| Spot-5 | 67.409 | 33.246 | 0.009 |
| Spot-6 | 67.292 | 31.762 | 0.016 |
| Spot-7 | 68.237 | 31.479 | 0.001 |
| Spot-8 | 67.585 | 32.114 | 0.017 |
| Spot-9 | 68.45 | 31.001 | 0.009 |
| Spot-10 | 70.383 | 29.243 | 0.042 |
| Spot-11 | 68.002 | 31.503 | 0.028 |
| Spot-12 | 70.523 | 29.176 | 0.047 |
Table 2.
Microthermometric measurements on fluid inclusions in quartz and barite.
| Chip/Flinc# | Eutectic | Tm ice | Th Total |
|---|---|---|---|
| RG14-21B-1-1-1 | nv | −2.0 | 158.2 |
| RG14-21B-1-2-1 | nv | −2.0 | 169.6 |
| RG14-21B-1-2-2 | nv | −2.0 | 167.8 |
| RG14-21B-1-3-1 | nv | −2.2 | 145.3 |
| RG14-21B-1-3-2 | nv | −2.2 | 164.7 |
| RG14-21B-1-4-1 | nv | −1.9 | 152.0 |
| RG14-21B-1-4-2 | nv | −1.9 | 145.2 |
| RG14-21B-1-5-1 | −21.5 | −1.8 | 158.7 |
| RG14-21B-1-5-2 | nv | −0.7 | 172.8 |
| RG14-21B-1-5-4 | −21.6 | −2.3 | 148.9 |
| RG14-21B-1-5-5 | −25.2 | −1.5 | 155.4 |
| RG14-21B-1-5-6 | −24.7 | −1.7 | 157.2 |
| RG14-21B-1-6-1 | nv | −2.4 | 145.7 |
| RG14-21B-1-6-2 | nv | −2.4 | 156.1 |
| RG14-21B-1-6-4 | nv | −3.4 | 143.6 |
| RG14-21B-1-6-5 | nv | −3.4 | 150.5 |
| RG14-21B-1-6-7 | nv | −2.5 | 169.9 |
| RG14-21B-1-6-8 | nv | −2.4 | 159.8 |
| RG14-21B-1-7-2 | nv | −2.5 | 123.1 |
| RG14-21B-1-7-3 | −28.1 | −3.3 | 127.2 |
| RG14-21B-1-7-4 | nv | −2.5 | 119.5 |
| RG14-21B-2-1-1 | −25.6 | −2.0 | 130.5 |
| RG14-21B-2-2-1 | −24.0 | −2.5 | 140.8 |
| RG14-21B-2-3-1 | nv | −1.2 | 144.5 |
| RG14-21B-2-3-3 | nv | −2.2 | 142.0 |
| RG14-21B-2-3-6 | nv | −1.1 | 145.9 |
| RG14-21B-2-4-4 | −22.6 | −2.0 | 127.8 |
| RG14-21B-2-5-1 | nv | −2.3 | 123.8 |
| RG14-21B-2-5-2 | −23.5 | −2.1 | 134.3 |
| RG14-21B-2-5-3 | nv | −2.3 | 135.1 |
| RG14-21B-2-6-1 | −22.5 | −2.6 | 138.0 |
| RG14-21B-2-6-2 | nv | −2.6 | 141.0 |
| RG14-33B-5-1-1 | nv | −1.9 | 150.9 |
All temperatures reported in degrees Celsius; eutectic = ice melting eutectic temperature; Tm ice = ice-melting temperature, Tm ha = halite melting/dissolution temperature, Th total = vapor homogenization temperature into the liquid, nv = not visible, italics = barite hosted fluid inclusion, bold = pseudosecondary fluid inclusion, bold-italics = primary fluid inclusion.
© 2018 by the authors. Licensee MDPI, Basel, Switzerland. This article is an open access article distributed under the terms and conditions of the Creative Commons Attribution (CC BY) license (http://creativecommons.org/licenses/by/4.0/).
Share and Cite
MDPI and ACS Style
Marshall, D.; Nicol, C.-A.; Greene, R.; Sawyer, R.; Stansell, A.; Easterbrook, R. Precious Metal Enrichment at the Myra Falls VMS Deposit, British Columbia, Canada. Geosciences 2018, 8, 422. https://doi.org/10.3390/geosciences8110422
AMA Style
Marshall D, Nicol C-A, Greene R, Sawyer R, Stansell A, Easterbrook R. Precious Metal Enrichment at the Myra Falls VMS Deposit, British Columbia, Canada. Geosciences. 2018; 8(11):422. https://doi.org/10.3390/geosciences8110422
Chicago/Turabian StyleMarshall, Daniel, Carol-Anne Nicol, Robert Greene, Rick Sawyer, Armond Stansell, and Ross Easterbrook. 2018. "Precious Metal Enrichment at the Myra Falls VMS Deposit, British Columbia, Canada" Geosciences 8, no. 11: 422. https://doi.org/10.3390/geosciences8110422
Note that from the first issue of 2016, this journal uses article numbers instead of page numbers. See further details here.