Faults as Windows to Monitor Gas Seepage: Application to CO2 Sequestration and CO2-EOR

Colorado School of Mines, Golden, CO 80401, USA
Geosciences 2018, 8(3), 92; https://doi.org/10.3390/geosciences8030092
Submission received: 12 January 2018
/
Revised: 8 February 2018
/
Accepted: 6 March 2018
/
Published: 9 March 2018
(This article belongs to the Special Issue Carbon Sequestration)
Abstract
:Monitoring of potential gas seepage for CO2 sequestration and CO2-EOR (Enhanced Oil Recovery) in geologic storage will involve geophysical and geochemical measurements of parameters at depth and at, or near the surface. The appropriate methods for MVA (Monitoring, Verification, Accounting) are needed for both cost and technical effectiveness. This work provides an overview of some of the geochemical methods that have been demonstrated to be effective for an existing CO2-EOR (Rangely, CA, USA) and a proposed project at Teapot Dome, WY, USA. Carbon dioxide and CH4 fluxes and shallow soil gas concentrations were measured, followed by nested completions of 10-m deep holes to obtain concentration gradients. The focus at Teapot Dome was the evaluation of faults as pathways for gas seepage in an under-pressured reservoir system. The measurements were supplemented by stable carbon and oxygen isotopic measurements, carbon-14, and limited use of inert gases. The work clearly demonstrates the superiority of CH4 over measurements of CO2 in early detection and quantification of gas seepage. Stable carbon isotopes, carbon-14, and inert gas measurements add to the verification of the deep source. A preliminary accounting at Rangely confirms the importance of CH4 measurements in the MVA application.
1. Introduction
Gas seepage can occur by several mechanisms and can follow a variety of pathways [1]. The reservoir pressure during injection can exceed the capillary entry pressure of the caprock. The probability of this increases non-linearly with pressure increase and differs for specific gases. This work focuses on leakage up pre-existing faults that serve as a pathway for fluid migration. The fault may be charged with gas, as free CO2, CH4, and light hydrocarbons. In the case of an old oil field planned for CO2-EOR, there may be pre-existing wells whose location is not recorded and are not properly plugged and abandoned (P&A). Carbon dioxide is soluble in water and may migrate with deep groundwater flow. An important fact with regard to solubility is that CH4 is much less soluble in water, maintaining a gaseous state, and is consequently much more mobile in a chemically reducing subsurface environment.
Migration of free gases below the water table is generally considered to occur by the mechanism of “buoyancy of microbubbles”, first described by MacElvain [2]. The buoyancy mechanism can be visualized as a micron-sized bubble of gas displacing a micron-sized bubble of water. The buoyancy mechanism largely refuted the earlier proposed mechanism of diffusion. Klusman [3], and Klusman and Saeed [4] described the mathematics of the processes. Carbon dioxide migration becomes more complicated as the water solubility, water migration, and carbonate mineral dissolution/precipitation enter into the process. There has been a long accumulation of observational evidence for the buoyancy mechanism and the speed at which free gases such as CH4 can move [3] (Chapter 2). Brown [5] described the vertical velocity of gases as a function of bubble size, and rock porosity and permeability. Velocities of 10 s to 100 s of meters/year were observed, and this is supported by many oil and gas field observations.
The response of gases in the saturated zone to vertical migration by the buoyancy mechanism is particularly sensitive to pressure. This allows separation of sedimentary basins into active and passive systems [6]. Hydrostatic pressure at the depth of interest is the line of separation between active and passive systems. Active systems have relatively common natural hydrocarbon seepage with active flow to the surface or sea floor, with examples including the Gulf of Mexico, on-shore and off-shore southern California, shallow seas of southeastern Asia, Caspian Sea, and Iran westward across southern Europe. In passive systems, natural pathways are present, but fluid flows are small to non-existent in a normally-pressured (hydrostatic) regime. Examples are most continental basins distant from tectonic plate boundaries.
There are many indirect indicators of gas seepage that frequently represent seepage over a long period of time and remain as fossil evidence if seepage has declined or disappeared. These include topographic highs, suggesting cementation of pore space; color shifts indicative of alteration, particularly reduction of iron by oxidation of methane seeping from depth; secondary carbonate and sulphate minerals; isotopic composition of cements and vein materials; electrical resistivity of the shallow subsurface; horizontal gradient magnetic intensity caused by iron reduction; radiometric anomalies produced by altered near-surface migration of uranium and potassium-40; ultraviolet fluorescence of soil extracts indicative of aromatic ring compounds; the presence of specialized microbes that are tolerant of alcohols produced in the stepwise oxidation of hydrocarbons; trace elements that are redox sensitive; and others [3] (Chapter 7).
The transport of gases in the unsaturated zone is controlled by diffusion in response to concentration gradients. The diffusivity rate in air is a function of temperature, pressure, diffusion volume, and molecular weight of the gas and can be estimated according to an equation presented by Baum [7]. Estimation of gas diffusivity in the unsaturated zone is performed using the Millington-Quirk model [8,9]. Fluctuations in barometric pressure impose a finite velocity to gas flow in the unsaturated zone (earth breathing), drawing soil air into the atmosphere during falling barometric pressure and driving atmospheric gases into the soil during rising pressure [10,11]. The relative influence of barometric pressure in near-surface migration is directly proportional to the molecular or atomic weight of the gas(es) being measured. This was observed in the simultaneous measurement of two gases: radon and helium [12]; nitrous oxide and methane [13]; carbon dioxide and methane [10].
There are problems with the use of CO2 in the monitoring of sequestration and CO2-EOR systems. These are large, open dynamic systems, where “equilibrium” is only occasionally approximated. There is systematic surface variation in gaseous CO2 on at least two time scales (seasonal and diurnal) and possibly two spatial scales (cm-m range, km range). One is searching for a small, deep-sourced signal in the presence of substantial near-surface and surface noise. An understanding of the noise through all seasons is essential if the deep signal is to be discovered.
There are three sources of CO2 that are always present: atmospheric, biological, near-surface inorganic carbon equilibrating with soil air. A fourth source is CO2 produced from methanotrophic oxidation of CH4, which can originate from a deep source of CH4, shallow methanogenesis, and even the methanotrophic oxidation of trace atmospheric CH4 drawn downward into shallow soils. A fifth source is the possible signal, i.e., CO2 from the injection reservoir.
Recognition of the various sources can be aided by isotopic measurements. There are two stable isotopes of carbon and two of hydrogen. Isotopic fractionation can occur when there is a chemical or biological reaction involving organic compounds, CO2 from the atmosphere or soil gas, and bicarbonate dissolved in water. Biological reactions involving carbon, either as oxidation or reduction are more effective in fractionation and favor the lighter carbon-12 over carbon-13. Biological reactions also favor the lighter hydrogen isotope over the heavier hydrogen-2 (deuterium). This fractionation is due to the kinetic isotope effect and relates to the relative strength of the chemical bonding. The radioactive carbon-14 is very effective in determining the “age” of the substrate involved in the reaction. Carbon-14 is a powerful tool in determining whether a carbon-containing gas came from depth (ancient) or a surface reaction involving carbon (modern). Textbooks on isotopes include Faure and Mensing [14] (3rd ed.); Clark and Fritz [15]; Basham [16]. The first edition of the Faure book is considered classic in the field of isotope geochemistry though initial geochemical applications were in geochronology.
If a carbon-containing gas is being utilized in the monitoring of a sequestration or CO2-EOR project, it must be a year-round effort on a regular schedule. The planning phase must consider both summer and winter measurements, or in warmer climates, wet and dry season measurements. Microbial oxidation of soil organic matter to CO2, and root respiration producing CO2 is lower in winter and/or the dry season. Methanotrophic oxidation rates of CH4 and light hydrocarbons to CO2 are lower in winter and/or dry season. Methanotrophic oxidation requires atmospheric oxygen, so measurement at greater depths in the unsaturated zone will be effective in the detection of CH4, prior to near-complete oxidation at the surface. Consequently, the best chance of detecting a deep-sourced signal of either CO2 or CH4 in an onshore project is in the winter and/or dry season.
It must be said without references that many individuals and agencies in the sequestration field do not know, or have not recognized the importance of CH4 as a potential natural tracer, or as an environmental problem if there is a significant flux to the atmosphere. From an environmental view CH4 is substantially more important than CO2 as a greenhouse gas. After all, all components in the injection reservoir “feel” the pressure of an injection program and migrate accordingly.
There are some working assumptions that must be considered in planning a monitoring program. Presume that all available techniques for locating faults and fractures have been used; for example, remote sensing, surface geologic mapping, well logs, and 3-D seismic monitoring. A non-uniform seepage pattern is almost certain. A thorough understanding of the natural processes involved in the production/consumption of an indicator or tracer gas specie is necessary. Formation overpressure will develop at reasonable injection rates unless permeability is unusually high; an overpressured, buoyant fluid at the top of the formation will tend to penetrate vertical fractures if present in a caprock, potentially inducing vertical migration, which will accelerate in overlying formations of higher permeability.
2. Materials and Methods
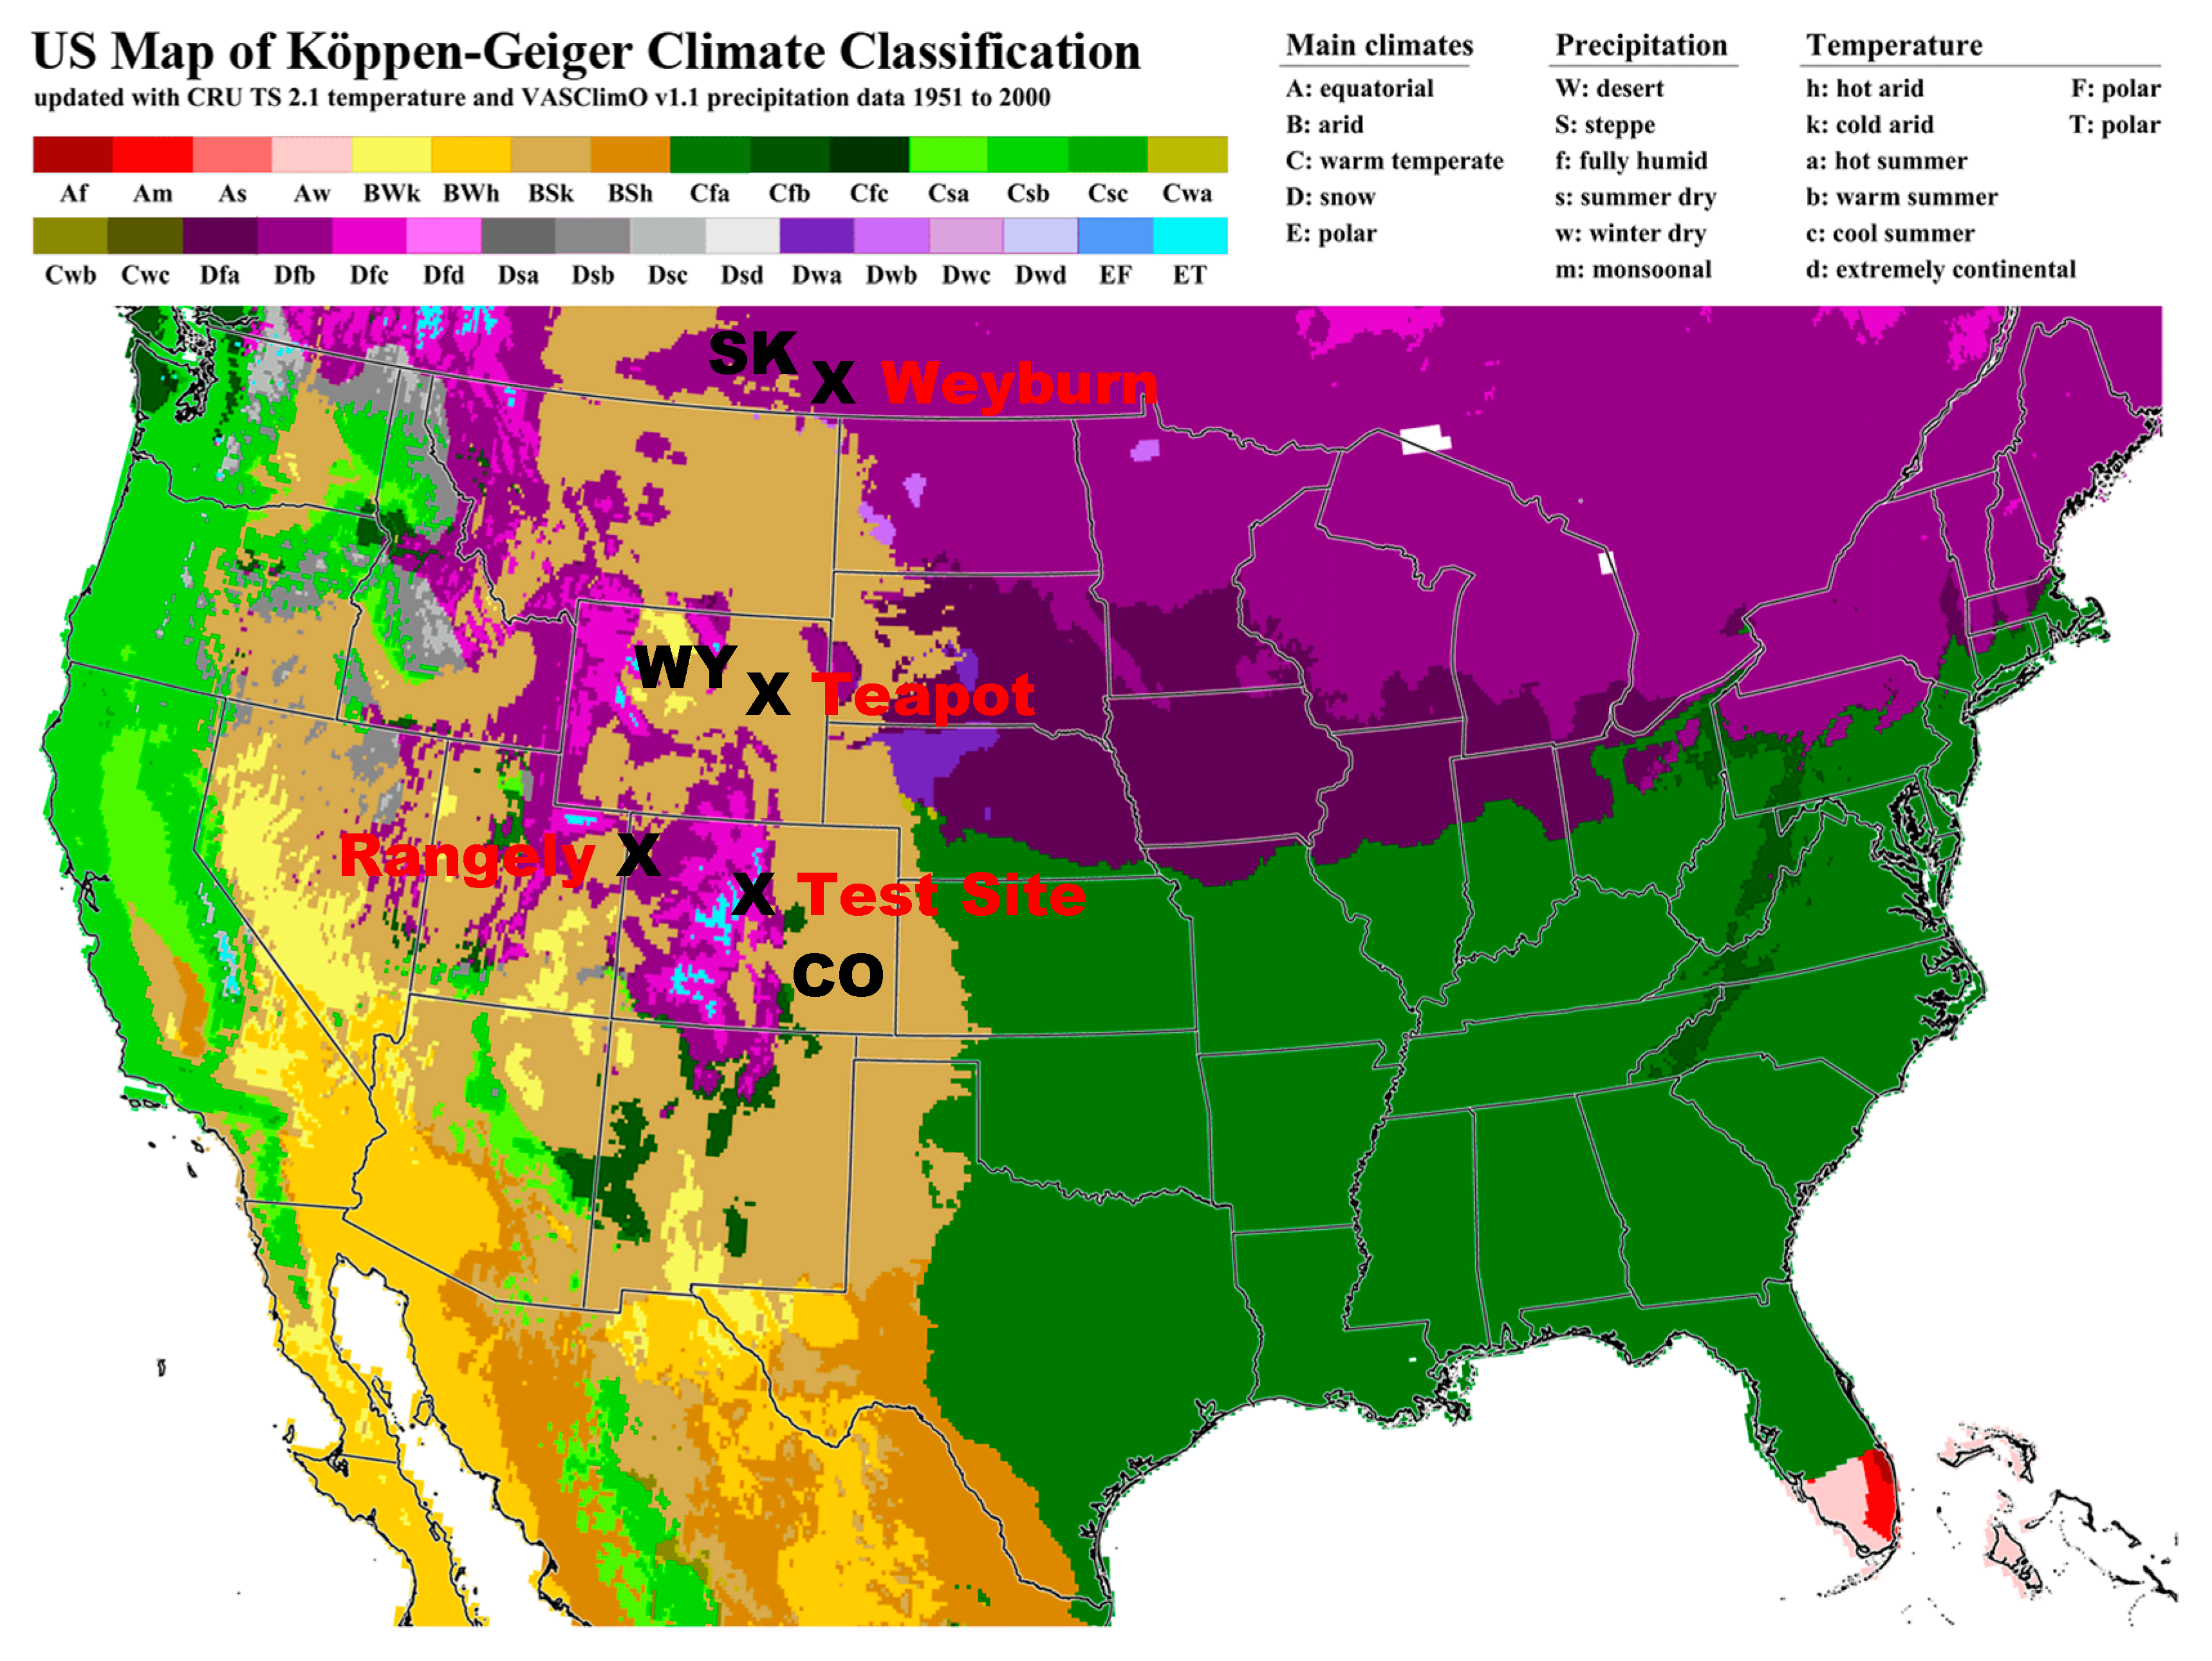
The results of measurements at three different sites in the Rocky Mountains of the western United States will be presented in the results (Figure 1). These sites are at moderate to high altitude (5000–8000 feet; 1500–2400 m), in a semiarid climate with relatively severe winters and a large seasonal contrast. Some discussion will be made of a location within the Weyburn field of Saskatchewan, Canada, at an altitude of 1800 feet (560 m), which is also shown in Figure 1. The soils of the primary measurement sites, i.e., Rangely, Colorado and Teapot Dome, Wyoming, are classed as Bsk in the Köppen climate system (Dry-steppe-kalt (cold); Figure 1). The test site and Weyburn are classed as Dfc in the Köppen system (winter snow cover-fully humid with winter-cool summers; Figure 1).
The Test Site in Colorado was first used in 1978 for measurements of Hg, Rn, and He in soil gas with a variety of soil gas measurements continuing intermittently into the early 2000s. Carbon dioxide flux measurements were made from 2000 through 2002. The Test Site is located on Precambrian high grade metamorphic rocks that can be considered a background for soil gas and flux measurements. It is located on a north-facing slope with evergreen forest.
The Rangely site is located on the northwestern plateau of Colorado on a structural anticline, but topographic low (Figure 1). Shallow production from shallow sand lenses in shale was initiated in the early 20th century. The discovery of the “deep” Permian Weber reservoir was in the 1930s with a large increase in production in the 1940s. The Weber reservoir is sandstone at a depth of 2000 m (6500 ft) with a porosity ≈ 12% and permeability from 0.2 to 200 millidarcies (mD). The American Petroleum Institute (API) gravity is 34 and the gas-oil-ratio (GOR) is 300. The Rangely field has an area of 78 km2 and has a vegetation cover of rangeland shrubs and grass. There is no agricultural activity other than light seasonal grazing.
A CO2 flood was initiated in 1986 using the Water-Alternating-Gas (WAG) process. Approximately 160 million cubic feet per day (4.5 million m3) of new and recycled gas is injected to produce approximately 13,000 bbl of oil and natural gas liquids/day. There are 200+ injectors and 300+ producers with a cumulative production of approximately 1 billion barrels. At the time of the study in 2001, there was about 23 million tonnes of CO2 in storage (28 million tonnes in 2010; approximately 34 million tonnes at present). The CO2 is geologic, purchased from the LaBarge field in Wyoming. The surface injection pressure for gas is 2000 psi (13.8 MPa), and for the water cycle, 1700 psi (11.7 MPa). The static downhole pressure is ≈ 3600 psi (24.82 MPa), which is ≈ 1.2 × hydrostatic pressure, and the reservoir is at 70 °C, so CO2 is supercritical.
The Teapot Dome site is a site where the U.S. Department of Energy owned both the land surface and subsurface resources, though these were sold in 2015 to a private company with future CO2-EOR probable. Teapot Dome covers about 42 km2 with oil production from three stacked horizons, one of which is quite shallow. The production is primarily from Jurassic reservoirs (2nd Wall Creek (2nd Frontier) and Shannon). These reservoirs have porosities and permeabilities of 8–16% and 0.2–150 mD, respectively. The deepest horizon (Tensleep B) is at a depth of 1800 m (5500 ft) and was proposed by the Rocky Mountain Oilfield Testing Center (RMOTC) for sequestration experimentation. The Tensleep has a porosity of 10–20% and permeability of 10–80 mD. The 2nd Wall Creek and Shannon are completely depleted, with oil production of 200–400 bbl/day. Cumulative production is 200–300 million barrels.
Rangely and Teapot Dome have some characteristics in common. Production is from sandstone reservoirs, i.e., Permian and Jurassic, respectively. Both are structural anticlines formed in the Laramide. Of importance in making near-surface measurements is that the surface geology is Cretaceous-age shales with poor soil development, similar vegetation, at a similar elevation, in a similar climate, and without coal in the overlying section. Rangely is in active CO2-EOR production, overpressured, and possibly an active seepage system. Teapot Dome is depleted, under pressured, and expected to be a passive seepage system. These characteristics make comparison of the two fields very relevant in understanding gas seepage from depth.
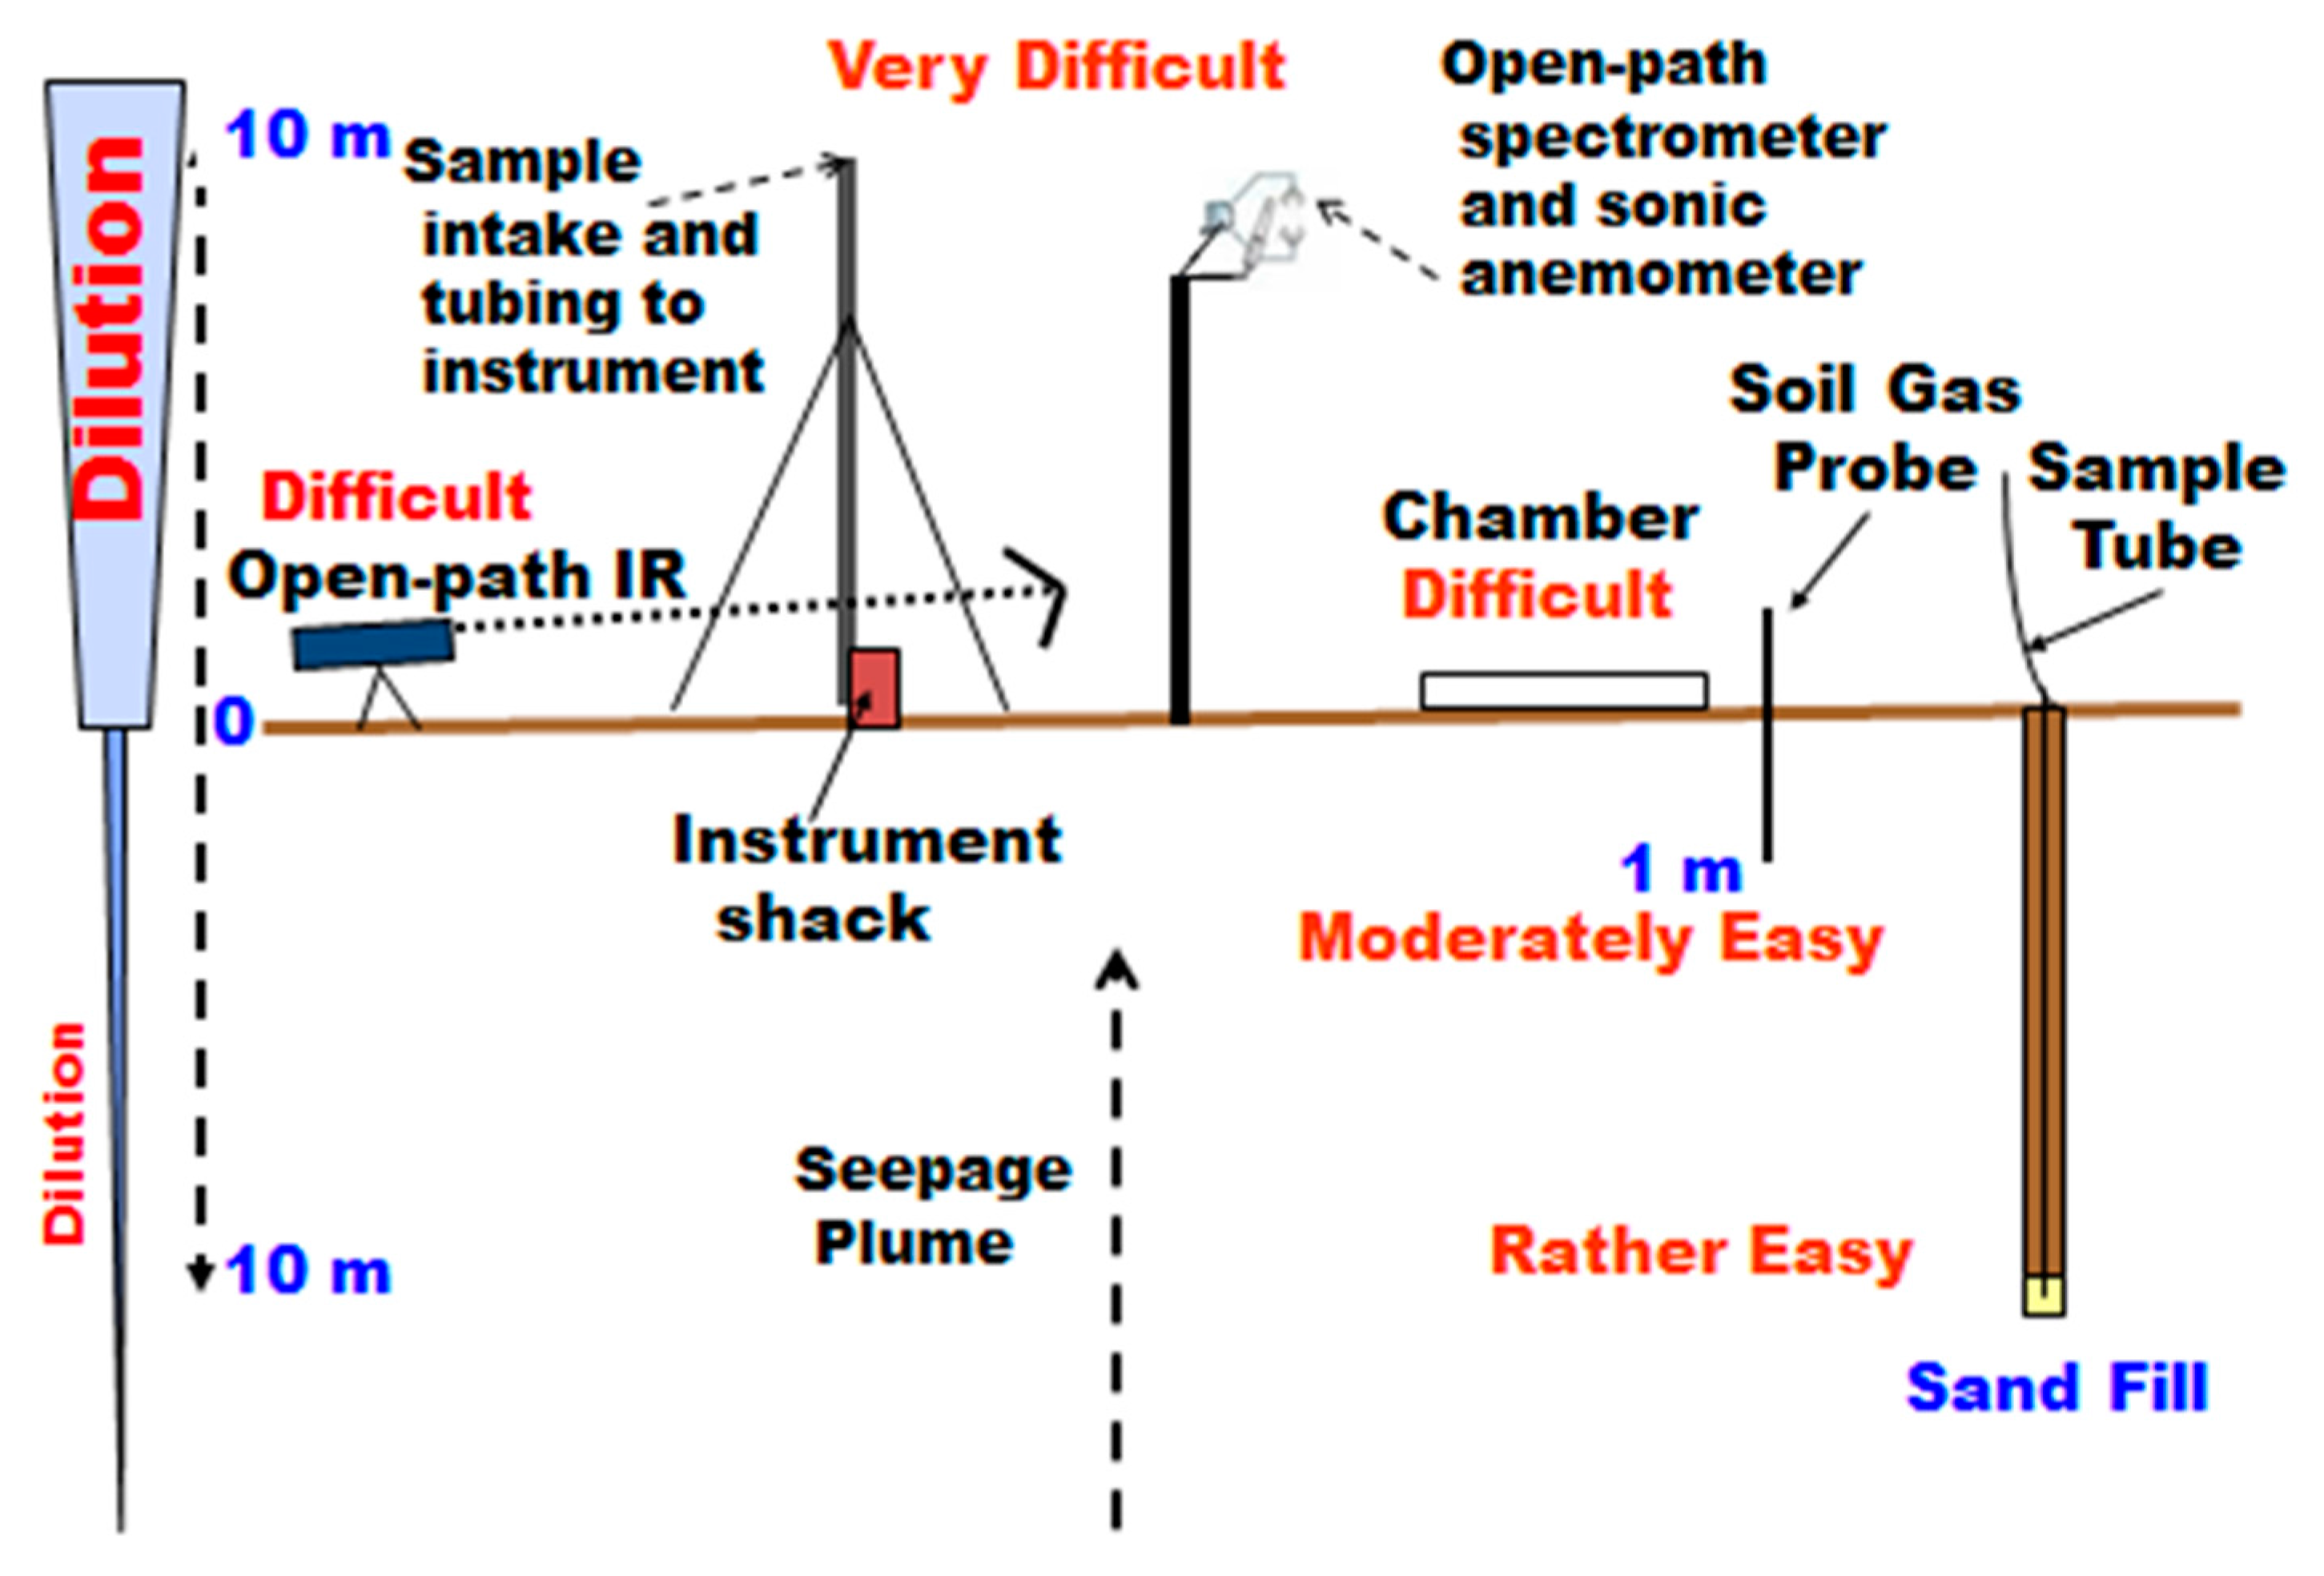
Figure 2 shows a schematic illustration of a variety of methods that have been used for measurement of gas fluxes and concentrations. Measurement of fluxes by eddy covariance (EC) on a tower was originally performed with a sample intake at the top, drawing air via tubing down to an instrument in a “shack” at the base of the tower. The flow rate is adjusted to allow for gas measurement closely timed with the sonic anemometer at the top. A later modification installed an open-path laser infrared (IR) instrument at the top of the tower to allow closer timing with the anemometer. More will be said about EC in the Discussion. Another atmospheric method for small area qualitative surveys and searching is the open-path measurement of absorption of an IR laser beam between a source and reflector and back to a detector [17,18].
The chamber measurement allows direct measurement of fluxes at the soil-atmosphere interface by manual sample withdrawal at timed intervals, or with a small pump drawing air from under the chamber to the instrument and returning it to the chamber (Figure 2). It is important that there is constant pressure under the chamber during the integration period. Chamber areas typically range from 0.03 to 1.00 m2. Sensitivity to gas exchange between the atmosphere-earth interface is improved, but a legitimate concern is that the area being sampled is small. The flux measurements at Rangely and Teapot Dome were made at each location, in triplicate, with three 1.00 m2 chambers set 10 m apart to decrease small-scale spatial variance.
Soil gas concentration measurements can be made on the field, or a small volume sample can be provided for specialized laboratory measurements. Flux measurements cannot be directly made but can be calculated from concentration gradients. Sampling at depth up to one meter is very quick, and the soil gas probe is highly portable. Limited sample volumes can be withdrawn without annular drawing of gas from the atmosphere. Deeper sampling requires power equipment for drilling or auguring and is suitable for a more permanent installation. Klusman [19] provided detailed “pros and cons” for the methods illustrated in Figure 2. In the studies at the three sites illustrated in Figure 1, chambers and shallow soil gas were used in the initial measurements.
Ten-meter holes at selected locations at Rangely and Teapot Dome were equipped for nested sampling at 1-, 2-, 3-, 5- and 10-m depths. This allows sampling at depths that are below the highest levels of environmental noise. A schematic of a 10-m hole construction is not shown, but the details of construction are shown [10,19,20,21]. A design to bring the nested tubing up to a more optimum working level for sampling or field measurements in a long-term monitoring program was constructed, but never implemented [22]. The amount of gas that can be drawn from each nested interval is a maximum of approximately one liter, after purging only the tubing from the sampled interval to the surface. Continuous flow sampling is not practical. Sampling was always done from the bottom interval upward as the deeper intervals were considered more important.
Table 1 summarizes the measurements made at Rangely and Teapot Dome. In both cases, initial chamber flux measurements and shallow soil gas survey were conducted. The data were scrutinized for the selection of locations of the 10-m holes to allow comparison/contrast of locations thought to have seepage. These selection criteria include the magnitude and direction of both CO2 and CH4 fluxes; magnitude and gradient of both CO2 and CH4 in shallow soil gas profiles; isotopic shift in 60- and 100-cm soil gas CO2, relative to atmospheric CO2; presence of C2H6 and C3H8 and/or abnormal amounts of C2H4 and C3H6. The presence of C2H4 and C3H6 is indicative of the first step in the oxidation of the respective C2 and C3 alkanes. The direction of CH4 flux can be positive (upward) or negative (downward) because of the relative source strength of seepage and methanotrophy, respectively. In the absence of a deep source of CH4 seepage, methanotrophs have the capability of using atmospheric CH4 in the range of 1.8–2.0 ppmv, resulting in a negative flux direction.
The measurements were made in summer and winter at Rangely and at Teapot Dome in the winter only. The summer and winter measurements at Rangely demonstrated the large seasonal difference in fluxes and in soil gas concentrations [24]. Because Rangely is an overpressured system, it was expected that useful data could be obtained in both seasons. Pre-project modeling using a one-dimensional finite difference code modified from the gas reservoir engineering field suggested that CH4 fluxes could likely be detectable and measurable in both seasons [10]. The results of the modeling also suggested that significant differences in gas fluxes through the saturated zone would have occurred between 1986 when the CO2 flood was initiated and the start of measurements in late 2000. The reservoir changed during this interval from a hydrocarbon-dominated system to a CO2-dominated system with minor hydrocarbons. The use of a control area was deemed necessary and is located about 15 km northeast of the Rangely field and has similar elevation and surface geology.
The results at Rangely suggested that measurements at the under-pressured Teapot Dome field in the winter only, when environmental influences were minimal, would yield the most useful data. Both projects were done in order to better understand geochemical processes rather than provide multi-year monitoring information. The importance of methanotrophy in attenuating a CH4 seepage signal was apparent by the completion of the Rangely project [25]. A summary publication on Rangely that also includes the evolution of reservoir brine composition during the CO2 flood is described by Klusman [20]. The addition of thermocouples to the 10-m holes at Teapot Dome and the addition of oxygen determination were done in the realization that the simple first-order methanotrophic oxidation model used at Rangely was likely inadequate [25].
A number of analytical techniques were used in the wide range of chemical determinations used in the Rangely and Teapot Dome studies. The CO2 fluxes were measured with a Licor-7000 research-grade IR spectrometer adapted by the author for use with existing 1.00 m2 flux chambers that were constructed in 1994 for a previous project. The CH4 fluxes were determined by gas chromatography (GC) using samples taken at 0-, 8-, 16- and 24-minute intervals at the same time the CO2 fluxes were measured over the first 12 min. Commercial flux chambers for both CO2 and CH4 are now available and will be considered in the Discussion section.
Carbon dioxide and CH4 in shallow soil gas and 10-m hole samples, as well as C2+ hydrocarbons, were determined by GC. The Rangely samples were analyzed by the author at CSM utilizing a Shimadzu 3-channel GC with thermal conductivity detector (TCD) for CO2 and a flame ionization detector (FID) for CH4 and light hydrocarbons. The CH4 flux and shallow soil gas samples at Teapot Dome were analyzed by the author for CO2 and CH4 on a Hitachi dual channel GC located at Teapot Dome. The 10-m and Section 10 samples were analyzed by a dual channel Hewlett-Packard GC for CO2, CH4, and light hydrocarbons at Vista Geoscience of Golden, Colorado. Calibration of the Licor-7000 and GC was done using standard gases from Scott Standard Gases (now Air Liquide).
Stable carbon isotopes of CO2 in atmospheric, flux, and soil gas samples were determined commercially by isotope ratio mass spectrometry (IRMS) performed by Isotech of Champaign, Illinois. Stable carbon isotopes of CH4 were measured by IRMS at the University of Hawaii. Stable carbon and oxygen isotope determination on solid CaCO3 samples by IRMS was completed in the Dept. of Geology Isotope Laboratory at the Colorado School of Mines.
Carbon-14 in gas samples was determined by Accelerator Mass Spectrometry (AMS). The samples were collected in laboratory-evacuated stainless steel containers by slow, passive withdrawal from each nested interval. The CO2 was purified by the author at the Colorado School of Mines with cryogenic separation on a vacuum line. The purified CO2 was sealed in “break-seal” soft glass tubing. The C-14 in the Rangely study was determined at the Accelerator Laboratory at the University of Toronto; the Teapot Dome samples were determined at the AMS laboratory at the Woods Hole Oceanographic Institution. The carbon-14 data are normally expressed as percentage or as a fraction of modern carbon (Fm), relative to a modern standard. The carbon-14 age can be calculated from the Fm data using a radioactive decay equation knowing the half-life or decay constant.
3. Results
3.1. Gas Fluxes and Shallow Soil Gas Results
Carbon dioxide flux measurements were made at the background Test Site during a two-year period that corresponded approximately with the Rangely study. The Rangely measurements were made during the peak of the summer and winter seasons. Figure 3 shows the CO2 flux measured in a single day at approximate 6-week intervals [19], which was added to and modified [11]. These consisted of 24-minute and 12-minute integration periods on two adjacent collars set 30 cm apart. The measurements alternated between the two collars with a 30-minute “rest period” between measurements. The rest period is necessary in order to allow the shallow soil gas gradient to recover, as the 12-minute flux measurement distorts the soil gas concentration profile, slowing the apparent flux with time during the integration period.
It is clear that the background flux values with no deep source vary substantially in magnitude with season. There are also rather steep increases and decreases during the transition seasons. The greater the flux, the greater the variability observed at this location. Figure 3 clearly illustrates one of the serious disadvantages of CO2 flux measurements in a monitoring program where one is searching for a deep source, if it is present at all.
There are also short-term perturbations to measurement of CO2 fluxes illustrated in Klusman [11]. Photosynthesis substantially alters CO2 gradients in the atmosphere, the magnitude varying with measurement altitude above the land surface and vegetation height. Photosynthesis is significant even in the semiarid climate of Rangely. During the winter, the photosynthetic component is absent, but barometric influences occur. In the Rangely climate, during the winter, the approach of a cold front is preceded by falling barometric pressure, which abruptly rises as the cold front arrives. The falling pressure draws soil gas CO2 from the soil pore space into the lower atmosphere [11]. The effect of rising and falling barometric pressure affects the soil gas concentration profile, which in the case of Rangely soils, is readily observable to a depth of at least one meter [11].
A rainfall event can have an even stronger effect on CO2 fluxes that are proportional to the magnitude of the event. A strong rainfall event on the night of July 15, 2001, perturbed flux measurements for several days [11]. There was a burst in CO2 flux with the δ13C shifting to more depleted values, indicative that the increase was due to accelerated soil microbial activity and soil respiration. The δ18O values of the CO2 shifted and became more enriched with time during the slower evapotranspiration of water. Because of the solubility of CO2 in water and rapid isotopic equilibration, the effect is observable in the δ18O of CO2.
The seasonal CO2 and CH4 flux measurements and winter flux measurements at Teapot Dome are summarized in Table 2. The soil gas CO2 and CH4 concentrations at a depth of 100 cm are also shown. The shallower 30- and 60-cm soil gas concentrations are not shown.
There are several items to note in Table 2. The mean, median and standard deviation for CO2 flux on the Rangely field were higher in summer than in winter as would be expected for a variable controlled by soil oxidation and root respiration. The same applies for the control area, except for the CO2 flux mean. Likewise, the mean, median and standard deviation (but not the median) of the CO2 in 100-cm soil gas were higher over the field than in the control area. The differences between the field and the control area suggest a different intensity of geochemical processes operating.
The same observations apply to the CH4 fluxes between the two seasons. In the comparison of the CH4 fluxes between the field and the control area, there were large differences in the mean and standard deviation. This suggests there were a small number of locations on the field that dominated the determination of the mean CH4 flux. This observation also fits the previously known situation that not all locations in an anomalous area have anomalous characteristics [3]. This also suggests that in a monitoring environment, it is better to monitor at selected locations rather than trying to measure geochemical parameters everywhere.
The results and relative differences for CH4 fluxes and 100-cm soil gas CH4 were the same as the interpretation for CO2. The field is higher in CH4 flux and 100-cm soil gas (summer vs. winter) and also field vs. control area. One can reach the conclusion that the Rangely field is anomalous with respect to the control area irrespective of whether CO2 and CH4 fluxes and/or CO2 and CH4 100-cm soil gas concentrations are being measured. There is consistency among all four data sets.
When comparing Rangely winter data with Teapot Dome winter data, the differences are much more dramatic. This is attributed to the preliminary indication that there is measureable gas seepage at Rangely, which is likely absent at Teapot Dome. Utilizing the mean CH4 flux and standard deviation at Teapot Dome, there is overlap with “zero.”
The connection between CO2 fluxes and CO2 in soil gas can be seen in Table 3. It is also noted that the locus of organic matter oxidation shifts downward in winter, as would be expected. Following the name of the field is a symbol (s or w) for summer and winter, respectively, and the year when the measurements were made.
The results shown in Table 3 demonstrate the connection between soil gas concentrations and gas fluxes. Table 2 strongly suggests that CH4 is a superior parameter to measure than measurement of CO2. The results of this demonstrate that winter measurements and measurements at increasing depth lessen the influence of environmental noise caused by biological processes producing and/or consuming carbon-containing gases. These data provide a one-time characterization of the gas seepage environment at Rangely and Teapot Dome.
3.2. Results for Nested Sampling of 10-m Holes
The method for selecting locations for 10-m holes to allow nested sampling was described in the Materials and Methods section. Schematics of the construction were presented in Klusman [10,19,20,25,26] and will not be presented here.
Substantial results from 10-m hole data verify the presence of gas seepage at selected locations in Rangely, including a δ13C shift in CO2 when comparing anomalous and non-anomalous locations. High concentrations of CH4 and light hydrocarbons were also found at depths of 3 m or more at anomalous locations. Of particular interest is that carbon-14 determination of CO2 during both summer and winter demonstrated the presence of ancient carbon at 3 m and deeper. The δ13C shift allowed recognition of the importance of methanotrophy in the attenuation of the CH4 seepage [25]. The stable carbon isotope and carbon-14 measurements demonstrated that the bulk of the CO2 flux is of shallow biological origin, not from injected CO2. More will be said about the accounting for seepage at Rangely in the Discussion.
3.3. Faults as Pathways and Seals at Rangely and Teapot Dome
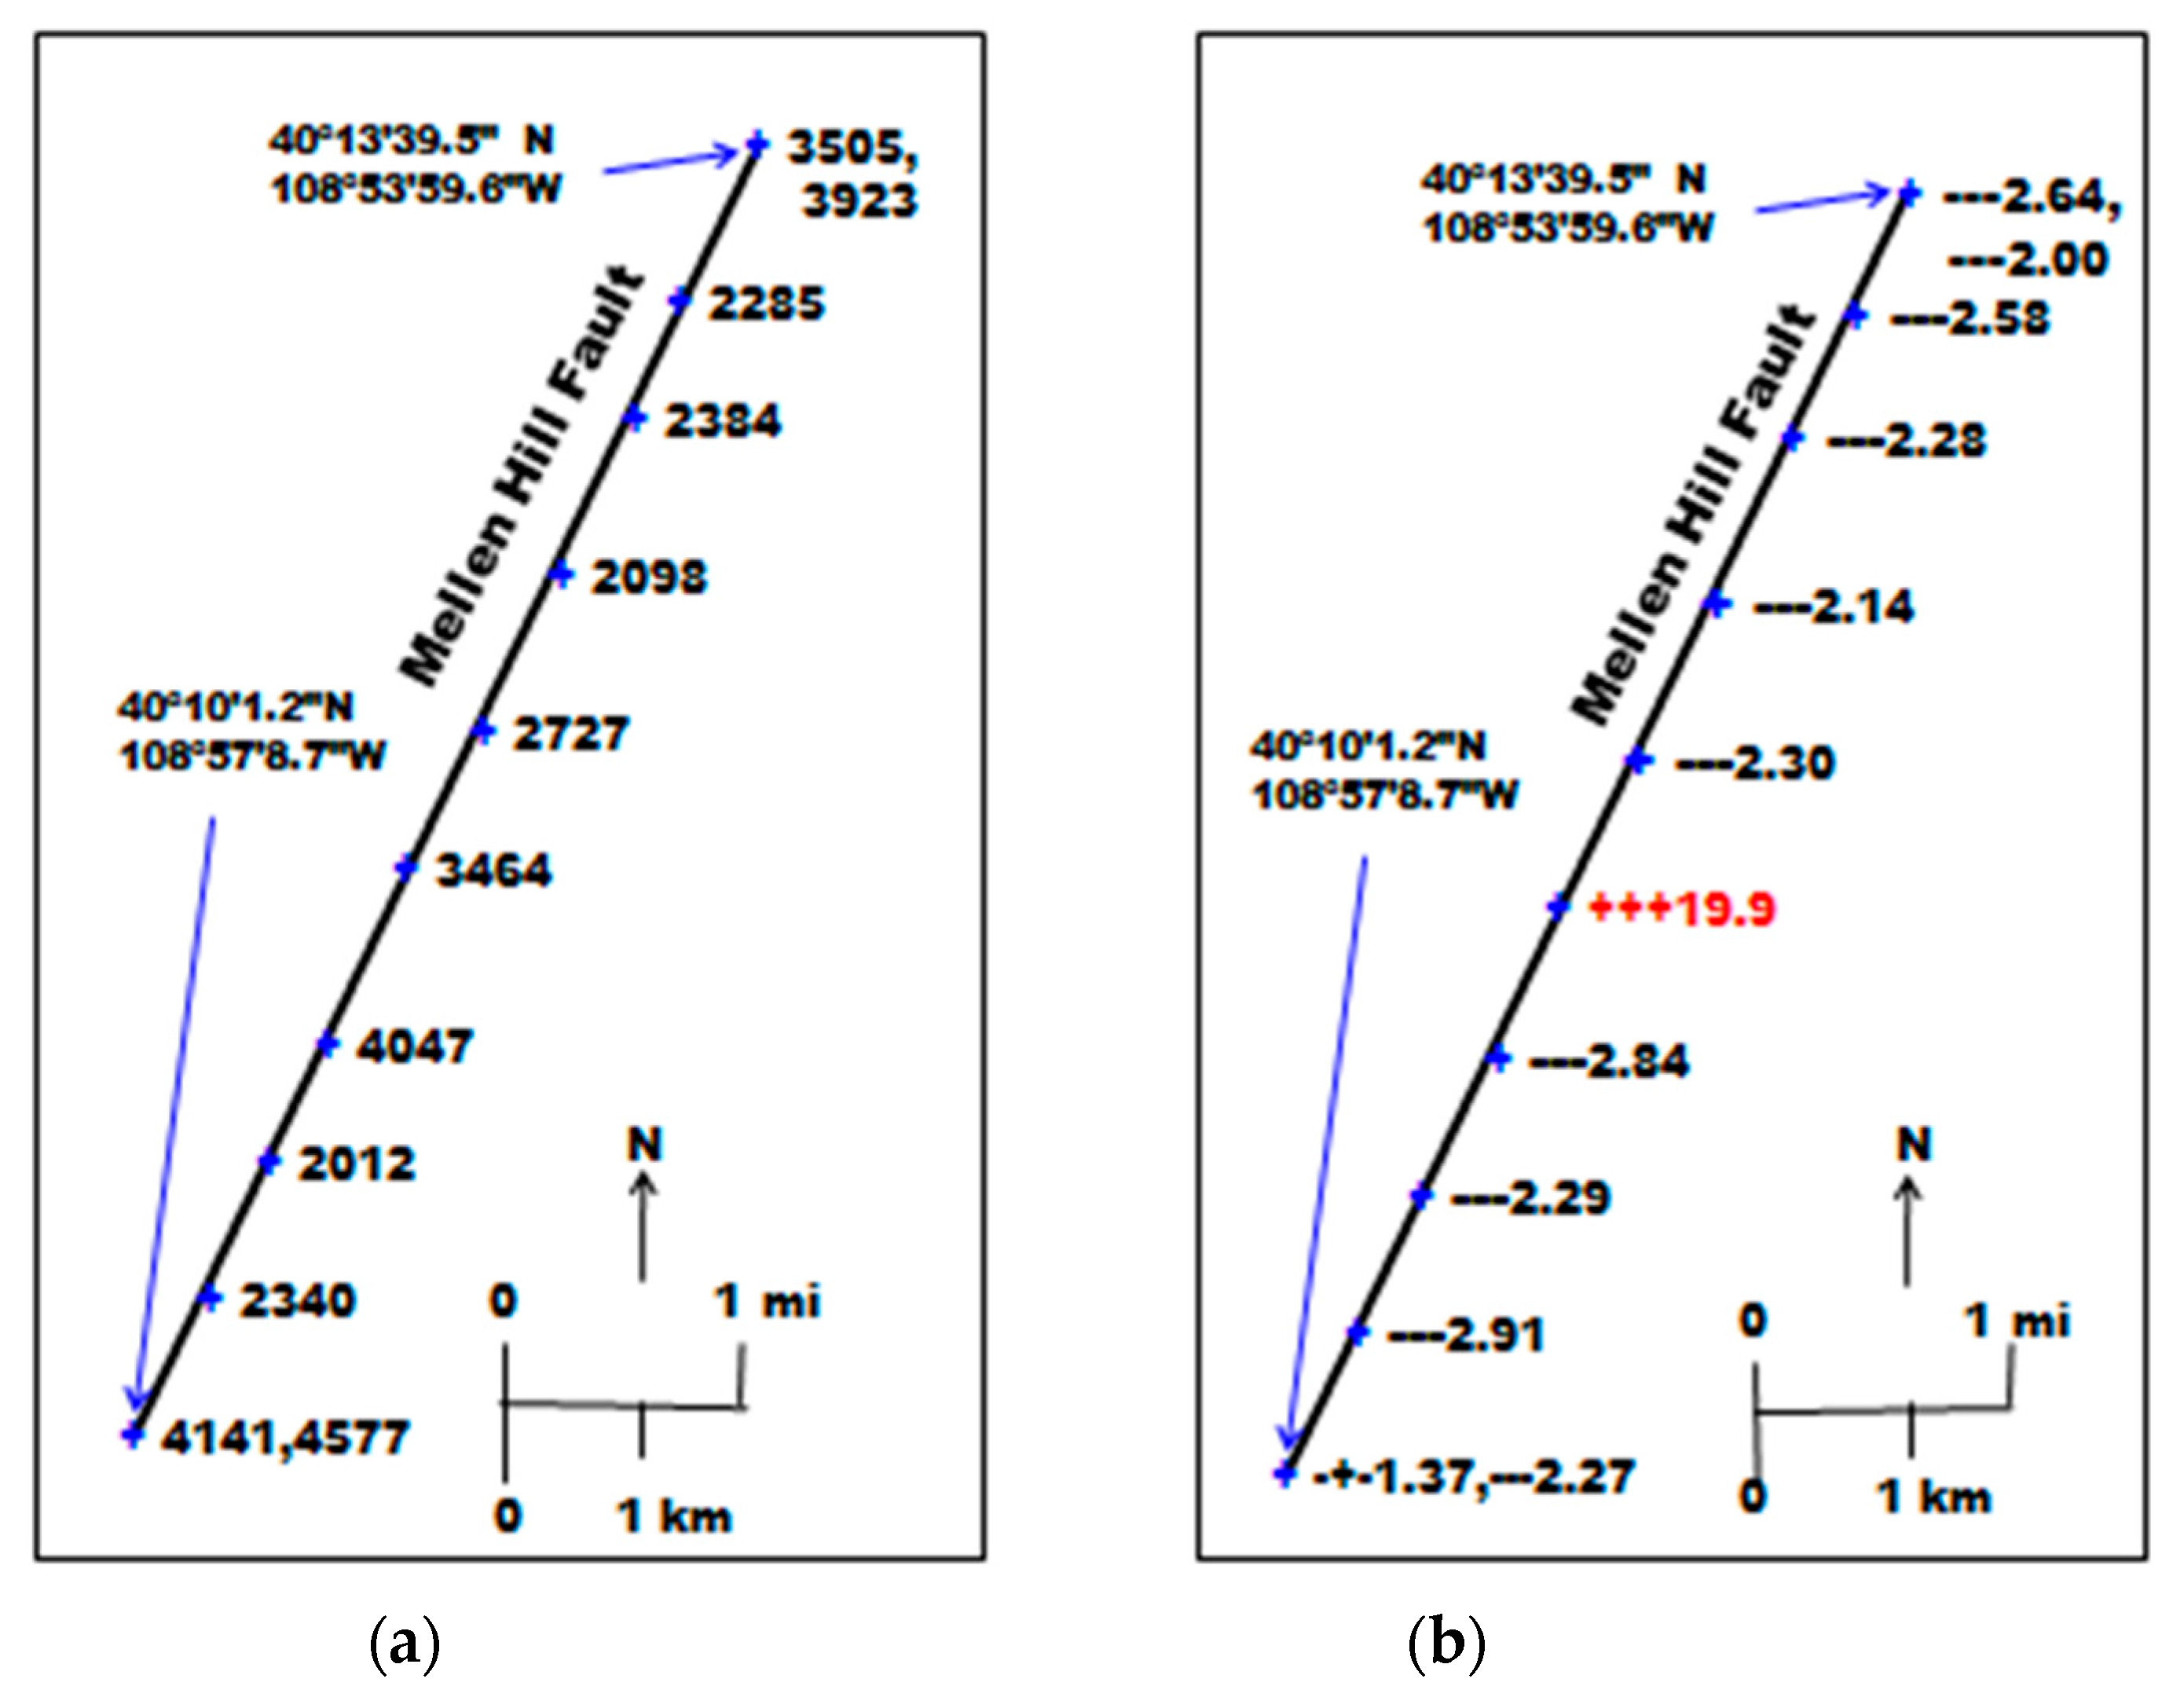
One of the objectives at Rangely was to evaluate the possible connection of the Mellen Hill Fault to the west of the field. The Mellen Hill Fault, which is readily visible on satellite imagery, is a normal fault, upthrown on the east side. Flux measurements of CO2 and CH4 were made at two locations along the fault that had vehicle access. Soil gas measurements were made at these locations and at eight additional locations over a distance of approximately 6 km between the two where flux measurements were made. Replicate samples were taken at the two locations at the ends of the fault profile on successive days.
Figure 4a shows the CO2 concentration at a depth of 100 cm along the fault profile. The mean of these values was 3125 ppmv; median was 3096 ppmv; standard deviation was 915 ppmv. The mean and median are slightly higher than the values over the Rangely field in Table 2, but are not unusual.
Figure 4b shows the δ13C of CO2 at depths of 30 cm, 60 cm and 100 cm, relative to the δ13C of atmospheric CO2. The δ13C values are not shown; only the isotopic shift. If depleted relative to the atmosphere, the data are shown as (−) signs; if enriched relative to the atmosphere, the data are shown as (+) signs. The numeric data are the CH4 concentrations in 100 cm soil gas. The mean, median, and standard deviations were 3.79 ppmv, 2.30 ppmv, and 5.09 ppmv, respectively. Rangely field values were 10.2 ppmv, 2.76 ppmv, and 26.97 ppmv, respectively (Table 2). The means and standard deviations are distorted in both cases by one, or a few highly anomalous values. Upon further investigation, it was found that the anomalous location on the Mellen Hill Fault corresponded to the location of a P&A well drilled by the State of Colorado (Government #1, Wild Horse Tract, SE¼, NE¼, Sec. 34, T3N, R103W). There is apparently no connection of the Mellen Hill Fault to the Rangely CO2-EOR operation, but only a leaking well that had been improperly P&A.
At Teapot Dome, the determination of the 40 sample locations was designed to provide relatively complete coverage of the anticline, but with some emphasis on fault locations along the S2 mapped fault complex (Figure 5). The sample locations are shown along with the CO2 flux values divided into quartiles (−282 to +102 mg·m−2·day−1; 116 to 214; 234 to 320; 328 to 733), excluding a value of 1154 mg·m−2·day−1 that was found to be at a reclaimed, covered, but contaminated location. The CO2 fluxes do not reveal any obvious pattern that is related to either the S1 or S2 fault complexes. The significant negative flux at Location 19 was found with all three chamber measurements at 10-m spacing and will be discussed later. A 10-m nested sampling hole was augured at this location (#19).
It was noted during the sample design phase on the field in October, 2003 that CaCO3 veins tended to occur on, or near the faults, and it was hypothesized that the CaCO3 was formed from the oxidation of seeping hydrocarbons in the past. It was described earlier that this is widely recognized as a “fossil” indicator of past/present hydrocarbon seepage and oxidation. Low CH4 fluxes were described in Table 2, and 13/40 locations had negative values, indicating the probability of methanotrophy being operational even in the low CH4 flux environment of the underpressured Teapot Dome field.
Ten-m holes were augured at Locations 17 and 18 on the S2 fault system (Figure 5). Location 17 had a low CO2 flux and a low, negative CH4 flux that were not expected. However, a small, steep-sided gully adjacent to Location 17 had visible calcite veins, and even residual hydrocarbon wax present in a vein. Location 18 had the highest CO2 flux in the 40-location survey, 733 mg·m−2·day−1, excluding the contaminated location. The CH4 flux was low, also a small negative value, but the CH4 gradient was high in the shallow soil gas measurements of the January, 2004 baseline survey. This suggested a highly effective methanotrophy process, even in the winter. A background location (02) near the northern edge of the field was chosen for a 10-m hole. The CO2 flux was the lowest value in the second quartile of Figure 5, and the CH4 flux was negative.
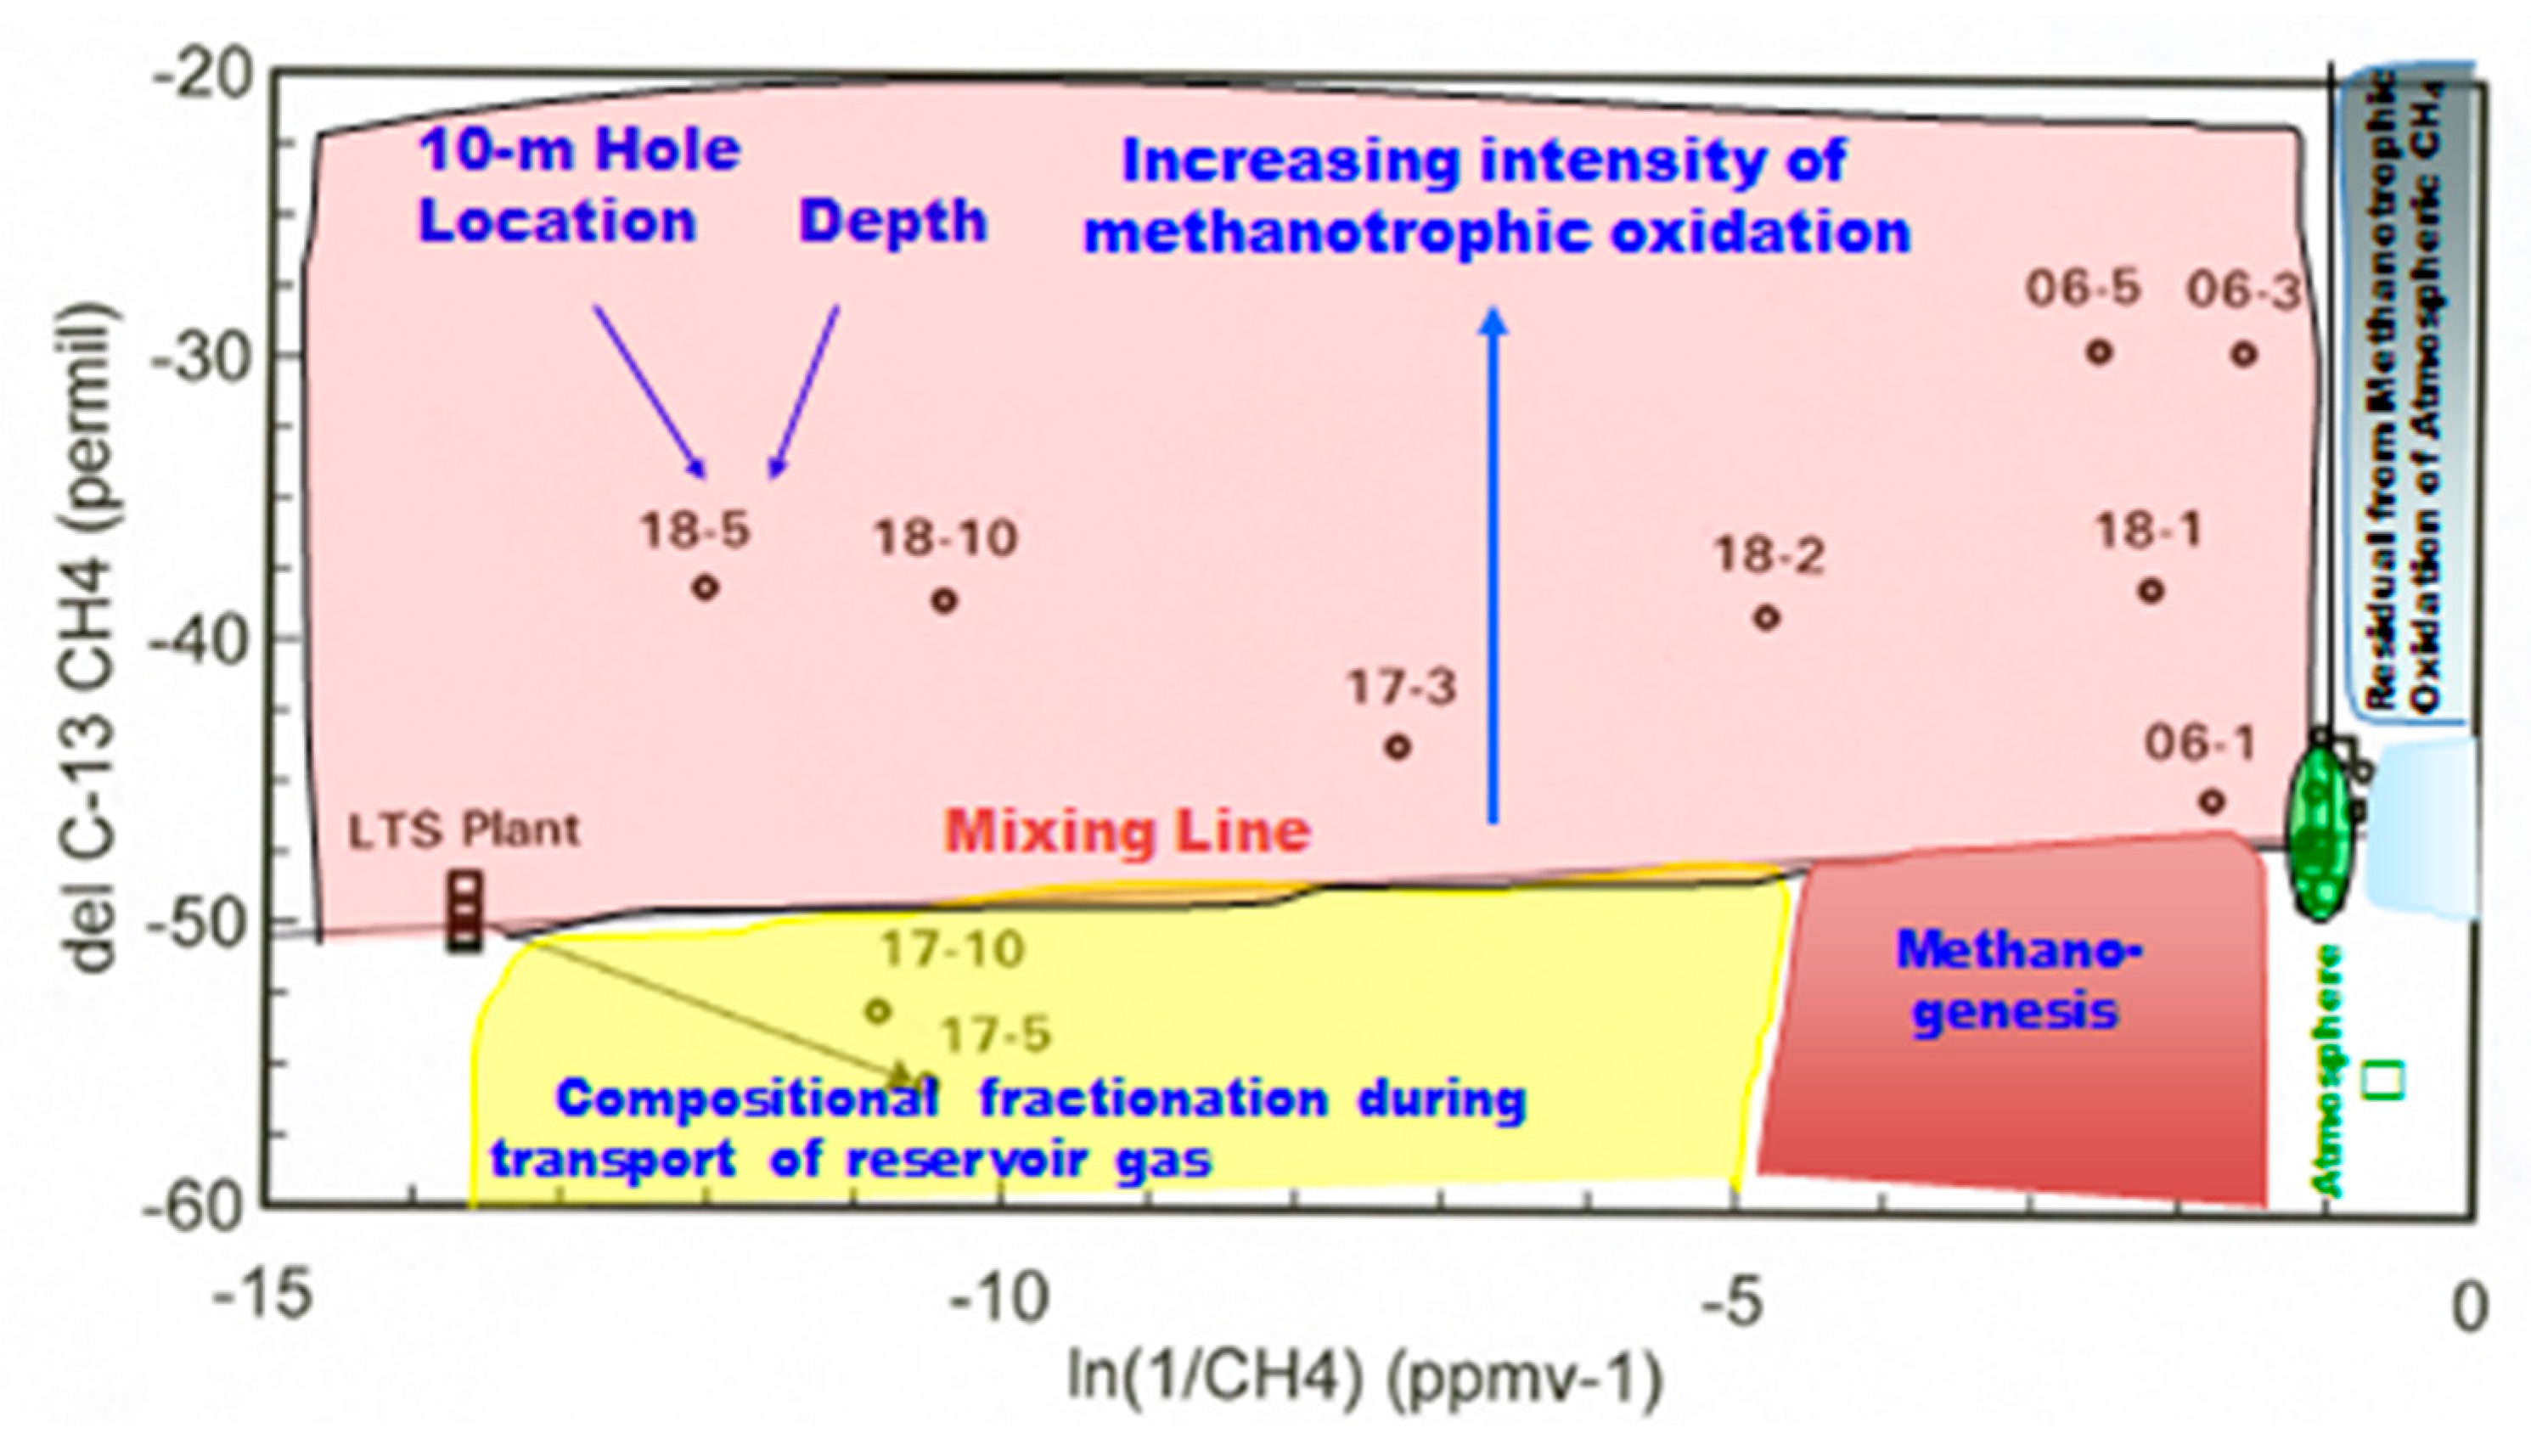
Another way to effectively illustrate both concentration and stable isotope data is an “Arrhenius plot” for CH4. It was applied earlier to atmospheric CO2 data as the “Keeling plot”, which was widely used in the atmospheric science literature. Figure 6 shows the plot for CH4 at Teapot Dome. Of primary interest is the upper left of the figure showing a substantial field for methanotrophy (Figure 6). Methanotrophic oxidation of CH4 results in a decrease in concentration, and a shift of the residual CH4 being sampled and measured to more enriched δ13C values. The mixing line between reservoir composition and the atmospheric composition would be due to simple mixing of the two end-members without any physical or geochemical process of modification. Substantial descriptions of the Teapot Dome 10-m gas concentration profiles were made [21], with additional discussion in the reviews [19,26]. This discussion will be of the two low concentration locations (#02 and #19) with average concentration profiles. This combined profile will be compared with the S2 fault locations (#17 and #18) in a compare/contrast mode because of the different behavior of the two fault locations.
Figure 6 shows the data as location and depth (i.e., 18-5) of a particular measurement. The background locations are close to the right-hand origin represented by the green ellipsoid, having concentrations and δ13 for CH4 close to atmospheric values. Location 18 has high CH4 concentrations and a significant isotopic shift, indicating effective methanotrophy. This contrasts with the 5- and 10-m data for Location 17. The isotopic shift is to more depleted values, which are relatively unusual. This shift can be explained as a slight isotopic fractionation during the migration process from the reservoir. The shift is above the mixing line for shallower depths, indicating that methanotrophy is taking over. LTS is the Low Temperature Separation plant where wet gases are cryogenically separated from the non-condensible gases. The LTS input composition is a composite sample of the reservoir gas. The small green ellipsoid contains the atmospheric composition represented by the □ symbol, samples very near atmospheric composition, and sampling/analytical error.
The analysis of the augur cuttings indicated for both Locations 17 and 18, there was an increase in the concentration of inorganic carbon and an isotopic shift to more depleted values of δ13C [19,21,26]. In the case of location 17, an apparent seal developed between 3- and 5-m depths. This explains the low CO2 flux and negative CH4 flux despite vein calcite being exposed in the adjacent gully.
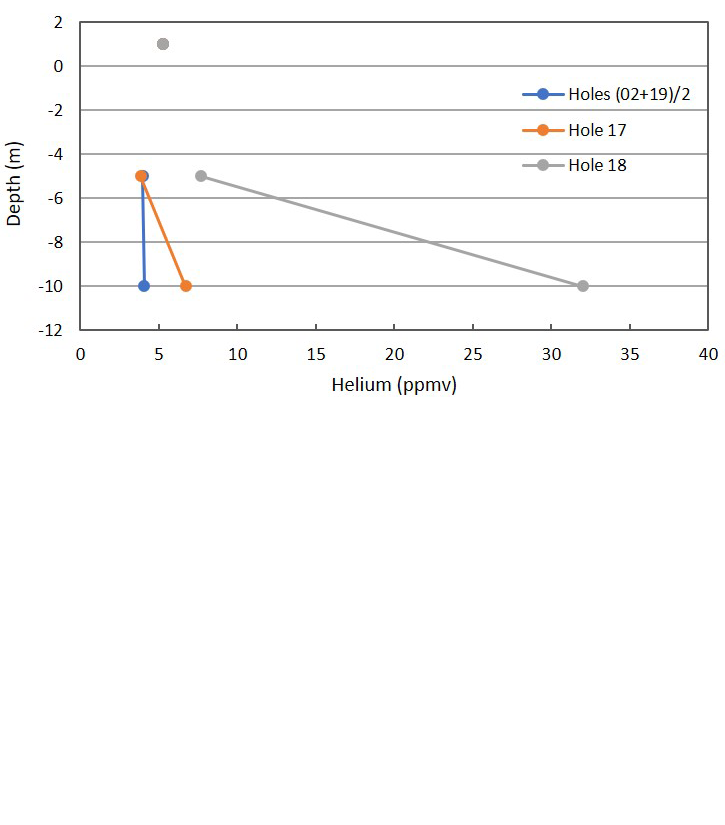
Figure 7 shows the CH4 profile for the combined background locations, anomalous Location 17, and anomalous Location 18 on a log scale. The very large difference indicates Fault Zone 2 has a connection to one or more of the stacked reservoirs at Teapot Dome. Even though the primary reservoir in the 2nd Wall Creek is severely underpressured, the fault is charged with gas.
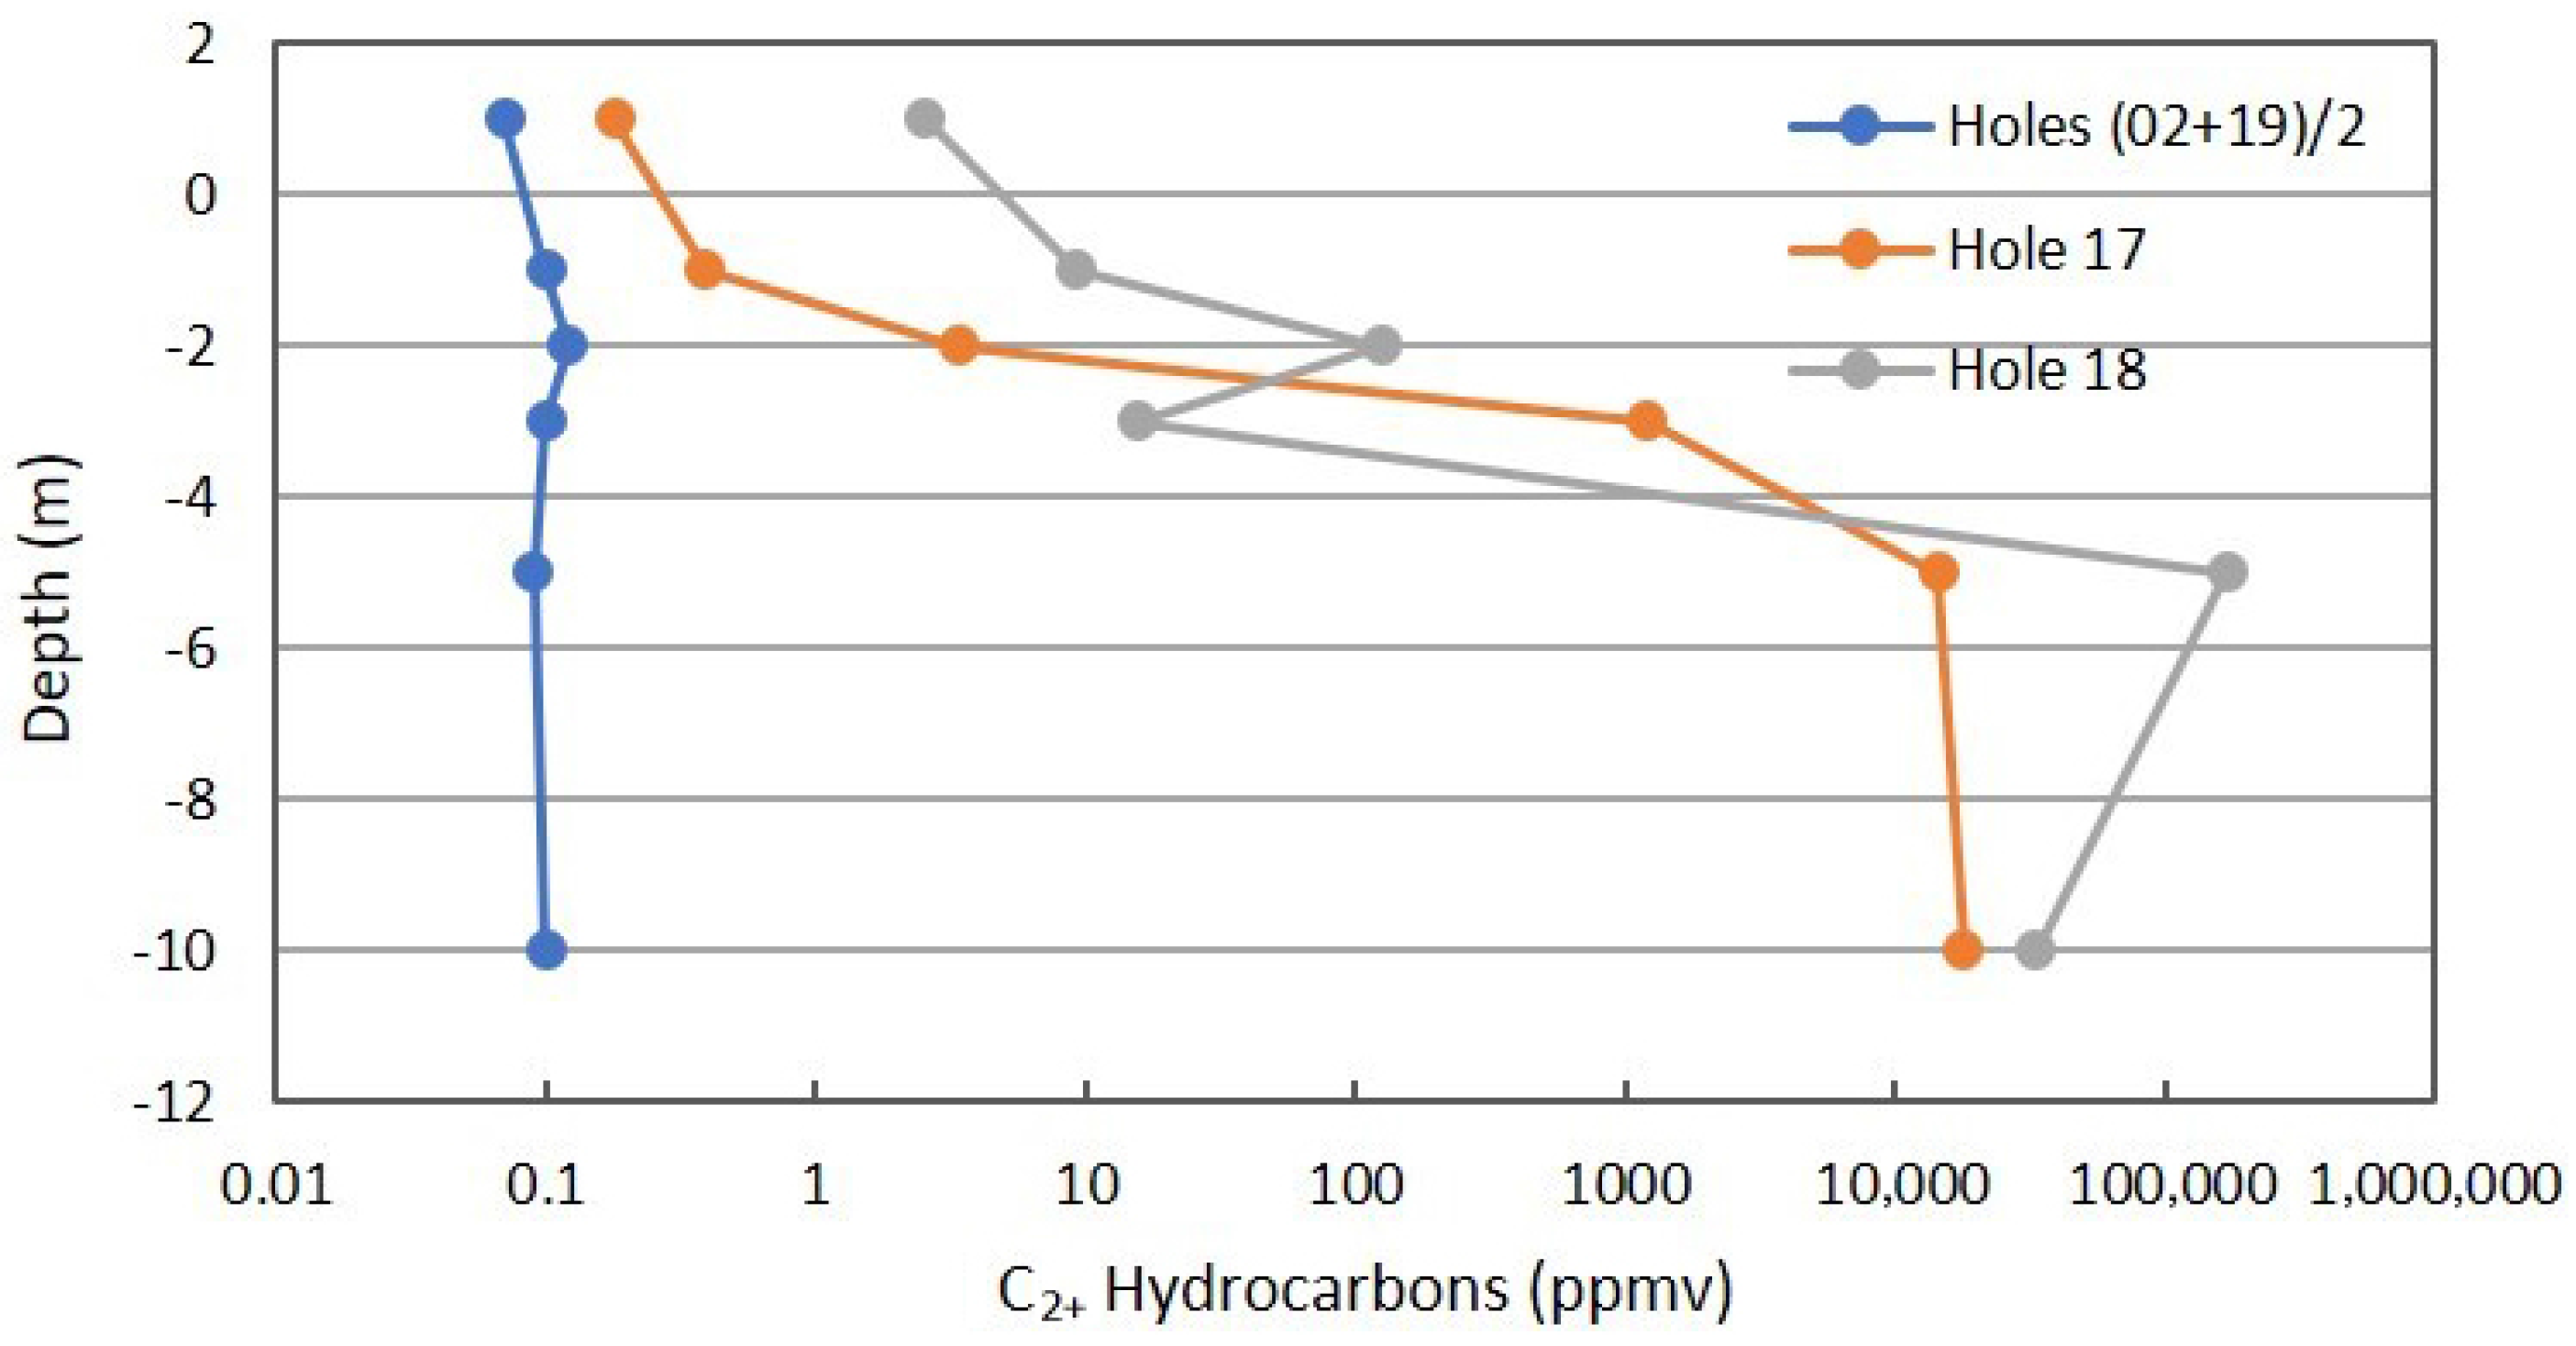
Figure 8 shows the same combined profiles for C2+ hydrocarbons that includes alkanes and alkenes. Alkenes are the first step in the oxidation of saturated hydrocarbons. The same interpretation can be applied as was described for Figure 7.
Figure 9 shows the combined profiles for CO2 concentration. The anomalous locations are higher in CO2 concentration than the combined background, but the differences are not as pronounced as for CH4 and C2+ hydrocarbons. This observation is in support of the superior nature of hydrocarbon data, relative to CO2 measurements.
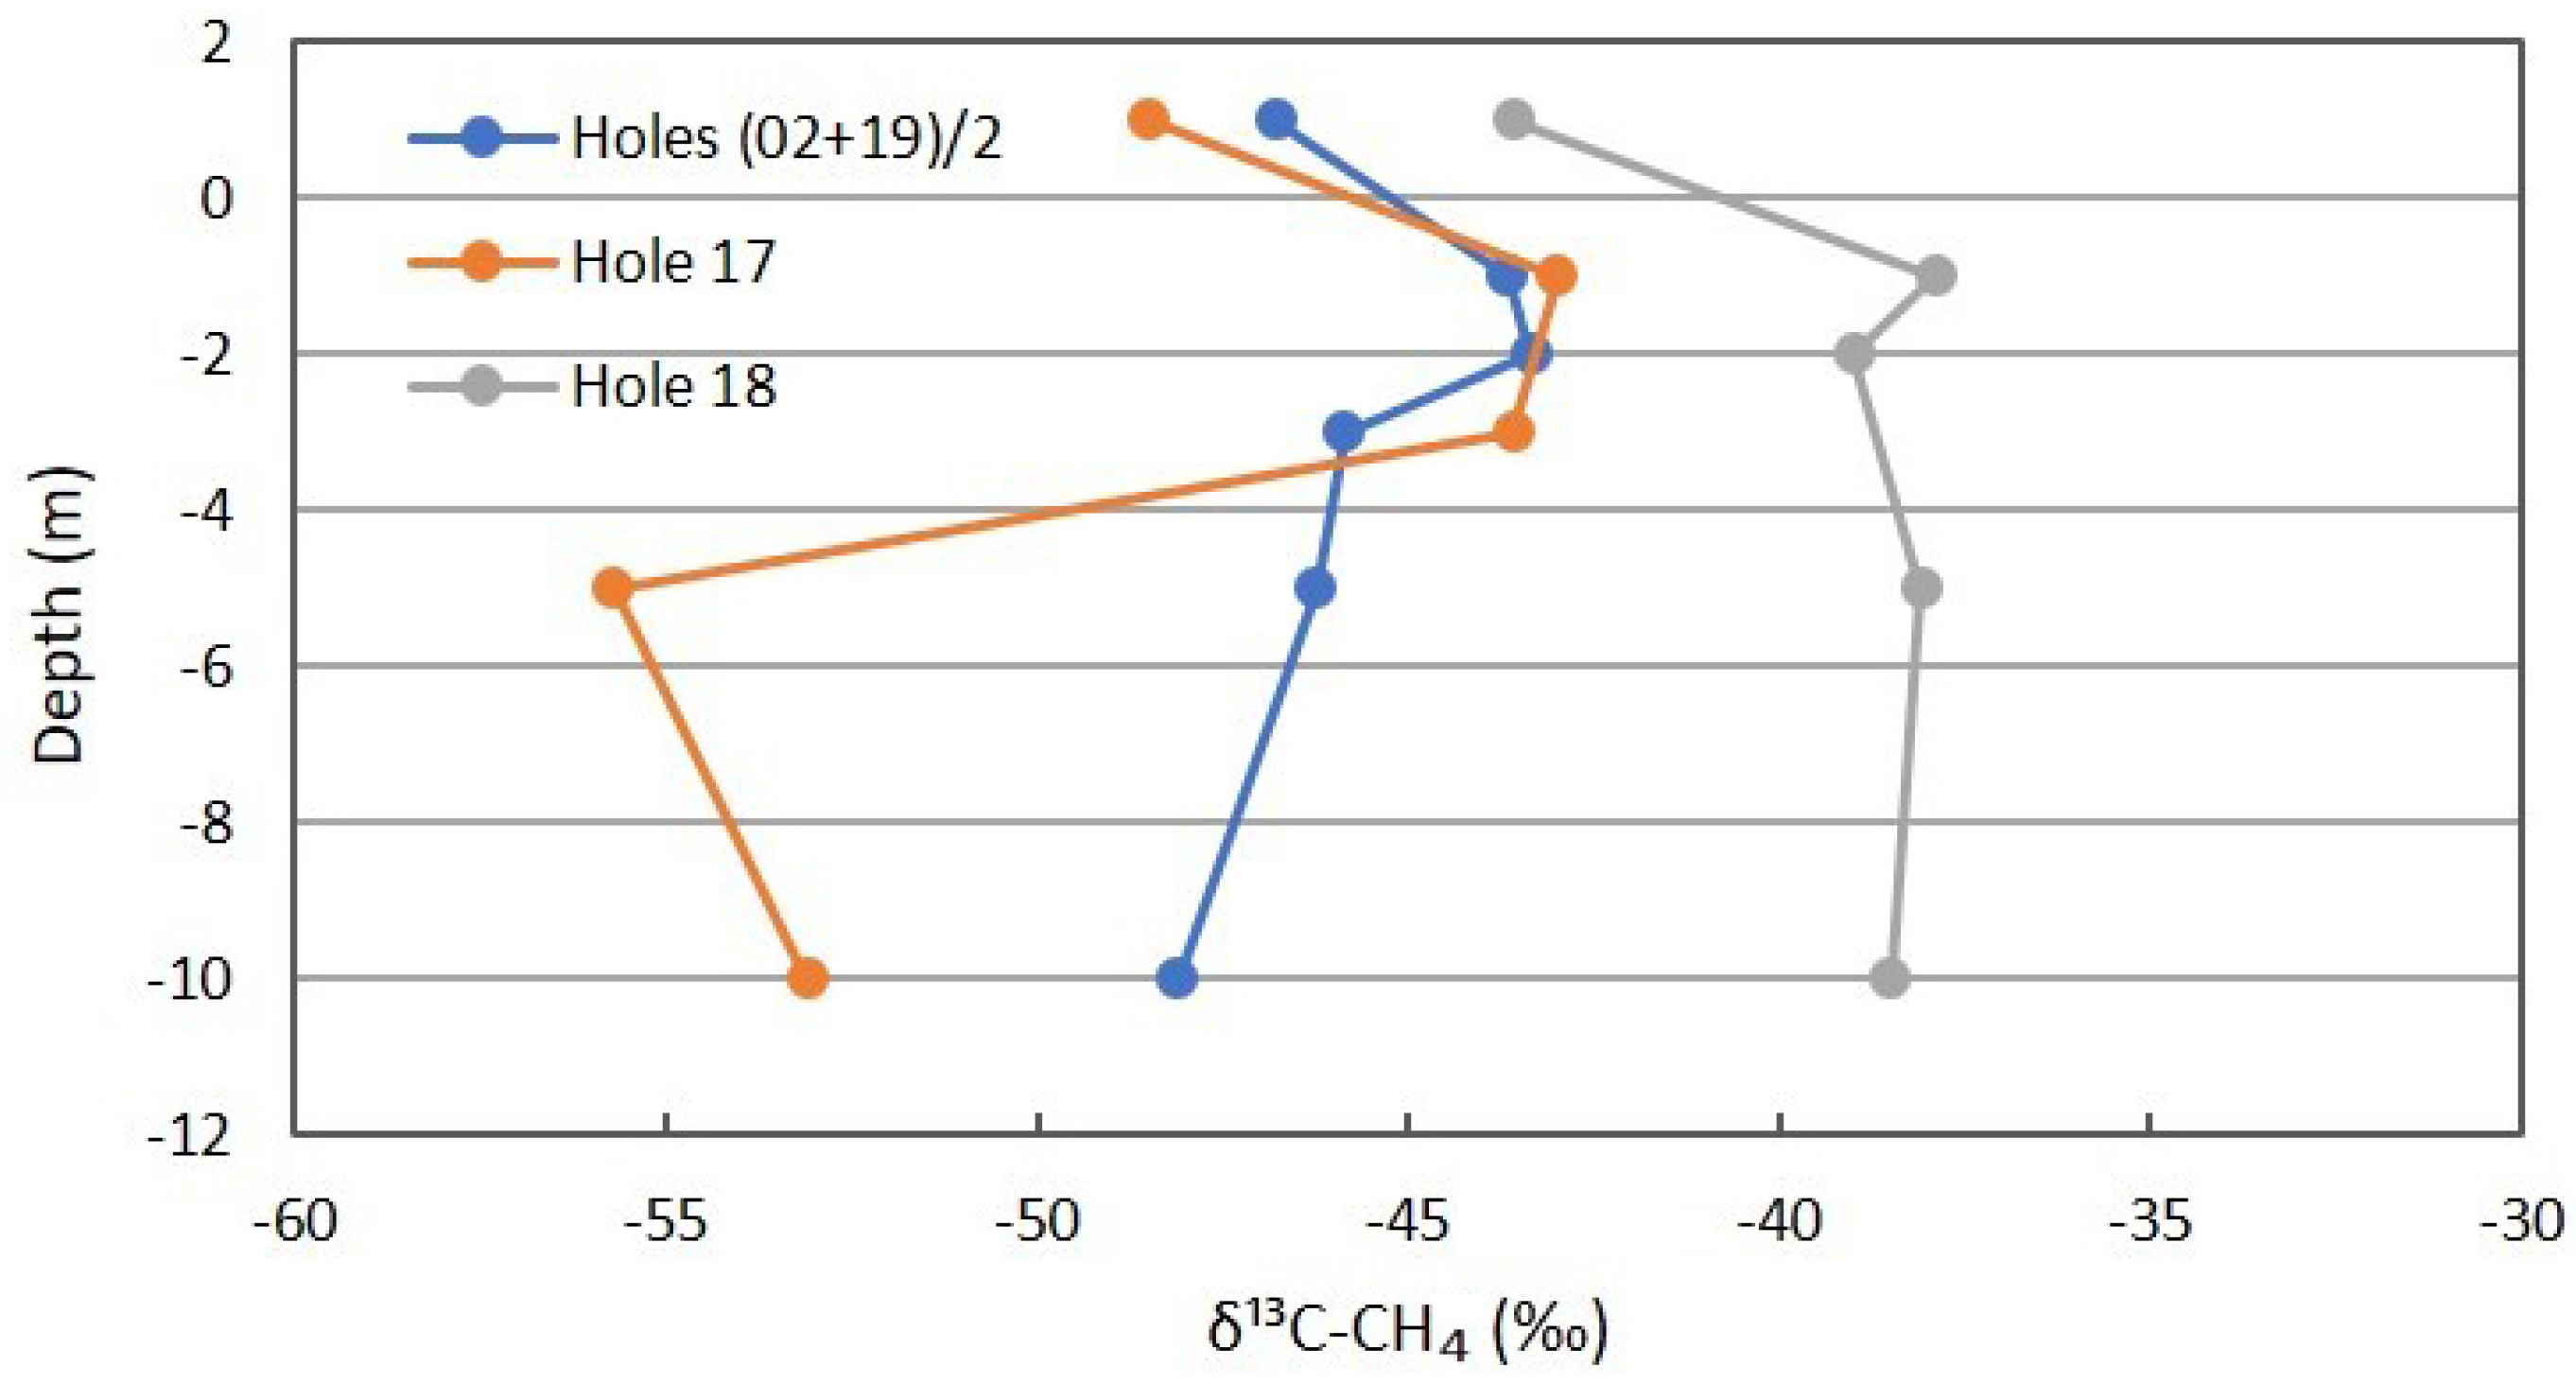
Figure 10 has the profiles for δ13C of CH4, showing a slight shift in the background. The shallow measurements for Location 17 are similar to the background, indicating the sealing at intermediate depths. The profile shifts to more depleted δ13C below the depth of sealing and the isotopic fractionation during migration from depth. The Location 18 profile shifts to more enriched δ13C at 5 m and 10 m, supporting rapid methanotrophy. At shallower depths, no further increase in δ13C occurs, suggesting slowing of methanotrophy at shallow depths during the winter months.
The δ13C for CO2 shown in Figure 11 is more complex. The background locations show some isotopic depletion with depth, supporting slow oxidation of soil organic matter. Location 17 is similar for shallow depths, but rapidly becomes more enriched at deeper intervals. The explanation for this is not as apparent, though lateral seepage of atmospheric CO2 from the adjacent gully is possible. However, this is inconsistent with the O2 profile presented next. The δ13C of Location 18 shifts rapidly to more depleted values, reflecting methanotrophic oxidation of the carbon source (reservoir CH4) to the product being sampled and measured (CO2).
Figure 12 is the profile for O2+Ar. The separation of O2 and Ar by ordinary GC and TCD detection is frequently not adequate and is presented as a combined peak. In this case, the atmospheric concentration of Ar at 0.94% is considered “constant”, and the combined data may suffer some inaccuracies. The apparent increase with shallow depths in the background may be the O2+Ar problem. A small decrease for the 10-m sample is expected for some methanotrophy of atmospheric CH4 at 10-m depth in the winter, but is absent at shallower depths. The comparison with CH4 in Figure 7 is useful. The decrease in O2 with depth for Locations 17 and 18 is to be expected. The larger decrease for Location 17 supports the earlier data on a seal between 3- and 5-m depths, but not lateral transport of gases from the adjacent gully. The diffusivity of O2 is larger than for CO2 due to molecular weight (32 vs. 44 amu, respectively).
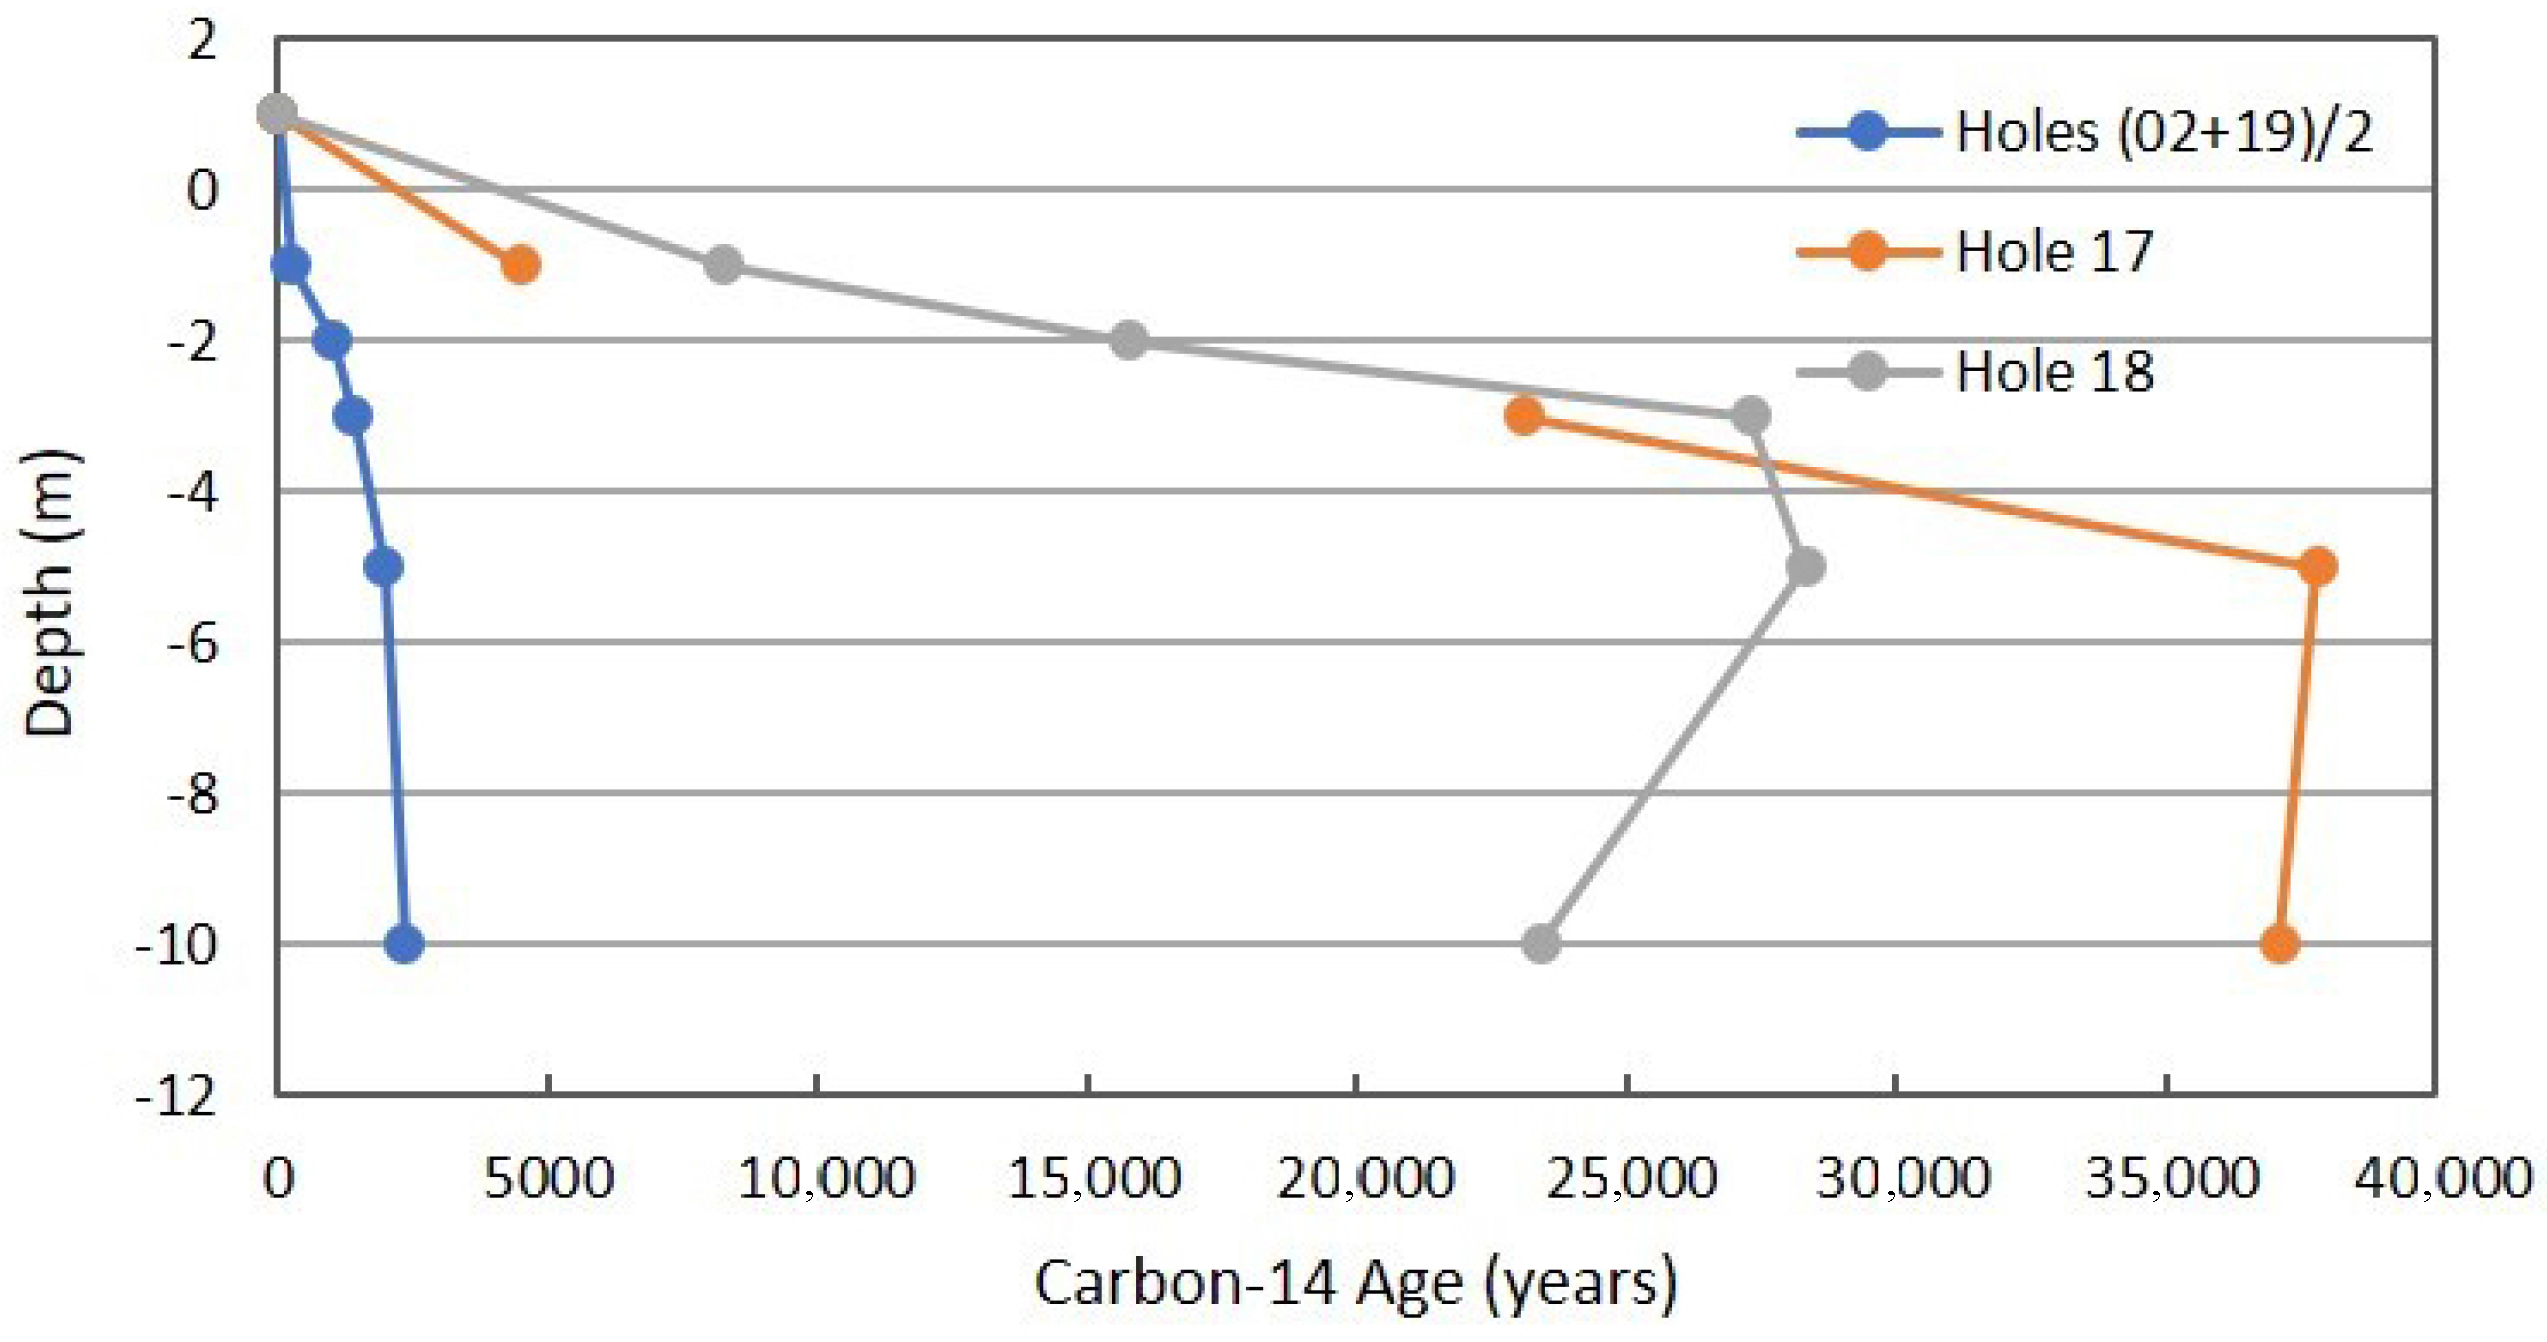
Figure 13 is the radiocarbon age determined on purified CO2 separated from other components in the soil gas samples of 10-m holes. This is a critical determination that can be considered strong verification in the MVA process for CO2 sequestration or in CO2-EOR. The non-routine C-14 determination can be applied if geologic CO2 or coal-derived CO2 is being injected into a subsurface reservoir. Carbon-14 can be used in a reverse fashion if modern CO2 is being injected and is still effective as an injected tracer.
The background data are clearly different from the anomalous locations in Fault Zone 2. The radiocarbon age for Location 17 is less than that for Location 18. This can be interpreted as less CH4 and hydrocarbon oxidation occurring at 5- and 10-m because of the seal between 3 and 5 m.
The 10-m holes and the producing reservoirs at Teapot Dome were sampled by Sarah Mackintosh and Christopher Ballentine in May 2005. Only the 5- and 10-m depths were sampled. The inert gases and selected isotopic ratios were determined by IRMS at the University of Manchester, UK. This can also be considered a non-routine determination and can provide strong verification of the presence and/or absence of deep-sourced gas seepage. The total concentrations of He and Ne can be determined by GC, and Ar is usually considered an interference on the determination of O2. One advantage is the atmospheric concentrations of the inert gases are quite constant, allowing for a deviation to be recognized as possibly anomalous. The stacked reservoirs were quite similar in inert gas composition, which may be expected because of many years of phase separation and reinjection of the non-condensable components back into the 2nd Wall Creek reservoir.
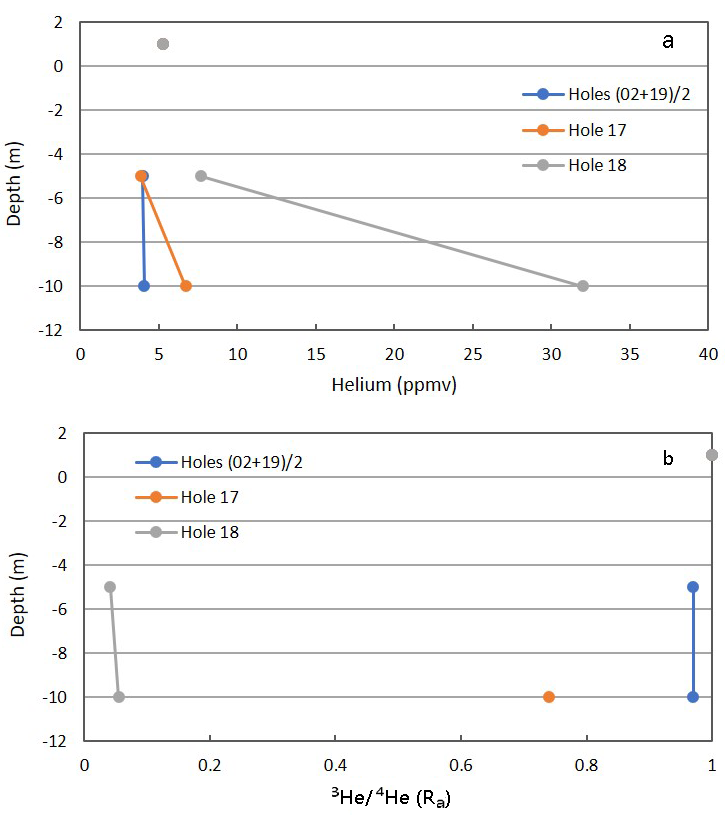
Figure 14a shows the total He for the background and anomalous Locations 17 and 18 [23]. There is a slight shift from the atmospheric concentration in the background location, which may be due to dilution by CO2 (Figure 9). Location 17 deviates only slightly from the atmospheric concentration, which may reflect the low CH4 and CO2 fluxes not carrying reservoir He toward the surface. Also, the seal invoked for Location 17 may be permeable to low atomic weight He gas. Location 18 has a high CO2 flux, invoking continual upward flow of reservoir gases, carrying reservoir He with the dominant components.
Isotopic data for inert gases are usually expressed as a ratio to the isotopic composition in air (Ra). This can be used to determine the proportion of air-derived contribution to the sample. The ratio of helium-3 to helium-4, but not the concentration, in the atmosphere is also constant and set as Ra = 1.00. The Ra value for the combined background was 0.97, indicating the atmospheric component. A downward shift in Ra indicates a relative increase in He-4 derived from radioactive α-decay at depth. Location 17 with a Ra of 0.74 at 10-m indicated some deep-source gas, but a significant atmospheric component. The low CH4 and CO2 fluxes allow for the mobile He atom to migrate into the system, either through the seal, or laterally from the adjacent gully. The low Ra value for Location 18 is consistent with a relatively robust upward flow of reservoir-derived gas carrying reservoir He toward the surface. As expected, the isotopic He ratio is consistent with the interpretation for total He.
It must also be stated that shallow groundwater is a superior medium for sampling inert gases, relative to soil gas [23]. However, in unpopulated areas, shallow groundwater wells may not be available as was the case for Teapot Dome. The area undergoing the CO2 flood at Rangely is also unpopulated, with the operation not extending under the town of Rangely. Inert gases were not sampled or measured at Rangely.
The Fault Zone 1 was subsequently investigated with another objective in mind. A single well in Section 10 (Figure 5) was proposed for a 10,000 tonne injection of CO2 [28]. Four lines of soil gas CO2 and CH4 determinations at 100-m spacing were sampled at 90° to the fault zones of Figure 4. The lines were offset from each other in order to maximize the opportunity to have the sampling intersect Fault Zone 1 or any other unknown fault (triangular grid). Fault Zone 1, which occurs near the southeastern portion of the sampled area, is a topographic high, and has calcite present in float. A short sampling profile was made at 2-m intervals directly across the suspected location of the fault. The un-named drainage was suspected of being a hidden fault zone because of the parallel nature to the known faults and wet conditions along the length of the drainage. The wet conditions prevented effective soil gas collection and measurements.
Figure 15 shows the CH4 concentration gradient (Figure 15a) and the presence of detectable C2H6 (Figure 15b) in the 100-cm soil gas sample. Only a few of the 40 locations in the survey had soil gas CH4 gradients >1.00 ppmv/meter. Substantial numbers had an indeterminate gradient or a negative gradient indicative of methanotrophy. The short profile over the fault had 6/10 samples with a gradient >1.00 ppmv/m. The results were similar for detectable ethane in the 100-cm soil gas sample (Figure 15b). The short profile had 9/10 samples with detectable ethane. Two of the short profile samples had detectable propane. The three detectable ethane samples surrounding the proposed injection well are unexplained, as no injection had yet occurred.
Two trenches were dug into the fault zone to confirm the presence of calcite veins in addition to the float at the surface. Two splays were present, reflecting the CH4 data on the fault x-section of Figure 15a. Samples were taken of calcite and shallow soil materials in the trenches. δ13C and δ18O were determined in these materials. Pedogenic CaCO3 can be recognized by the oxygen isotopic composition. The equilibration of this material with CO2 from the atmosphere is the basis for determination of the temperature of formation using the “meteoric water line” [29]. The pedogenic carbonate formation temperature (8.08 °C) corresponded closely with average recorded temperatures at the Casper, Wyoming airport approximately 30 km to the southwest (7.94 °C) over a 12-year period [19]. It was found that the vein material was formed from oxidation of hydrocarbons (δ13C) at higher temperatures (δ18O).
4. Discussion
The results illustrated in Figure 4 using geochemistry and stable isotopes demonstrated the lack of a connection between a deep reservoir and the surface. Demonstration of a “negative” result may be an important part of a monitoring program. This was also the case of an alleged leak at a small area at the southern edge of the Weyburn CO2-EOR project [30]. Soil gas and inert gas determinations in shallow groundwater were used in the verification of the absence of leakage.
Romanak and Yang [31] used a simple GC measurement of major components in soil gases in the same area of Weyburn to determine if CO2 was derived from normal soil respiration or from oxidation of CH4. This method was elaborated on in Romanak et al. [32]. This approach could be the basis for a more comprehensive long-term monitoring program.
Gilfillan and Haszeldine [33] applied inert gas isotopic ratio determination in shallow groundwater at the alleged leakage site to provide a strong verification of a conclusion of “no leakage.” The groundwater samples were compositionally similar to “air-saturated water” and were significantly different from the deep reservoir fluids, the produced fluids, and the CO2 being injected. This work also demonstrated the superiority of groundwater sampling over soil gas shown for inert gases in Figure 14, if groundwater is available. Generally, groundwater will be available in populated and agricultural areas.
In the review of the geochemical measurements at the alleged leakage site at Weyburn by the author, a number of observations could be made that compared the site with the Rangely measurements. The climate in both areas is cold in the winter, but Weyburn was glaciated in the Pleistocene and is substantially wetter. The area is also known as “prairie pot-hole” country, which brings up the possibility of methanogenesis being operational.
Figure 16 shows this author’s interpretation of the seasonal variation in biogeochemical processes operational at Weyburn and Rangely. Figure 16a shows a simplified chemical reaction of summer methanogenesis by acetate reduction producing CH4 for the Weyburn site. The dry climate of Rangely does not have methanogenesis operational, but has methanotrophy from deep-sourced CH4. During the winter, methanogenesis slows at Weyburn and methanotropy slows at Rangely (Figure 16b). The net effect is that the magnitude of the seasonal soil gas CH4 signal reverses when making the Weyburn-Rangely comparison.
The soil temperature gradient profiles for Rangely were not measured nor reported for the Kerr Farm at Weyburn. The profiles were measured at Teapot Dome in both summer and winter months, but not on a regular schedule. These data can be extrapolated to Rangely and Weyburn to some extent. The depth of the frozen layer can be readily recognized during driving of a soil gas probe by a change in the resistance when passing from frozen to unfrozen ground. This was between 30 and 60 cm at nearly all locations at Rangely and Teapot Dome. The minimum measured Teapot Dome soil temperature at a depth of 15-cm was −7.0 °C, and the average winter value was −2.5 °C. The maximum measured soil temperature at a depth of 15-cm was 21.5 °C, and the average was 17.5 °C. The damping depth where summer and winter soil temperatures converge was between 5 m and 10 m with temperatures in the 11–12 °C range. Rangely is a slightly colder climate with larger day/night differences in air temperatures. This can be projected to result in slightly lower soil temperature profiles. Weyburn is also a slightly colder climate than Teapot Dome, but with smaller day/night differences. The general presence of snow cover moderates the depth penetration of colder temperatures and is likely similar to Rangely. Soil temperatures measured at the Test Site at a depth of 15-cm lag behind air temperatures by approximately one month [12]. This lag can be expected to vary with location, depth of measurement and the presence of partially water-filled porosity.
The temperature gradient profiles must also consider the contrasting climates and water table elevations at Weyburn (Dfc) and Rangely (Bsk). The profiles do not extend deep enough to see a true geothermal gradient for the Earth’s crust at that location. The average air temperatures may be similar in summer, and also in winter at the two locations, despite differences in maximum and minimum values. The ability of the seasonal air temperature wave to penetrate the unsaturated zone is related to the material making up the shallow soil or bedrock, and most importantly, the presence of water. Water has a high heat capacity, effectively attenuating the atmospheric temperature wave from the surface at Weyburn. In the drier climate at Rangely, the summer warming extends deeper, but does not reach the water table. The average temperature at greater depth is approximately equal to the average annual temperature in the absence of a high geothermal gradient. The deeper portion of the profile at Rangely exhibits a slightly greater temperature. This is due to the possibility of an increased geothermal gradient related to gas migration [3]. In geothermal exploration, shallow temperature gradients are effective in locating drilling targets. In some oil/gas fields, there is also a small temperature gradient anomaly. This observation reflects a “rule-of-thumb” that mass flow and heat flow are correlated.
A monitoring program should measure soil temperature profiles at a project site, particularly when carbon-containing gases are being measured. This is in addition to normal meteorological measurements. The production/consumption of carbon-containing gases is strongly influenced by temperature, particularly microbiological reactions in the soil column. Temperature data will also allow future modeling of production/consumption processes that vary with season. A diurnal temperature wave can also be recognized for depths less than one meter in dry climates. Recording of data at the same time of day can reduce or largely eliminate this short-term effect.
The radiocarbon results of Figure 13 were presented as radiocarbon age. Radiocarbon age may be different from true age, depending on the decay constant used in calculation of radiocarbon age. Tree-ring dating (dendrochronology) coupled with C-14 determination allowed for calibration. It was found that the assumed constant C-14 production in the upper atmosphere is not constant over a long period of time. The standard reference material for calibration is the C-14 content of an oxalic acid sample prepared in 1950 and defined as “Modern.” There have been two significant perturbations of C-14 in the atmosphere. Atmospheric thermonuclear testing raised the C-14 content of CO2 substantially, peaking in 1963. Burning of fossil fuels decreases the C-14 content of atmospheric CO2. Dissolution of CO2 in the ocean and uptake by photosynthesis also decreases the C-14 content with time.
Data from AMS determination of C-14 content are normally reported as Fraction of Modern; Fm. The radiocarbon age can be calculated from the Fm value using an accepted value for the decay constant. The Fm value asymtotically approaches zero with increasing age, and the uncertainty in the AMS determination increases with increasing age because of counting statistics. The minimum Fm reported in the Rangely and Teapot Dome research was 0.0090 ± 0.0004, translating to a radiocarbon age of 37,800 years. Using a 5568-year half-life, this translates to almost seven half-lives. The Fm content of the CO2 in the atmosphere as sampled and determined at Rangely and Teapot Dome was from 1.02 to 1.03, and is reported as >Modern.
The use of C-14 in areas of continental glaciation presents a potential problem in interpretation and effectiveness in application. At depth intervals below that of modern root respiration, but still in glacial till, may provide Fm values that are intermediate in age. For example, at three half-lives (3 × 5568 years = 16,700 years), decaying organic material in glacial till will have a Fm value of 0.125. Even in the absence of glaciation, shallow samples may exhibit an age of several hundred years, reflecting slow oxidation of humic substances (Figure 13).
Sampling and measurement techniques deserve some discussion. Figure 2 illustrates the effect of elevation above or below the land surface in the effectiveness of the detection of a subtle, deep signal. Tower measurements by eddy covariance (EC) have been promoted by some and there is substantial experience in application to ecosystem and agricultural studies [34]. However, in ecosystem studies, the above-ground and surface biology is the signal that is desired in the measurement. In the MVA application, the ecosystem is noise. The possible, but small deep-sourced signal that is being sought is imbedded in this surface environmental noise. In forested environments, a downward CO2 flux is observed during photosynthesis. There has also been a lack of winter measurements, except for permanent ecosystem programs. It is the opinion of this author that tower measurements in an agricultural or industrial environment will also have difficulties because of seasonal and even diurnal noise.
Klusman [19] suggested that cavity-enhanced absorption spectrometry (CEAS) has potential for effective application in an MVA program. This is particularly true for CO2-EOR where a CH4 signal may be more important than a CO2 signal. The mobility of CH4, its low and relatively constant concentration in the atmosphere is also a factor in using CH4 as an indigenous tracer for monitoring gas seepage. Two variations of CEAS are emerging as being effective in a monitoring program. These are cavity ring-down absorption spectrometry and off-axis cavity absorption spectrometry. There is the possibility of isotopic ratio determination for carbon, but probably not simultaneously with hydrogen isotopes. One of these has been adapted to and coupled with a flux chamber. Tang et al. [35] reported CH4 seepage measurements using this instrument at the Dawanqi and Yakela oil fields. This will result in a substantial increase in speed and sensitivity of flux measurements. Krevor et al. [36] used a portable cavity-enhanced ring-down instrument to successfully search for CO2 leakage pathways after injection of an isotopically spiked sample into a slotted pipeline at the ZERT site in Montana, USA.
Open-path CO2 and open-path CH4 instruments, both using laser IR technology are available. These have been primarily applied in high flux environments for CH4 [37,38]. In the EC method, the distance that these can see in an upwind direction is proportional to the height of the tower and for continuous operation will require line power. In addition to the dilution factor of Figure 2, the instrument must be brought down from the tower for calibration in a closed chamber of known CO2 or CH4 concentration. Searching and location of a leakage signal that is suspected because of a change in bi-monthly monitoring of 10-m holes might be feasible using EC on a tripod. Alternatives are IR laser measurement between a source and a readily movable reflector, and CEAS [36]. These methods improve portability in a search mode.
In the situation where a suspected leak must be found relatively quickly, another approach might be used that encompasses both soil gas concentration(s) and flux measurements [39]. The speed of vertical gas migration in faulted and fractured terrain was also investigated using injected and produced tracers. Tarp and/or tent structures covering larger areas than are practical with commercial flux chambers allow for rapid reconnaissance, though vegetation cover increases the difficulty. This approach was applied to inert gas radioisotopes demonstrating the effective application and mobility of inert gases that will accumulate in a deep reservoir. The importance of barometric pumping in the migration of gases in the shallow subsurface was also quantified.
The unexpected negative CO2 flux at Teapot Dome background location 19 was solved during the auguring of the 10-m hole. A perched water table was found at approximately seven meters depth. Sampling and analysis of this water demonstrated that it was supersaturated with respect to calcite. The interpretation of this was that soil organic matter oxidation in the winter was so low that CO2 was being drawn from the atmosphere to satisfy the crystallization of calcite. Consequently, there is no 10-m interval in location 19. This has consequences in wetter climates with a shallow water table. The deepest completion for soil gas sampling should be as close as practical to the water table.
The accounting portion of MVA has not been discussed. A preliminary estimate has been made for CO2 and CH4 at Rangely [24]. Accounting was discussed in some detail in Klusman [26]. The accounting at Rangely provided an estimate of <170 tonnes of CO2/year, and either 400 or 700 tonnes of CH4/year over the 78 km2 area. The 400 tonne value is calculated by subtracting the control area average from the Rangely field average. The 700 tonne value is obtained from a statistical analysis of the population distribution. Improvements in flux measurements will allow for better accounting over time than was accomplished with the initial Rangely seasonal measurements.
A selection of gas seepage levels for CO2 and CH4 is illustrated in Figure 17 to place measurements in perspective. The range for common environmental levels was provided by Benson and Hepple [40]. The Decatur measurement is for several years of averaging in three seasons, excluding the winter season [41]. Horsehoe Lake (HL), California, originated from a passive volcanic gas venting event [42,43]. The red and blue lettering for Rangely, Teapot Dome, and other measurements are for winter and summer measurements, respectively. The limit of detection (LOD) shown for CO2 is for the Licor 7000 used by the author at Rangely and Teapot Dome. The LOD for CH4 is more complex, and the absolute value is |0.45| mg·m−2·day−1. The value represents one determination in the 1.00 m2 flux chamber. Methane frequently has negative fluxes as well as positive fluxes. The LOD of 0.45 for CH4 is the absolute value for a single small positive or negative flux measurement. In the case of the Frio experiment in a warm, wet southeast Texas environment, the negative flux observed in 2004 was greater in magnitude than that measured in 2005 [44]. This result was attributed to much wetter conditions in 2005, giving methanotrophs less vertical space to operate in the unsaturated zone.
5. Conclusions
Measurements of seasonal CO2 and CH4 gas fluxes at an operational CO2-EOR project and a proposed project were completed at Rangely, Colorado and Teapot Dome, Wyoming. The flux measurements were supplemented by shallow soil gas measurements at 30-, 60-, and 100-cm depths. These data were used for the selection of locations for 10-m holes with nested completions to allow sampling at 1-, 2-, 3-, 5- and 10-m depths. In addition to CO2 and CH4, light hydrocarbon and stable isotopic measurements were made. Verification of CH4 seepage at the overpressured Rangely system was made with carbon-14. In addition to carbon-14, limited inert gas measurements were made at Teapot Dome.
The results demonstrate the importance of seasonality in measurement of gas fluxes and of soil gas for an on-shore project. In order to see through the substantial surface and near-surface noise of these systems, winter or dry season measurements are essential. Methane will be a far more effective tracer in CO2-EOR than the measurement of CO2 because of the mobility of CH4 in the subsurface chemically reducing environment. The results at Teapot Dome also demonstrated the importance of winter measurements and the role of faults as conduits for gas seepage. At the underpressured, and hydrocarbon-depleted Teapot Dome field, the gas fluxes were minimal. However, the faults are charged with hydrocarbons, which will probably respond to re-pressurization of the reservoirs.
Supplementary Materials
The following are available online at www.mdpi.com/2076-3263/8/3/92/s1, supplementary.v1.pptx.
Acknowledgments
The research at Rangely was sponsored by Basic Energy Sciences of the U.S. Department of Energy. Chevron Production, USA, operator of the Rangely field provided in-kind support and access to substantial reservoir and field data. The research at Teapot Dome was sponsored by the Rocky Mountain Oilfield Testing Center, and Naval Petroleum Reserve #3 personnel provided in-kind support. The research was carried out by the author in a transition retirement. Three anonymous reviewers provided useful suggestions and corrections.
Conflicts of Interest
The author declares no conflict of interest.
References
- Ciais, P.; Sabine, C. Chapter 6. Carbon and Other Biogeochemical Cycles. In Climate Change 2013: The Physical Science Basis; Contribution of Working Group I to the Fifth Assessment Report of the Intergovernmental Panel on Climate Change, Stocker, T.F., Qin, O., Plattner, G.-K., Tignor, M., Allen, S.K., Boschung, J., Nauels, A., Xia, Y., Bex, V., Midgley, P.M., Eds.; Cambridge University Press: New York, NY, USA, 2013; pp. 465–570. ISBN 978-1-107-05799-1. [Google Scholar]
- MacElvain, R. Mechanics of gaseous ascension through a sedimentary column. In Unconventional Methods in Exploration for Petroleum and Natural Gas; Heroy, W.B., Ed.; Southern Methodist University Press: Dallas, TX, USA, 1969; pp. 15–28. [Google Scholar]
- Klusman, R.W. Soil Gas and Related Methods for Natural Resource Exploration; John Wiley & Sons: Chichester, UK, 1993; p. 483. ISBN 0-471-93892-0. [Google Scholar]
- Klusman, R.W.; Saeed, M.A. Comparison of light hydrocarbon seepage mechanisms. In Hydrocarbon Migration and Its Near-Surface Expression; Schumacher, D., Abrams, M.A., Eds.; American Association of Petroleum Geologists: Tulsa, OK, USA, 1996; pp. 157–168. ISBN 1-58861-206-1. [Google Scholar]
- Brown, A. Evaluation of possible gas microseepage mechanisms. Am. Assoc. Petrol. Geol. Bull. 2000, 84, 1775–1789. [Google Scholar]
- Abrams, M.A. Significance of hydrocarbon seepage relative to petroleum generation and entrapment. Mar. Petrol. Geol. 2005, 22, 457–477. [Google Scholar] [CrossRef]
- Baum, E.J. Chemical Property Estimation: Theory and Application; Lewis Publishers: Boca Raton, FL, USA, 1998; p. 386. ISBN 0-87371-938-7. [Google Scholar]
- Millington, R.J.; Quirk, J.M. Permeability of porous solids. Trans. Faraday Soc. 1961, 57, 1200–1207. [Google Scholar] [CrossRef]
- Thibodeaux, L.J. Environmental Chemodynamics: Movement of Chemicals in Air, Water, and Soil, 2nd ed.; John Wiley & Sons: New York, NY, USA, 1996; p. 593. ISBN 0-471-61295-2. [Google Scholar]
- Klusman, R.W. Possible Vertical Migration of CO2 Associated with Large-Scale Injection into Subsurface Geologic Formations; Final Report DOE Grant DE-FG03-00ER 15090; Colorado School of Mines: St. Golden, CO, USA, 2003; p. 158. [Google Scholar]
- Klusman, R.W. Evaluation of leakage potential from a carbon dioxide EOR/sequestration project. Energy Convers. Manag. 2003, 44, 1921–1940. [Google Scholar] [CrossRef]
- Klusman, R.W.; Jaacks, J.A. Environmental influences upon mercury, radon and helium concentrations in soil gases at a site near Denver, Colorado. J. Geochem. Explor. 1987, 27, 259–280. [Google Scholar] [CrossRef]
- Klusman, R.W.; Leopold, M.E.; LeRoy, M.P. Seasonal variation in methane fluxes from sedimentary basins to the atmosphere: Results from chamber measurements and modeling of transport from deep sources. J. Geophys. Res. 2000, 105, 24661–24670. [Google Scholar] [CrossRef]
- Faure, G.; Mensing, T.M. Isotopes: Principles and Applications, 3rd ed.; John Wiley & Sons: Hoboken, NJ, USA, 2005; p. 897. ISBN 978-8126538379. [Google Scholar]
- Clark, I.D.; Fritz, P. Environmental Isotopes in Hydrology; CRC Press, Lewis Publishers: Boca Raton, FL, USA, 1997; p. 328. ISBN 1-56670-249-6. [Google Scholar]
- Baskaran, M. Environmental Isotope Geochemistry, v. 1; Springer: New York, NY, USA, 2011; p. 951. ISBN 978-3642106361. [Google Scholar]
- Hashmonay, R.A.; Natschke, D.F.; Wagoner, K.; Harris, D.B.; Thompson, E.I.; Yost, M.G. Field evaluation of a method for estimating gaseous fluxes from area sources using open-path Fourier transform infrared. Environ. Sci. Technol. 2001, 35, 2309–2313. [Google Scholar] [CrossRef] [PubMed]
- Trottier, S.; Gunter, W.D.; Kadatz, B.; Olson, M.; Perkins, E.H. Atmospheric monitoring for the Pembina Cardium CO2 monitoring project using open path laser technology. Energy Procedia 2009, 1, 2307–2314. [Google Scholar] [CrossRef]
- Klusman, R.W. Comparison of surface and near-surface geochemical methods for detection of gas microseepage from carbon dioxide sequestration. Int. J. Greenh. Gas Control 2011, 5, 1369–1392. [Google Scholar] [CrossRef]
- Klusman, R.W. A geochemical perspective and assessment of leakage potential for a mature carbon dioxide-enhanced oil recovery project and as a prototype for carbon dioxide sequestration: Rangely field, Colorado. Am. Assoc. Petrol. Geol. Bull. 2003, 87, 1485–1507. [Google Scholar] [CrossRef]
- Klusman, R.W. Detailed compositional analysis of gas seepage at the National Carbon Storage Test Site, Teapot Dome, Wyoming, USA. Appl. Geochem. 2006, 21, 1498–1521. [Google Scholar] [CrossRef]
- Klusman, R.W. Design for 10-m hole construction, sampling and measurement. Unpublished work. 2004. [Google Scholar]
- Mackintosh, S.J.; Ballentine, C.J. Using 3He/4He isotope ratios to identify the source of deep reservoir contributions to shallow fluids and soil gas. Chem. Geol. 2012, 304–305, 142–150. [Google Scholar] [CrossRef]
- Klusman, R.W. Rate measurements and detection of gas microseepage to the atmosphere from an enhanced oil recovery/sequestration project, Rangely, Colorado, USA. Appl. Geochem. 2003, 18, 1825–1838. [Google Scholar] [CrossRef]
- Klusman, R.W. Computer modeling of methanotrophic oxidation of hydrocarbons in the unsaturated zone from an enhanced oil recovery/sequestration project, Rangely, Colorado, USA. Appl. Geochem. 2003, 18, 1839–1852. [Google Scholar] [CrossRef]
- Klusman, R.W. Surface geochemical measurements applied to monitoring, verification, and accounting of leakage from sequestration projects. Interpretation 2015, 3, SM1–SM21. [Google Scholar] [CrossRef]
- Klusman, R.W. Baseline studies of surface gas exchange and soil gas composition in preparation for CO2 sequestration research: Teapot Dome, Wyoming. Am. Assoc. Petrol. Geol. Bull. 2005, 89, 981–1003. [Google Scholar] [CrossRef]
- Klusman, R.W. Soil Gas Survey near CO2 Injection Well 44-2-TPX-10; Final Report, DOE Contract DE-AP91-03WR01095; Colorado School of Mines: St. Golden, CO, USA, 2007; p. 43. [Google Scholar]
- Craig, H. Isotopic variations in meteoric waters. Science 1961, 133, 1702–1703. [Google Scholar] [CrossRef] [PubMed]
- Sherk, G.W. The Kerr Investigation: Final Report; IPAC-CO2 Research: Regina, SK, Canada, 2011; p. 181. [Google Scholar]
- Romanak, K.D.; Yang, C. Analysis of gas geochemistry at the Kerr site. In The Kerr Investigation: Final Report; Sherk, G.W., Ed.; IPAC-CO2 Research: Regina, SK, Canada, 2011; pp. 58–77. [Google Scholar]
- Romanak, K.D.; Bennett, P.C.; Yang, C.; Hovorka, S.D. Process-based approach to CO2 leakage detection by vadose zone gas monitoring at geologic CO2 storage sites. Geophys. Res. Lett. 2012, 39. [Google Scholar] [CrossRef]
- Gilfillan, S.M.; Haszeldine, S. Report on noble gas, carbon stable isotope and HCO3 measurements from the Kerr quarter and surrounding area, Goodwater, Saskatchewan. In The Kerr Investigation: Final Report; Sherk, G.W., Ed.; IPAC-CO2 Research: Regina, SK, Canada, 2011; pp. 79–103. [Google Scholar]
- Ameriflux. Ameriflux Guidelines for Making Eddy Covariance Flux Measurements. Available online: http://public.orl.gov/ameriflux/measurement.standards.020209.doc (accessed on 23 May 2011).
- Tang, J.; Xu, Y.; Wang, G.; Etiope, G.; Han, W.; Yao, Z.; Hang, J. Microseepage of methane to the atmosphere from the Dawanqi oil-gas field, Tarim Basin, China. J. Geophys. Res. Atmos. 2017, 122, 4353–4363. [Google Scholar] [CrossRef]
- Krevor, S.; Perrin, J.-C.; Esposito, A.; Rella, C.; Benson, S.M. Rapid detection and characterization of surface CO2 leakage through the realtime measurement of δ13C signatures in CO2 flux from the ground. Int. J. Greenh. Gas Control 2010, 4, 811–815. [Google Scholar] [CrossRef]
- Alberto, M.C.; Wassmann, R.R.; Buresh, R.J.; Quilty, J.R.; Centeno, T. Measuring methane flux from irrigated rice field by eddy covariance method using open-path gas analyzer. Field Crops Res 2014, 160, 12–21. [Google Scholar] [CrossRef]
- Herbst, M.; Friberg, T.; Thomas, R.; Soegard, H. Catchment-wide atmospheric greenhouse gas exchange as influenced by land use diversity. Vadose Zone J. 2011, 10, 67–77. [Google Scholar] [CrossRef]
- Carrigan, C.R.; Sun, Y.; Hunter, S.L.; Ruddle, D.G.; Wagoner, J.L.; Myers, K.B.L.; Emer, D.F.; Drellack, S.L.; Chipman, V.D. Delayed signatures of underground nuclear explosions. Sci. Rep. 2016, 6, 23032. [Google Scholar] [CrossRef] [PubMed]
- Benson, S.M.; Hepple, R. Prospects for early detection and options for remediation of leakage from CO2 storage projects. In Geologic Storage of Carbon Dioxide with Monitoring and Verification, v. 2; Benson, S.M., Ed.; Elsevier Science: London, UK, 2005; pp. 1189–1203. ISBN 978-0-08-044572-4. [Google Scholar]
- Greenberg, S.A.; Bauer, R.; Will, R.; Locke, R., II; Carney, M.; Leetaru, H.; Medler, J. Geologic carbon storage at a one million tonne demonstration project: Lessons learned from the Illinois Basin—Decatur Project. Energy Procedia 2017, 114, 5529–5539. [Google Scholar] [CrossRef]
- Lewicki, J.L.; Fischer, M.L.; Hilley, G.E. Six week time series of eddy covariance CO2 flux at Mammoth Mountain, California: Performance evaluation and role of meteorological forcing. J. Volcanol. Geotherm. Res. 2008, 171, 178–190. [Google Scholar] [CrossRef]
- Lewicki, J.L.; Hilley, G.E.; Dobeck, L.; Mario, B.V. Eddy covariance imaging of diffuse volcanic CO2 emission at Mammoth Mountain, CA, USA. Bull. Volcanol. 2012, 74, 135–141. [Google Scholar] [CrossRef]
- Klusman, R.W.; Strazisar, B.R. South Liberty salt dome-Frio gas flux project. Unpublished research. 2004–2005. [Google Scholar]
Figure 1.
Location of sites of measurements and discussion in this study (modified from http://koeppen-geiger.vu-wien.ac.at/usa).
Figure 1.
Location of sites of measurements and discussion in this study (modified from http://koeppen-geiger.vu-wien.ac.at/usa).

Figure 2.
Schematic of gas measurements at different elevations above and below the land surface (modified from Klusman [19]).
Figure 2.
Schematic of gas measurements at different elevations above and below the land surface (modified from Klusman [19]).

Figure 3.
Carbon dioxide seasonal flux measurements at the Control Site (modified from Klusman [11]).
Figure 3.
Carbon dioxide seasonal flux measurements at the Control Site (modified from Klusman [11]).
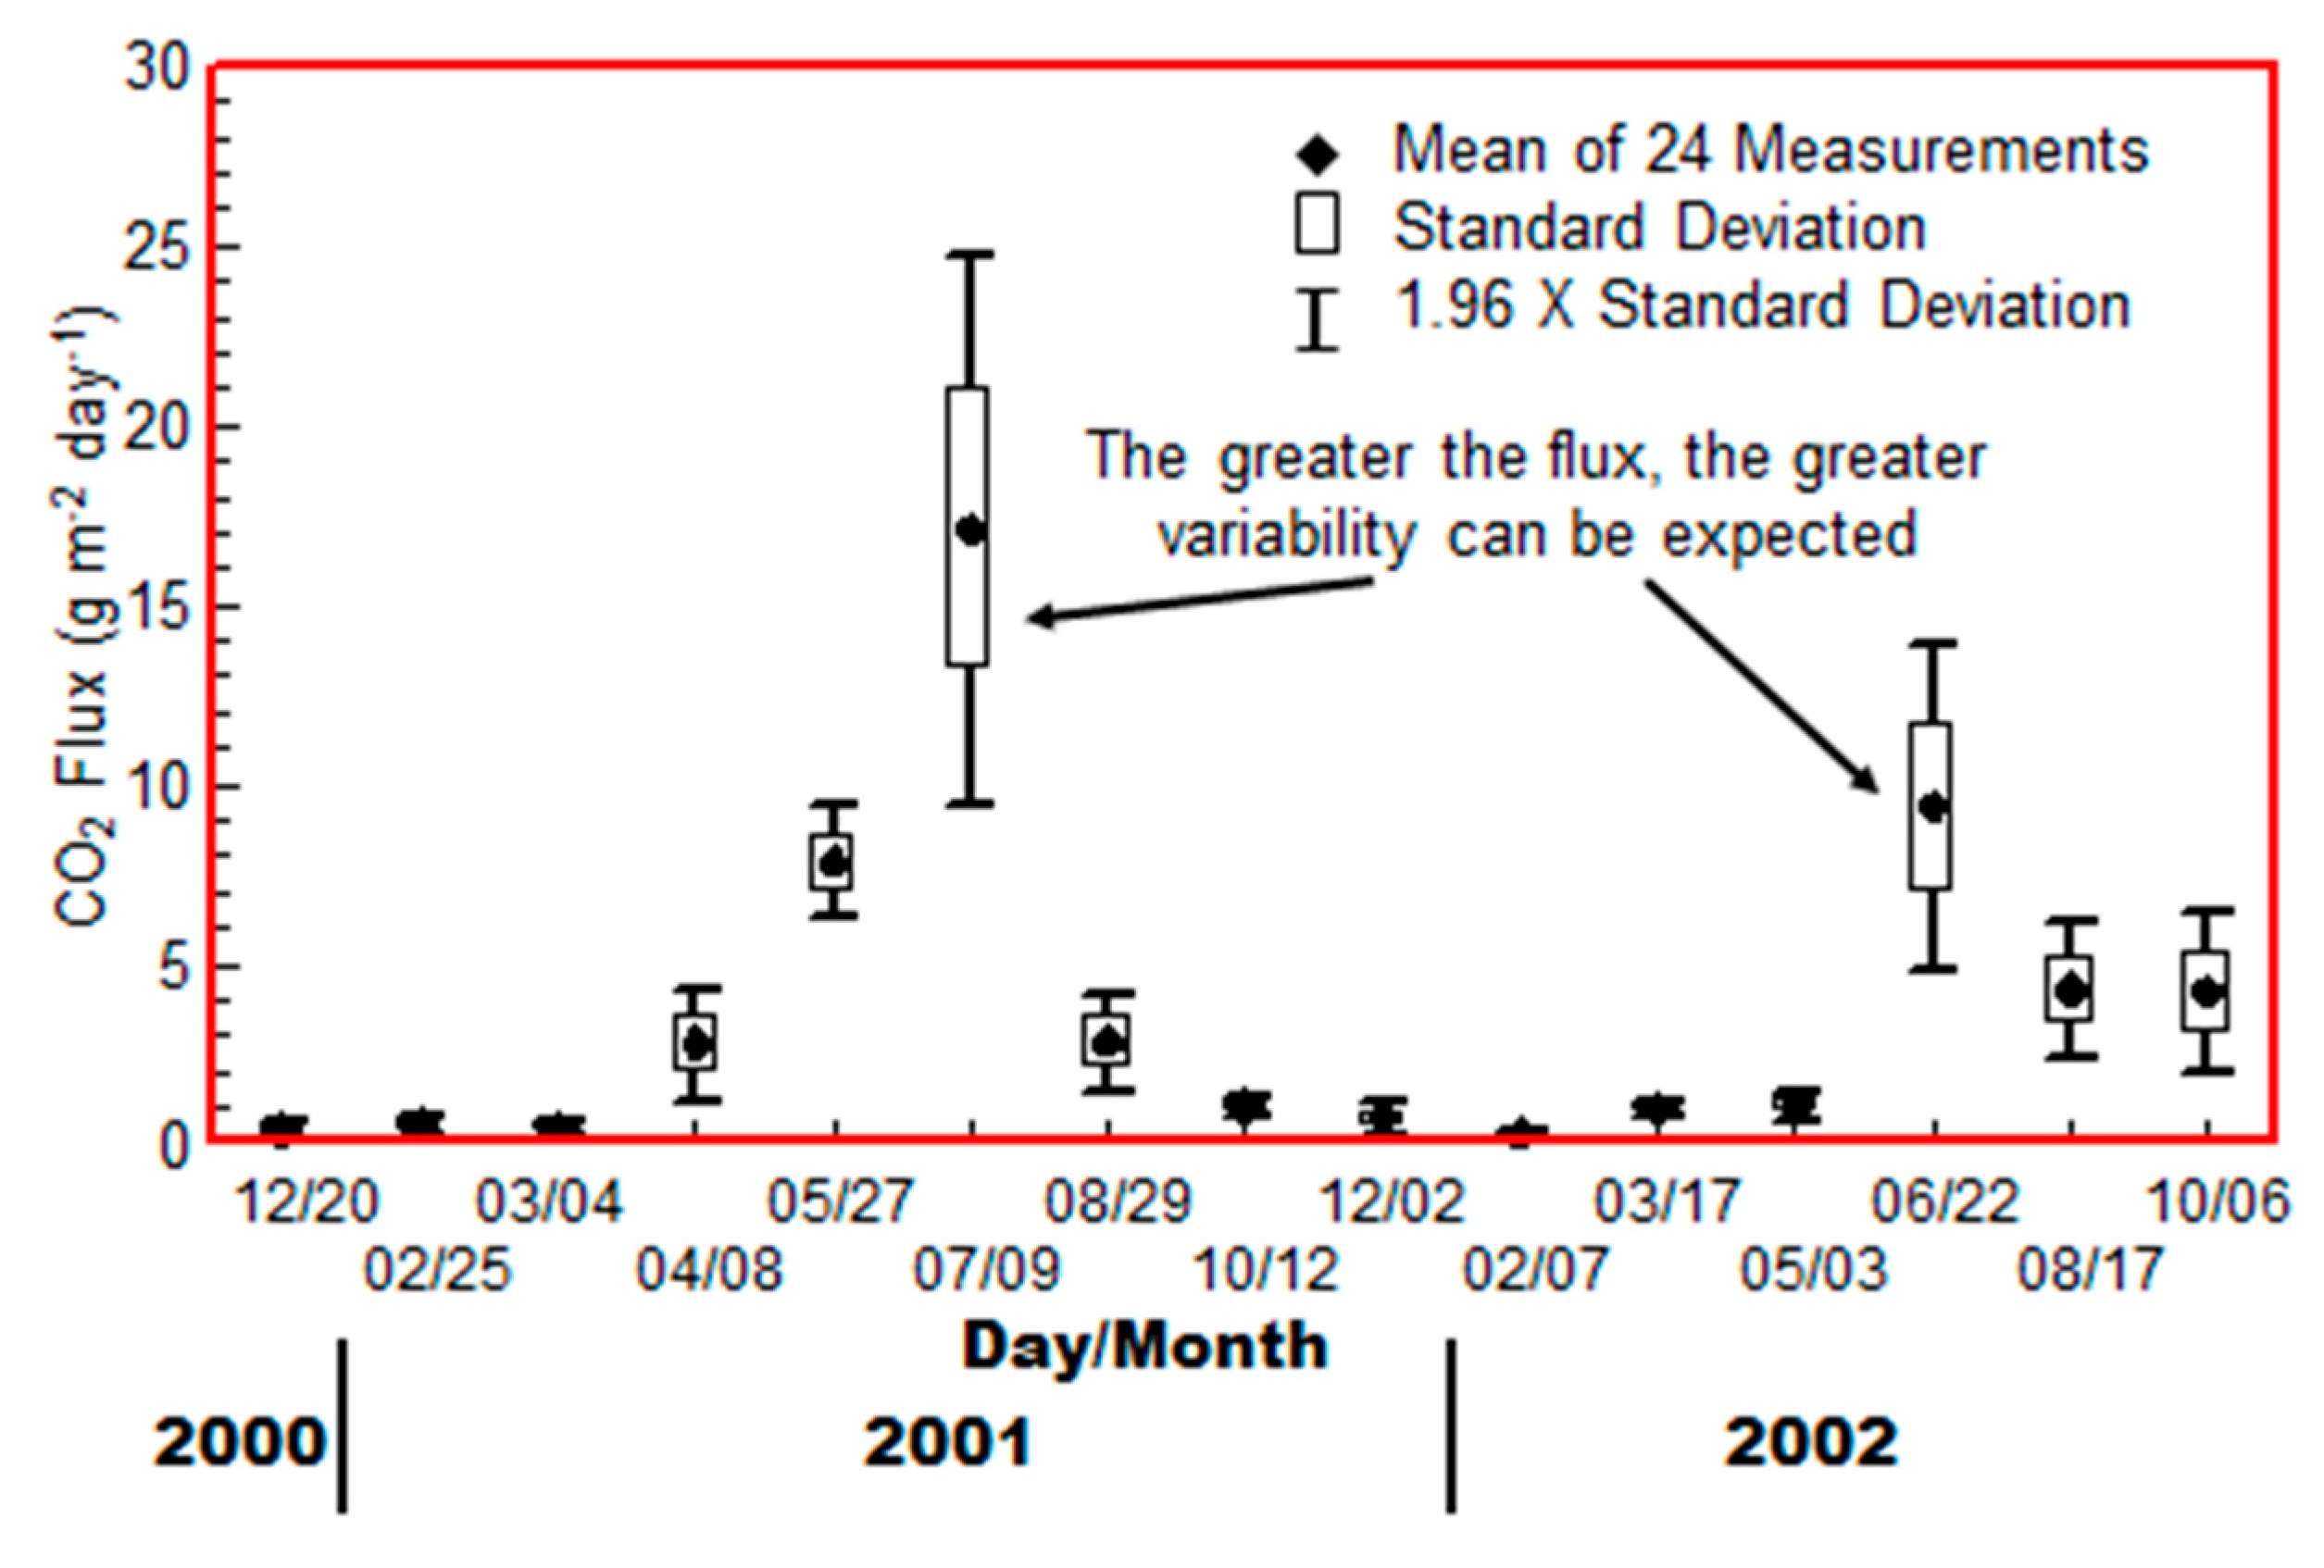
Figure 4.
Soil gas concentrations, (a) CO2 concentration (ppmv), (b) relative δ13C of CO2 compared to atmospheric δ13C, and CH4 concentration (ppmv) along the Mellen Hill Fault.
Figure 4.
Soil gas concentrations, (a) CO2 concentration (ppmv), (b) relative δ13C of CO2 compared to atmospheric δ13C, and CH4 concentration (ppmv) along the Mellen Hill Fault.

Figure 5.
Outline of the Naval Petroleum Reserve #3 (NPR#3) with gas flux locations. The symbols for locations 17 and 18 are mostly covered by the S2 fault trace.
Figure 5.
Outline of the Naval Petroleum Reserve #3 (NPR#3) with gas flux locations. The symbols for locations 17 and 18 are mostly covered by the S2 fault trace.
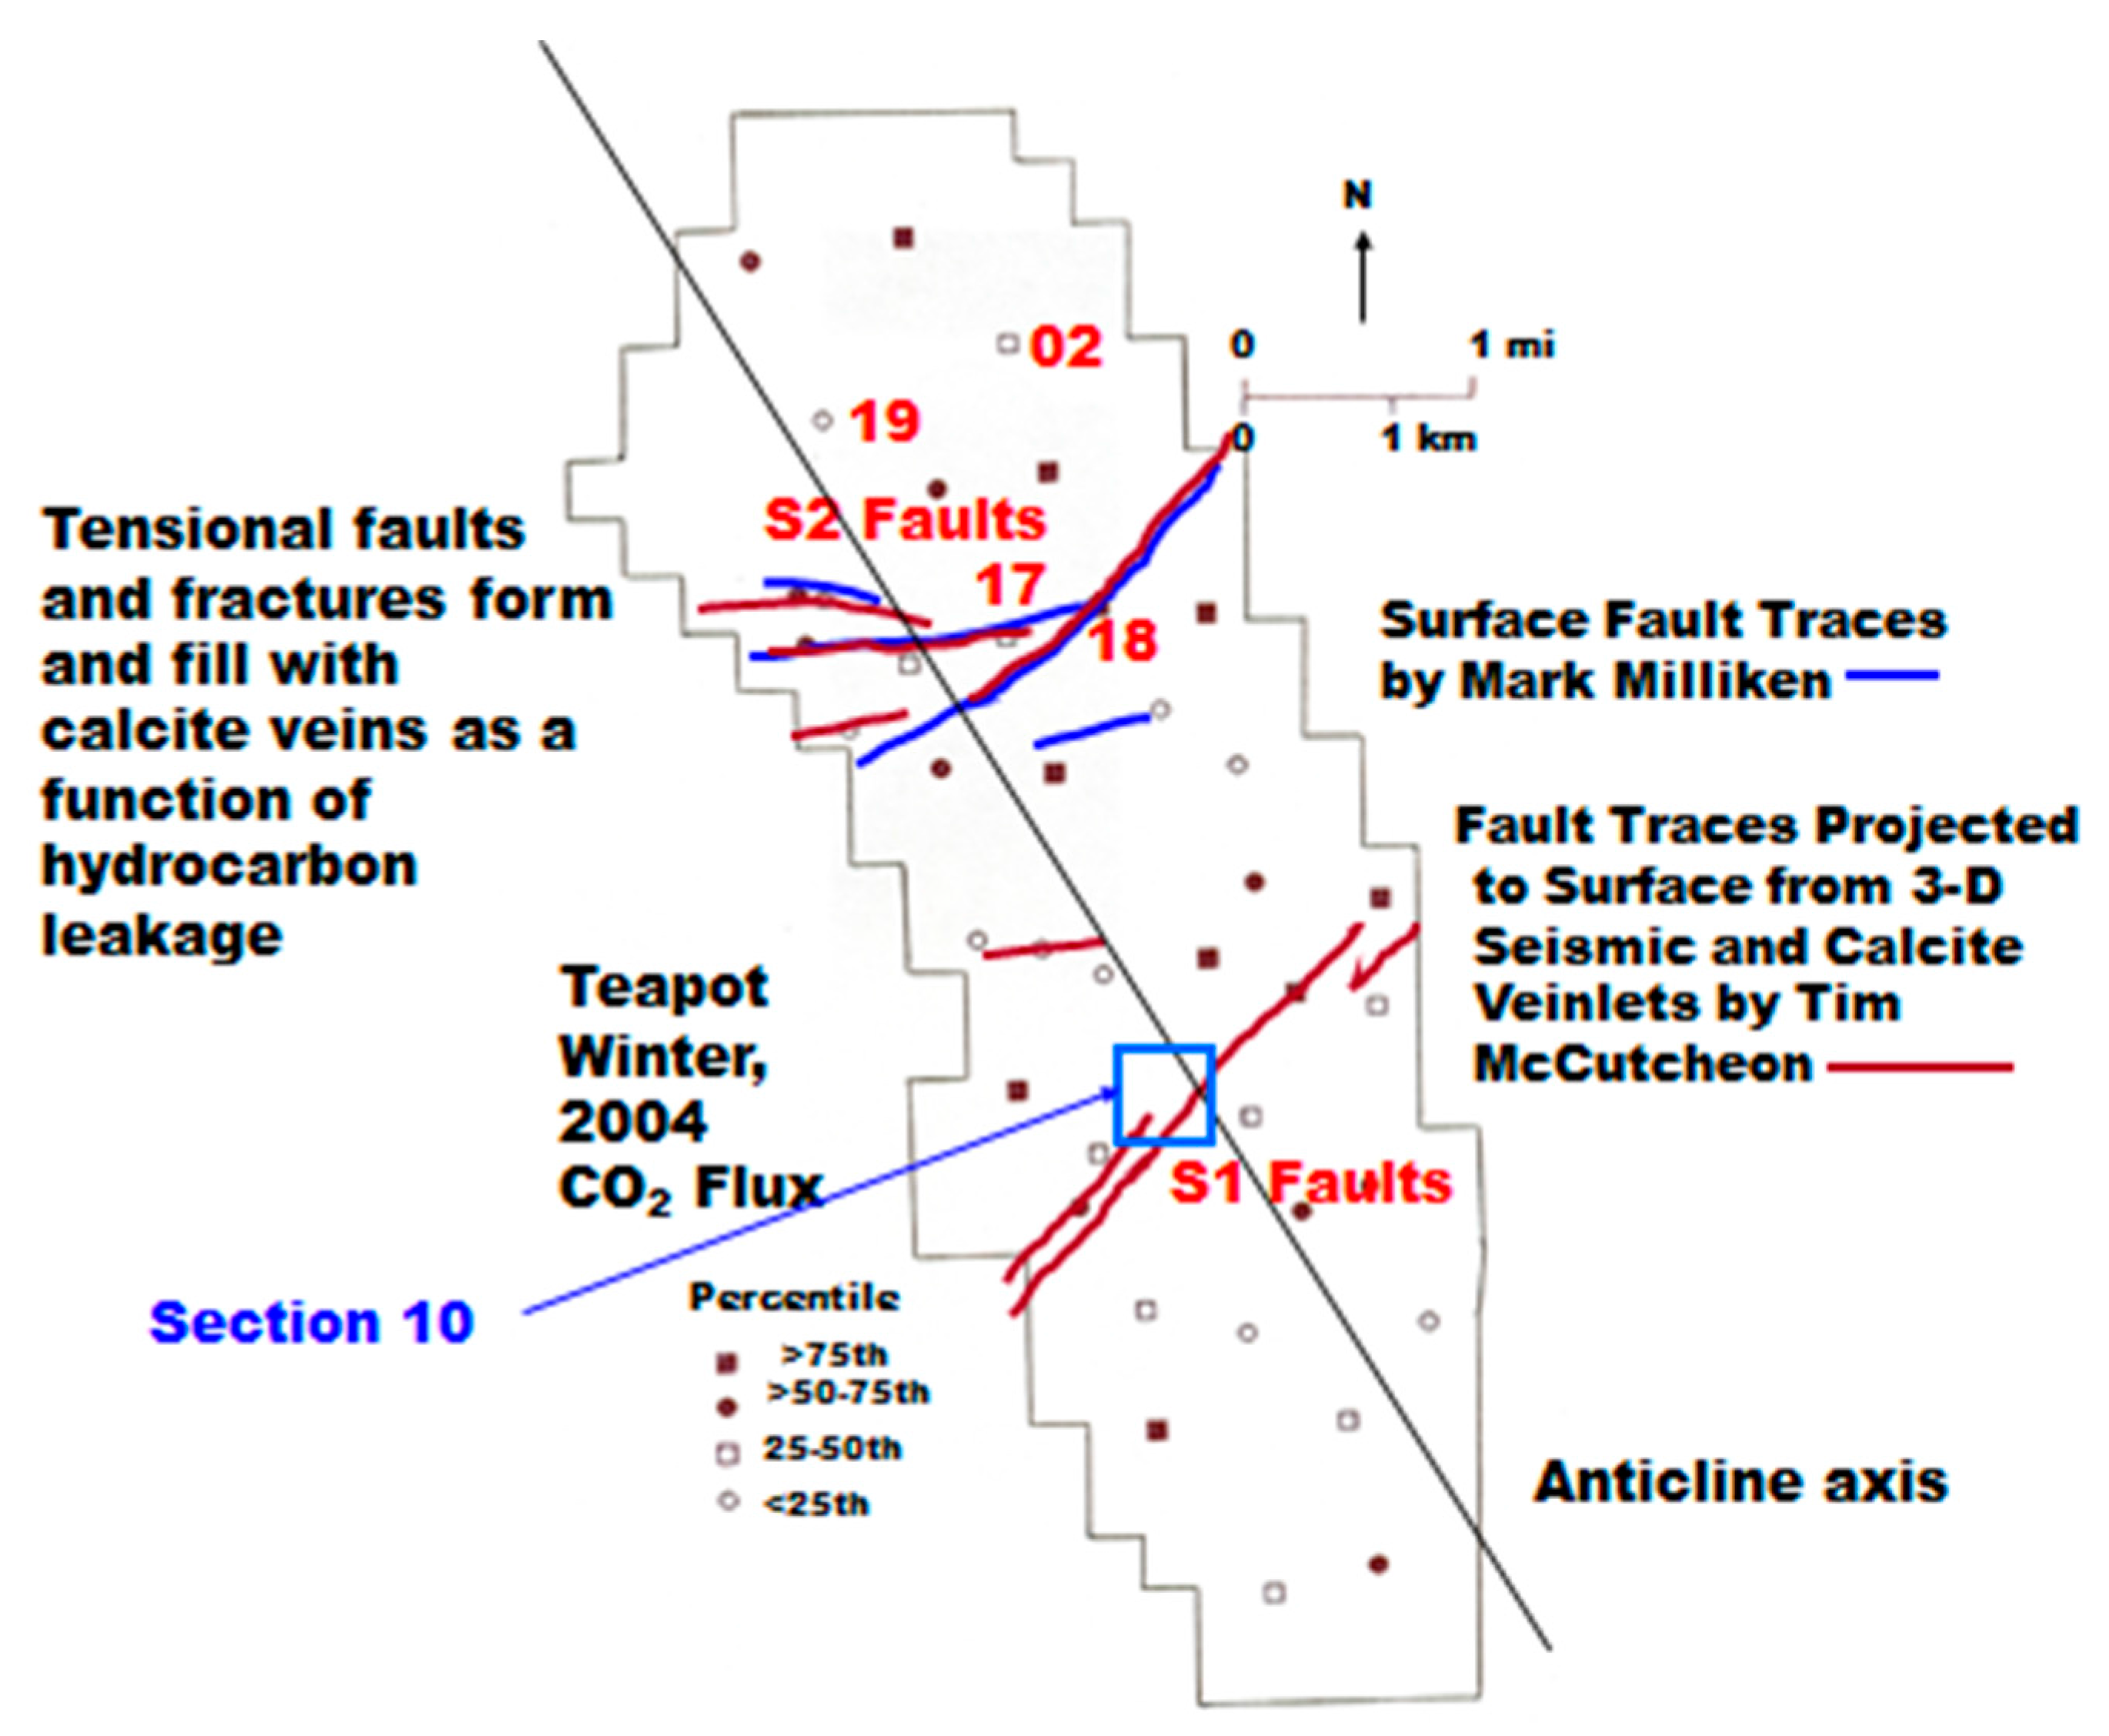
Figure 6.
δ13C of CH4 vs. ln(1/CH4) for 10-m holes at Teapot Dome (modified from Klusman [19]).
Figure 6.
δ13C of CH4 vs. ln(1/CH4) for 10-m holes at Teapot Dome (modified from Klusman [19]).

Figure 7.
Methane profile for combined background locations and Locations 17 and 18 on Fault Zone 2. See Figure 5 for the locations.
Figure 7.
Methane profile for combined background locations and Locations 17 and 18 on Fault Zone 2. See Figure 5 for the locations.
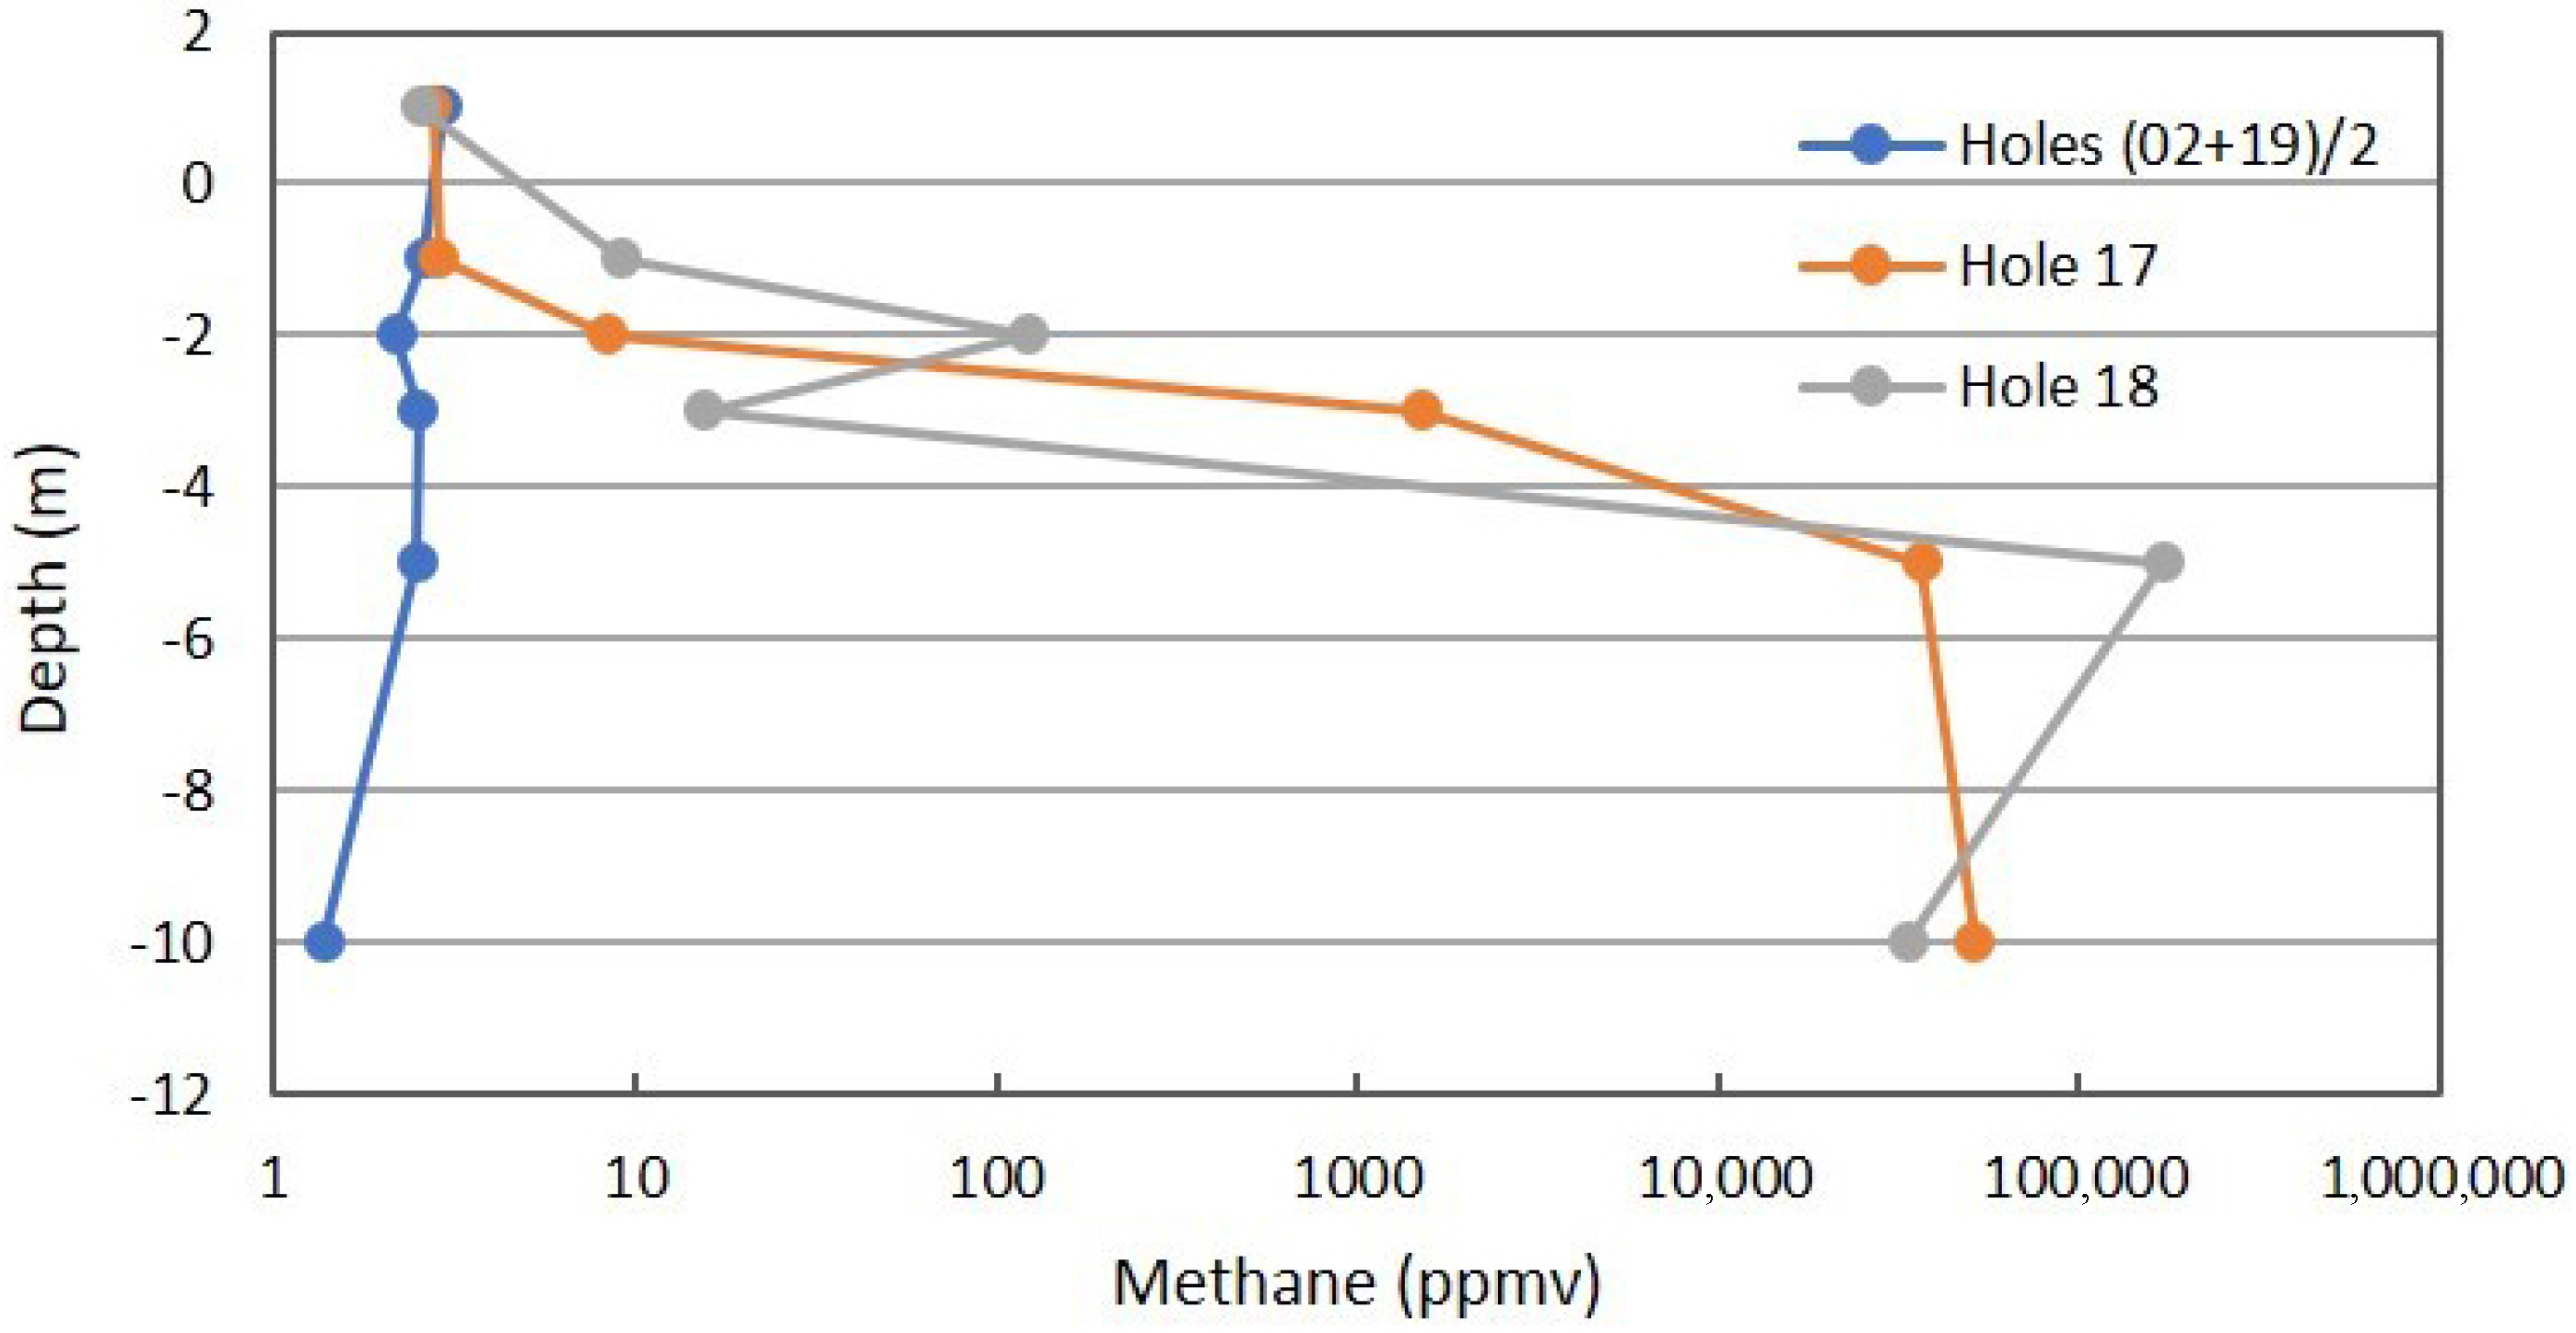
Figure 8.
C2+ profile in combined background locations and Locations 17 and 18 on Fault Zone 2. See Figure 5 for the locations.
Figure 8.
C2+ profile in combined background locations and Locations 17 and 18 on Fault Zone 2. See Figure 5 for the locations.

Figure 9.
Carbon dioxide profile in combined background locations and Locations 17 and 18 in Fault Zone 2. See Figure 5 for the locations.
Figure 9.
Carbon dioxide profile in combined background locations and Locations 17 and 18 in Fault Zone 2. See Figure 5 for the locations.
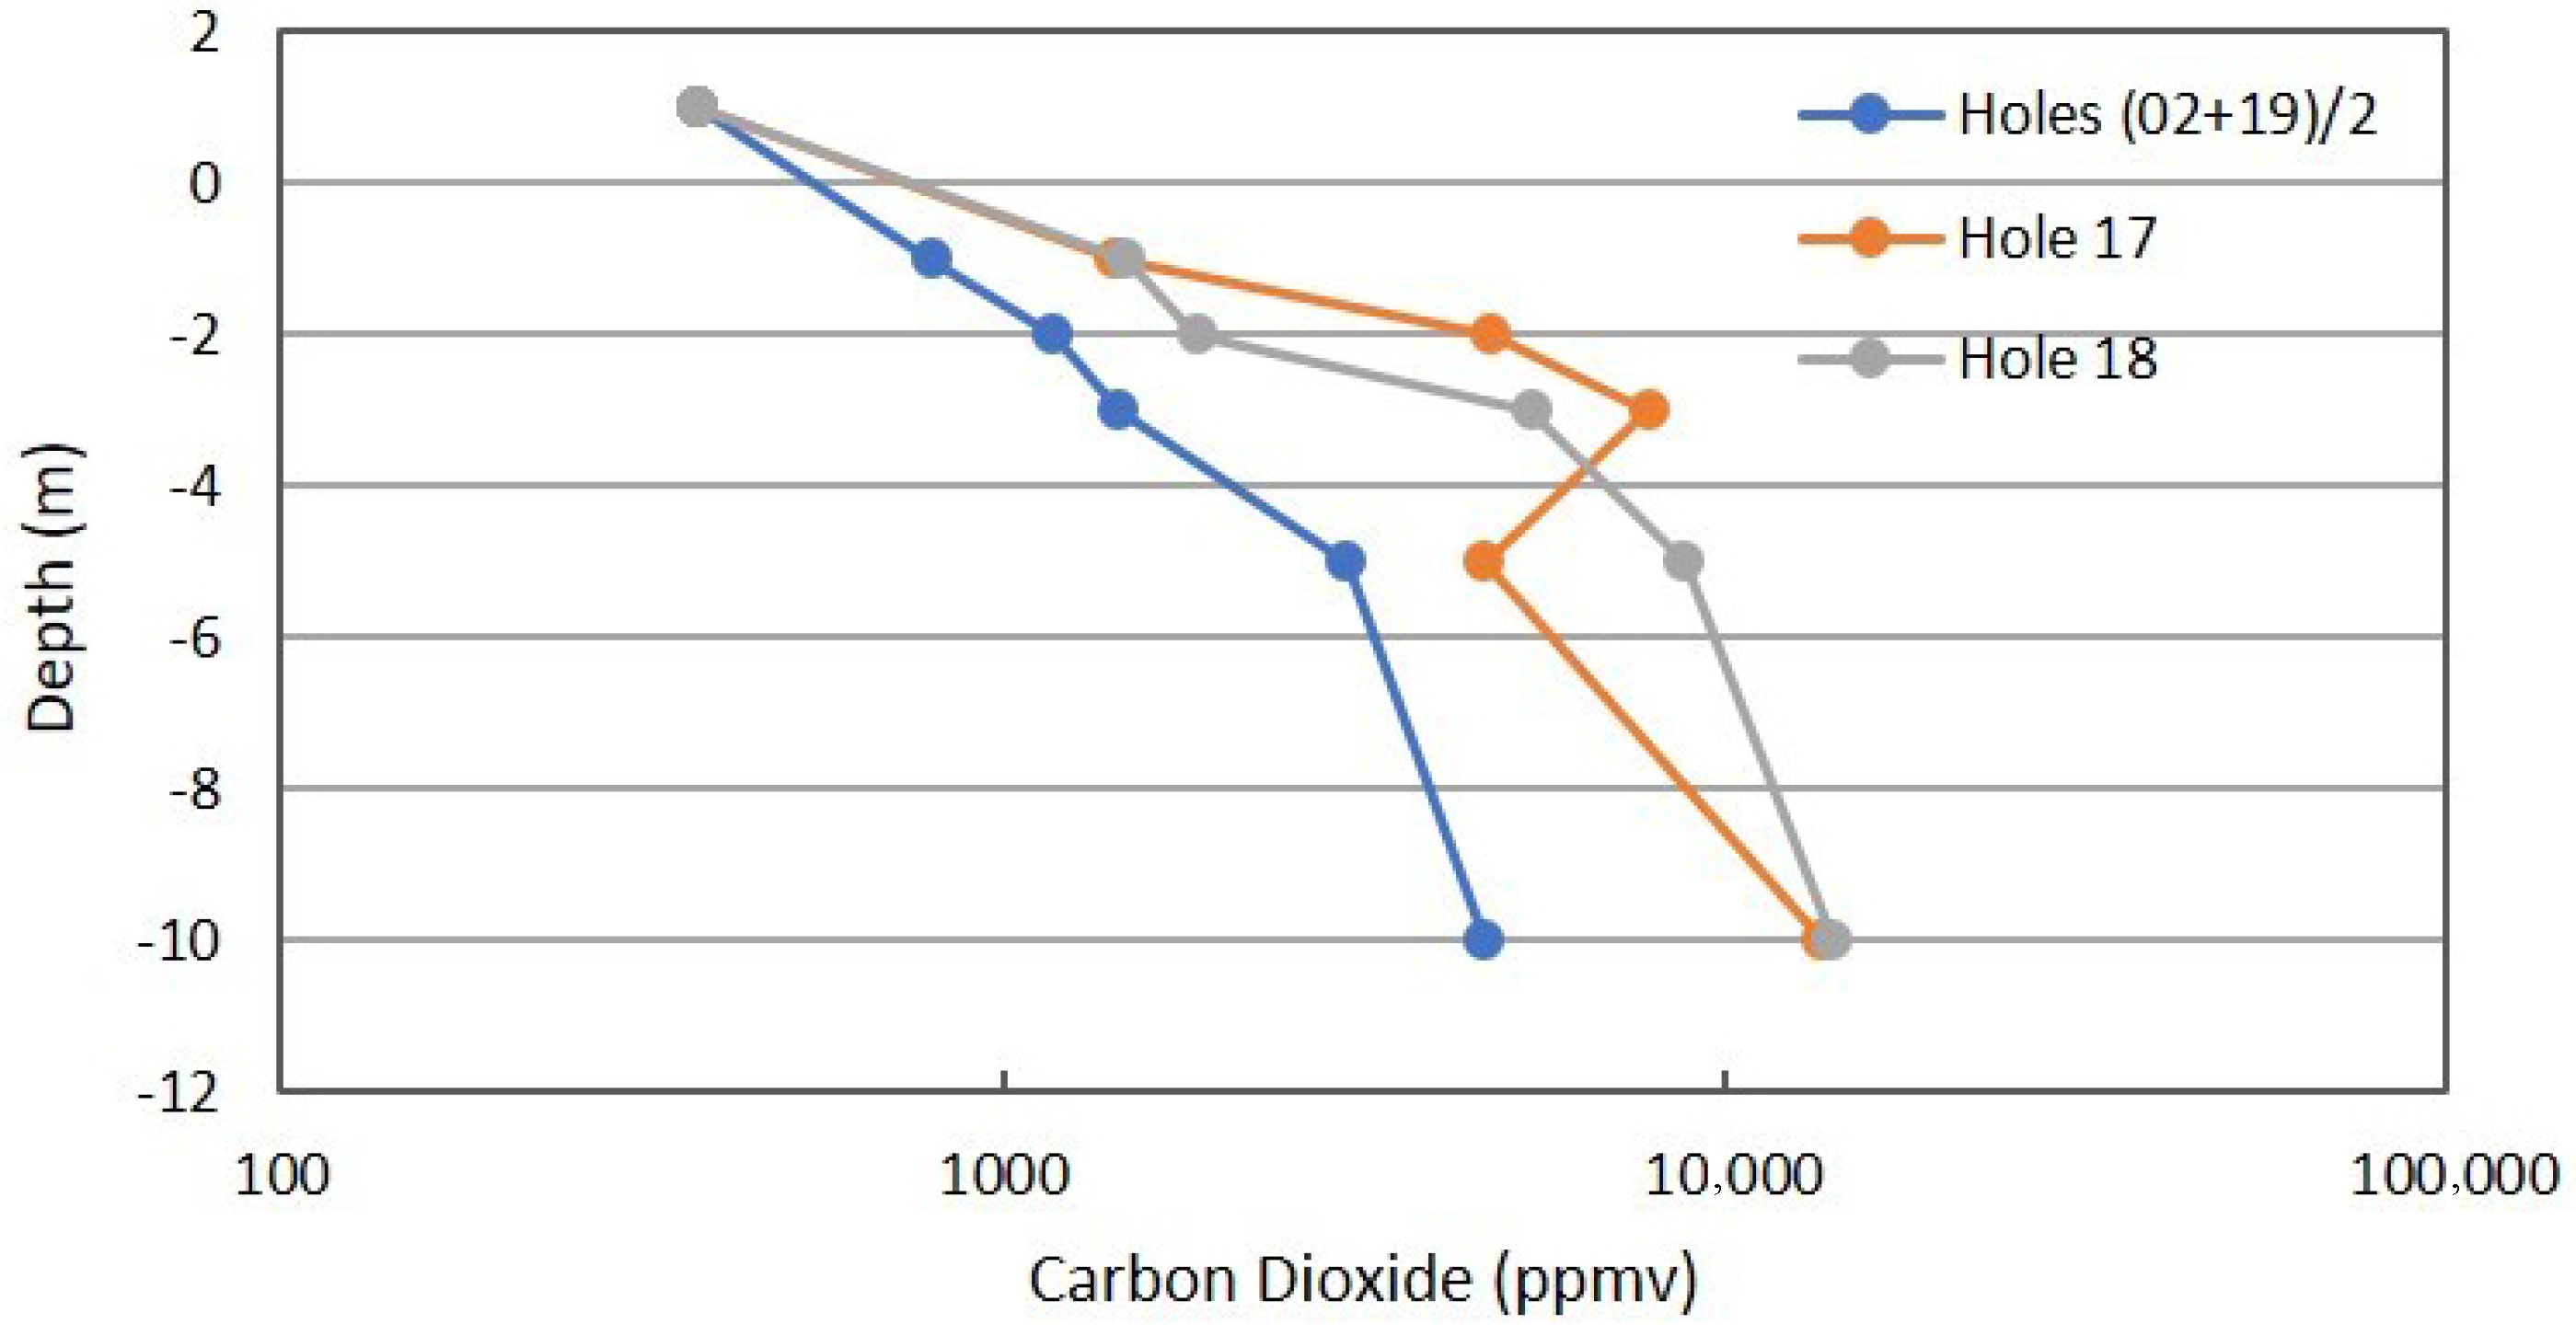
Figure 10.
δ13C profile for CH4 in combined background locations and Locations 17 and 18 on Fault Zone 2. See Figure 5 for the locations.
Figure 10.
δ13C profile for CH4 in combined background locations and Locations 17 and 18 on Fault Zone 2. See Figure 5 for the locations.

Figure 11.
δ13C profile for CO2 in combined background locations and Locations 17 and 18 in Fault Zone 2. See Figure 5 for the locations.
Figure 11.
δ13C profile for CO2 in combined background locations and Locations 17 and 18 in Fault Zone 2. See Figure 5 for the locations.
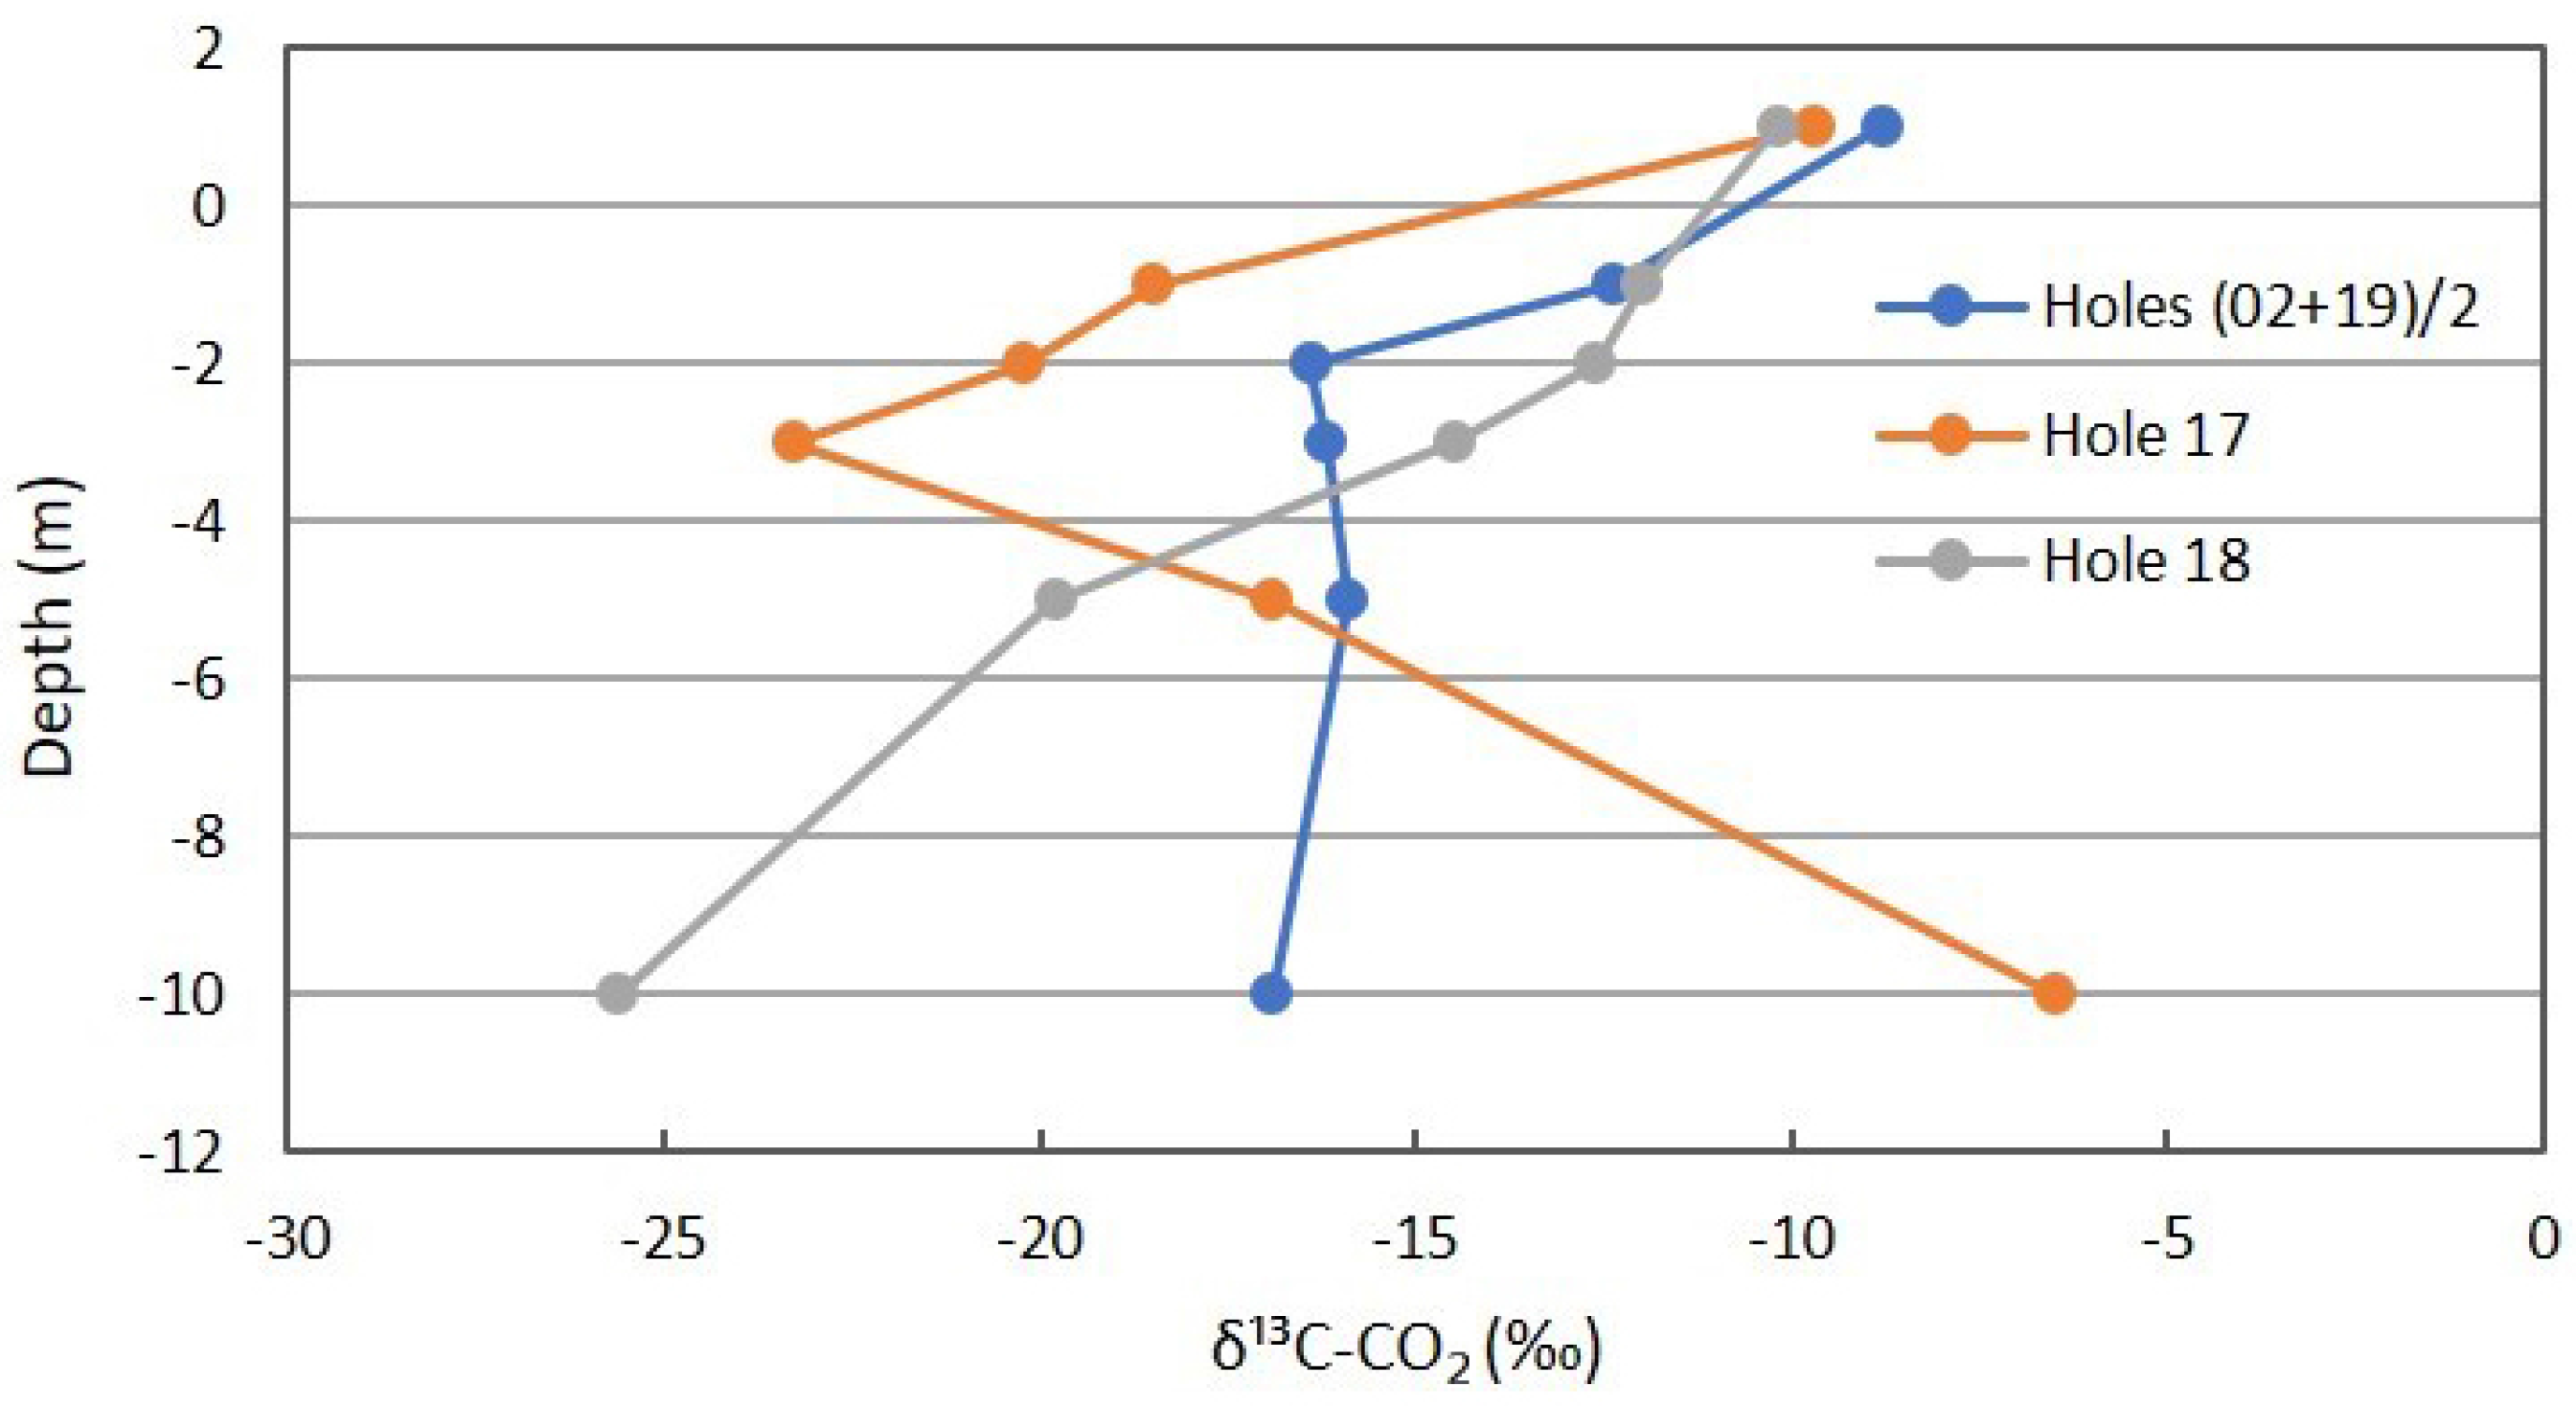
Figure 12.
Oxygen+Ar profile for combined background locations and Locations 17 and 18 in Fault Zone 2. See Figure 5 for the locations.
Figure 12.
Oxygen+Ar profile for combined background locations and Locations 17 and 18 in Fault Zone 2. See Figure 5 for the locations.
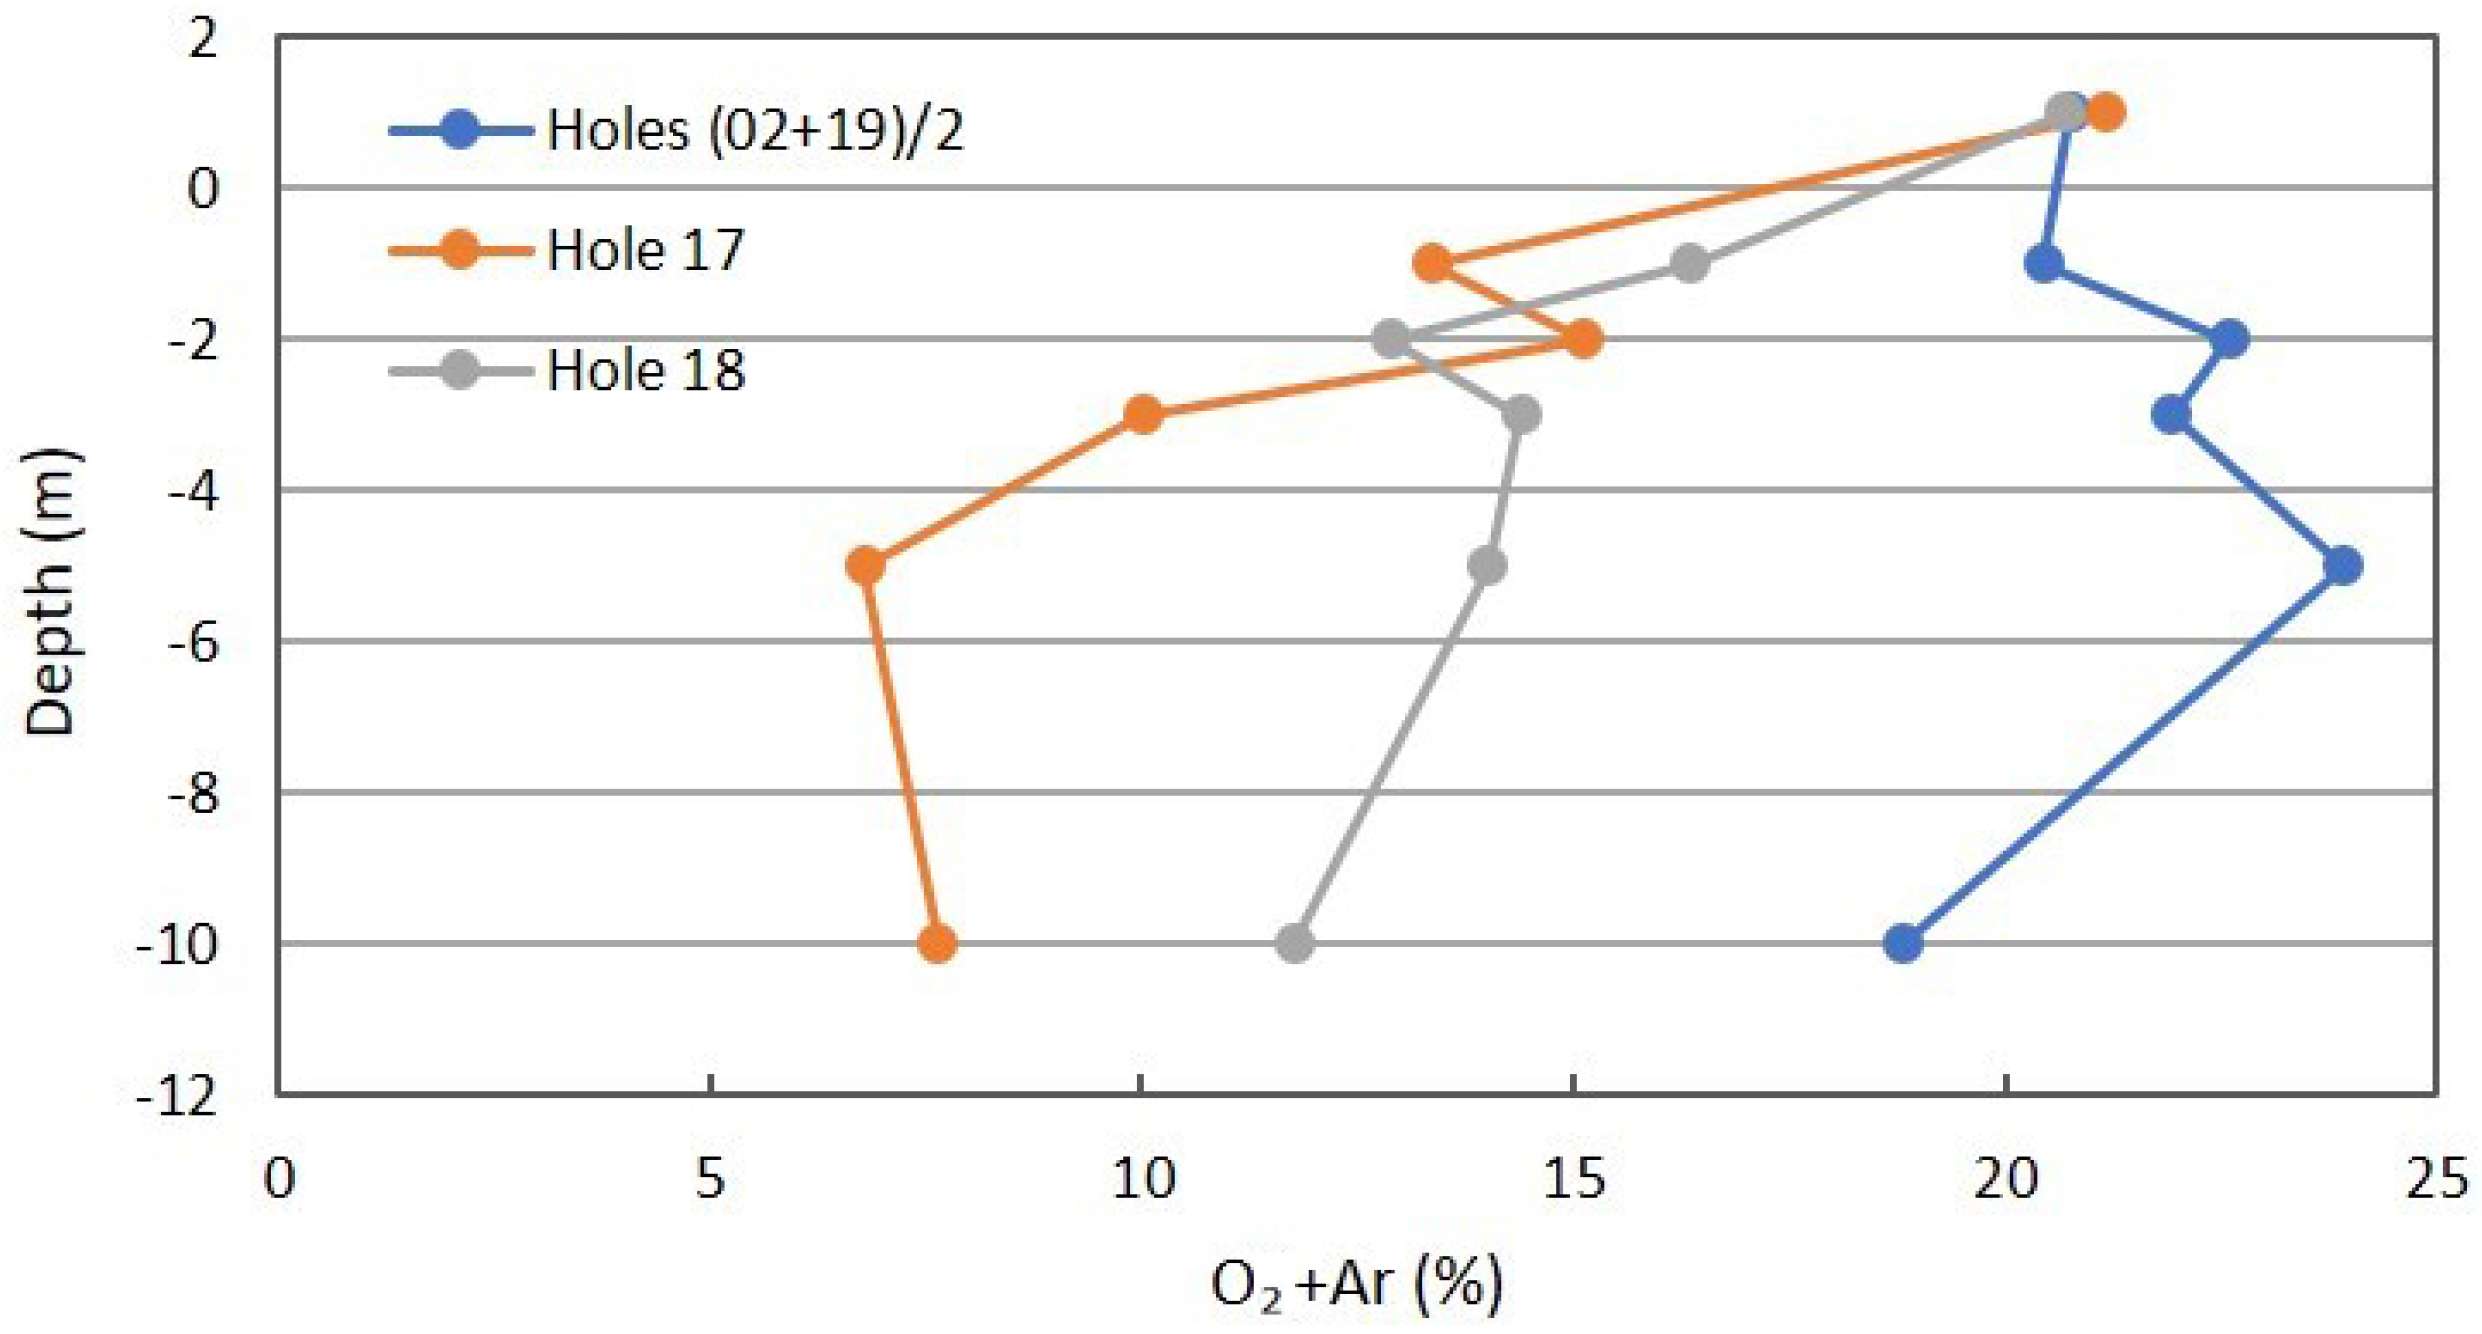
Figure 13.
Radiocarbon profile for combined background locations and Locations 17 and 18 in Fault Zone 2. See Figure 5 for the locations.
Figure 13.
Radiocarbon profile for combined background locations and Locations 17 and 18 in Fault Zone 2. See Figure 5 for the locations.

Figure 14.
Helium (a) and 3He/4He (b) for combined background locations and Locations 17 and 18 in Fault Zone 2. See Figure 5 for the locations.
Figure 14.
Helium (a) and 3He/4He (b) for combined background locations and Locations 17 and 18 in Fault Zone 2. See Figure 5 for the locations.
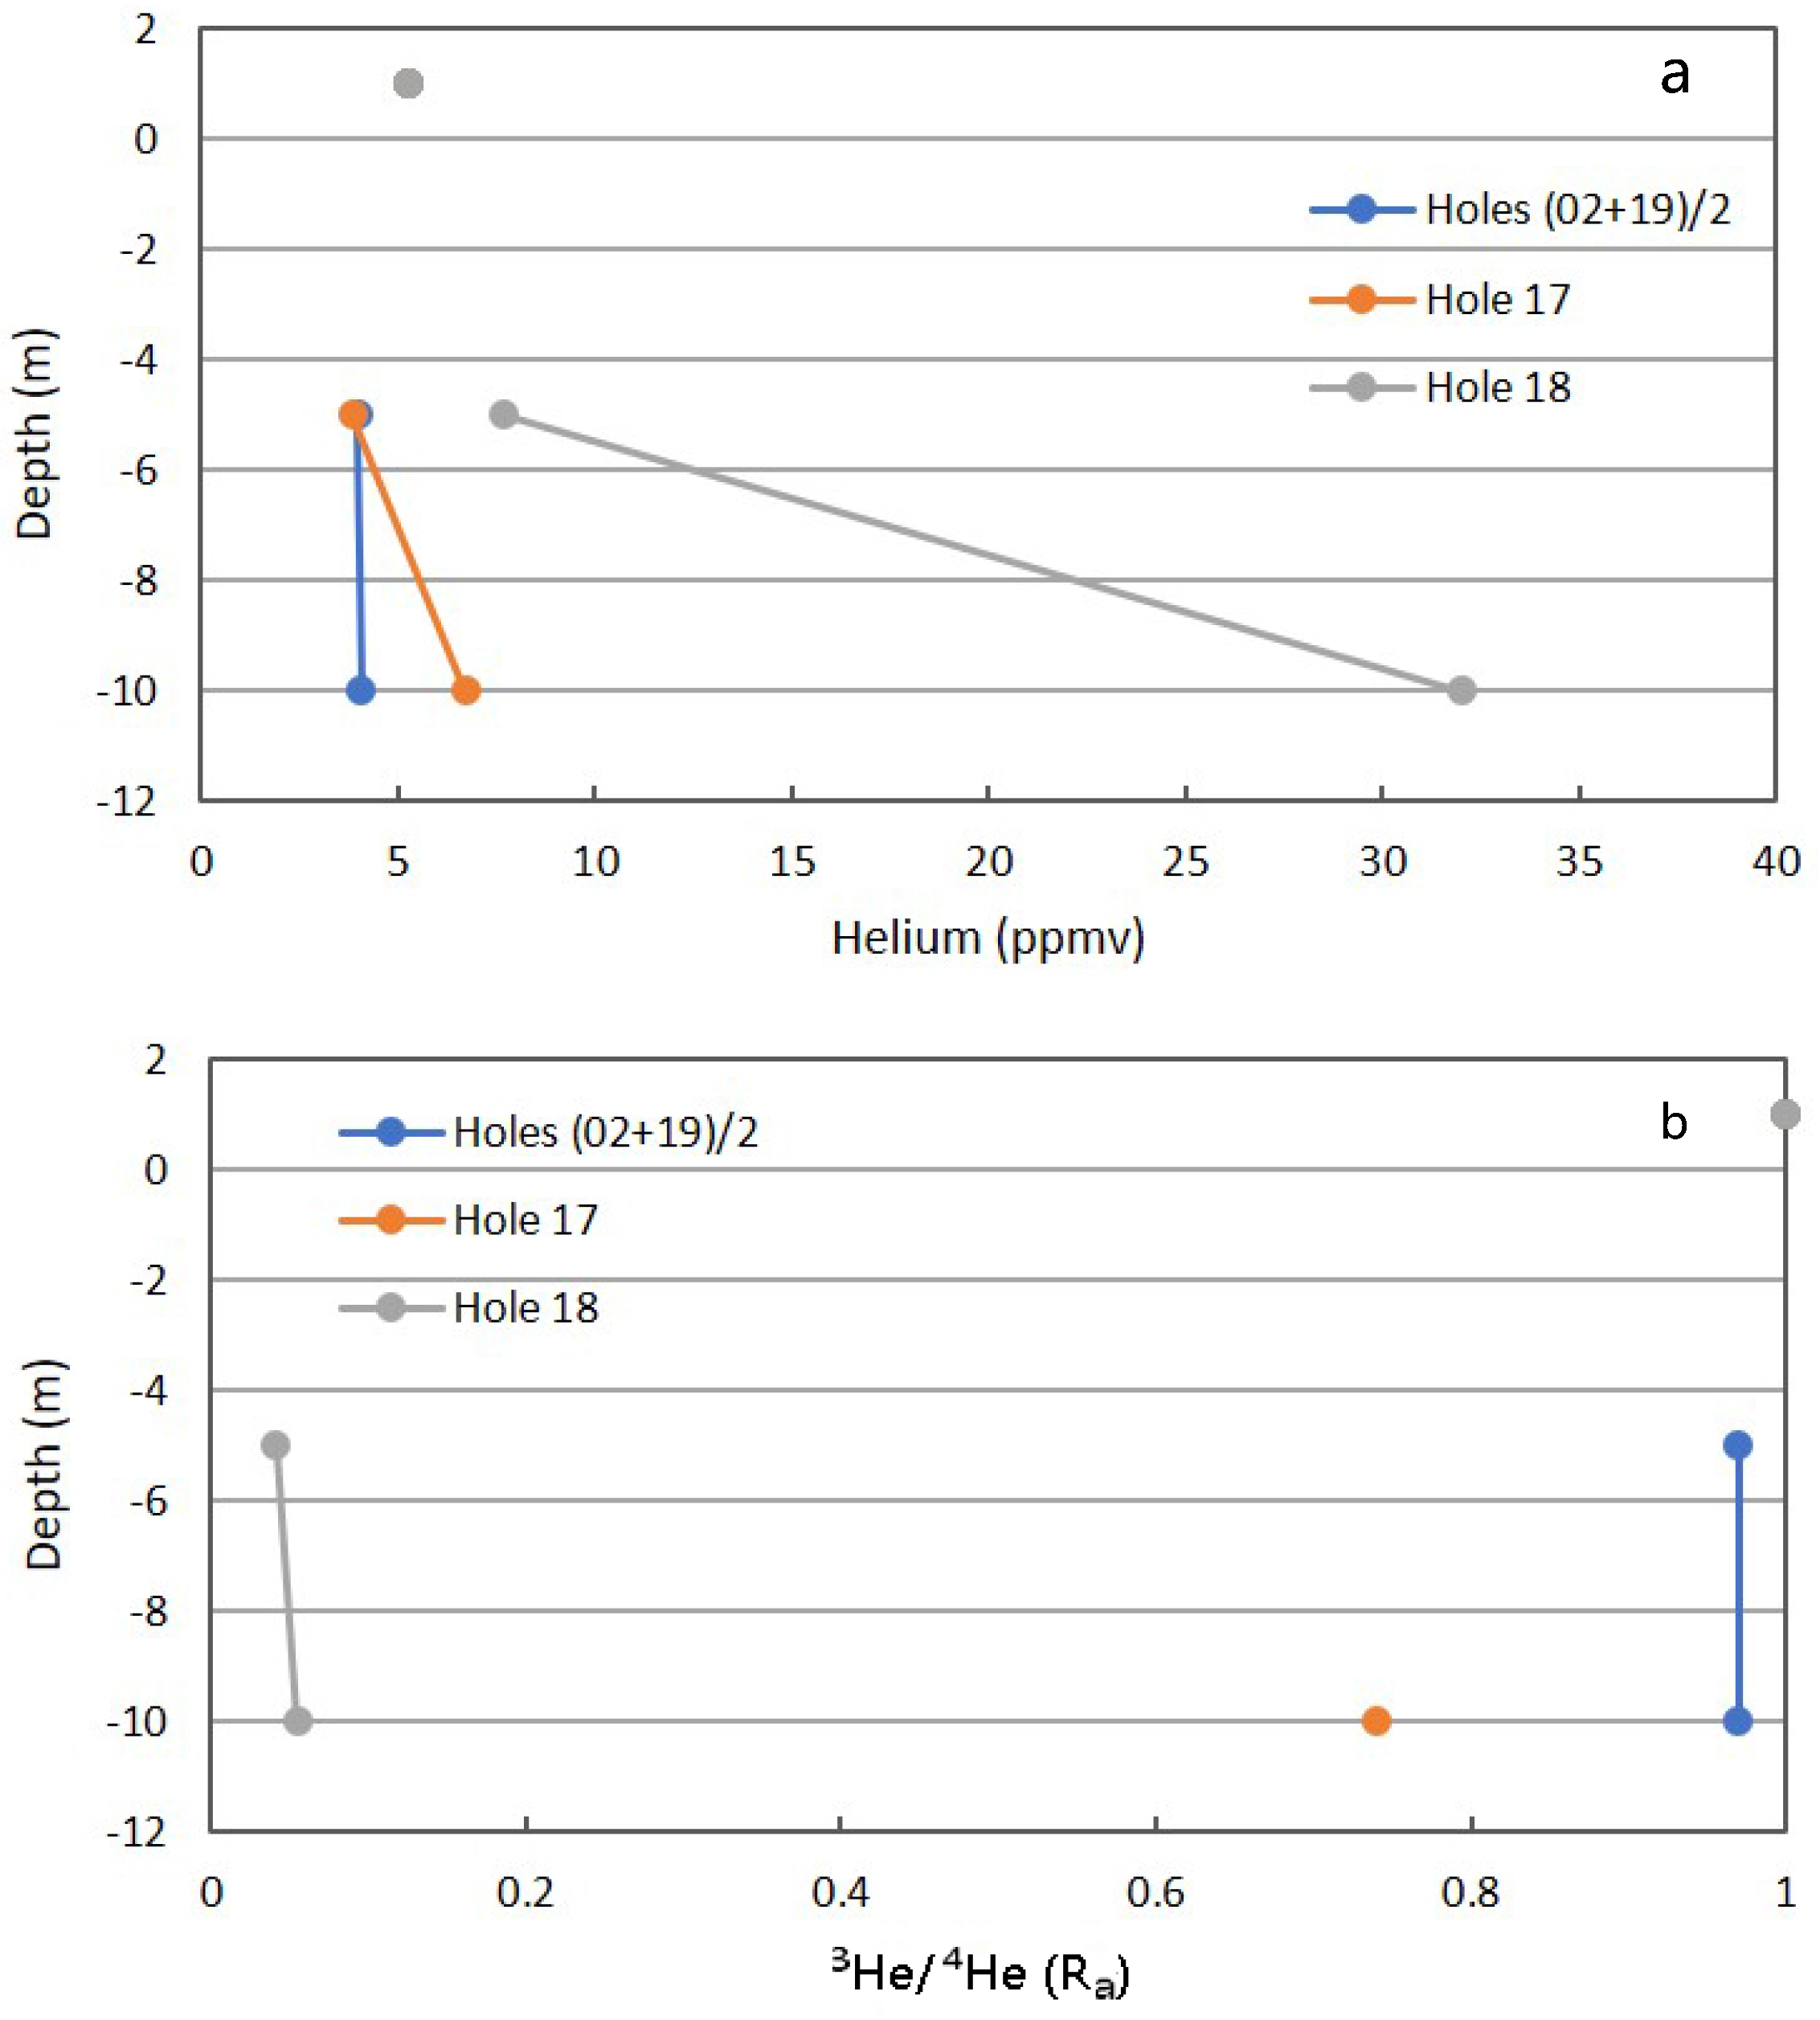
Figure 15.
Methane gradient (a) and ethane detection (b) in a focused study in Section 10 and Fault Zone 1.
Figure 15.
Methane gradient (a) and ethane detection (b) in a focused study in Section 10 and Fault Zone 1.

Figure 16.
Schematic of seasonal gas seepage processes operating at Weyburn and Rangely and qualitative soil temperature gradients, (a) summer; (b) winter.
Figure 16.
Schematic of seasonal gas seepage processes operating at Weyburn and Rangely and qualitative soil temperature gradients, (a) summer; (b) winter.
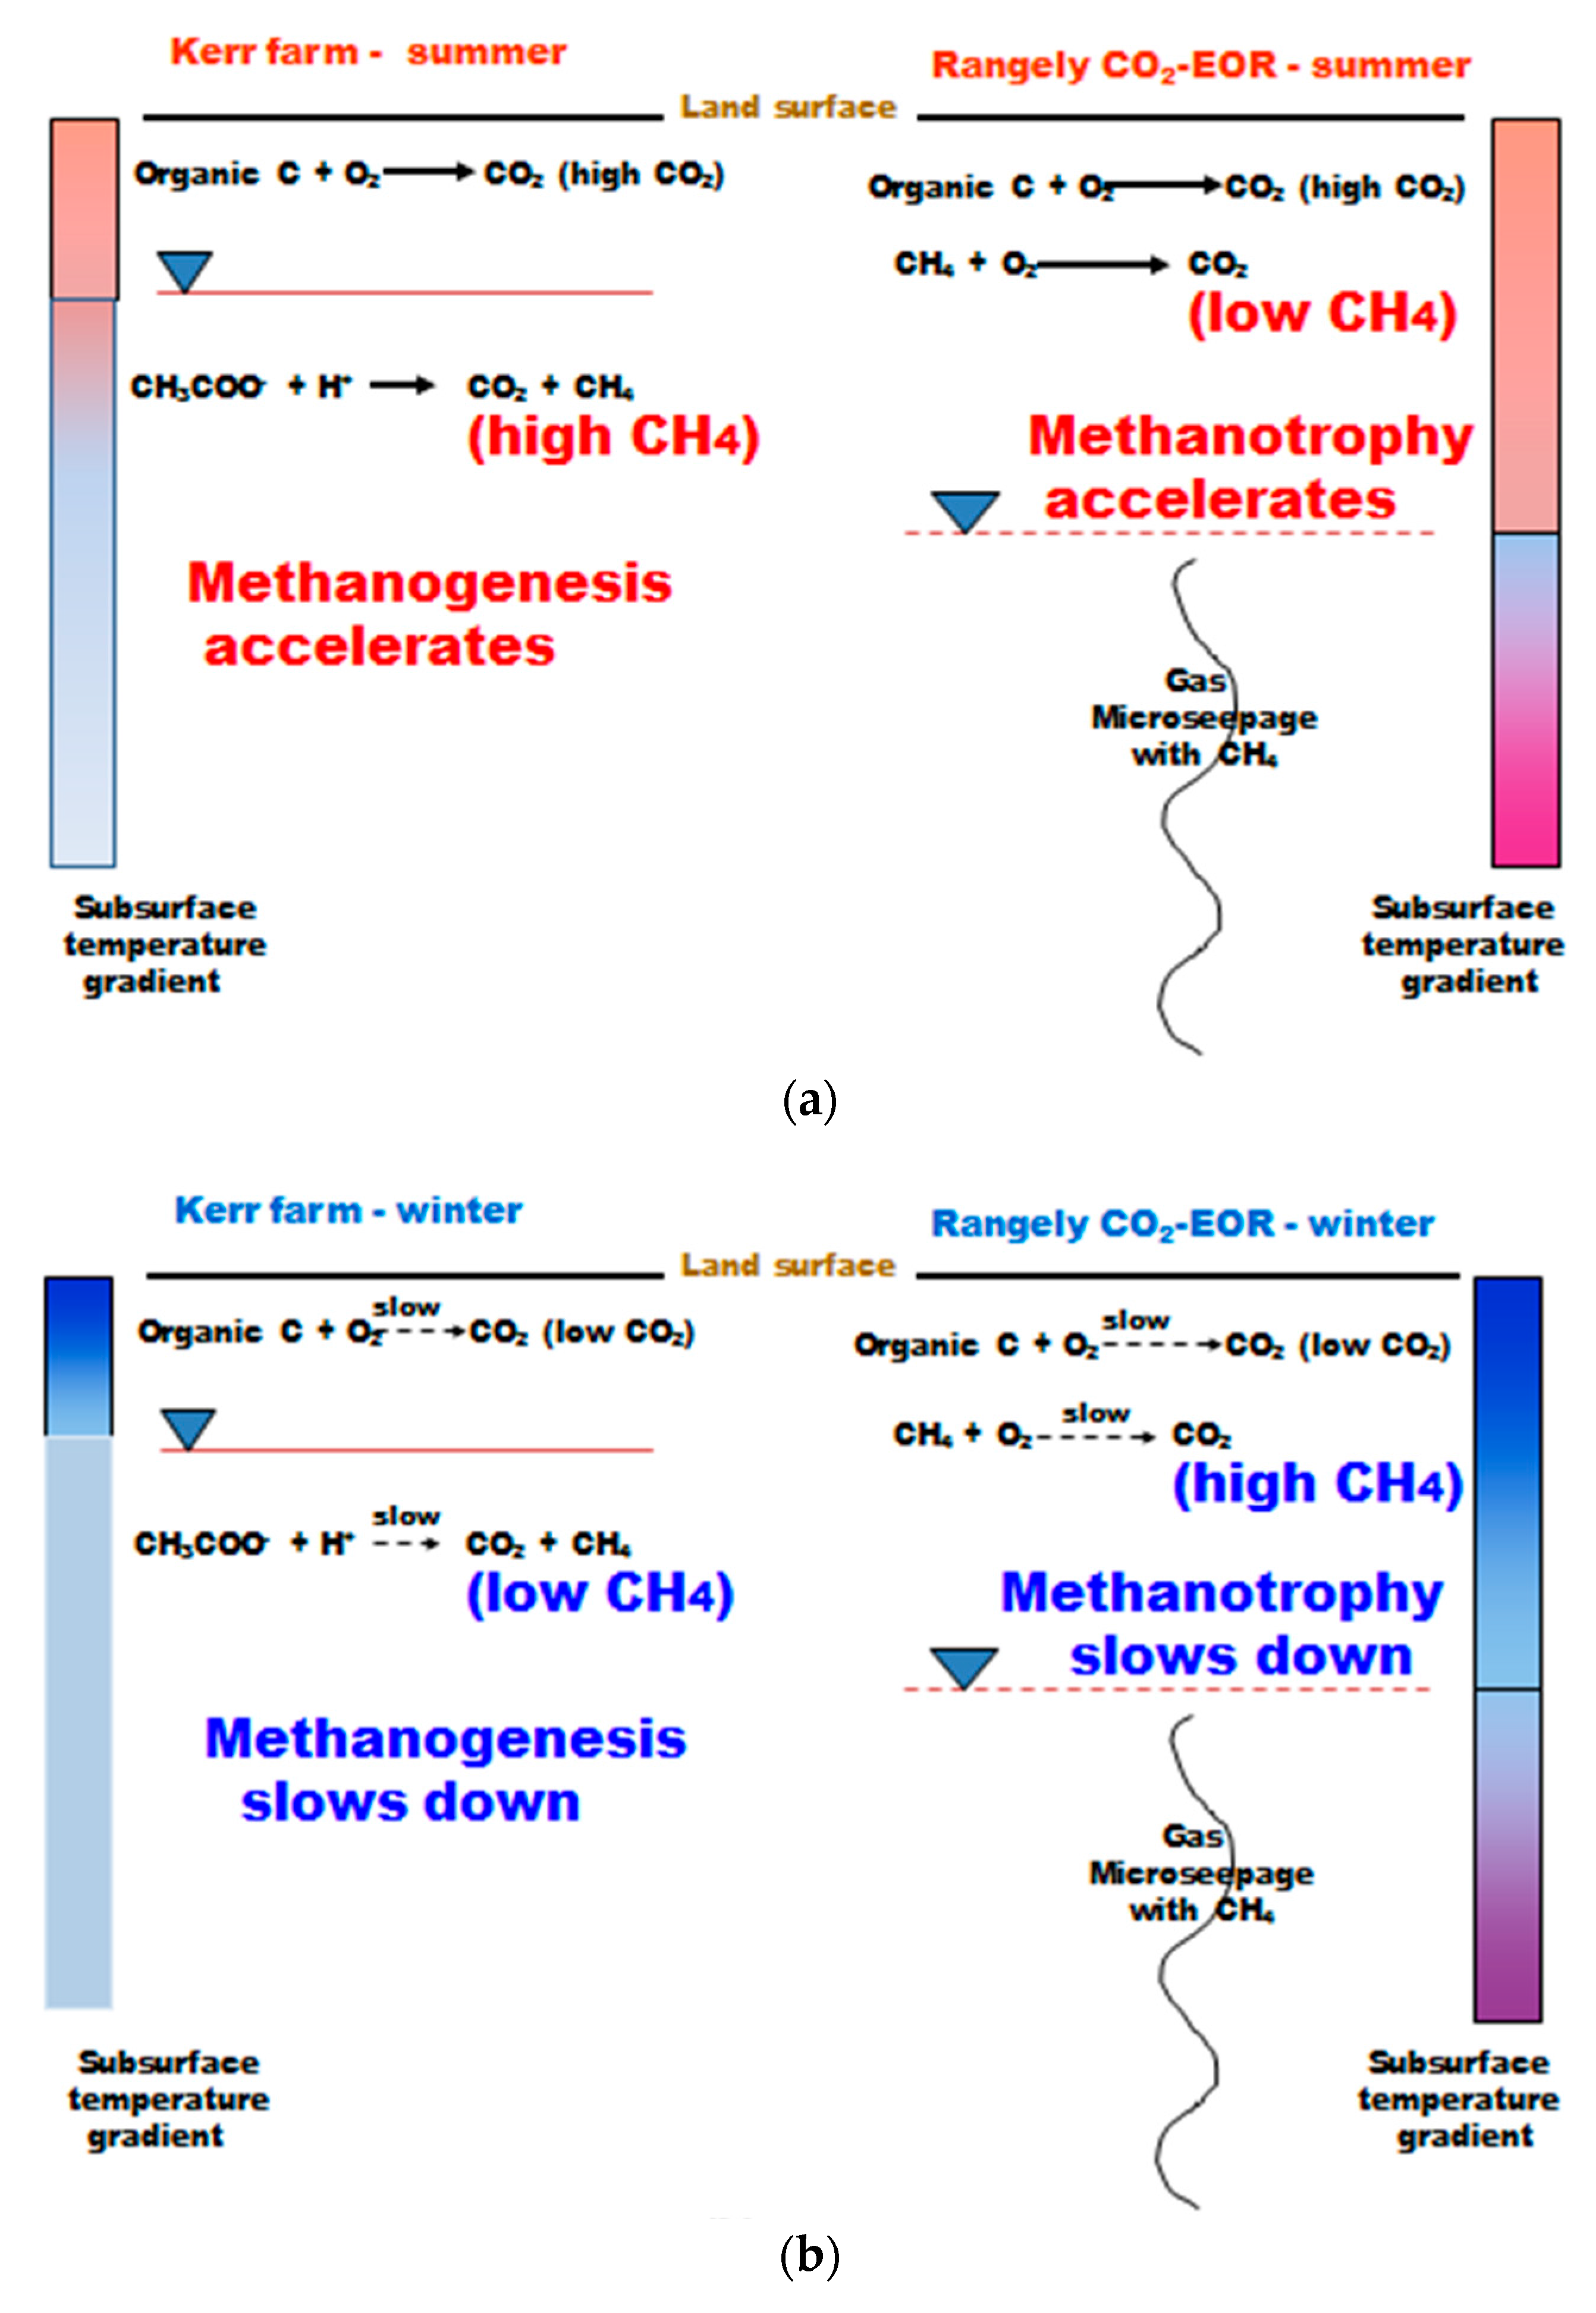
Figure 17.
Carbon dioxide and methane flux levels observed in a selection of studies (summer data in red; winter data in blue; vertical axes not to scale).
Figure 17.
Carbon dioxide and methane flux levels observed in a selection of studies (summer data in red; winter data in blue; vertical axes not to scale).


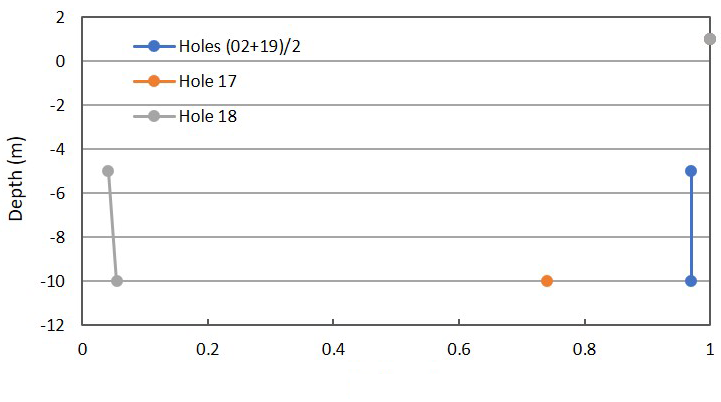
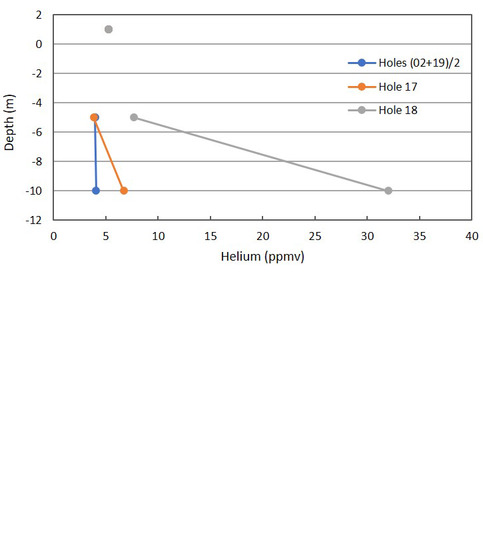
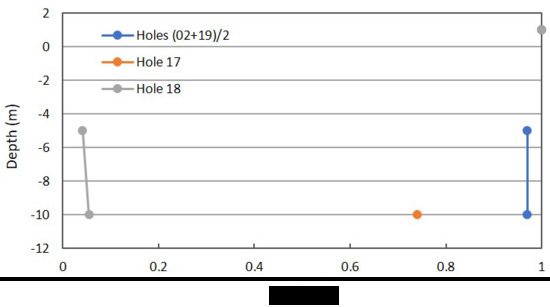
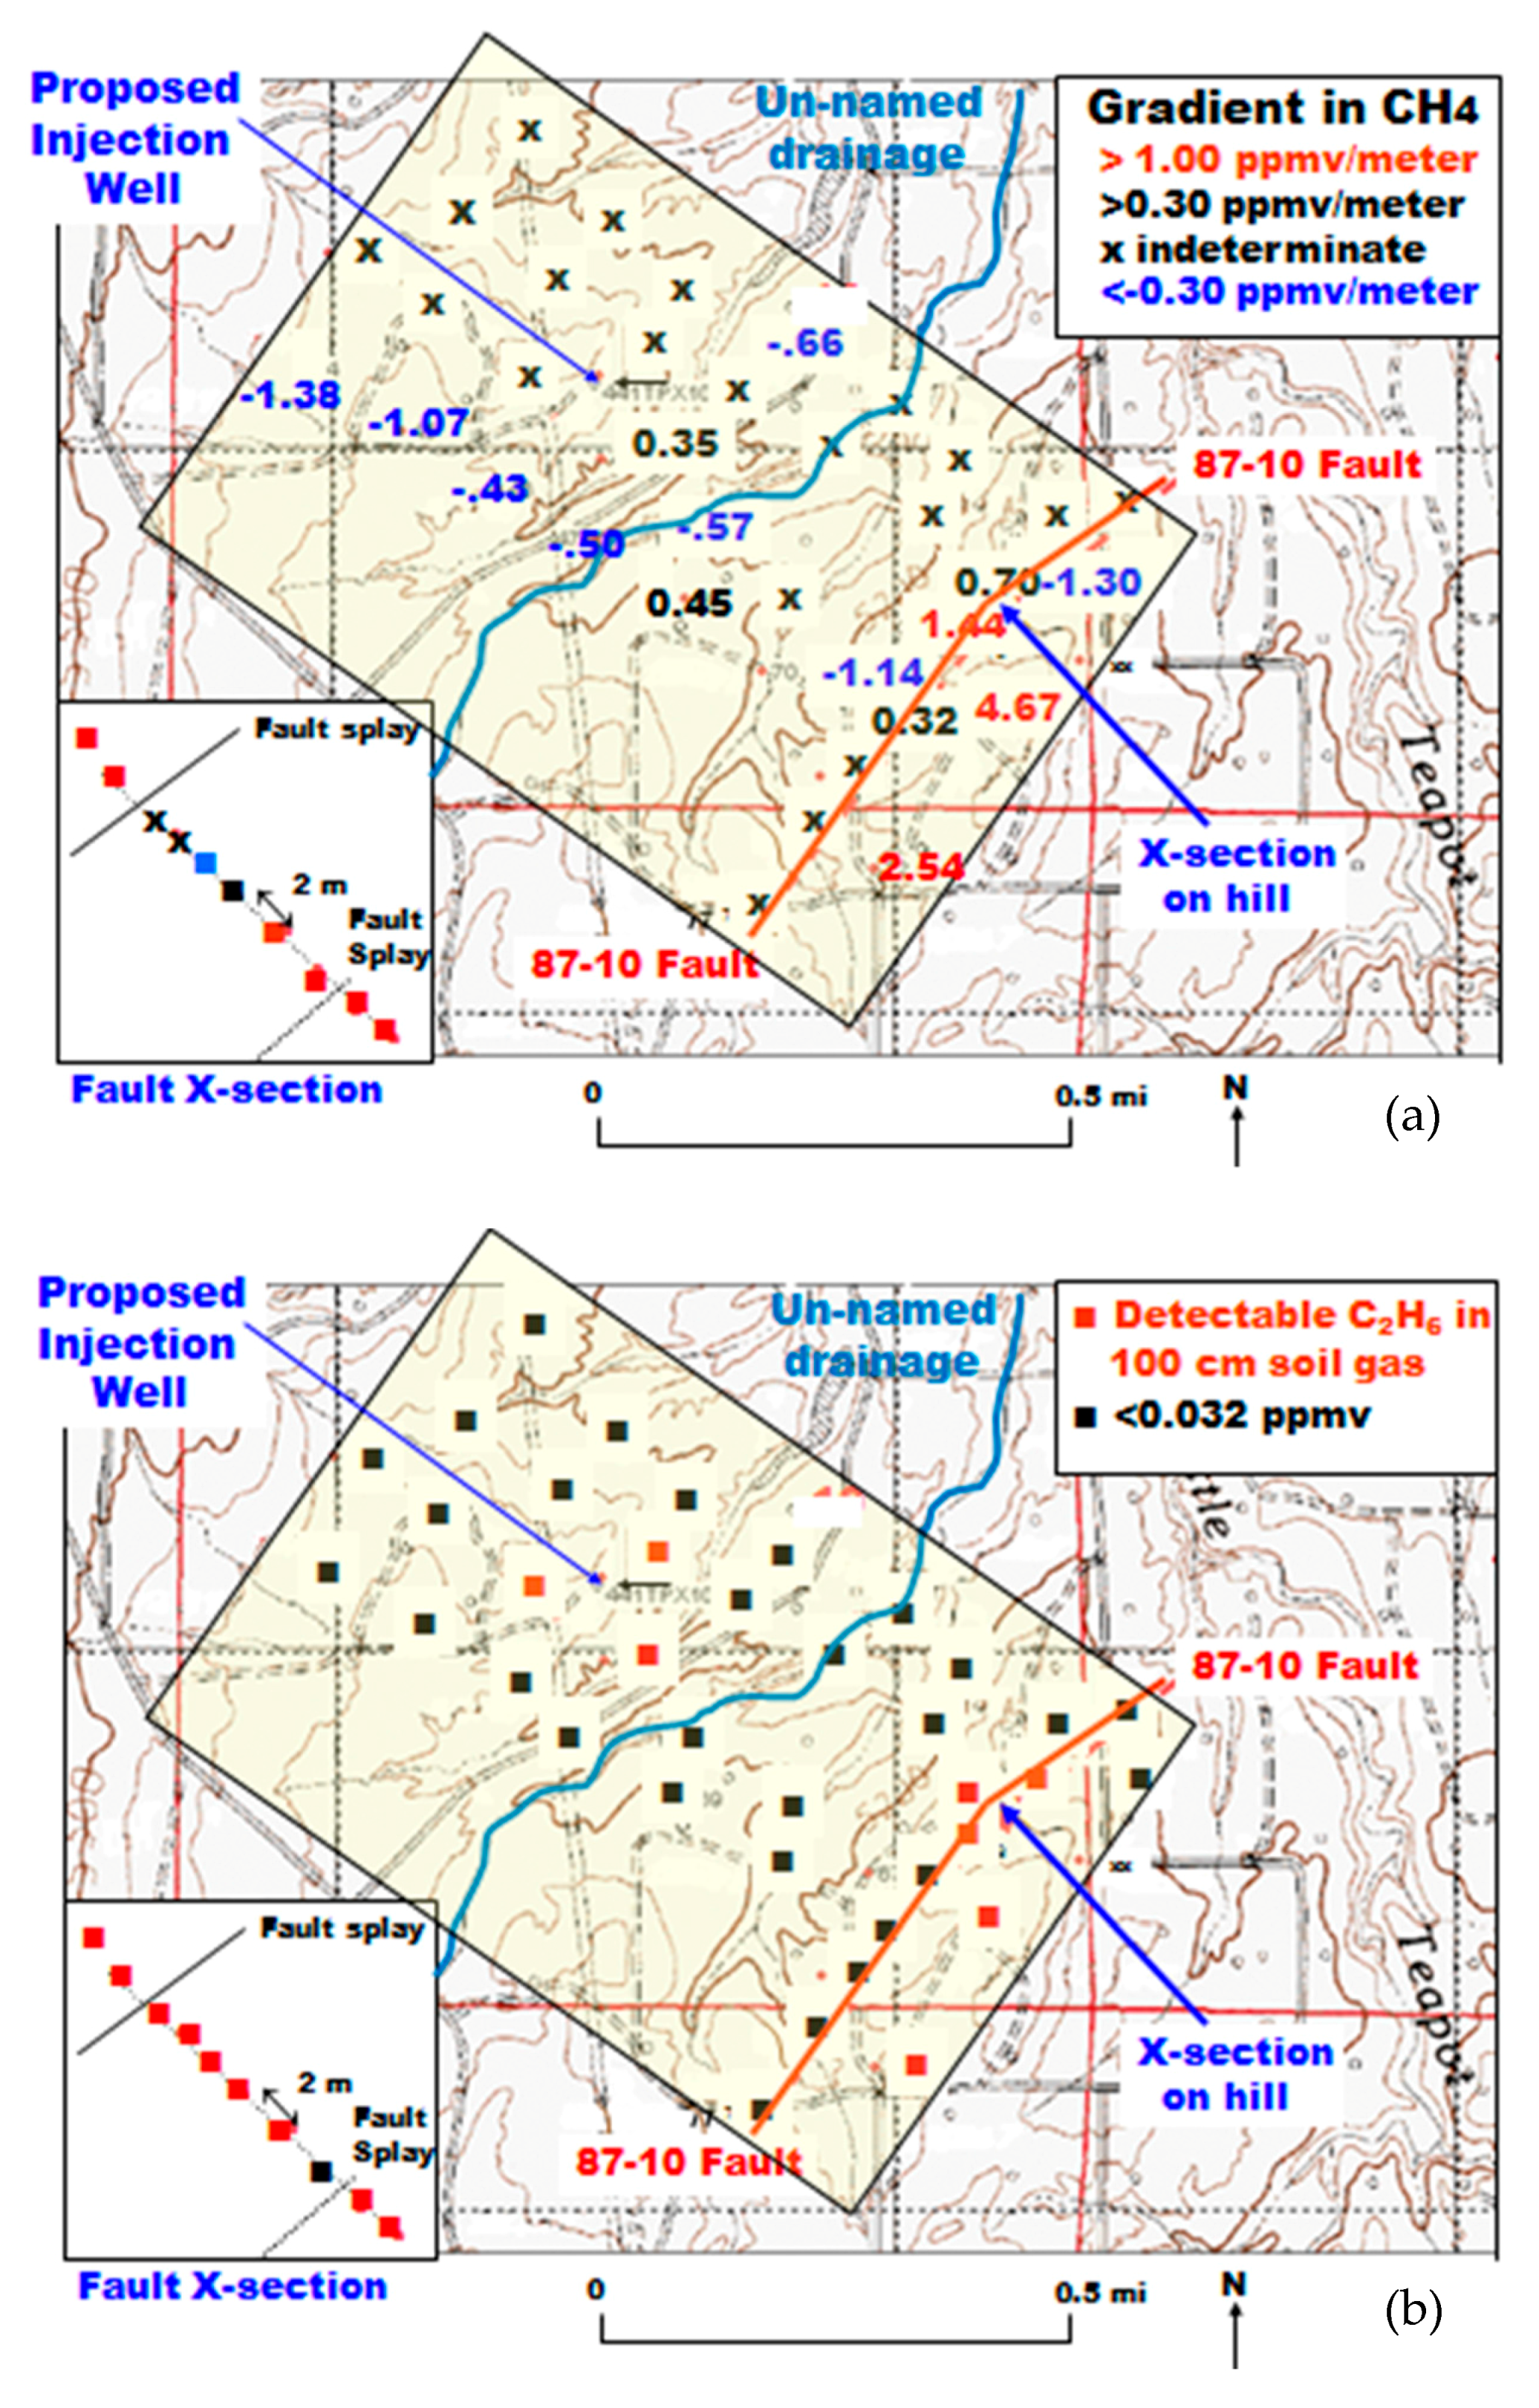
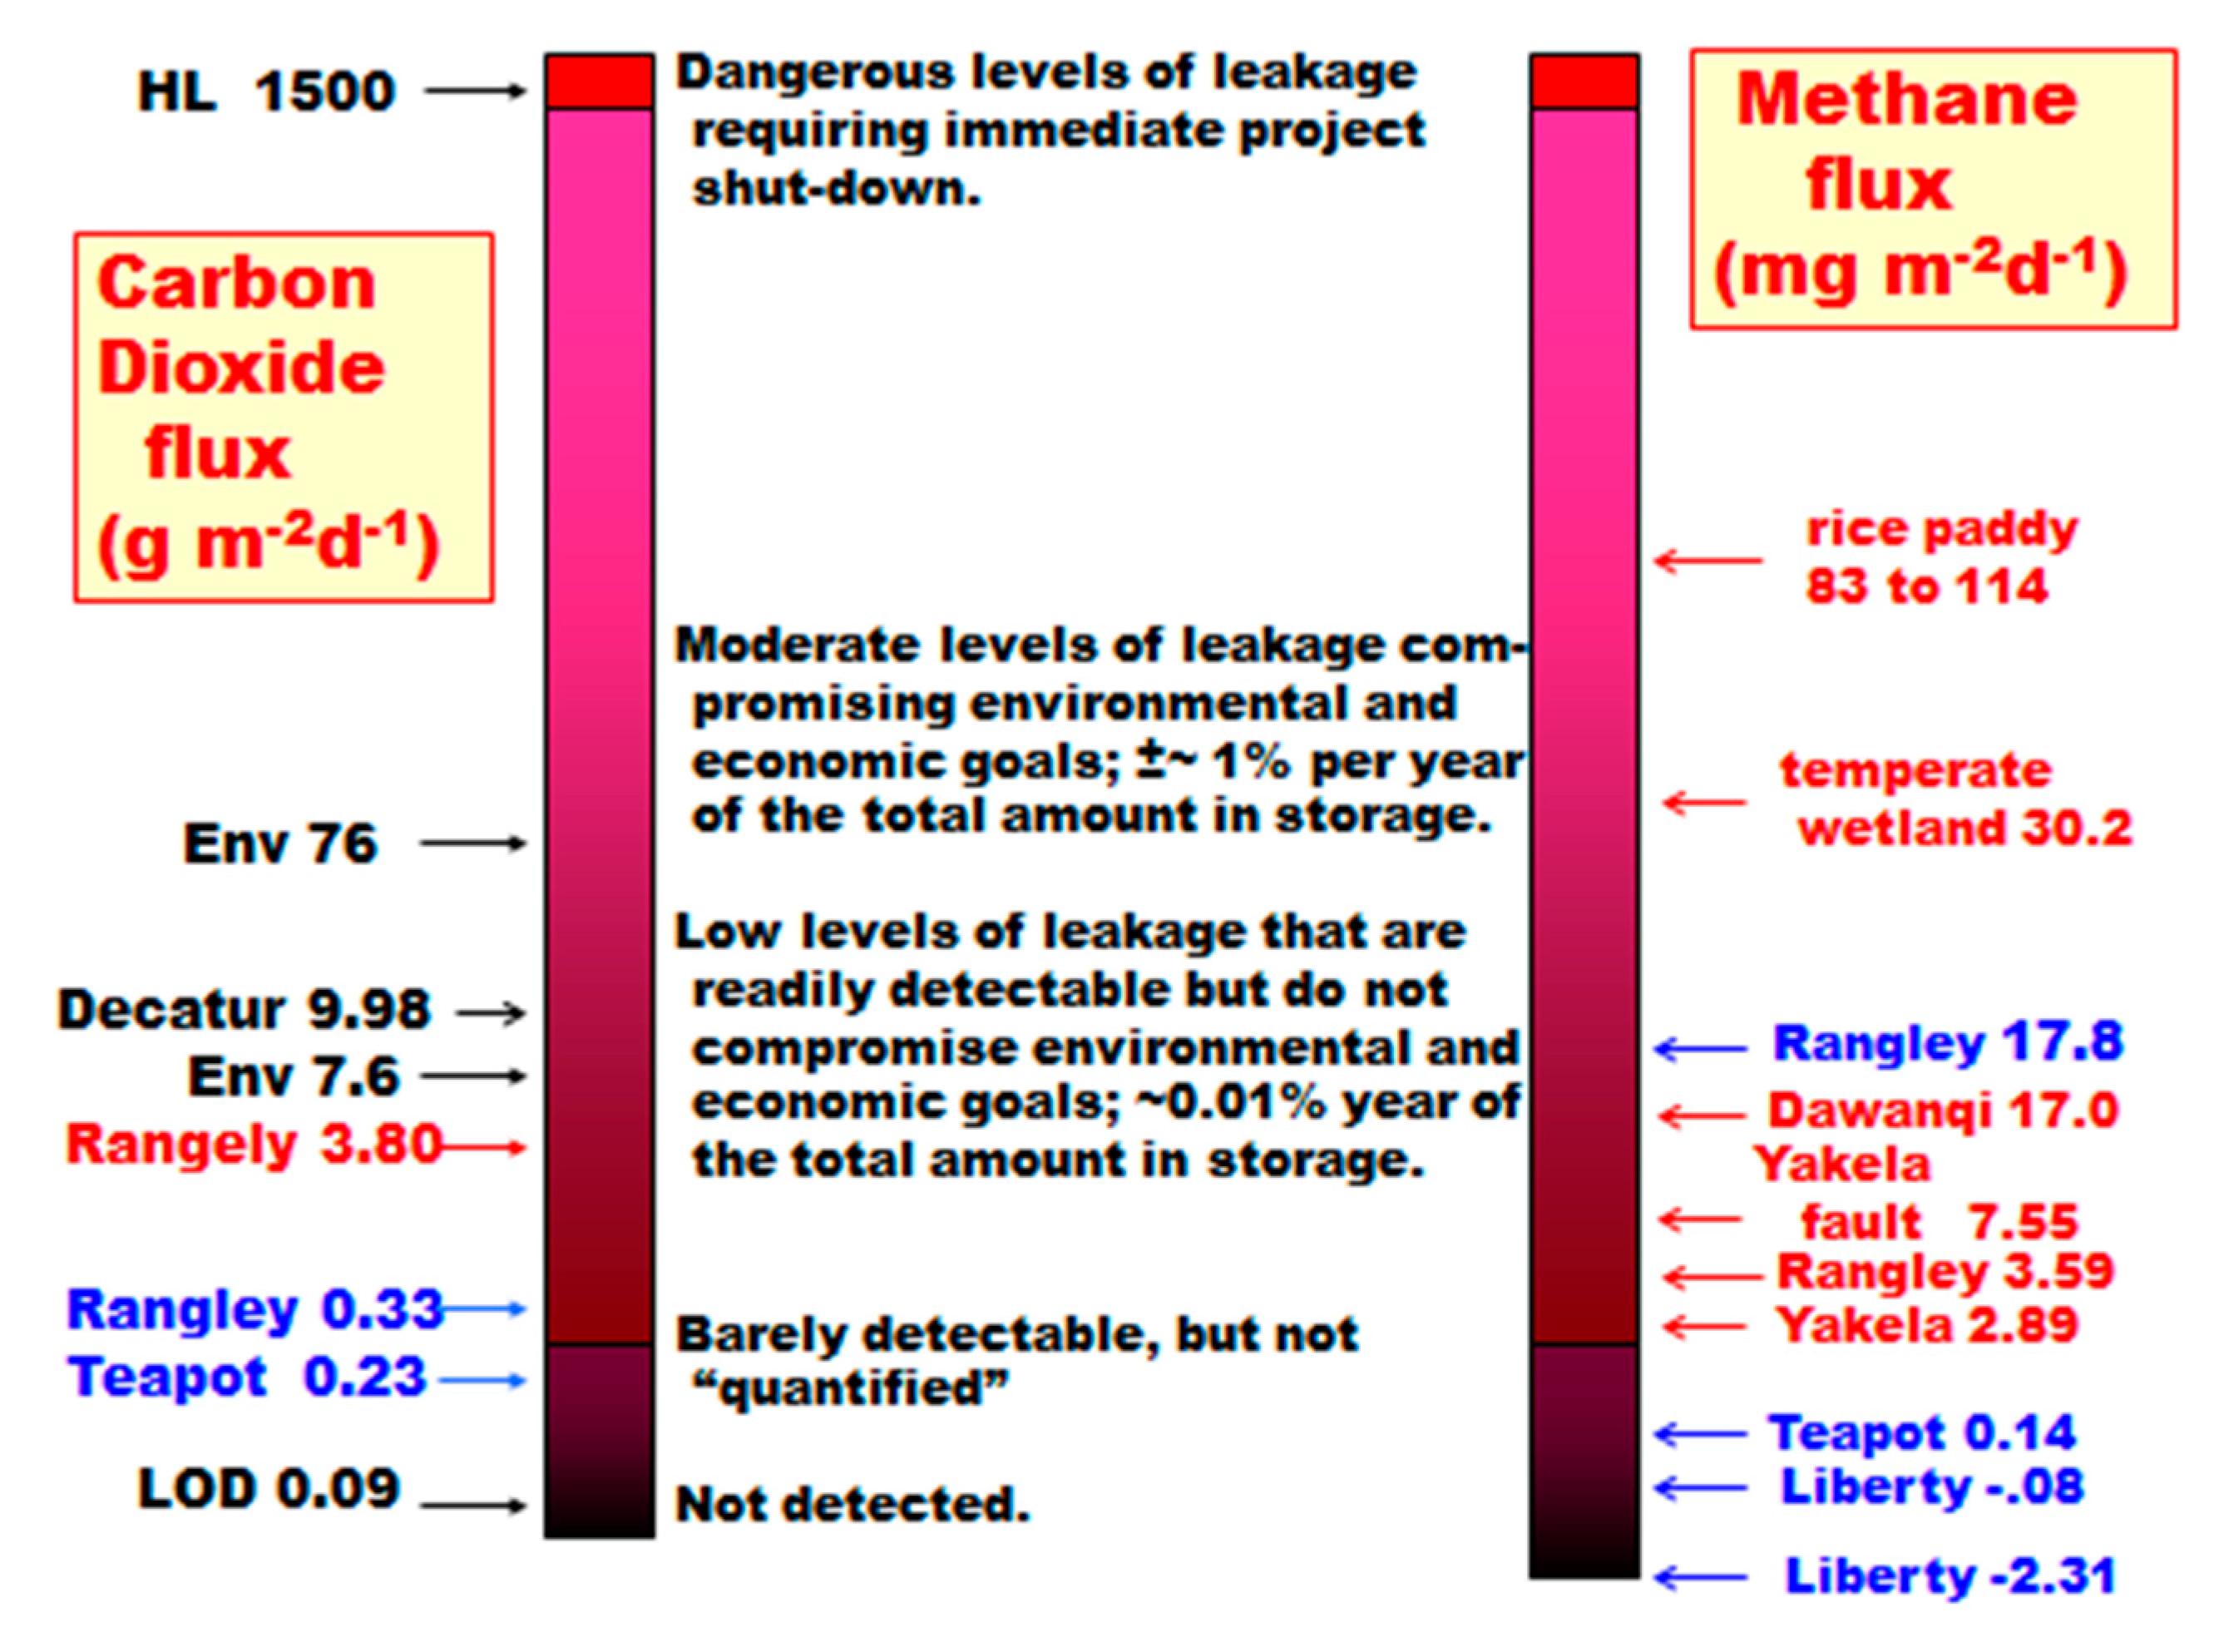
Table 1.
Measurements made at Rangely and Teapot Dome.
| Parameter | n (Rangely) | n (Teapot) |
|---|---|---|
| Reconnaissance Surveys | 2000–2002 | 2004 |
| CO2 and CH4 fluxes-triplicate fluxes 10-m apart | 59 1 | 40 |
| CO2 and CH4 in soil gases at 30-, 60-, and 100 cm depths | 67 | 40 |
| δ13C of CO2 in soil gas at 30-, 60-, and 100 cm depths | 67 | 40 |
| CH4, CO2, and δ13C of CO2 in an atmosphere sample | 59 | 40 |
| δ13C of CO2 in Klusman breath twice per day during sampling 10-m holes | 2001–2002 | 2005–2007 |
| CO2, CH4, C2+ alkanes and alkenes, O2+Ar, δ13C of both CO2 and CH4, C-14 of purified CO2 | 5 2 | 5 2 |
| Inert gases concentration and isotopic ratios | 5 3 | 5 3 |
| Miscellaneous measurements | 2000–2002 | 2003–2005 |
| Shallow soil temperatures at 15-, 30-, 60-, 100-cm | 4 4 | 4 4 |
| 10-m hole temperature at 1-, 2-, 3-, 5-, 10-m depths | 5 | 5 5 |
| Soil moisture at 15-cm intervals from surface to 2-m depth | 2 6 | 2 6 |
| Soil gas porosity and permeability at 15-cm intervals from the surface to 2-m depths | 2 6 | 2 6 |
| Barometric pressure—1-h interval, 24 h/day at a fixed location during all field work | 1 7 | 1 7 |
| δ13C and δ18O of CaCO3 in five 10-m hole depth intervals | - | 50 |
| δ13C of native vegetation | variable | variable |
| Section 10 study at Teapot Dome in 2007 | ||
| CO2 and CH4 in soil gases at 30-, 60-, and 100-cm depths | 50 | |
| δ13C and 18O of CaCO3 from miscellaneous samples in faults | - | variable |
1 At Rangely, the 59 flux locations were partitioned between 41 on the field proper, 16 in a control area, and 2 at the ends of the Mellen Hill fault; 2 The 5 locations were selected on the criteria listed above. O2+Ar were only measured at Teapot Dome; 3 The inert gases were sampled in 2005 by Mackintosh and Ballentine, again in 2008, and were published in 2012 [23]; 4 At Rangely, only 30-, 60-, and 100-cm were measured. These measurements were performed at 4 locations scattered across the field; 5 10-m hole nested interval temperatures were measured at Teapot Dome only; 6 Moisture, porosity, and permeability were measured by a combination of gravimetry and a gas permeator; 7 Barometric pressure was recorded hourly by a simple barometric device in the motel room.
Table 2.
Gas flux and soil gas concentrations at Rangely and Teapot Dome 1,2.
| Rangely Field | Teapot Dome | |||||||||||
|---|---|---|---|---|---|---|---|---|---|---|---|---|
| Summer | Winter | Summer | Winter | |||||||||
| Rangely Field | Mean | Med. | SD | Mean | Med. | SD | Mean | Med. | SD | Mean | Med. | SD |
| CO2 flux | 4187 | 3560 | 3574 | 307 | 67.9 | 1134 | - | - | - | 227.1 | 214.1 | 186.9 |
| CH4 flux | 4.86 | 0.440 | 22.8 | 25.1 | 0.87 | 135 | - | - | - | 0.137 | 0.102 | 0.325 |
| Rangely Control Area | No Control Area Because of Underpressure | |||||||||||
| CO2 flux | 2525 | 2616 | 847 | 429 | 62.0 | 742 | - | - | - | - | - | - |
| CH4 flux | 0.636 | 0.620 | 1.51 | 1.34 | 0.753 | 1.99 | - | - | - | - | - | - |
| Rangely Field | Teapot Dome | |||||||||||
| CO2 in soil gas | 2897 | 2650 | 1759 | 1015 | 596 | 1246 | - | - | - | 1010 | 719 | 1194 |
| CH4 in soil gas | 21.70 | 2.73 | 110 | 10.18 | 2.76 | 26.97 | - | - | - | 0.92 | 0.96 | 0.09 |
| Rangely Control Area | No Control Area Because of Underpressure | |||||||||||
| CO2 in soil gas | 2079 | 2106 | 942 | 840 | 534 | 570 | - | - | - | - | - | - |
| CH4 in soil gas | 2.89 | 2.46 | 2.13 | 9.02 | 2.77 | 24.47 | - | - | - | - | - | - |
1 Gas fluxes are in units of mg·m−2·day−1; soil gas concentrations are in units of ppmv; 2 Soil gas samples are samples from 100-cm depth only.
Table 3.
Correlations between gas fluxes and soil gas concentrations at Rangely and Teapot Dome.
| Teapot Dome-s04 | Rangely-s01 | Teapot Dome-w04 | Rangely-w01/02 |
|---|---|---|---|
| CO2 flux and 30-cm soil gas | 0.266 1 | 0.151 | 0.135 |
| CO2 flux and 60-cm soil gas | 0.252 1 | 0.231 | 0.268 |
| CO2 flux and 100-cm soil gas | 0.093 | 0.446 2 | 0.339 2 |
1 α < 0.05; 2 α < 0.01.
© 2018 by the author. Licensee MDPI, Basel, Switzerland. This article is an open access article distributed under the terms and conditions of the Creative Commons Attribution (CC BY) license (http://creativecommons.org/licenses/by/4.0/).
Share and Cite
MDPI and ACS Style
Klusman, R.W. Faults as Windows to Monitor Gas Seepage: Application to CO2 Sequestration and CO2-EOR. Geosciences 2018, 8, 92. https://doi.org/10.3390/geosciences8030092
AMA Style
Klusman RW. Faults as Windows to Monitor Gas Seepage: Application to CO2 Sequestration and CO2-EOR. Geosciences. 2018; 8(3):92. https://doi.org/10.3390/geosciences8030092
Chicago/Turabian StyleKlusman, Ronald W. 2018. "Faults as Windows to Monitor Gas Seepage: Application to CO2 Sequestration and CO2-EOR" Geosciences 8, no. 3: 92. https://doi.org/10.3390/geosciences8030092
Note that from the first issue of 2016, this journal uses article numbers instead of page numbers. See further details here.