Columbite-Group Minerals from New York Pegmatites: Insights from Isotopic and Geochemical Analyses

Abstract
:1. Introduction
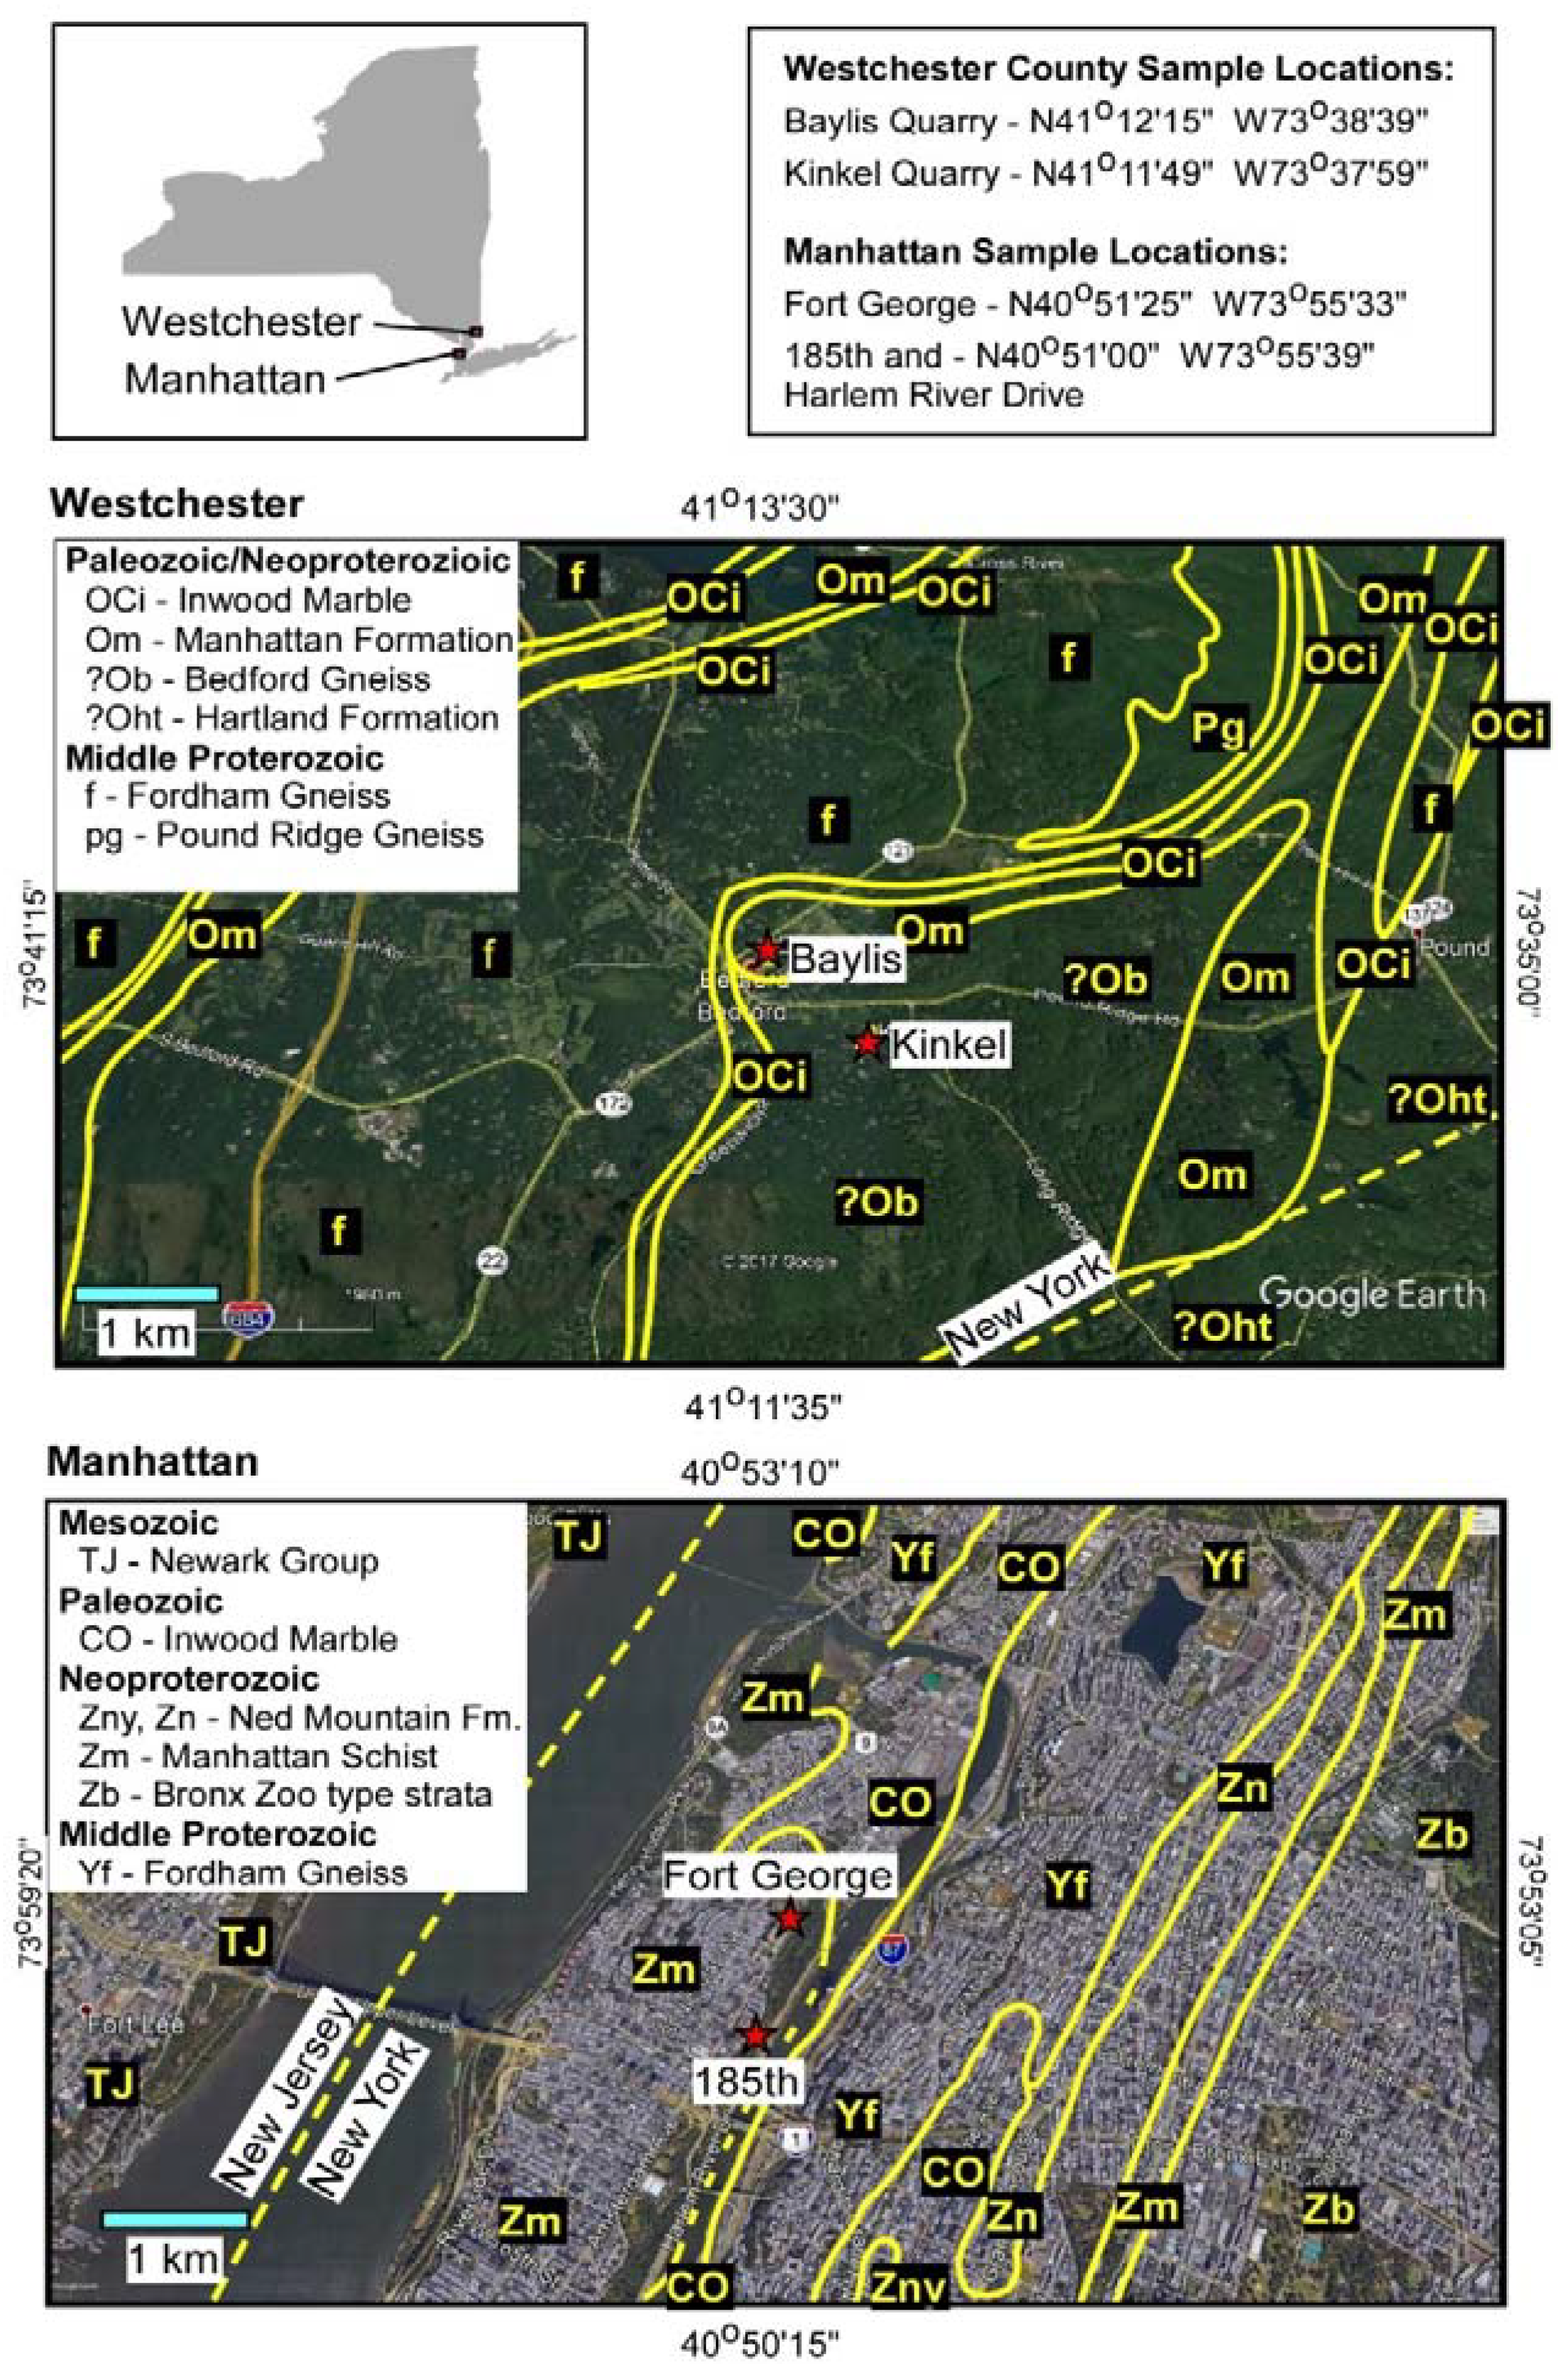
2. Geological Setting
3. Analytical Methods
3.1. Major Elements
3.2. Trace Elements
3.3. Geochronology
4. Results
4.1. Major Elements
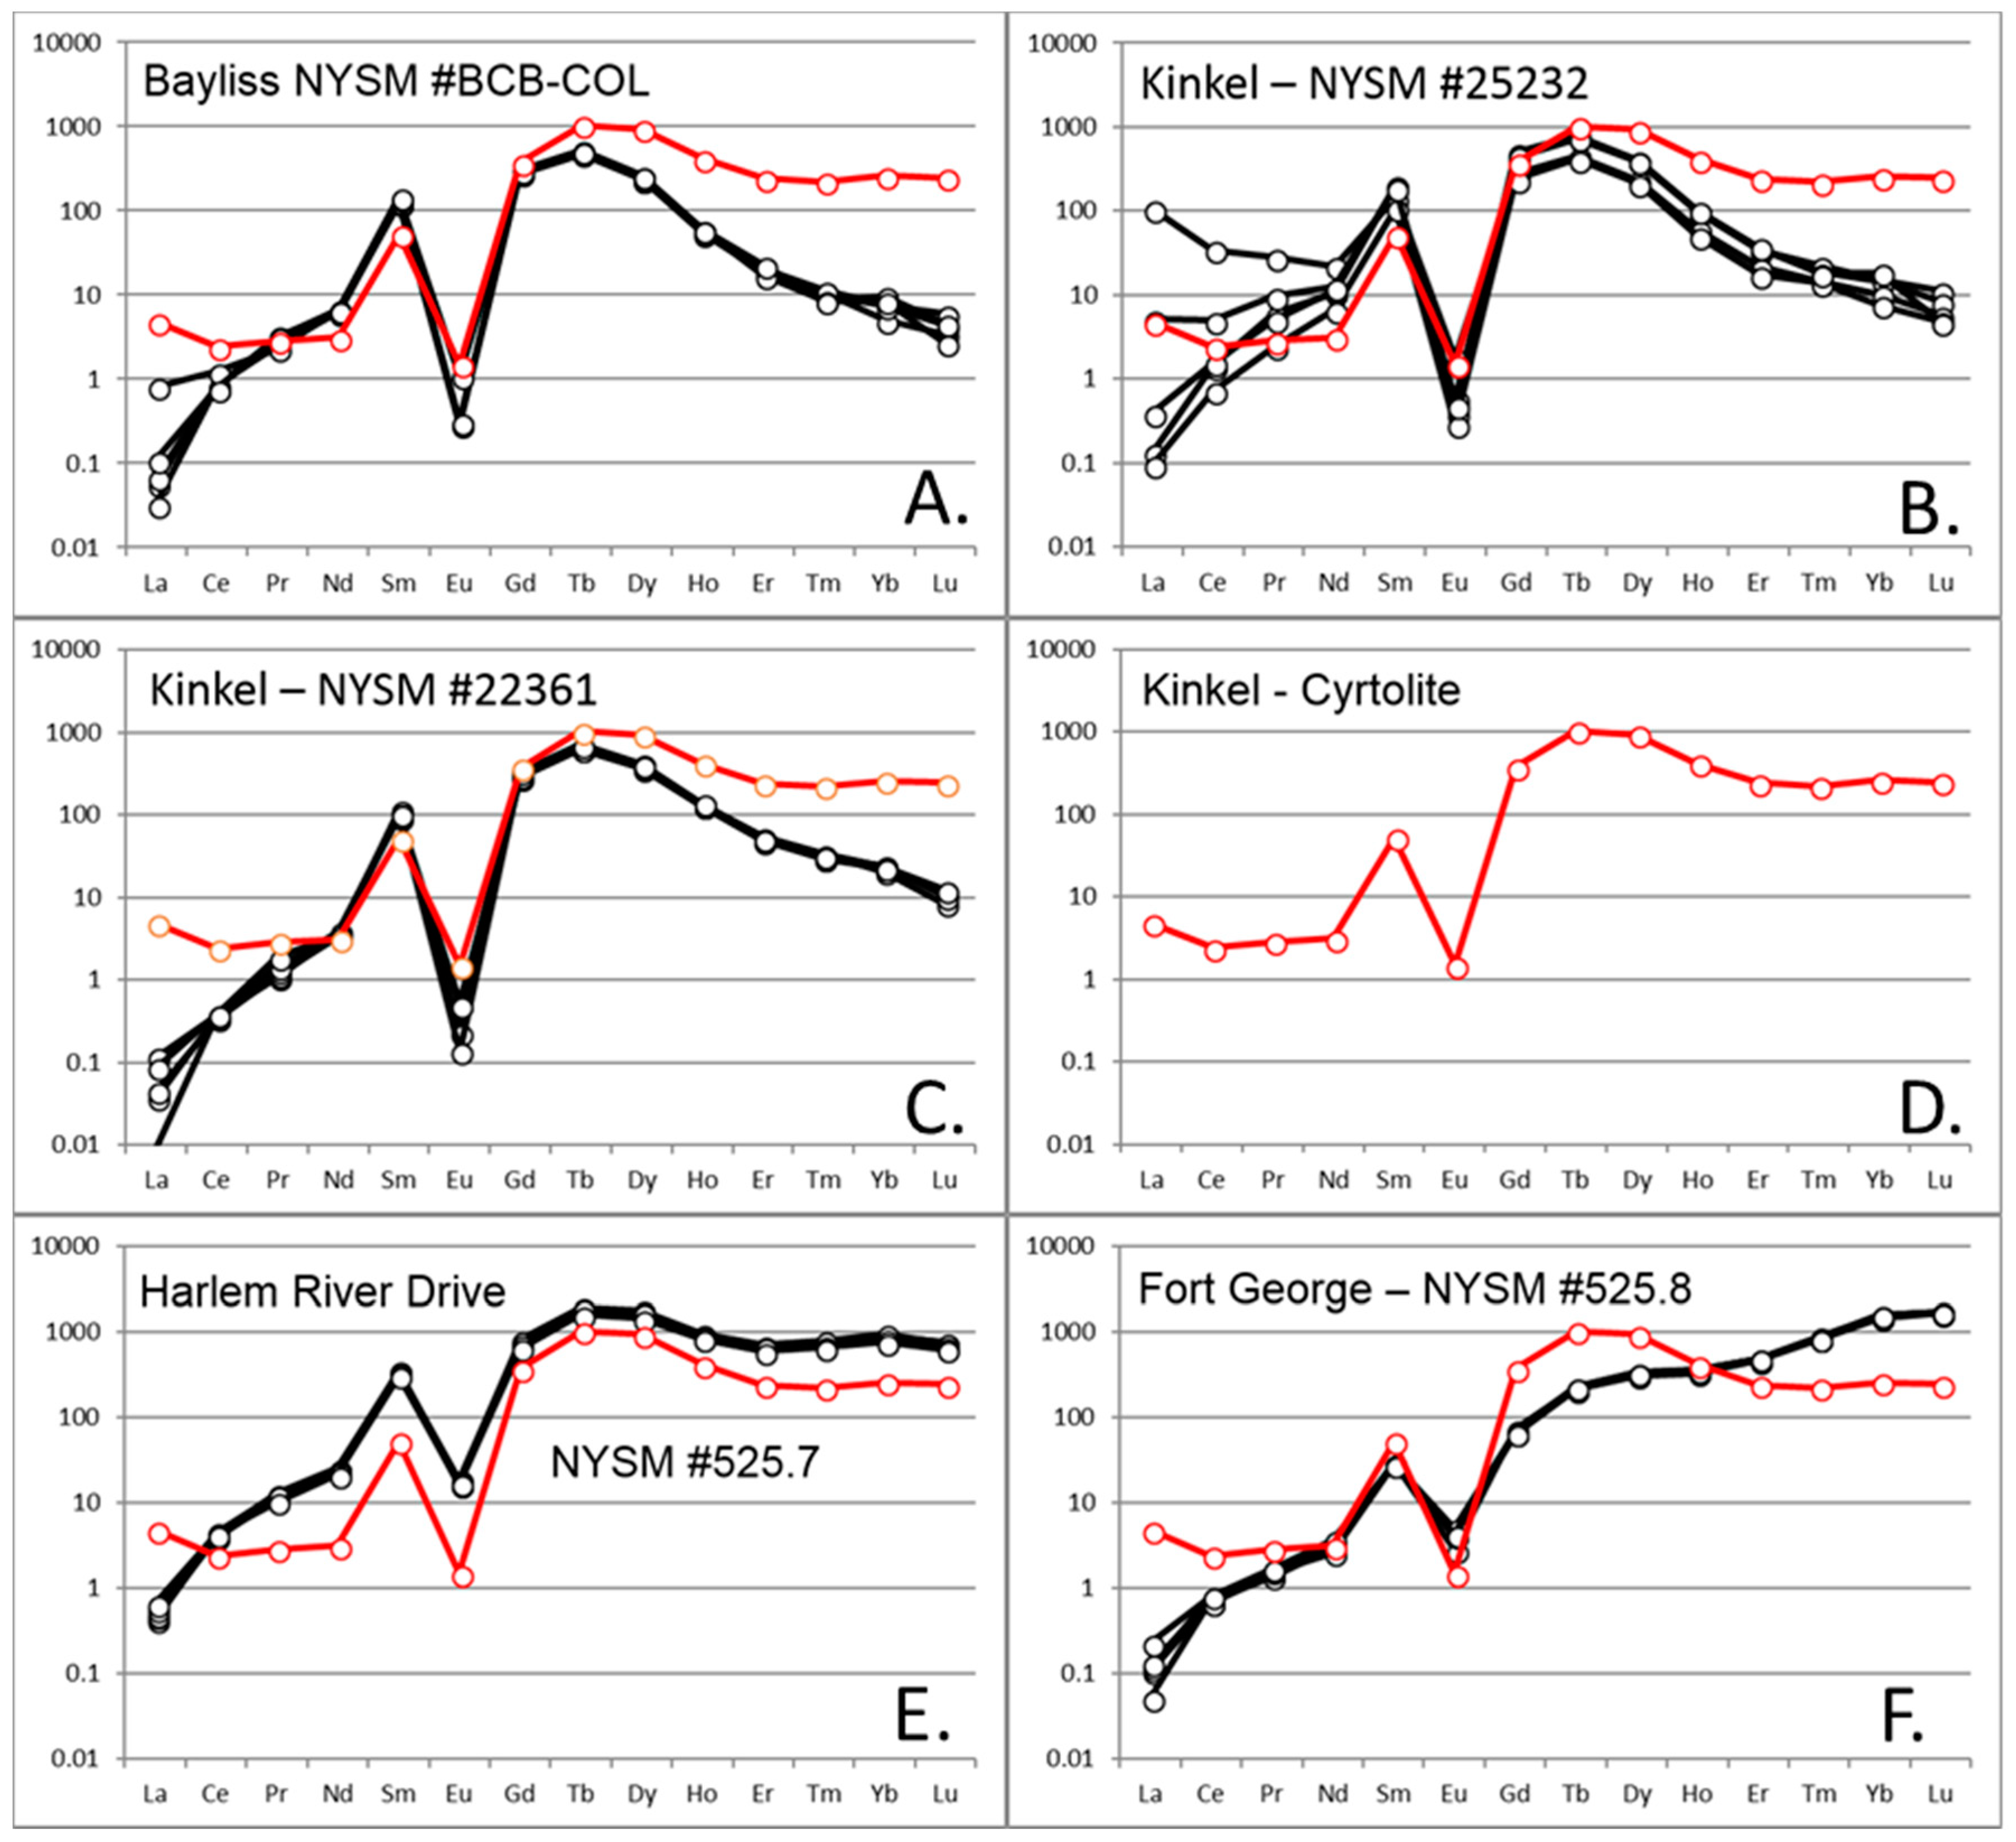
4.2. Trace Elements
4.3. Geochronology
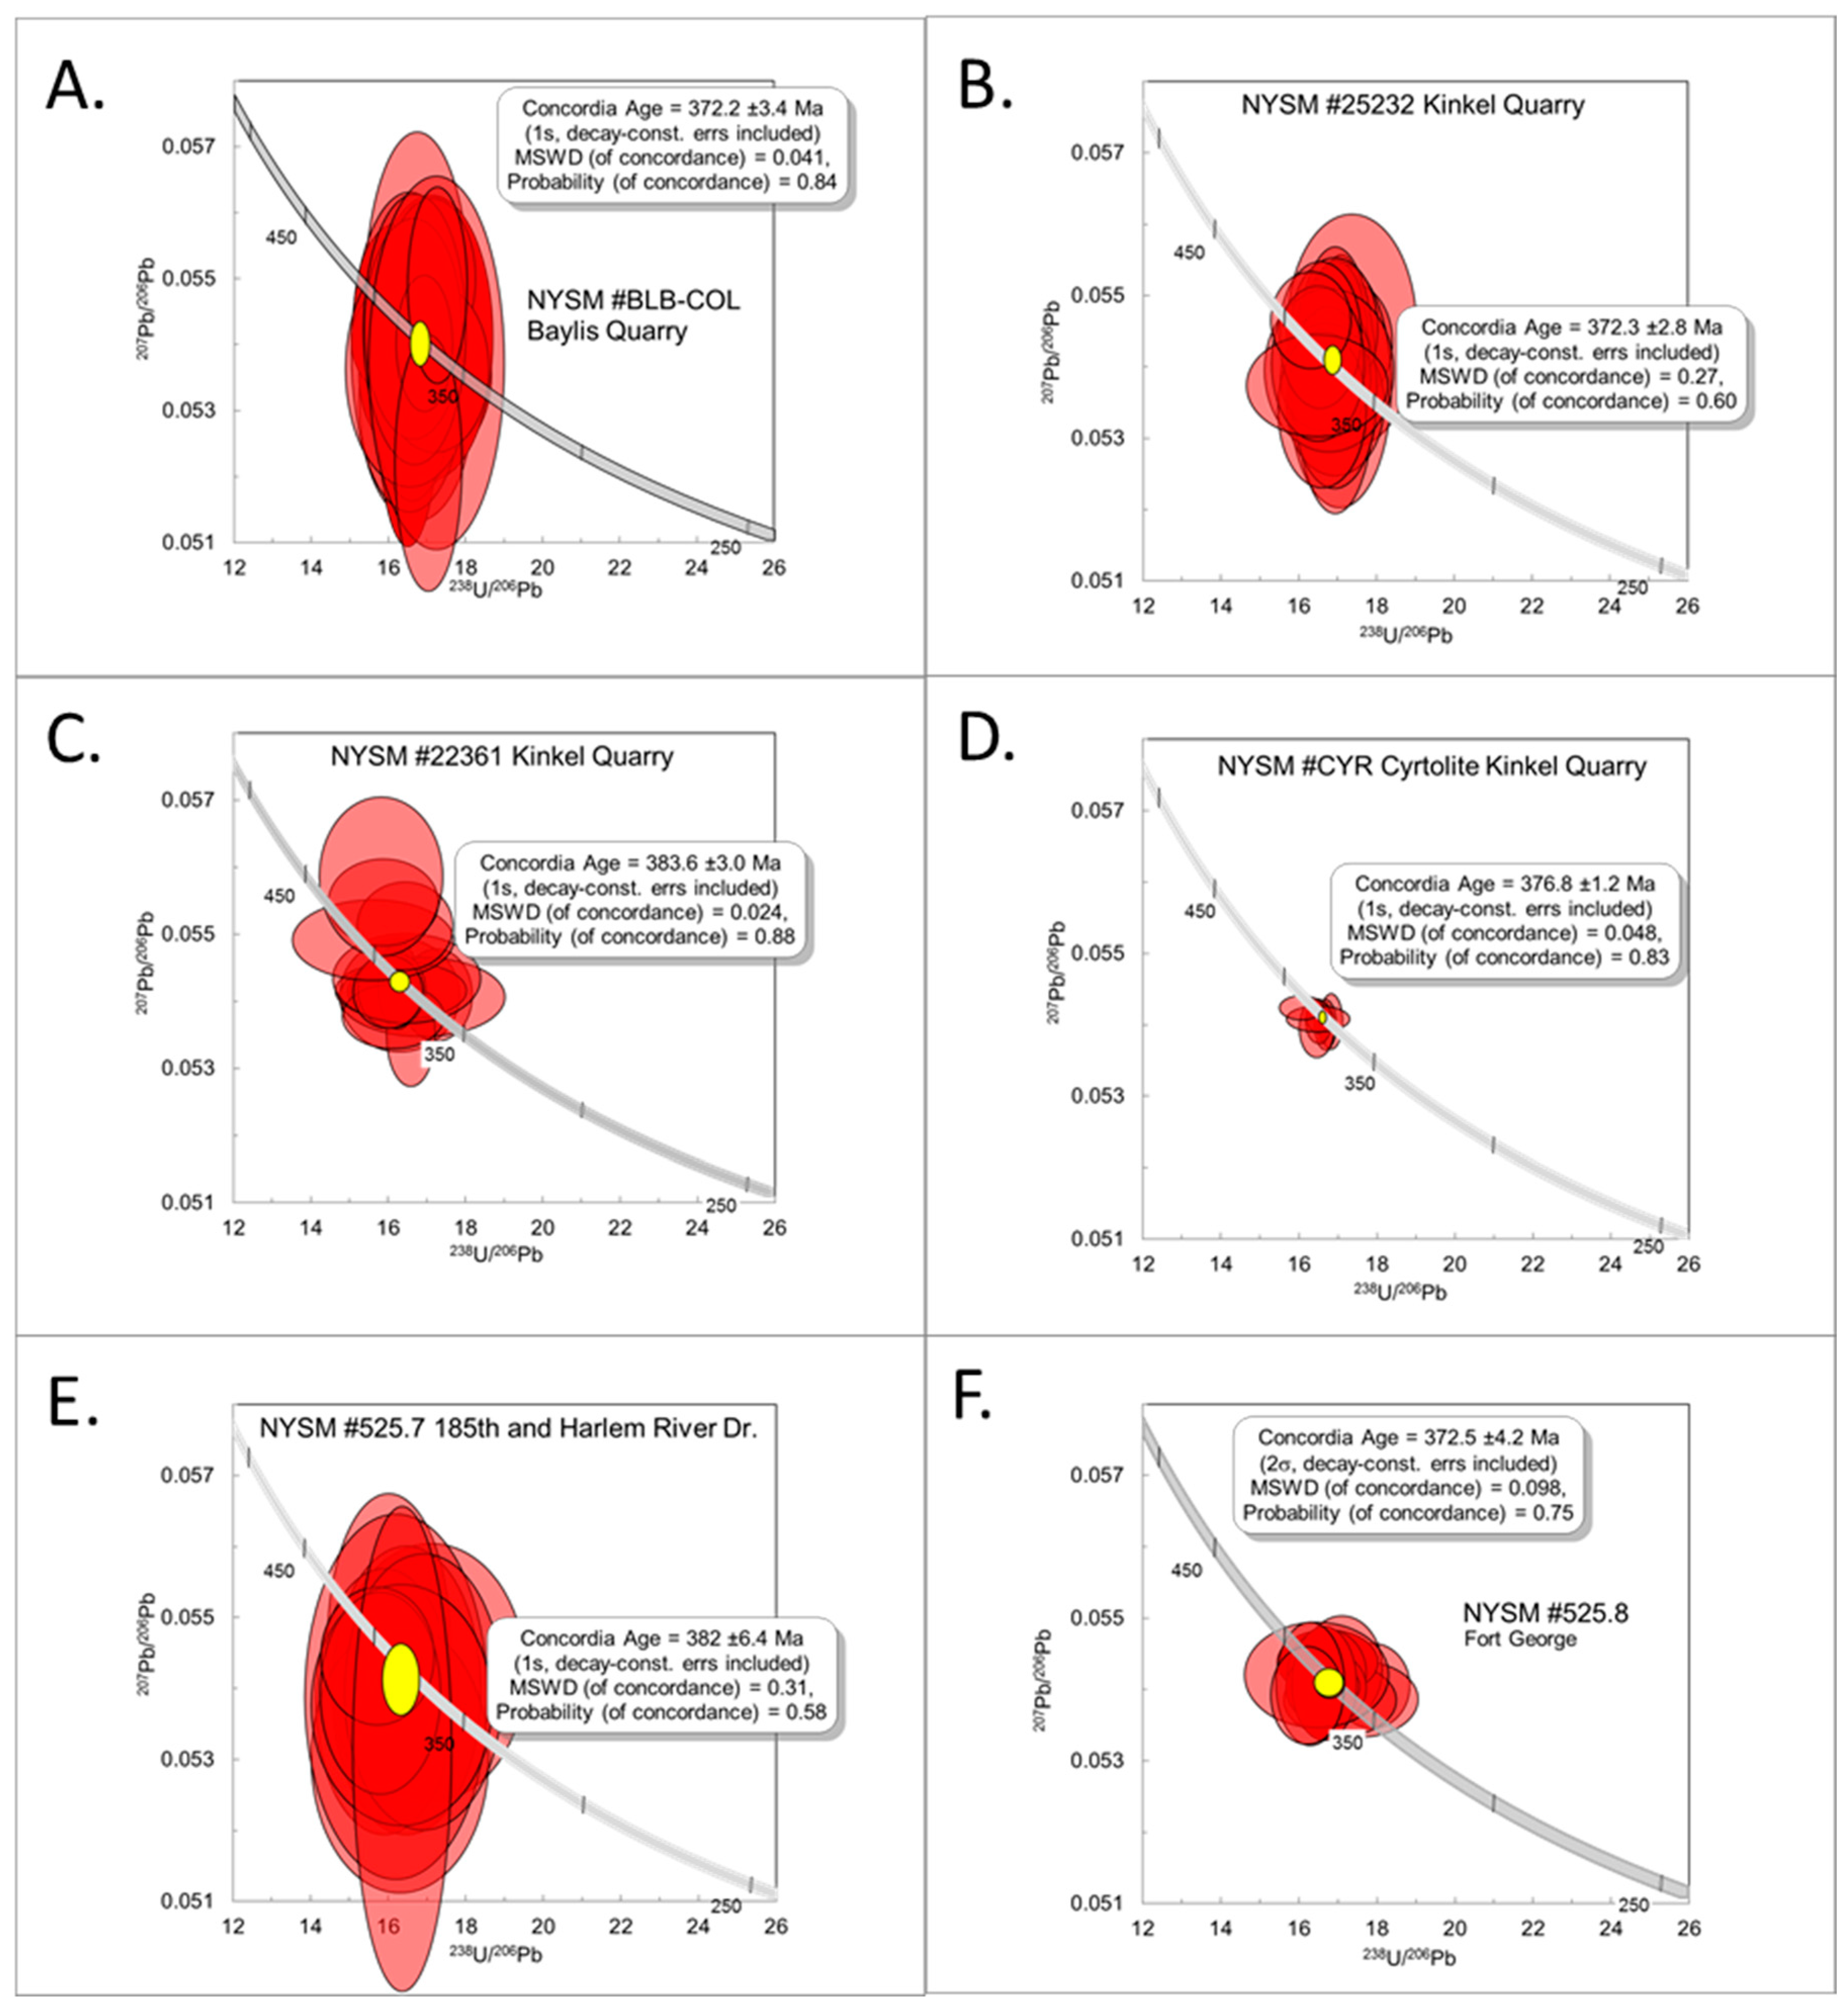
4.3.1. NYSM #BCB-COL
4.3.2. NYSM #25232
4.3.3. NYSM #22361
4.3.4. Zircon- “Cyrtolite” (CYR)
4.3.5. NYSM #525.7
4.3.6. NYSM #525.8
5. Discussion
6. Conclusions
Supplementary Materials
Author Contributions
Funding
Acknowledgments
Conflicts of Interest
References
- Burke, E.A.J. Tidying up mineral names: An IMA-CNMNC scheme for suffixes, hyphens and diacritical marks. Miner. Rec. 2008, 39, 131–135. [Google Scholar]
- Romer, R.L.; Wright, J.E. U-Pb dating of columbites: A geochronologic tool to date magmatism and ore deposits. Geochim. Cosmochim. Acta 1992, 56, 2137–2142. [Google Scholar] [CrossRef]
- Möller, P. REE (Y), Nb, and Ta enrichment in pegmatites and carbonatite-alkalic rock complexes. In Lanthanides, Tantalum and Niobium; Möller, P., Černý, P., Saupé, F., Eds.; Special Publication No. 7 of the Society for Geology Applied to Mineral Deposits 7; Springer: Berlin/Heidelberg, Germany, 1989; pp. 27–79. [Google Scholar] [CrossRef]
- Černý, P. Characteristics of pegmatite deposits of tantalum. In Lanthanides, Tantalum and Niobium; Möller, P., Černý, P., Saupé, F., Eds.; Special Publication No. 7 of the Society for Geology Applied to Mineral Deposits 7; Springer: Berlin/Heidelberg, Germany, 1989; pp. 195–239. [Google Scholar]
- USGS. Conflict Minerals from the Democratic Republic of the Congo: Global Tungsten Processing Plants, a Critical Part of the Tungsten Supply Chain. 2014. Available online: https://pubs.usgs.gov/fs/2014/3069/pdf/fs2014-3069.pdf (accessed on 19 November 2017).
- Romer, R.L.; Lehmann, B. U-Pb columbite–tantalite age of Neoproterozoic Ta-Nb mineralisation in Burundi. Econ. Geol. 1995, 90, 2303–2309. [Google Scholar] [CrossRef]
- Romer, R.L.; Smeds, S.A. Implications of U-Pb ages of columbite–tantalites from granitic pegmatites for the Paleoproterozoic accretion of 1.90–1.85 Ga magmatic arcs to the Baltic Shield. Precambrian Res. 1994, 67, 141–158. [Google Scholar] [CrossRef]
- Smith, S.R.; Foster, G.L.; Romer, R.L.; Tindle, A.G.; Kelley, S.P.; Noble, S.R.; Horstwood, M.; Breaks, F.W. U-Pb columbite–tantalite chronology of rare-element pegmatites using TIMS and Laser Ablation–Multi Collector–ICP–MS. Contrib. Miner. Petrol. 2004, 147, 549–564. [Google Scholar] [CrossRef]
- Melcher, F.; Sitnikova, M.A.; Graupner, T.; Martin, N.; Oberthür, T.; Henjes-Kunst, F.; Gäbler, E.; Gerdes, A.; Brätz, H.; Davis, D.W.; et al. Fingerprinting of conflict minerals: Columbite-tantalite (“coltan”) ores. SGA News, 23 June 2008. [Google Scholar]
- Aldrich, L.T.; Davis, G.L.; Tilton, G.R.; Wetherill, G.W. Radioactive ages of minerals from the Brown Derby Mine and the Quartz Creek Granite near Gunnison, Colorado. J. Geophys. Res. 1956, 61, 215–232. [Google Scholar] [CrossRef]
- Romer, R.L.; Smeds, S.A. U-Pb columbite ages of pegmatites from Sveconorwegian terranes in southwestern Sweden. Precambrian Res. 1996, 76, 15–30. [Google Scholar] [CrossRef]
- Romer, R.L.; Smeds, S.A. U-Pb columbite chronology of post-kinematic Palaeoproterozoic pegmatites in Sweden. Precambrian Res. 1997, 82, 85–99. [Google Scholar] [CrossRef]
- Dill, H.G.; Gerdes, A.; Weber, B. Cu-Fe-U phosphate mineralization of the Hagendorf-Pleystein pegmatite province, Germany: With special reference to laser-ablation inductively-coupled plasma mass spectrometry (LA-ICP-MS) of limonite-cored torbenite. Miner. Mag. 2007, 71, 371–387. [Google Scholar] [CrossRef]
- Dewaele, S.; Henjes-Kunst, F.; Melcher, F.; Sitnikova, M.; Burgess, R.; Gerdes, A.; Fernandez, M.A.; DeClercq, F.; Muchez, F.; Lehman, B. Late Neoproterozoic overprinting of the cassiterite and columbite-tantalite bearing pegmatites of the Gatumba area, Rwanda (Central Africa). J. Afr. Earth Sci. 2011, 61, 10–26. [Google Scholar] [CrossRef]
- Deng, X.D.; Li, J.W.; Zhao, X.F.; Hu, Z.C.; Hu, H.; Selby, D.; de Souza, Z.S. U-Pb isotope and trace elements analysis of columbite-(Mn) and zircon by laser ablation ICP-MS: Implications for geochronology of pegmatite and associated ore deposits. Chem. Geol. 2013, 344, 1–11. [Google Scholar] [CrossRef] [Green Version]
- Che, X.D.; Wu, F.Y.; Wang, R.C.; Gerdes, A.; Ji, W.Q.; Shao, Z.H.; Yang, J.H.; Zhu, Z.Y. In situ U-Pb dating of columbite-tantalite by LA-ICP-MS. Ore Geol. Rev. 2015, 65, 979–989. [Google Scholar] [CrossRef]
- Tang, Y.; Zhao, J.Y.; Zhang, H.; Cai, D.W.; Lv, Z.H.; Liu, Y.L.; Zhang, X. Precise columbite-(Fe) and zircon U-Pb dating of the Nanping No. 31 pegmatite vein in northeastern Cathaysia Block, SE China. Ore Geol. Rev. 2017, 83, 300–311. [Google Scholar] [CrossRef]
- Lupulescu, M.V.; Chiarenzelli, J.R.; Bailey, D.G. Mineralogy, classification, and tectonic setting of the granitic pegmatites of New York, USA. Can. Miner. 2012, 50, 1713–1728. [Google Scholar] [CrossRef]
- Tan, L.-P. Major Pegmatite Deposits of New York State; New York State Museum Science Service, Bulletin; New York State Museum: Albany, NY, USA, 1966; Volume 408, p. 138. [Google Scholar]
- Aleinikoff, J.N. Isotopic and morphologic evidence for the age of the Fordham Gneiss. Am. J. Sci. 1985, 285, 459–479. [Google Scholar] [CrossRef]
- Fisher, D.W.; Isachsen, Y.W.; Rickard, L.V. Geological Map of New York: Hudson-Mohawk Sheet; New York State Museum Science Service Map and Chart Series; The University of the State of New York: Albany, NY, USA, 1970; Volume 15. [Google Scholar]
- Horton, J.D.; San Juan, C.A.; Stoeser, D.B. The State Geological Map Compilation. (SGMC) Geodatabase of the Conterminous United States; United States Geological Survey Data Series 1052.2788749; U.S. Geological Survey: Reston, VA, USA, 2017.
- Luquer, L.M.; Reis, H. The augen-gneiss area, pegmatite veins, and diorite dikes at Bedford, New York. Am. Geol. 1896, 18, 239–261. [Google Scholar]
- Newland, D.H. The Mining and Quarry Industry of New York State 1905; New York State Museum Science Service, Bulletin: Albany, NY, USA, 1905; p. 102. [Google Scholar]
- Bastin, E.S. Economic geology of the feldspar deposits of the United States. U.S. Geol. Surv. Bull. 1910, 420, 54–63. [Google Scholar]
- Newland, D.H. The mineral resources of the State of New York. N. Y. State Mus. Bull. 1921, 223–224, 69–76. [Google Scholar]
- Newland, D.H.; Hartnagel, C.A. The mining and quarry industries of New York State for 1934 to 1936. N. Y. State Mus. Bull. 1939, 319, 18–36. [Google Scholar]
- Scotford, D.M. Metamorphism and axial-plane folding in the Poundridge area, New York. Geol. Soc. Am. Bull. 1956, 67, 1155–1198. [Google Scholar] [CrossRef]
- Manchester, J.G. The minerals of New York City and its environments. N. Y. Miner. Club Bull. 1931, 3, 168. [Google Scholar]
- Frondel, C. Systematic mineralogy of uranium and thorium. U. S. Geol. Surv. Bull. 1958, 1064, 400. [Google Scholar]
- Lupulescu, M.V. Minerals from New York State Pegmatites. Rocks Miner. 2007, 82, 34–38. [Google Scholar] [CrossRef]
- Gehrels, G.E.; Valencia, V.; Ruiz, J. Enhanced precision, accuracy, efficiency, and spatial resolution of U-Pb ages by laser ablation-multicollector inductively coupled plasma-mass spectrometry. Geochem. Geophys. Geosyst. 2008, 9. [Google Scholar] [CrossRef]
- Stacey, J.S.; Kramers, J.D. Approximation of terrestrial lead isotope evolution by a two-stage model. Earth Planet. Sci. Lett. 1975, 26, 207–221. [Google Scholar] [CrossRef]
- Ludwig, K. Isoplot 3.60; Berkeley Geochronology Center: Berkeley, CA, USA, 2008. Available online: https://www.bgc.org/isoplot_etc/isoplot.html (accessed on 4 May 2018).
- Ercit, S.T. The geochemistry and crystal chemistry of columbite-group minerals from granitic pegmatites, southwestern Grenville Province. Can. Miner. 1994, 32, 421–438. [Google Scholar]
- Černý, P.; Ercit, S.T.; Smeds, S.A.; Groat, L.A.; Chapman, R. Zirconium and hafnium in minerals of the columbite and wodginite groups from granitic pegmatites. Can. Miner. 2007, 45, 185–202. [Google Scholar] [CrossRef]
- Muench, O.B. The analysis of cyrtolite for lead and uranium. Am. J. Sci. 1931, 21, 350–357. [Google Scholar] [CrossRef]
- Muench, O.B. The analysis of Bedford cyrtolite for lead and uranium. J. Am. Chem. Soc. 1934, 56, 1536. [Google Scholar] [CrossRef]
- Agar, W.M. The pegmatites of Bedford, New York. In Proceedings of the 16th International Geological Congress, Washington, DC, USA, 22–29 July 1933; pp. 123–128. [Google Scholar]
- Isachsen, Y.W. Geochronology of New York State; Empire State Geogram; New York State Museum Science Service; New York State Museum: New York, NY, USA, 1963; pp. 1–8. [Google Scholar]
- Wise, M.A.; Cerny, P.; Falster, A.U. Scandium substitution in columbite-group minerals and ixiolite. Can. Miner. 1998, 36, 673–680. [Google Scholar]
- Graupner, T.; Melcher, F.; Gabler, H.-E.; Sitnikova, M.; Bratz, H.; Bahr, A. Rare Earth element geochemistry of columbite-group minerals: LA-ICP-MS data. Miner. Mag. 2010, 74, 691–713. [Google Scholar] [CrossRef]
- van Staal, C.R.; Whalen, J.B. Magmatism during the Salinic, Acadian and Neoacadian Orogenies; Geological Society of America Abstracts with Programs; Geological Society of America: Harrisburg, PA, USA, 2006; Volume 38, p. 31. [Google Scholar]
- Bradley, D.; Buchwaldt, R.; Shea, E.; Bowring, S.; O’Sullivan, P.; Benowitz, J.; McCauley, A.; Bradley, L. Geochronology and Orogenic Context of Northern Appalachian Lithium-Cesium-Tantalum Pegmatites; Geological Society of America Abstracts with Programs; Geological Society of America: Breton Woods, NH, USA, 2013; Volume 45, p. 108. [Google Scholar]
- Bradley, D.; Shea, E.; Buchwaldt, R.; Bowring, S.; McCauley, A.; Benowitz, J.; O’Sullivan, P. Geochronology and Orogenic Context of Lithium-Cesium-Tantalum Pegmatites in the Appalachians; Geological Society of America Abstracts with Programs; Geological Society of America: Albany, NY, USA, 2016; Volume 48. [Google Scholar]


| Oxide | NYSM 22361 | NYSM 25232 | BCB-COL | NYSM 525.8 | NYSM 525.7 |
|---|---|---|---|---|---|
| CaO | 0.02 | udl | udl | 0.03 | 0.10 |
| FeO | 14.18 | 14.18 | 14.12 | 6.24 | 6.26 |
| MnO | 6.38 | 6.33 | 6.32 | 13.64 | 12.73 |
| MgO | 0.14 | 0.06 | 0.13 | udl | 0.03 |
| Nb2O5 | 71.50 | 71.53 | 71.74 | 67.85 | 59.89 |
| Ta2O5 | 6.35 | 7.93 | 6.93 | 12.78 | 20.43 |
| TiO2 | 1.62 | 0.82 | 1.69 | 0.45 | 0.64 |
| Total | 100.19 | 100.85 | 100.93 | 100.99 | 100.08 |
| apfu | |||||
| Ca2+ | nd | nd | nd | nd | 0.01 |
| Fe2+ | 0.68 | 0.68 | 0.67 | 0.30 | 0.32 |
| Mn2+ | 0.31 | 0.31 | 0.30 | 0.67 | 0.66 |
| Mg2+ | 0.01 | 0.01 | 0.01 | 0 | nd |
| Nb5+ | 1.85 | 1.85 | 1.84 | 1.79 | 1.65 |
| Ta5+ | 0.10 | 0.12 | 0.11 | 0.20 | 0.34 |
| Ti4+ | 0.07 | 0.04 | 0.07 | 0.02 | 0.03 |
| Mn/(Mn+Fe) | 0.31 | 0.31 | 0.31 | 0.69 | 0.67 |
| Ta/(Ta+Nb) | 0.05 | 0.06 | 0.06 | 0.10 | 0.17 |
| Sample | Zr | Y | Sn | Sc | W | Hf | Pb | U | Th |
|---|---|---|---|---|---|---|---|---|---|
| BCB-COL | 4670 | 170 | 487.2 | 53.8 | 7050 | 480 | 580.8 | 620.5 | 8.7 |
| NYSM 22361 | 4500 | 223.9 | 499.5 | 72.7 | 8391.6 | 476.8 | 882.5 | 647.1 | 10.9 |
| NYSM 25232 | 4524 | 307.4 | 368.8 | 30.4 | 2088 | 556.4 | 392.8 | 315.0 | 2.4 |
| NYSM 525.7 | 500.4 | 3930 | 97.7 | 35.2 | 1726 | 71.9 | 238.6 | 170.1 | 13.9 |
| NYSM 525.8 | 2622 | 2104 | 386.8 | 8.6 | 4496 | 406 | 736 | 500.2 | 20.7 |
| CYR | - | 1948.2 | - | 118.7 | - | 54,100 | 1678.2 | 2327 | 16.9 |
| Sample | La | Ce | Pr | Nd | Sm | Eu | Gd | Tb | Dy | Ho | Er | Tm | Yb | Lu | Y |
|---|---|---|---|---|---|---|---|---|---|---|---|---|---|---|---|
| BCB-COL | 0.07 | 0.72 | 0.35 | 3.89 | 26.14 | 0.05 | 75.88 | 23.8 | 78.84 | 4.12 | 4.11 | 0.32 | 1.59 | 0.13 | 170 |
| 22361 | 11 | 16 | 2 | 10 | 33 | 0.07 | 99 | 30 | 105 | 6 | 6 | 0.6 | 3 | 0.22 | 223.85 |
| 25232 | 0.02 | 0.3 | 0.2 | 2 | 20 | 0.03 | 82 | 31 | 127 | 10 | 11 | 1 | 5 | 0.35 | 307.4 |
| 525.7 | 2.76 | 8 | 2 | 20 | 76 | 2 | 264 | 112 | 824 | 144 | 397 | 70 | 574 | 75 | 3930 |
| 525.8 | 0.16 | 3 | 2 | 14 | 66 | 1 | 191 | 86 | 534 | 64 | 138 | 23 | 180 | 23 | 2104 |
| CYR | 1.49 | 1.95 | 0.35 | 1.88 | 10.29 | 0.11 | 97.09 | 48.92 | 301.75 | 29.95 | 50.99 | 7.23 | 54.13 | 7.91 | 1948.2 |
| Sample | U (ppm) | 206Pb/204Pb | U/Th | Concordant Age (Ma) | MSDW | PROB | Weighted Mean (Ma) | MSDW | PROB | n | |
|---|---|---|---|---|---|---|---|---|---|---|---|
| NYSM BCB-COL | Mean | 620.1 | 28,730.2 | 117.0 | 372.2 | 0.04 | 0.84 | 372.2 | 0.15 | 1.00 | 20 |
| SD | 26.7 | 1405.3 | 3.2 | 3.4 | 8.2 | ||||||
| NYSM 25232 | Mean | 315.0 | 92,970.4 | 352.3 | 372.3 | 0.27 | 0.60 | 371.3 | 0.13 | 1.00 | 20 |
| SD | 6.1 | 9769.9 | 6.0 | 2.8 | 7.3 | ||||||
| NYSM 22361 | Mean | 647.1 | 77,805.3 | 128.1 | 383.6 | 0.02 | 0.88 | 383.4 | 0.37 | 0.98 | 15 |
| SD | 80.1 | 41,412.8 | 12.0 | 3.0 | 8.9 | ||||||
| NYSM CYR | Mean | 2230 | 238,925 | 239 | 376.8 | 0.05 | 0.83 | 376.9 | 0.64 | 0.73 | 8 |
| SD | 525 | 164,168 | 36 | 1.2 | 4.3 | ||||||
| NYSM 525.7 | Mean | 165.5 | 106,213.2 | 32.7 | 382 | 0.31 | 0.58 | 383.0 | 0.15 | 1.00 | 14 |
| SD | 49.5 | 72,993.9 | 8.7 | 6.4 | 15 | ||||||
| NYSM 525.8 | Mean | 500.2 | 28,854.1 | 80.5 | 372.4 | 0.03 | 0.86 | 372 | 0.35 | 0.97 | 12 |
| SD | 4.5 | 5479.9 | 2.5 | 3.9 | 11 |
© 2018 by the authors. Licensee MDPI, Basel, Switzerland. This article is an open access article distributed under the terms and conditions of the Creative Commons Attribution (CC BY) license (http://creativecommons.org/licenses/by/4.0/).
Share and Cite
Lupulescu, M.V.; Chiarenzelli, J.R.; Pecha, M.E.; Singer, J.W.; Regan, S.P. Columbite-Group Minerals from New York Pegmatites: Insights from Isotopic and Geochemical Analyses. Geosciences 2018, 8, 169. https://doi.org/10.3390/geosciences8050169
Lupulescu MV, Chiarenzelli JR, Pecha ME, Singer JW, Regan SP. Columbite-Group Minerals from New York Pegmatites: Insights from Isotopic and Geochemical Analyses. Geosciences. 2018; 8(5):169. https://doi.org/10.3390/geosciences8050169
Chicago/Turabian StyleLupulescu, Marian V., Jeffrey R. Chiarenzelli, Mark E. Pecha, Jared W. Singer, and Sean P. Regan. 2018. "Columbite-Group Minerals from New York Pegmatites: Insights from Isotopic and Geochemical Analyses" Geosciences 8, no. 5: 169. https://doi.org/10.3390/geosciences8050169