Article

Diffuse Versus Conduit Flow in Coastal Karst Aquifers: The Consequences of Island Area and Perimeter Relationships

1
Department of Natural Sciences, Shawnee State University, 940 Second Street, Portsmouth, OH 45662, USA
2
Department of Geosciences, Mississippi State University, P.O. Box 5448, Mississippi State, MS 39762, USA
*
Author to whom correspondence should be addressed.
Geosciences 2018, 8(7), 268; https://doi.org/10.3390/geosciences8070268
Submission received: 29 June 2018 / Revised: 15 July 2018 / Accepted: 17 July 2018 / Published: 20 July 2018

Abstract

:
The majority of limestone islands are made of eogenetic carbonate rock, with intrinsic high porosity and permeability. The freshwater lenses of small islands are dominated by diffuse flow regimes as the island perimeter is everywhere close to the meteoric catchment of the island interior. This flow regime produces flank margin caves at the lens margin, where dissolution is enhanced by mixing corrosion, superposition of organic decay horizons and higher flow velocities as the lens thins. The lens interior develops touching-vug flow systems that result in enhanced permeability and lens thinning over time. As islands become larger, the area (meteoric catchment) goes up by the square, but the island perimeter (discharge zone) goes up linearly; diffuse flow becomes inefficient; conduit flow develops to produce traditional epigenic cave systems that discharge the freshwater lens by specific turbulent flow routes, which in turn are fed by diffuse flow in the island interior. Locally, diffuse flow to the island perimeter continues in coastal proximal areas between major conduit flow routes to produce flank margin caves. The Bahamian Archipelago represents a case history in which tectonics is limited, the rocks are entirely eogenetic and the diffuse to conduit flow transition is demonstrated.

1. Introduction

Coastal karst aquifers are a unique type of aquifer, involving the interplay of dissolutional processes, freshwater lens chemistry and dynamics and sea-level change. The vast majority of coastal karst aquifers in the world are made up of young carbonates that have not yet undergone burial diagenesis, termed eogenetic by Choquette and Pray [1]. Most karst studies from the interior of continents have been done on diagenetically-mature carbonates, which Choquette and Pray [1] termed telogenetic. Karst aquifers can be viewed as a three-part aquifer, with water flow occurring as matrix flow, fracture flow and conduit flow [2,3]. For most telogenetic rocks, matrix flow is minimal as the pore space is small in size and amount and poorly connected; flow is usually through bedding planes and fractures, which serve as the origin points for the water transmission, which subsequently evolves into turbulent conduit flow. Eogenetic rocks retain much of their original depositional porosity, which usually is well connected to provide good matrix permeability. Telogenetic coastal karst aquifers exist, such as Gotland Island off the coast of Sweden or much of the coast of the Adriatic Sea (e.g., [4,5]). World wide, carbonate coasts, most common in tropical and subtropical latitudes, tend to be young and eogenetic in character, reflecting their recent origin in an active carbonate depositional environment (e.g., [6]). The Bahamian Archipelago represents Mid to Late Quaternary eogenetic carbonate islands in a non-tectonic environment. As such, they provide a setting in which karst processes in islands can be studied with a minimum of extraneous factors. The Bahamian geology as utilized for this paper is that provided in Carew and Mylroie [7,8] and Kindler et al. [9].
The characterization and management of water resources on carbonate islands must address the issue of a limited and, to a certain extent, fixed supply of fresh water from meteoric sources. Karst aquifers behave very differently than traditional porous media aquifers; in telogenetic rocks of continental interiors, karst flow is dominated by turbulent conduit pathways, a type of cave development called epigenic, as it is coupled to the surface hydrology (e.g., [2,3]). Caves developed decoupled from surface hydrology, in a diffuse flow environment associated with rising waters are termed hypogenic (e.g., [2,3]). Total aquifer storage in telogenetic carbonate rocks is low as matrix porosity is minimal. In eogenetic island karst aquifers, matrix flow of a diffuse nature dominates water transmission, and extensive storage is primarily within the matrix. Over time, dissolution within the matrix produces touching-vug flow [10], which increases aquifer hydraulic conductivity, resulting in the lens thinning over time, as head requirements to induce seaward flow are reduced. In both epigenic and hypogenic karst situations, the aquifer undergoes self-modification by dissolution to a greater extent than any other kind of aquifer system. As eogenetic karst aquifers mature, preferred flow routes enlarge and integrate, while portions of the aquifer outside of these flow routes infill with carbonate cement [10]. Overall aquifer porosity decreases, while overall permeability increases as the karst system matures.

2. Islands as Models of Coastal Karst Aquifers

The study of carbonate islands, such as those in the Bahamian Archipelago, has been useful compared to extensive eogenetic carbonate coasts on continents, such as in Quintana Roo State on the Yucatan Peninsula of Mexico. Islands offer constraints on the size of the aquifer system and isolation from external sources of flow. The Carbonate Island Karst Model (CIKM) was developed to explain the constraints and controls under which island karst systems operate [11,12]. The CIKM views carbonate islands in the following framework:
  • Mixing of fresh and salt water at the boundaries of the freshwater lens creates dissolutional potential that results in a localized area of preferential porosity and permeability development. The collection of organics at the top and bottom of the lens (water table and halocline or mixing zone, respectively) may also enhance dissolution. The maximum amount of dissolution occurs at the lens margin, where the water table and halocline mixing zones, and their associated organics (e.g., [13]), are superimposed and where lens flow velocities are fastest as the lens thins. The increase in flow velocity allows reactants to enter, and products to exit, in a manner that keeps forward dissolutional reactions active.
  • Sea-level change, which also moves the position of the freshwater lens both vertically and laterally.
    • Glacioeustacy has moved sea-level, and thus the freshwater lens position, upwards and downwards relative to present conditions by more than 100 m throughout the Quaternary.
    • Local tectonic movement, sediment compaction and isostatic adjustment can cause sea-level overprinting of dissolutional and diagenetic features developed during different glacioeustatic events (e.g., [14]).
  • The karst is commonly eogenetic in that it has developed on rocks that are young and have never been buried below the zone of meteoric diagenesis; however, telogenetic rocks do occur on carbonate islands and coasts. In eogenetic carbonates, matrix flow is an important component.
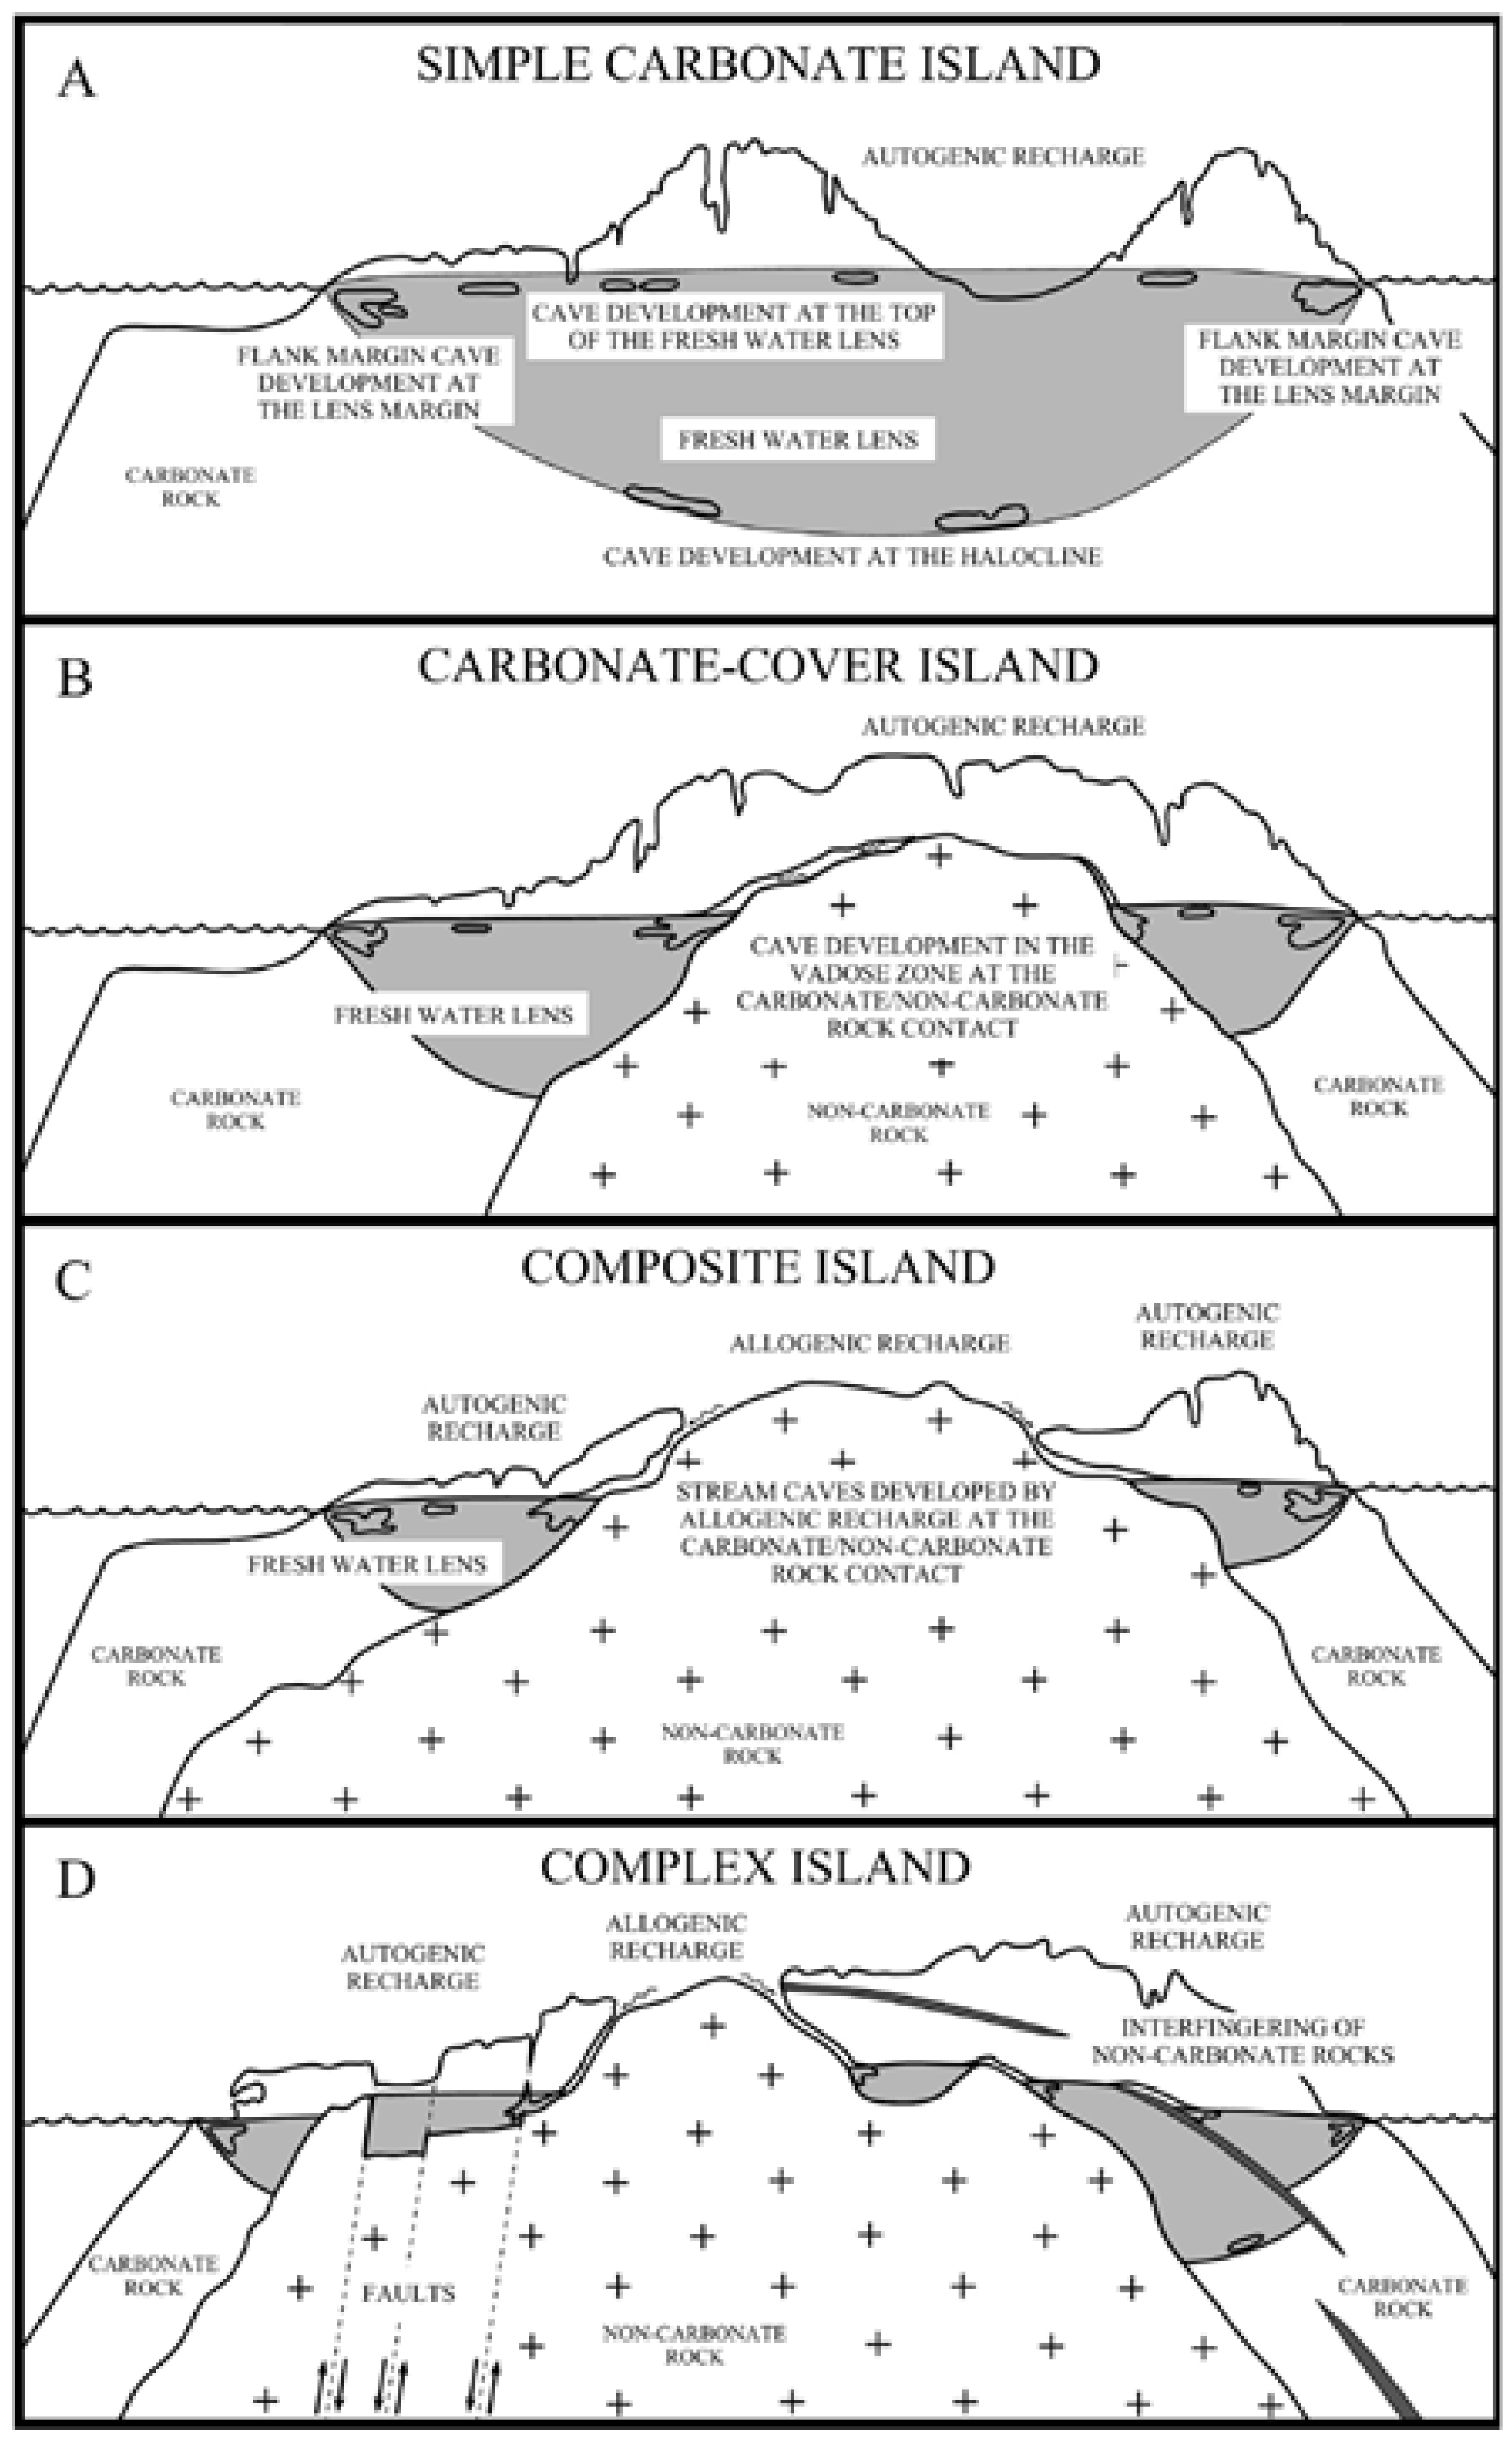
  • Carbonate islands can be divided into four categories based on carbonate and non-carbonate relationships and sea-level (Figure 1).
    • Simple carbonate island: Only carbonate rocks are present within the range of the freshwater lens position as controlled by sea-level (Figure 1A). The meteoric catchment is entirely autogenic, and flow within the freshwater lens is controlled entirely by the properties of the carbonate rock. The Bahamian Archipelago is an example of simple carbonate islands.
    • Carbonate-cover island: Only carbonate rocks are exposed at the surface, and the catchment is entirely autogenic (Figure 1B). Non-carbonate rocks exist under the carbonate rocks and may partition and influence flow within the lens, including perched conduit flow at the carbonate and non-carbonate contact. Bermuda (at a glacioeustatic sea-level lowstand) is an example of a carbonate-cover island.
    • Composite island: Both carbonate and non-carbonate rocks are exposed at the surface (Figure 1C), allowing for both allogenic and autogenic catchment. The lens is partitioned, and perched conduit cave systems can develop at the contact of the carbonate and non-carbonate rocks. Barbados and Guam are examples of composite islands.
    • Complex island: Carbonate and noncarbonate rocks are complexly interrelated by depositional relationships and/or faulting (Figure 1D). Perching, isolation and confining of the freshwater lens is possible. Saipan is an example of a complex island.
The four-part classification of islands as simple, carbonate-cover, composite and complex is an idealization. For islands such as the Bahamian Archipelago, the simple classification is quite accurate. For an island such as Guam, the north half is carbonate-cover while the south half is composite [15]. Oahu in the Hawaiian Archipelago is almost an entirely volcanic island, but does contain some carbonate outcrops that host karst and caves; classifying it as a composite island therefore fits the CIKM, but fails to appreciate the overall island character. The four-part island classification scheme is simply a tool to broadly characterize islands or portions of islands, to better separate the interplay of overall island geology on how karst aquifer flow occurs.
The CIKM does not take into account island size; it was developed for small islands, to constrain spatial conditions, much as Vacher [
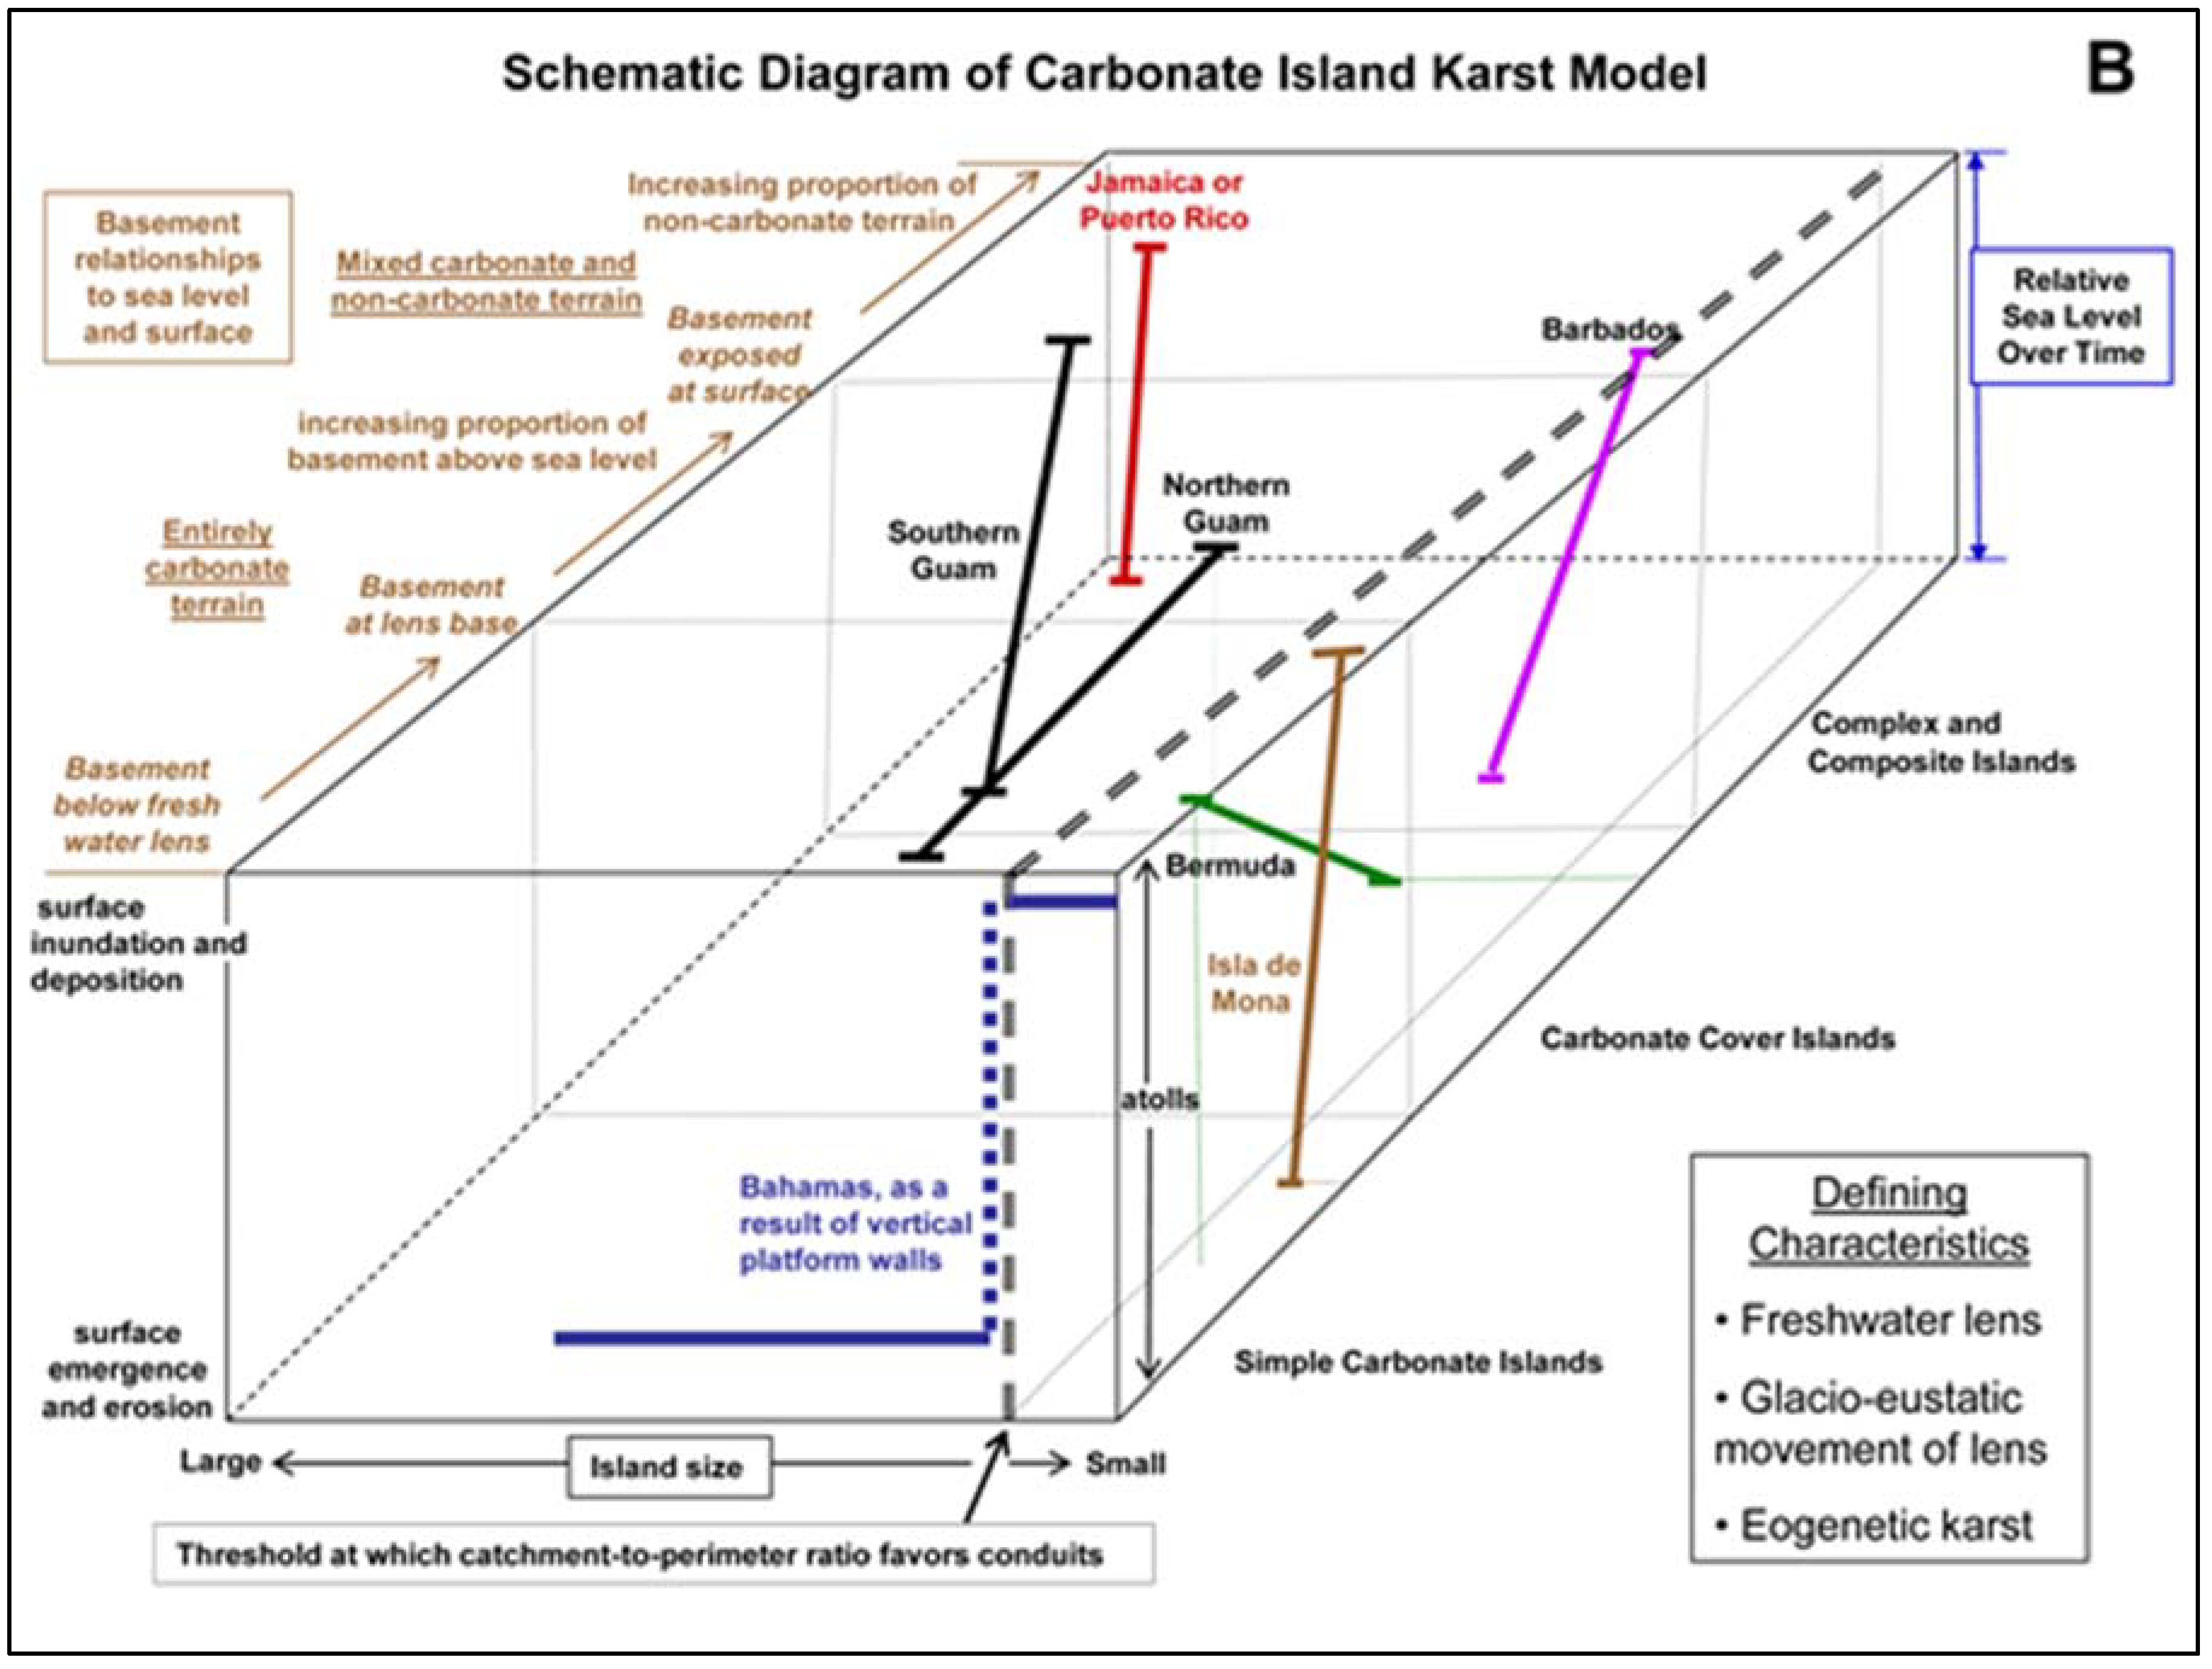
16] did by configuring his model carbonate islands as linear strips. There are important implications of island size that must be considered, and this paper will address that situation. The CIKM can also be visualized as a three-dimensional construct (Figure 2A), in which the long horizontal axis of the box represents island category, the short horizontal axis of the box represents island size and the vertical axis of the box represents sea-level [17]. Islands can be placed within the box to display their current condition and how those trajectories change as conditions change, for example sea-level (
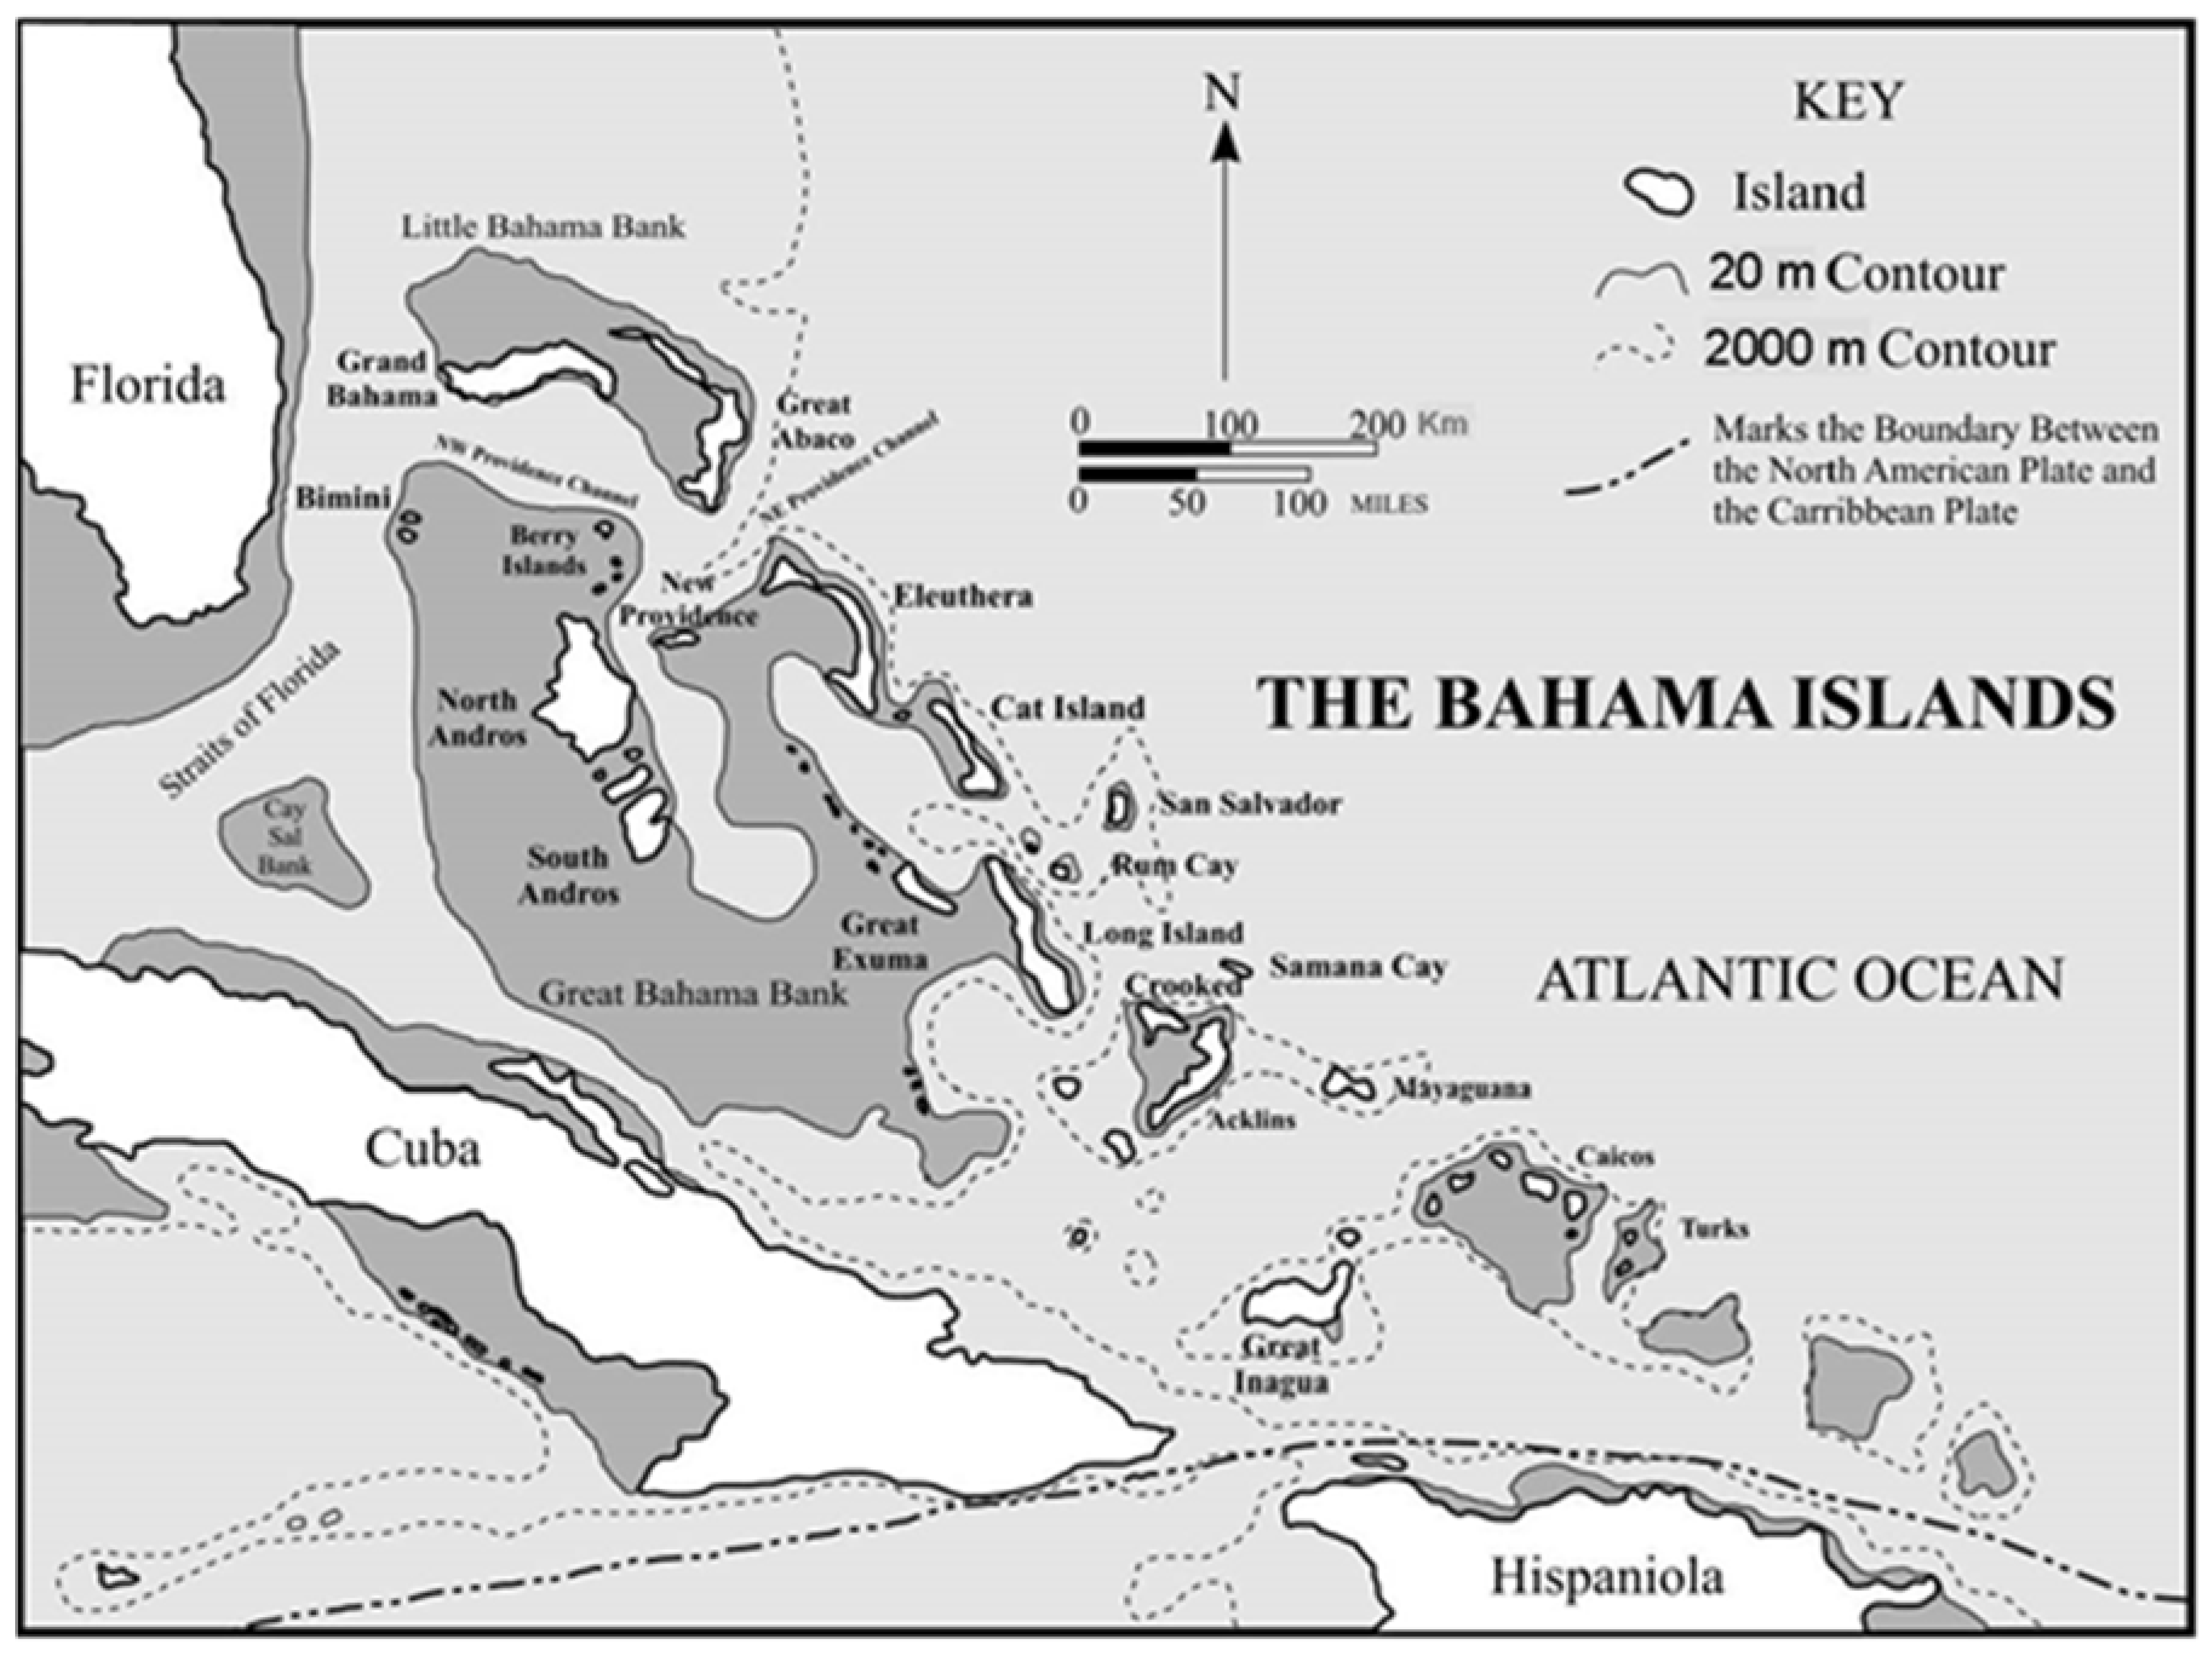
Figure 2B). Sea-level fall makes the Bahamian Archipelago transit abruptly, from small to large islands; the abrupt transition is due to the vertical nature of the platform walls (Figure 3). Bermuda moves from a simple carbonate island to a carbonate-cover island as the drop in sea-level lowers the freshwater lens in contact with the underlying volcanic edifice, which then partitions the lens. Barbados, Jamaica and Puerto Rico all show more relative carbonate exposure as sea-level falls and offshore lagoons are exposed. Isla de Mona covers almost all of its small bank; its carbonate outcrop increases slightly as sea-level falls. Guam shows two trajectories, depending on which portion of the island is considered.
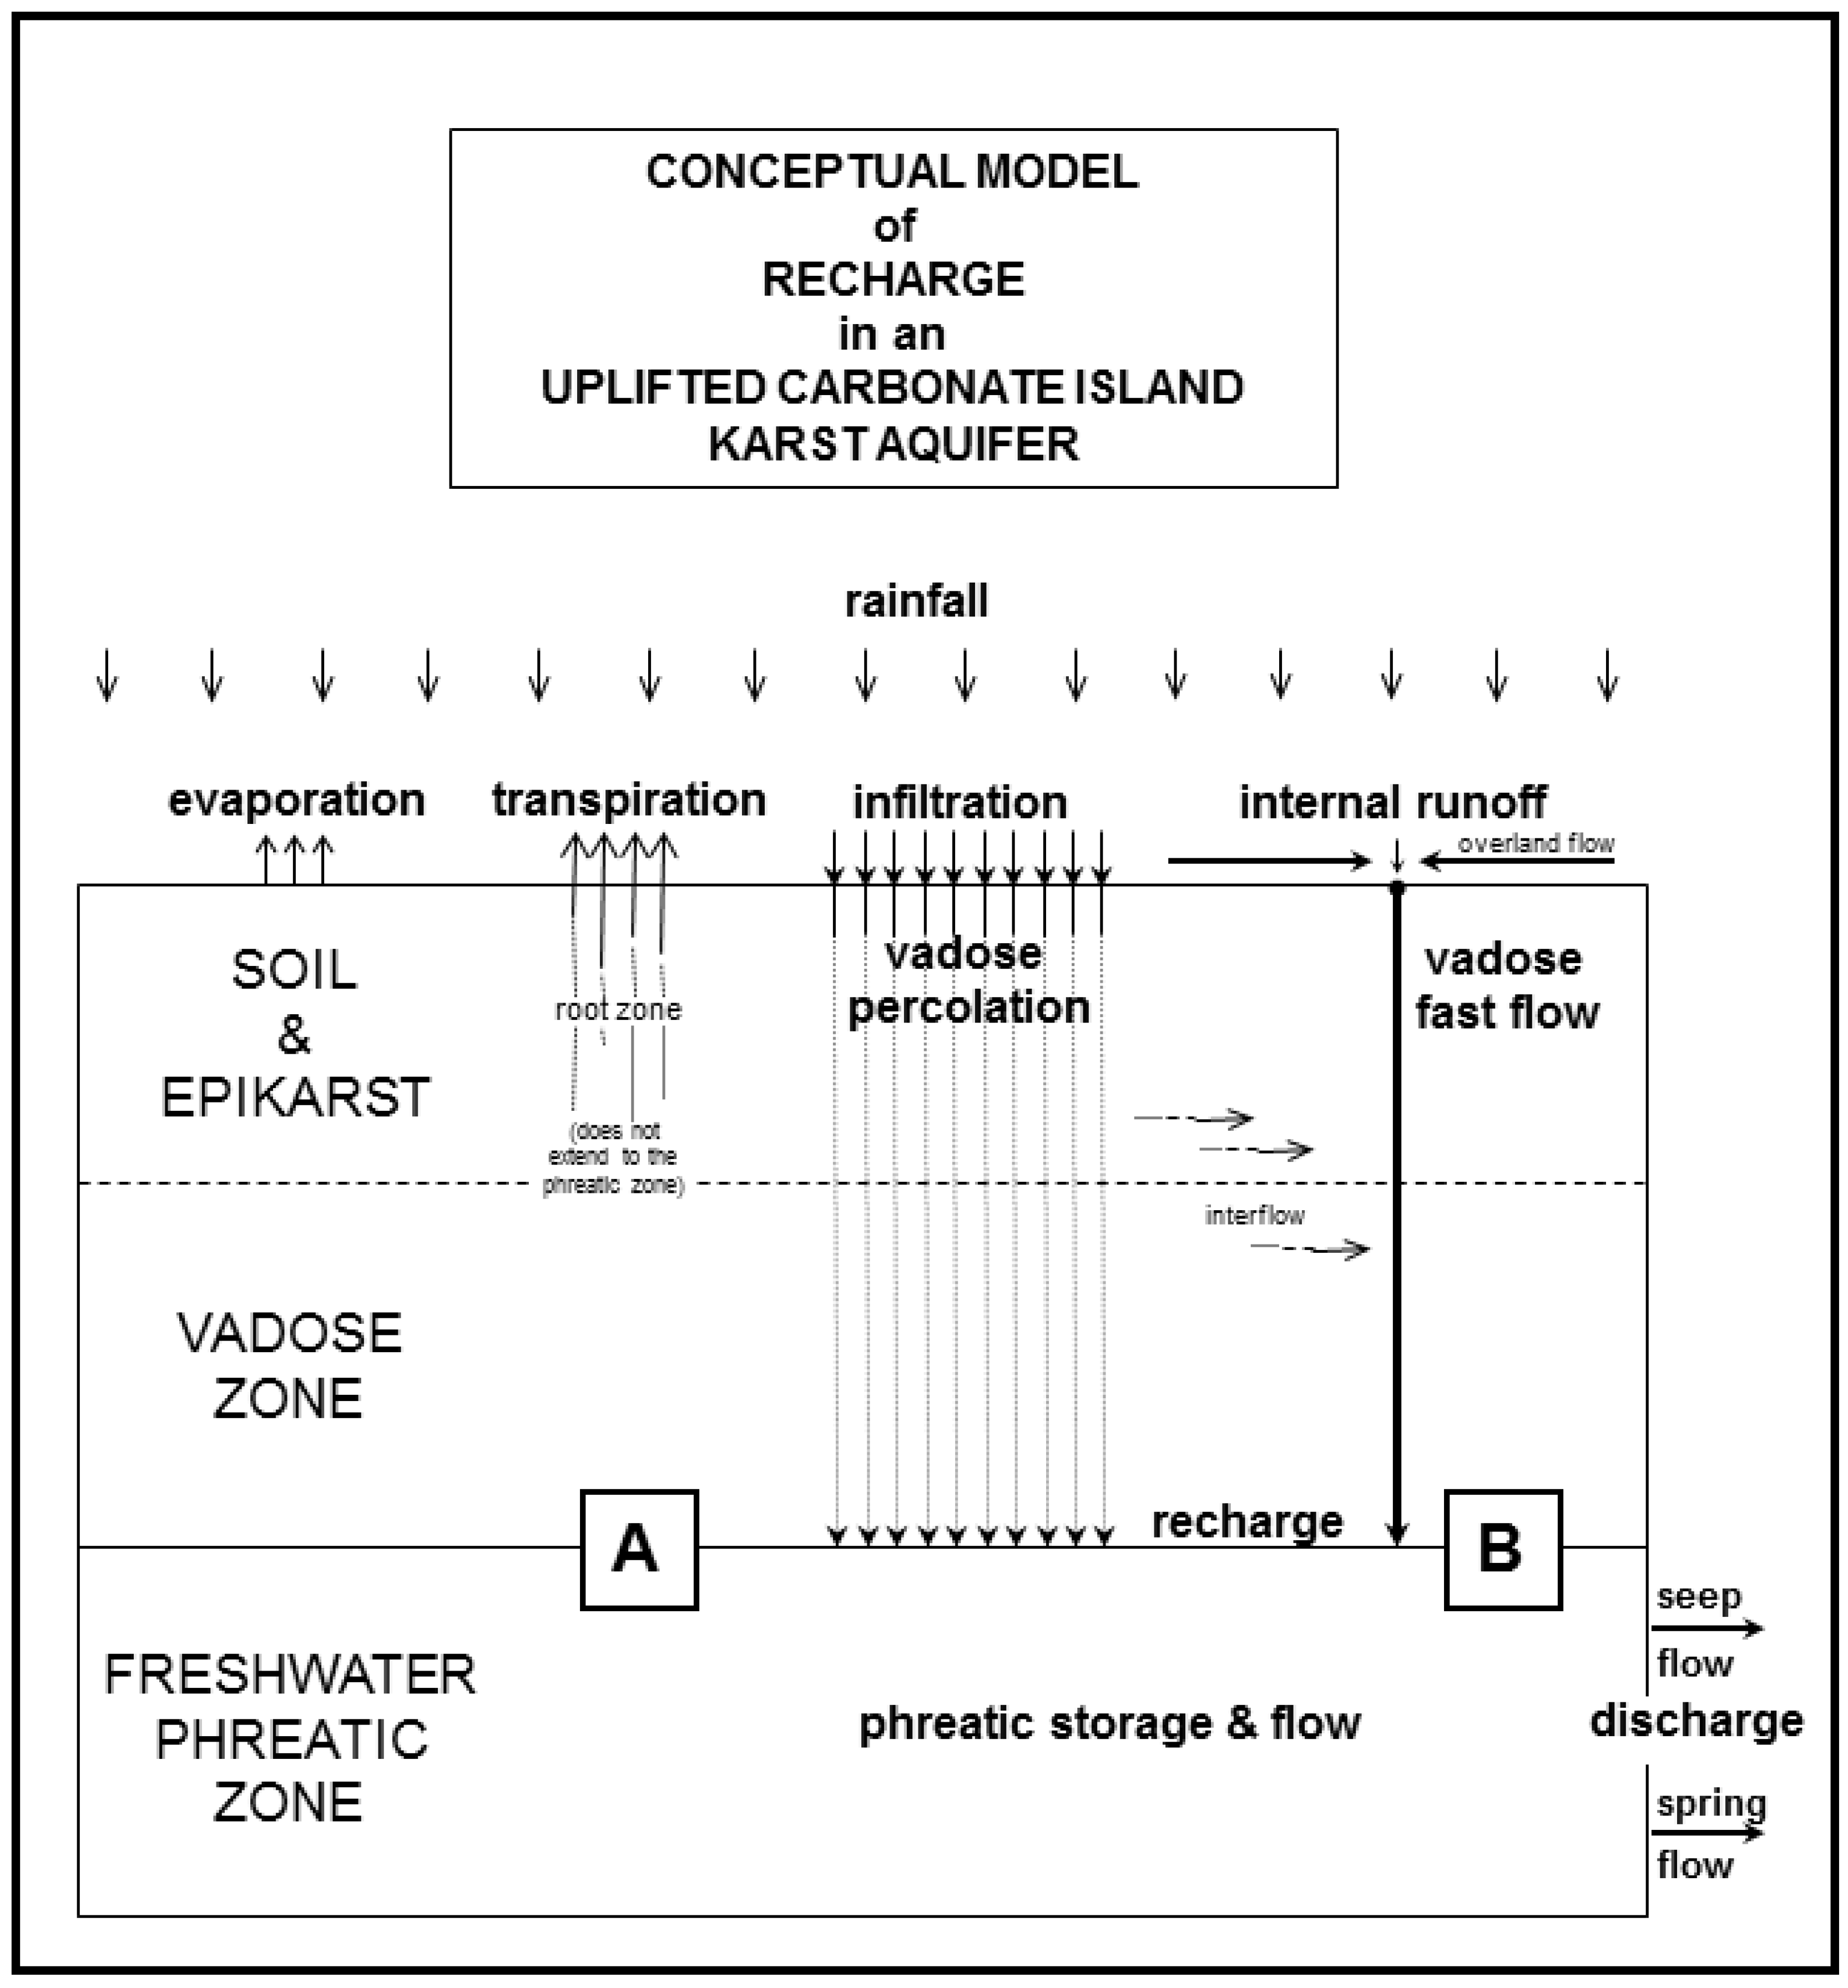
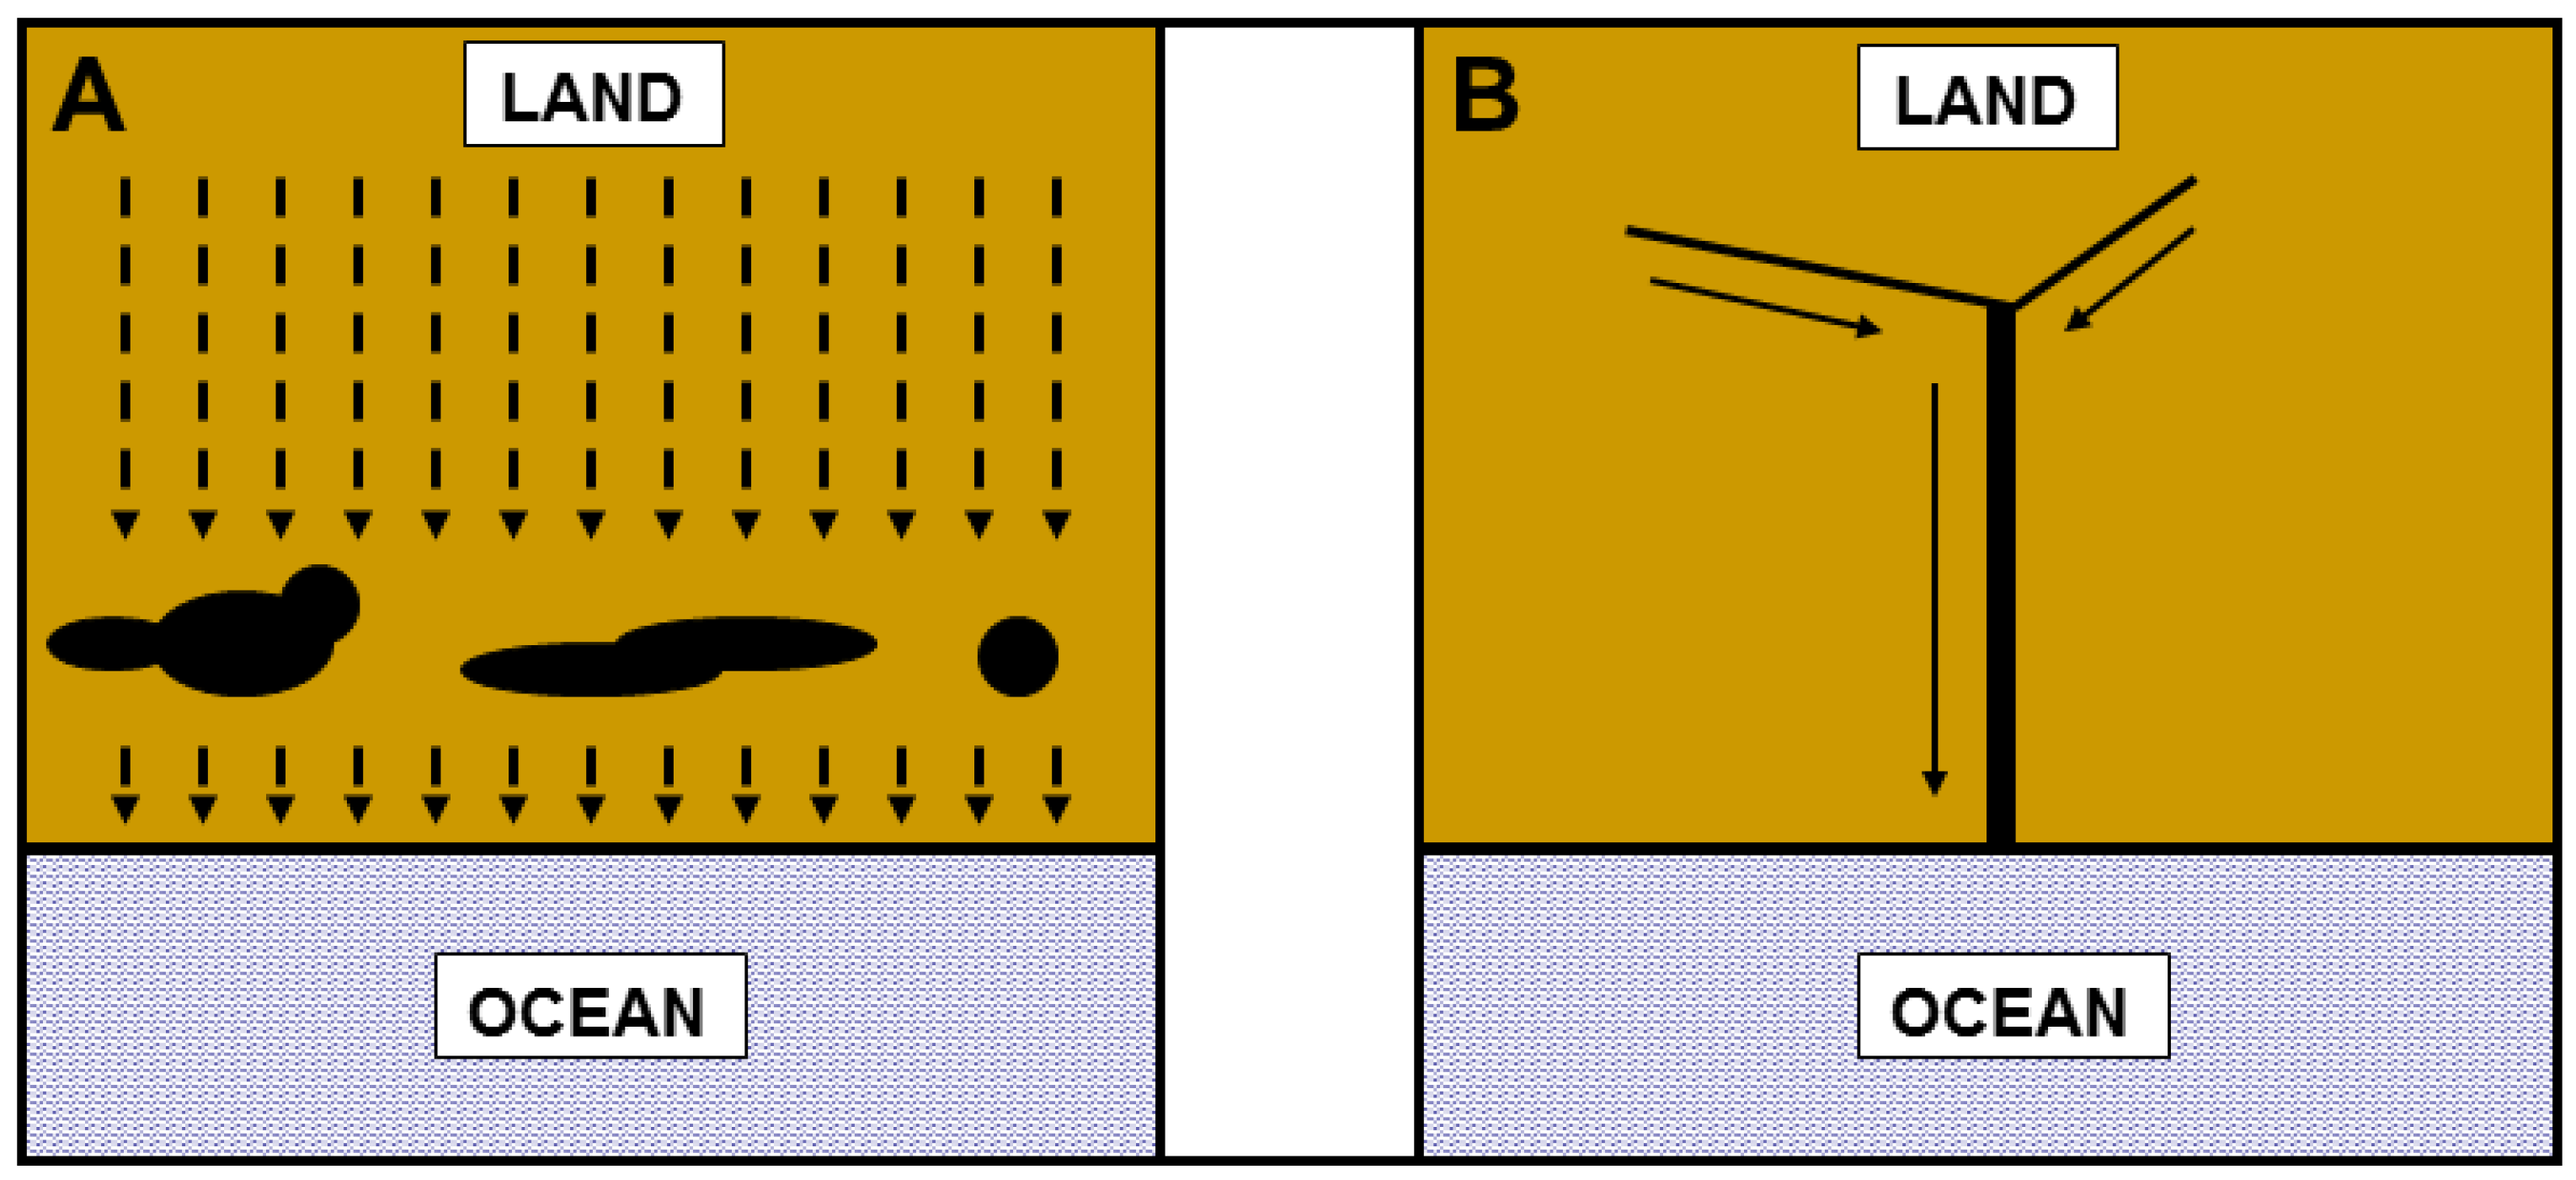
The nature of the aquifer recharge, autogenic versus allogenic, has geochemical and flow dynamic implications. Meteoric catchment directly onto the carbonate outcrop is autogenic, and the dissolutional potential of that meteoric water as it descends through the vadose zone is progressively consumed (Figure 1A,B). For eogenetic carbonates, the vadose flow is commonly diffuse through the matrix porosity, but calcrete crusts on the surface can locally concentrate flow into small discrete inputs called vadose fast-flow routes, observed in the field as pit caves (Figure 4). Such fast-flow routes help explain why monitoring of the freshwater lens can show long response times to meteoric events at some observation points, as at Point A in Figure 4, and immediate response times at others, as at Point B in Figure 4, a result of the proximity of the monitoring site to such a fast-flow route; closer means a faster lens reaction time. Allogenic flow is meteoric recharge captured on adjacent non-carbonate rocks, which then flows, as an identifiable stream, onto the carbonates (Figure 1C,D). Such allogenic water has lost little of its dissolutional potential when first contacting the carbonate rocks and does so as a large flow volume. Such water penetrates the carbonate rock and can travel significant distances into the carbonate aquifer before its dissolutional potential suffers a major reduction.
Sea-level rise as a result of climate change is an immediate problem for coastal karst aquifers, as it changes the balance between the position of the freshwater lens and sea-level. Sea-level rise also migrates the lens margin inland. Associated climate change, such as rainfall variation, can affect the amount, quality and sustainability of island freshwater resources. The current rise in sea-level therefore is having an immediate impact on freshwater lenses in carbonate islands around the world.
The lens margin is a site of preferred dissolution, and as a result, megapores or caves develop in the diffuse flow regime of the lens margin. As this cave development occurs under the flank of the enclosing land mass, these caves are termed flank margin caves. These caves are considered a subdivision of the hypogene cave category [19], as they develop decoupled from surface hydrology, lack turbulent flow and involve mixing chemistry with sea water in the subsurface. Flank margin caves are restricted in their development to the lens margin at the time of their formation, and abandoned flank margin caves therefore reveal past sea-level position. They form without humanly-accessible entrances and can be entered only after erosive processes or cave collapse have breached them to the surficial environment. They can exist as isolated chambers, collections of chambers or large integrated chamber amalgamations, always aligned with the strike and position of the lens margin at the time of their formation. The degree to which the chambers interconnect is in part controlled by how long the freshwater lens was stable at a single elevation. The largest flank margin caves in the world, such as Sistema Faro on Isla de Mona, Puerto Rico, are relicts from the more stable sea-levels of the Pliocene, prior to the high amplitude, short wavelength glacioeustatic conditions of the Quaternary [20].
To evaluate void production in the subsurface requires understanding the different outcomes associated with hypogenic flank margin cave development and epigenic conduit cave development. This situation is illustrated in Figure 5. Flank margin caves are oriented parallel to the coast, a 90° difference from the conduit flow cave orientation draining the interior. Contaminant transport is entirely different between the two examples. The location of subsurface voids, either as a karst collapse hazard if the voids are shallow or as paleokarst hydrocarbon reservoirs if the voids are at a depth, requires understanding the nature of the karst system at work.

3. The Consequences of Island Size

Island size is an important factor in determining which type of flow system develops within a freshwater lens. If the island is small, and in eogenetic carbonates, the island interior is everywhere close to the island perimeter, and diffuse flow efficiently delivers captured meteoric water from the freshwater lens to the sea. Mylroie and Vacher [22] and Vacher and Mylroie [
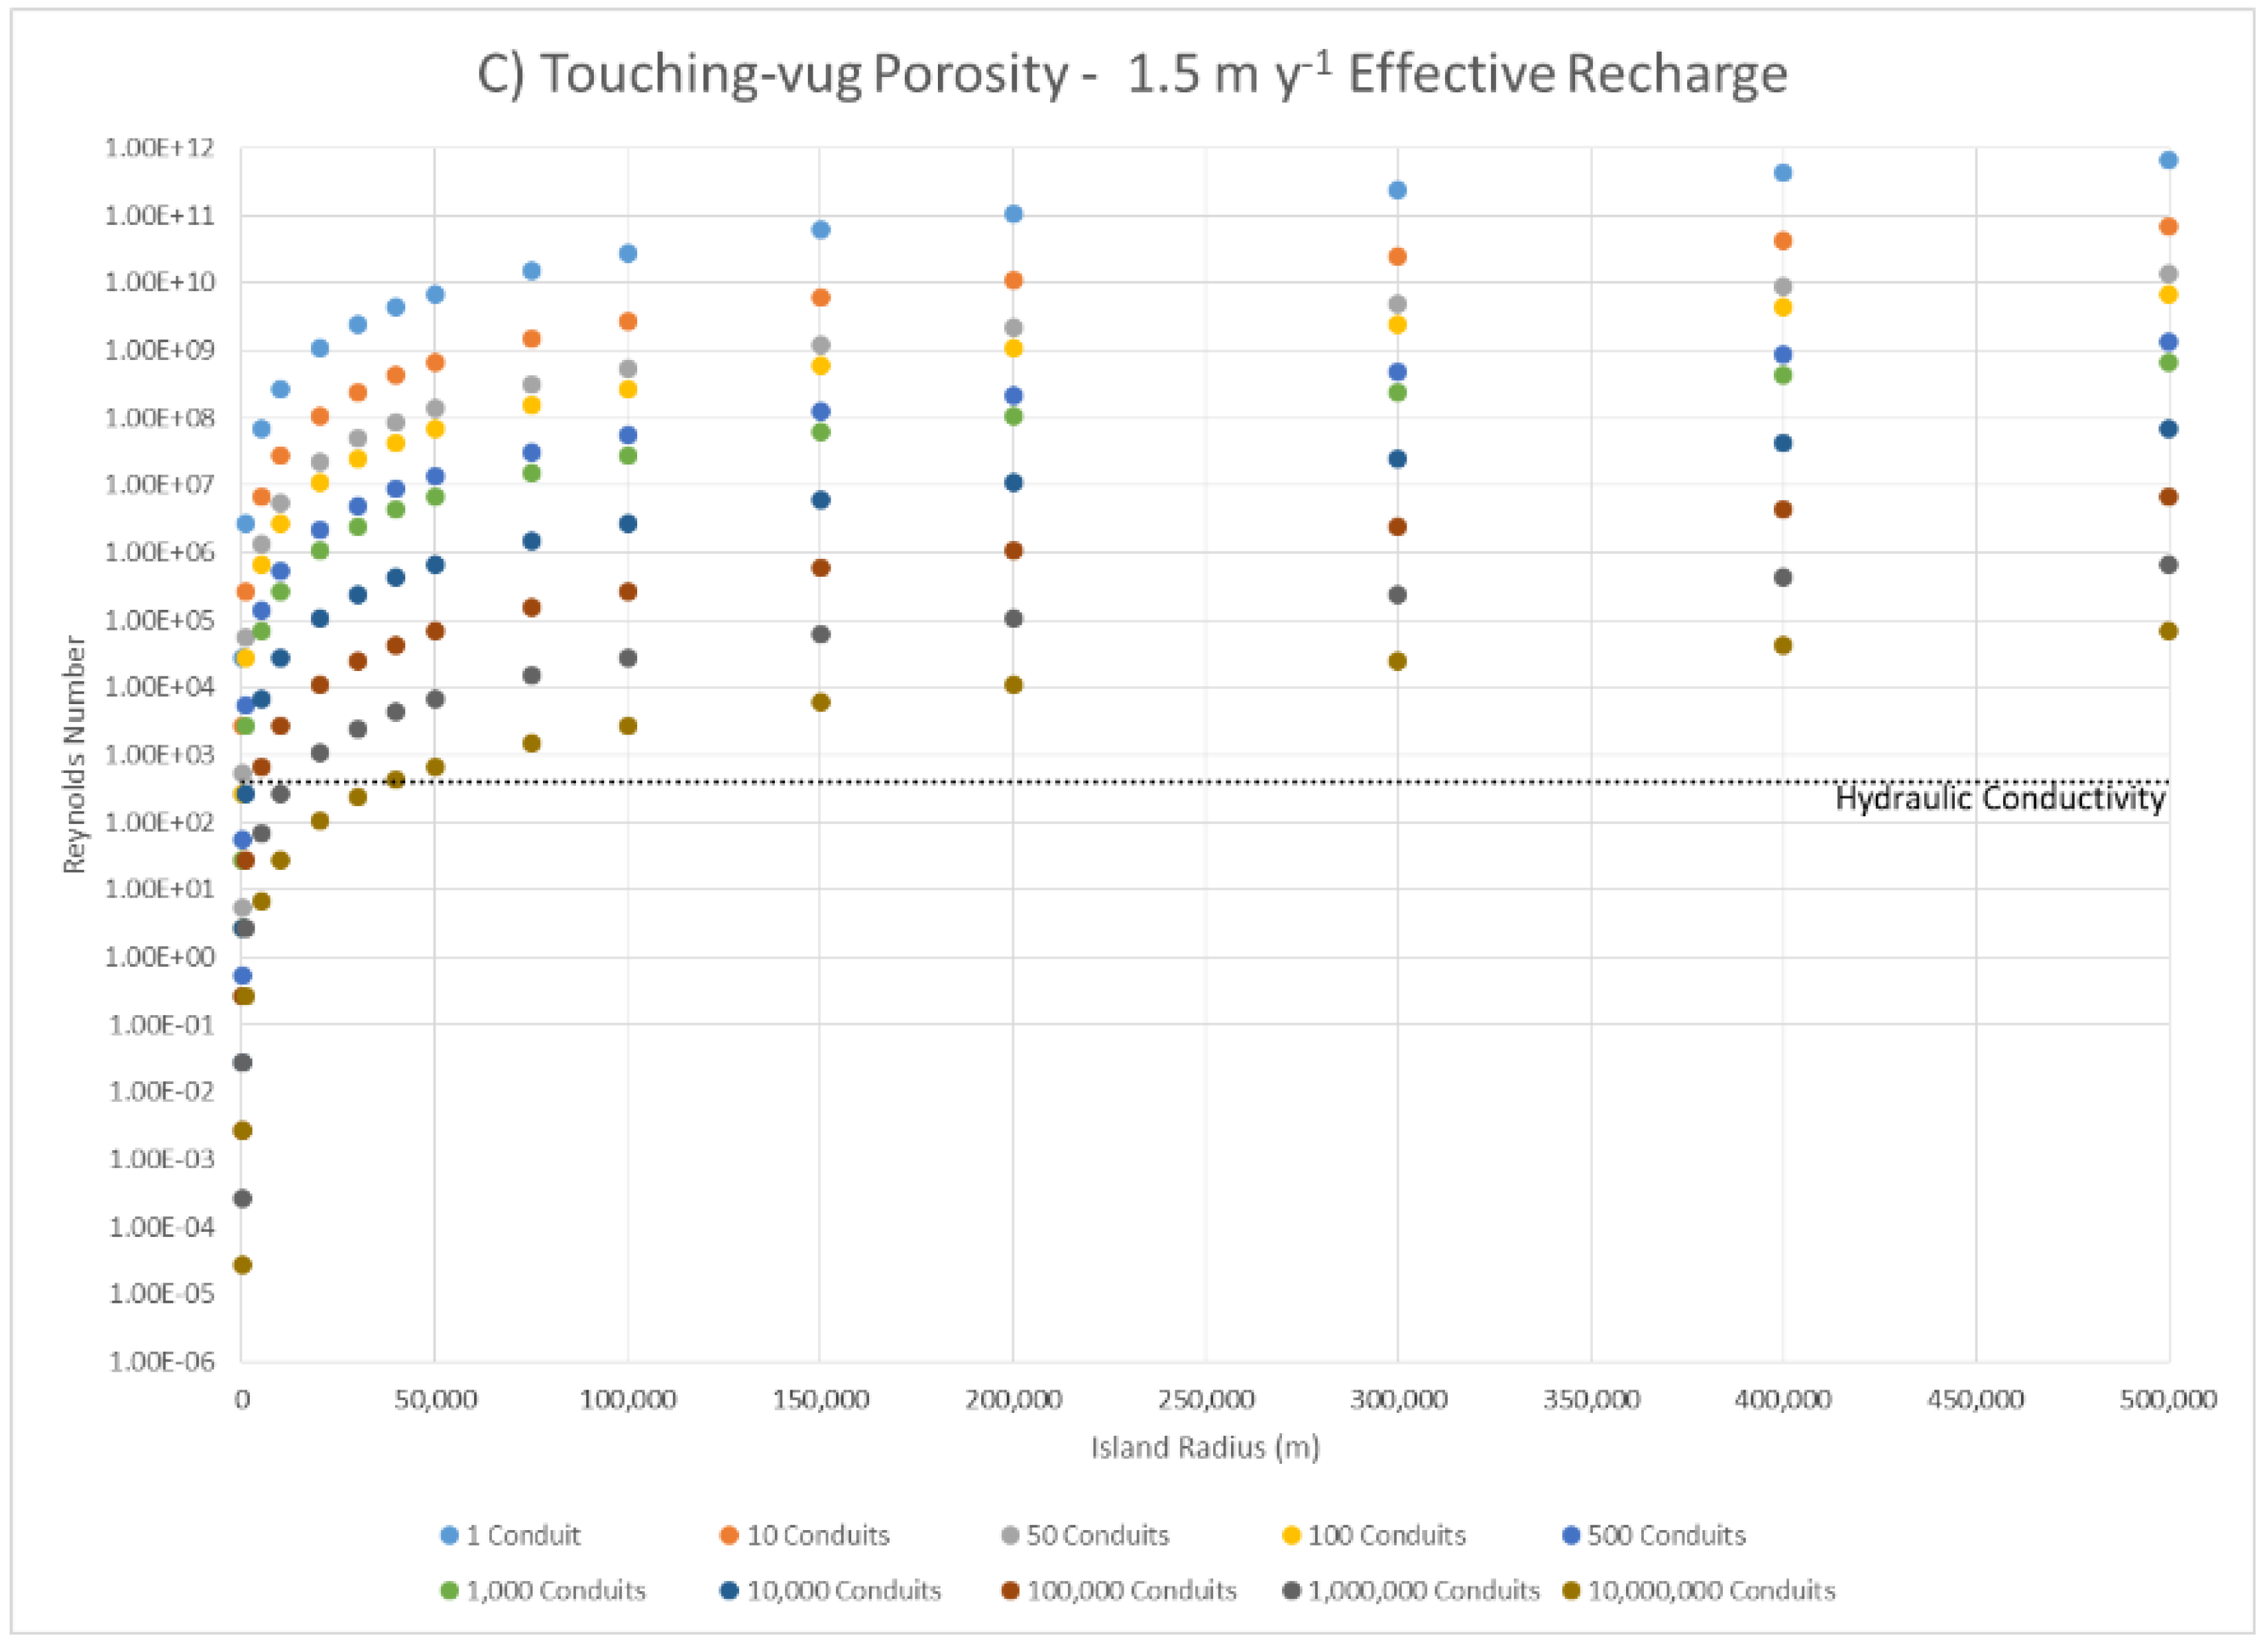
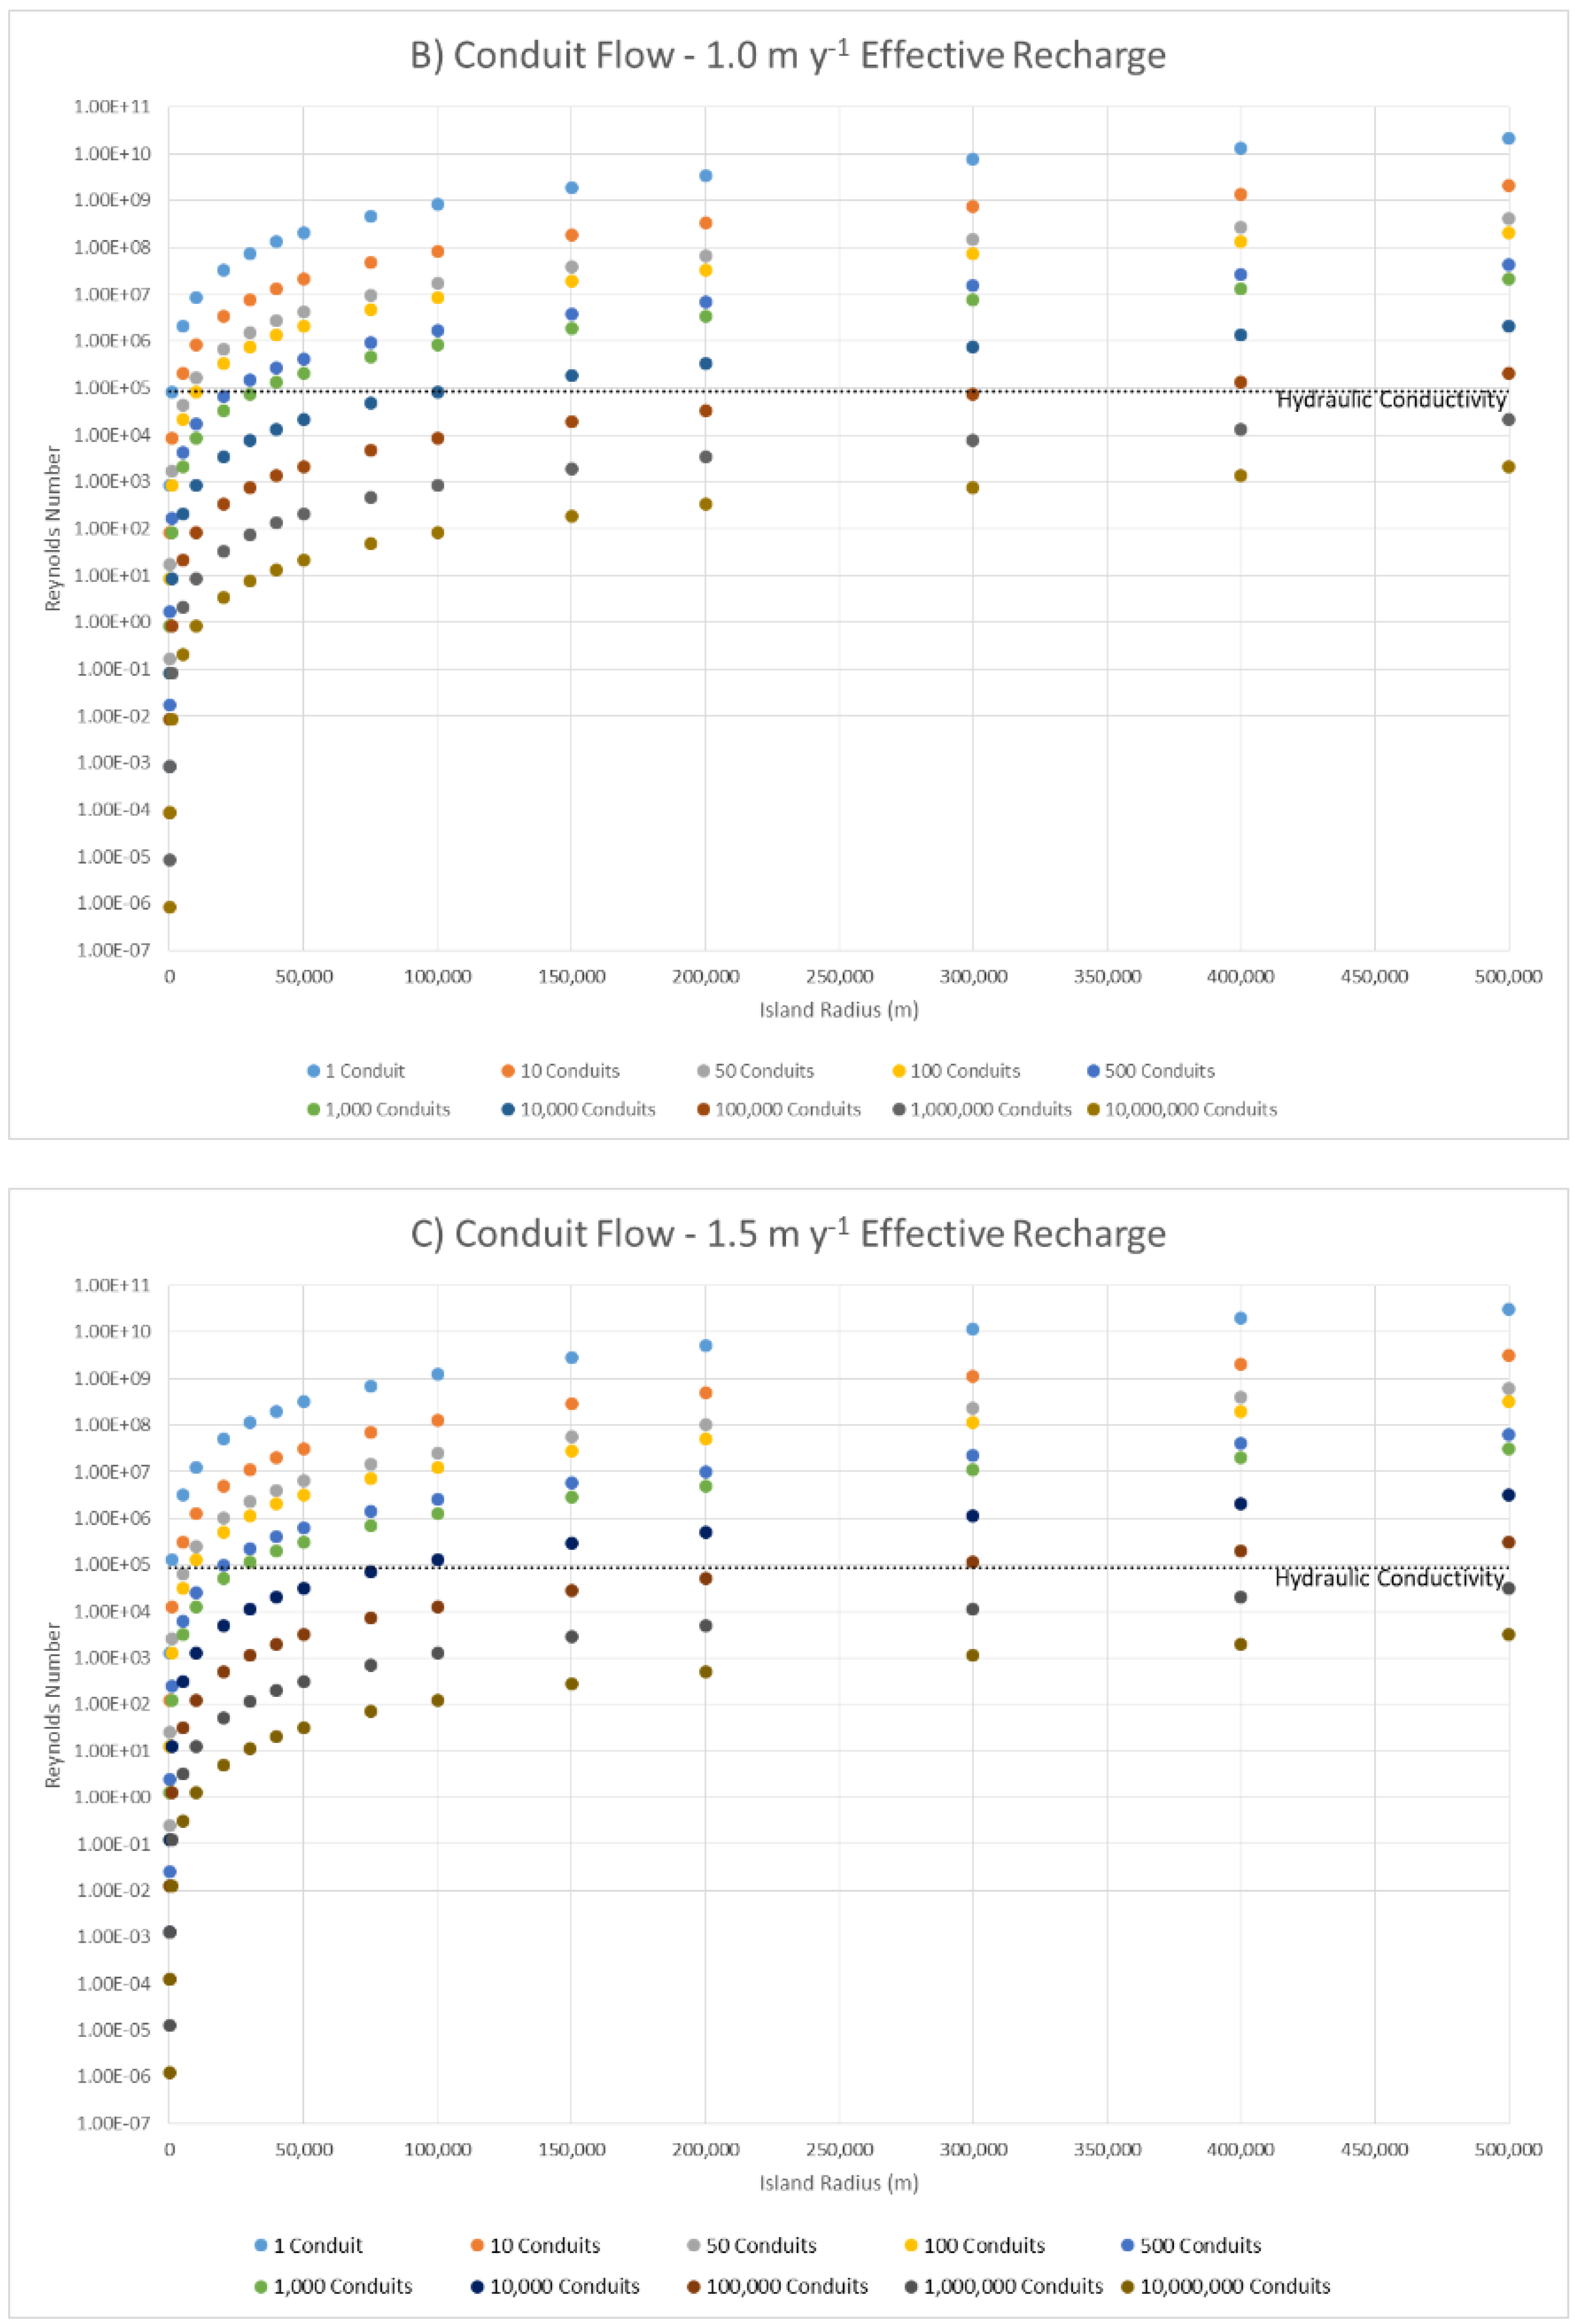
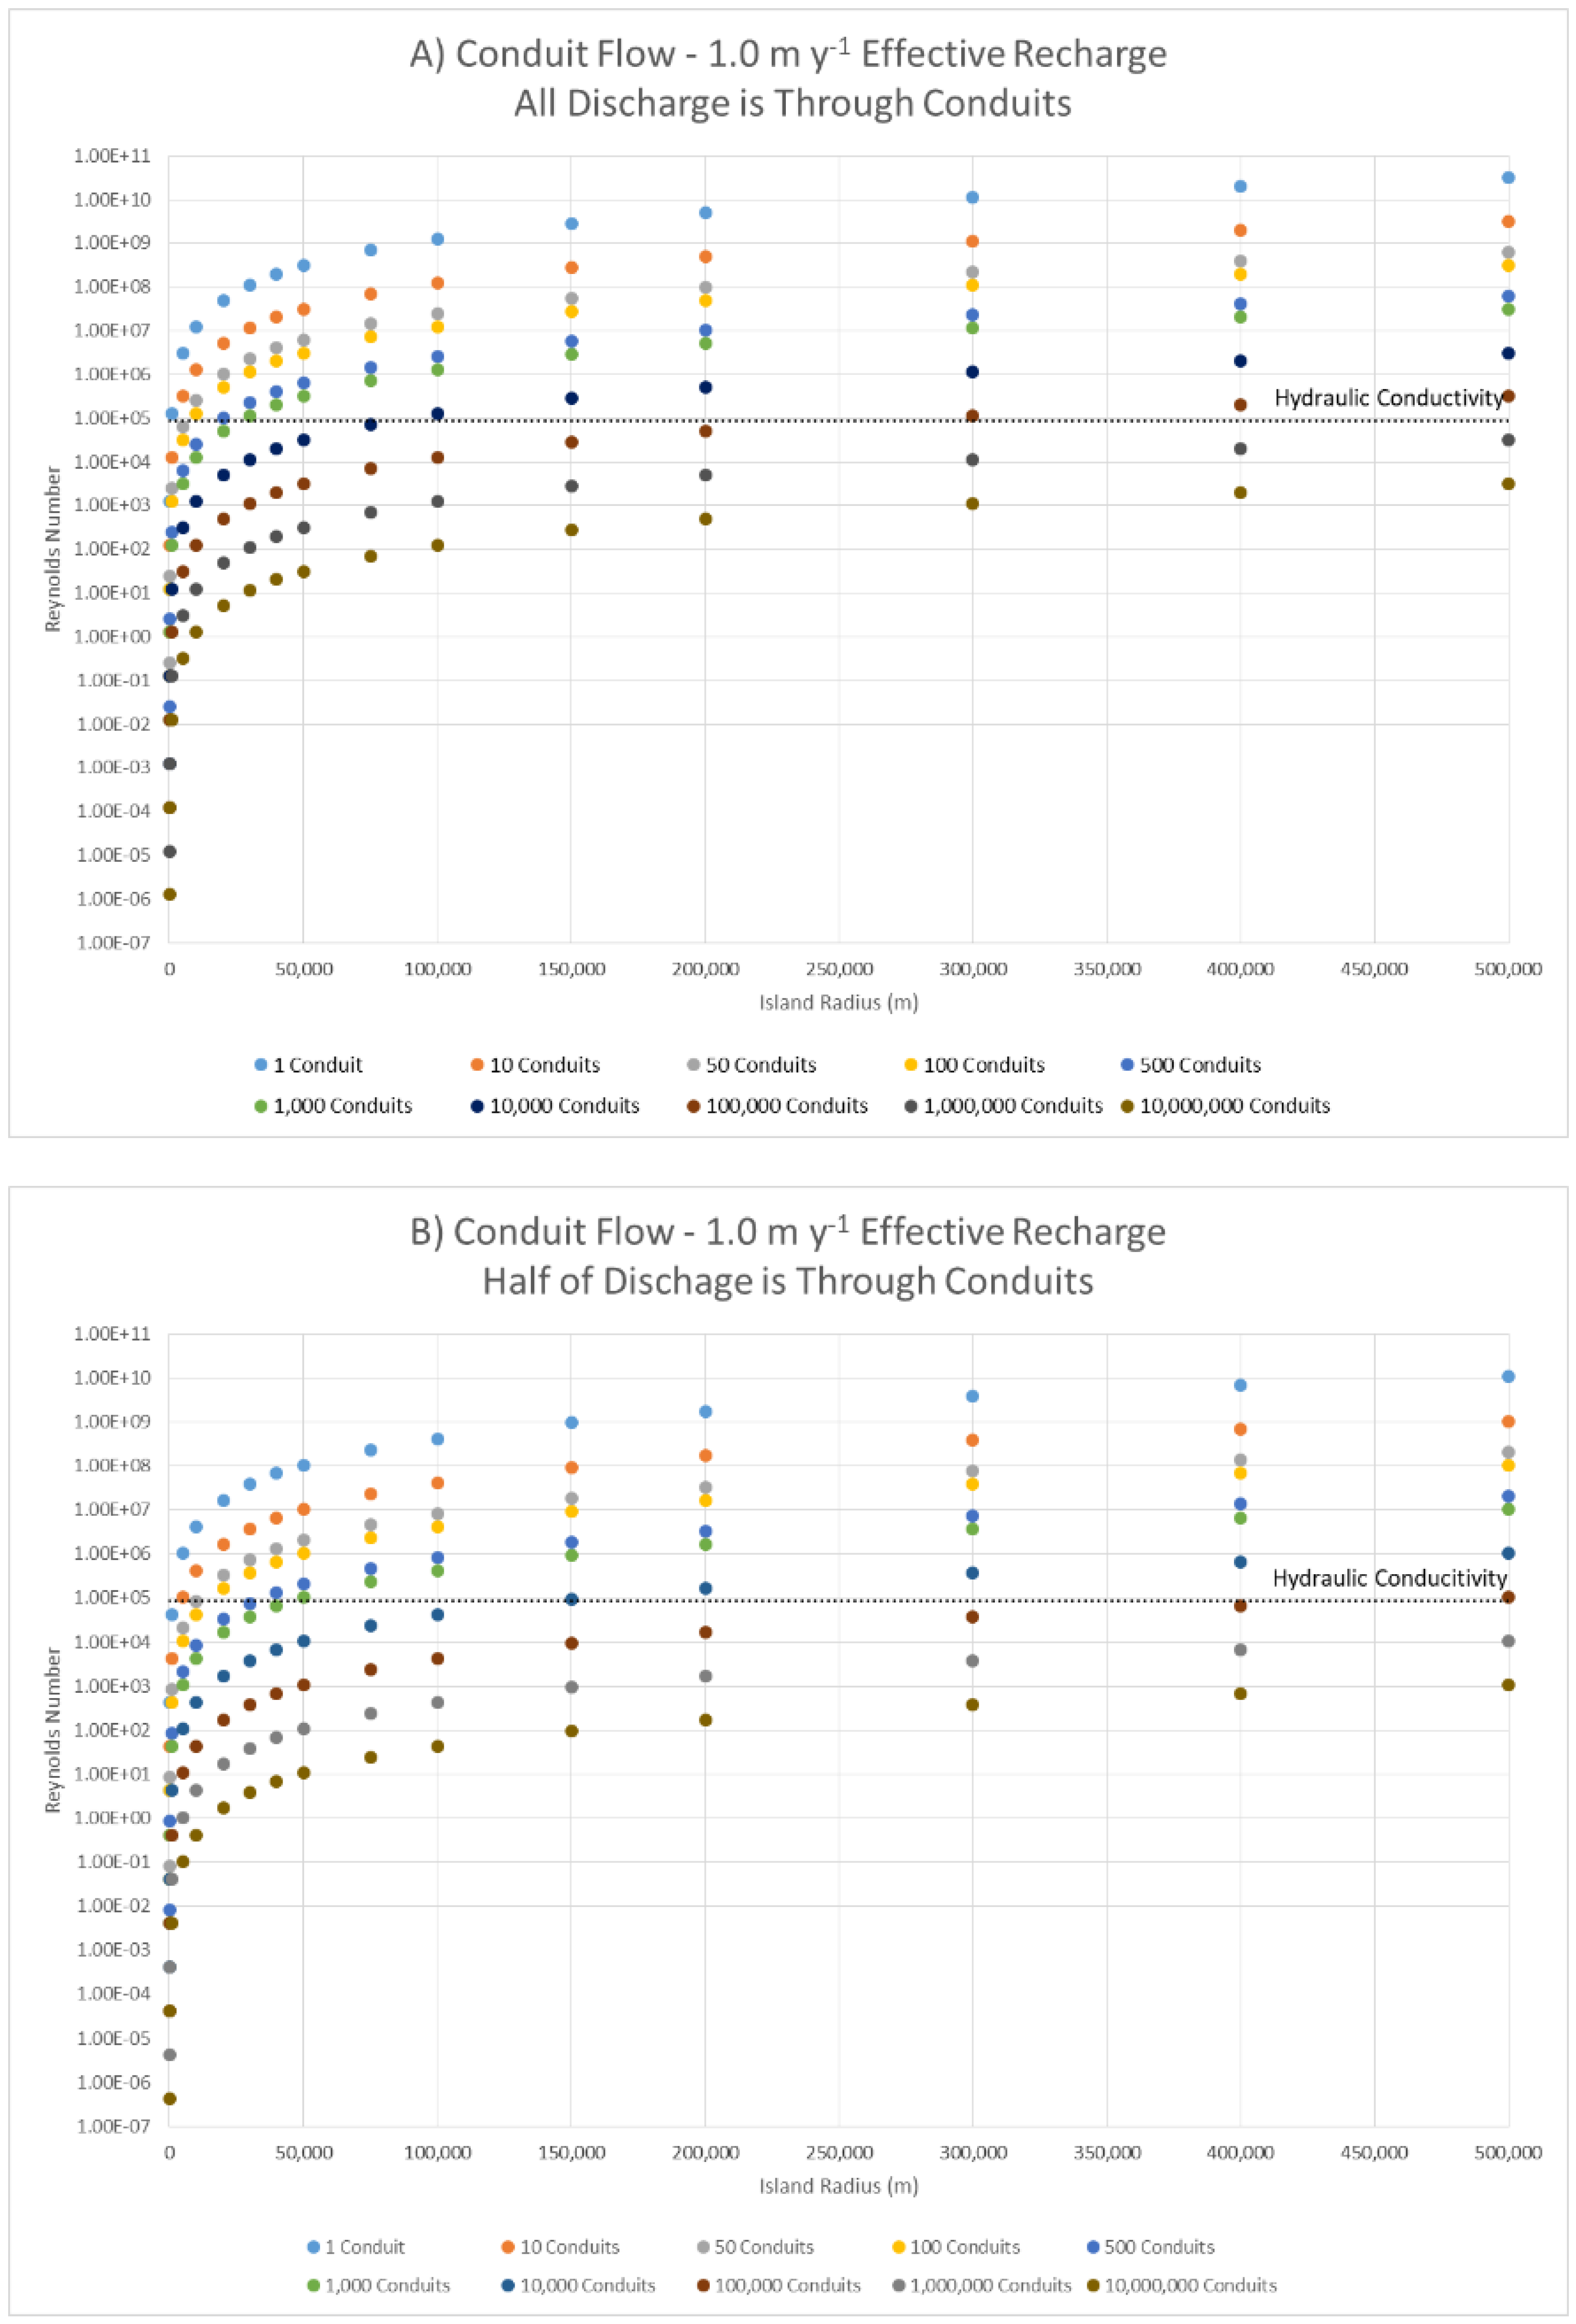
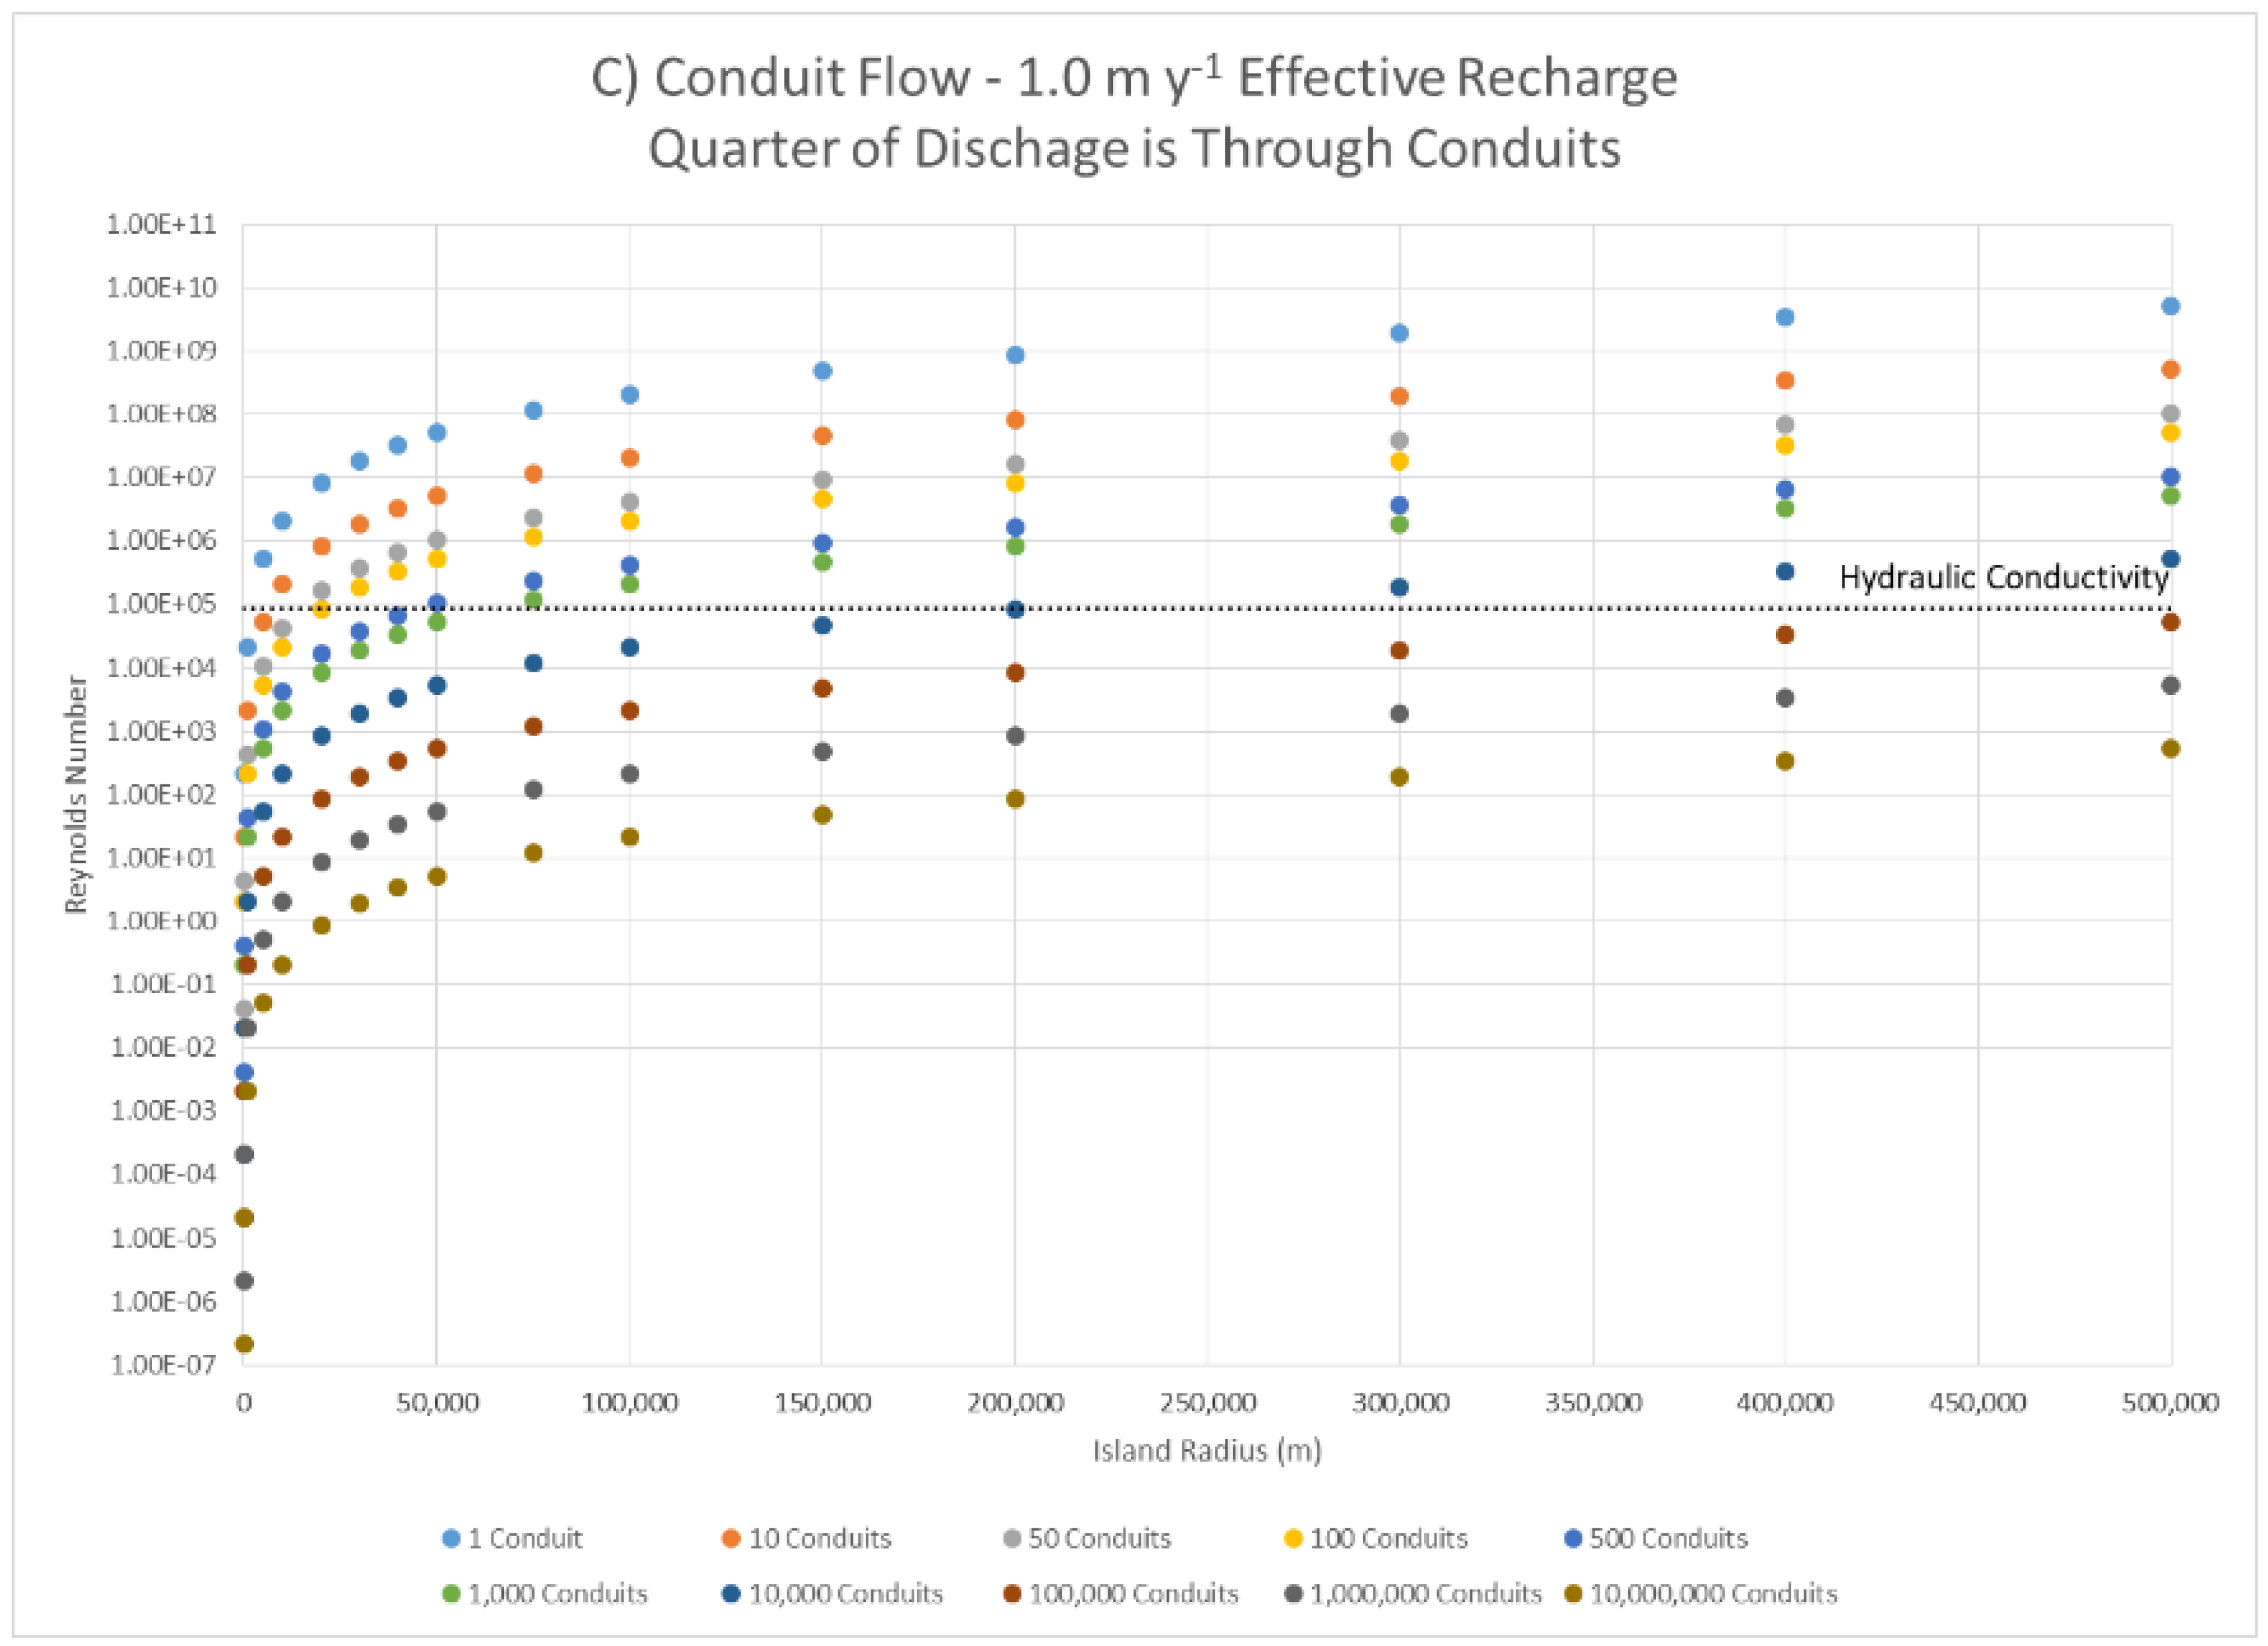
10] proposed that as island size increases, the island area responsible for meteoric catchment increases by the square, but the island perimeter, responsible for lens discharge, increases only linearly. The heads necessary to force water flow to the sea increase, and the touching-vug permeability of the eogenetic carbonates evolves into a turbulent flow conduit pathway. Do field relationships on carbonate islands support this hypothesis, and can it be quantitatively modeled?
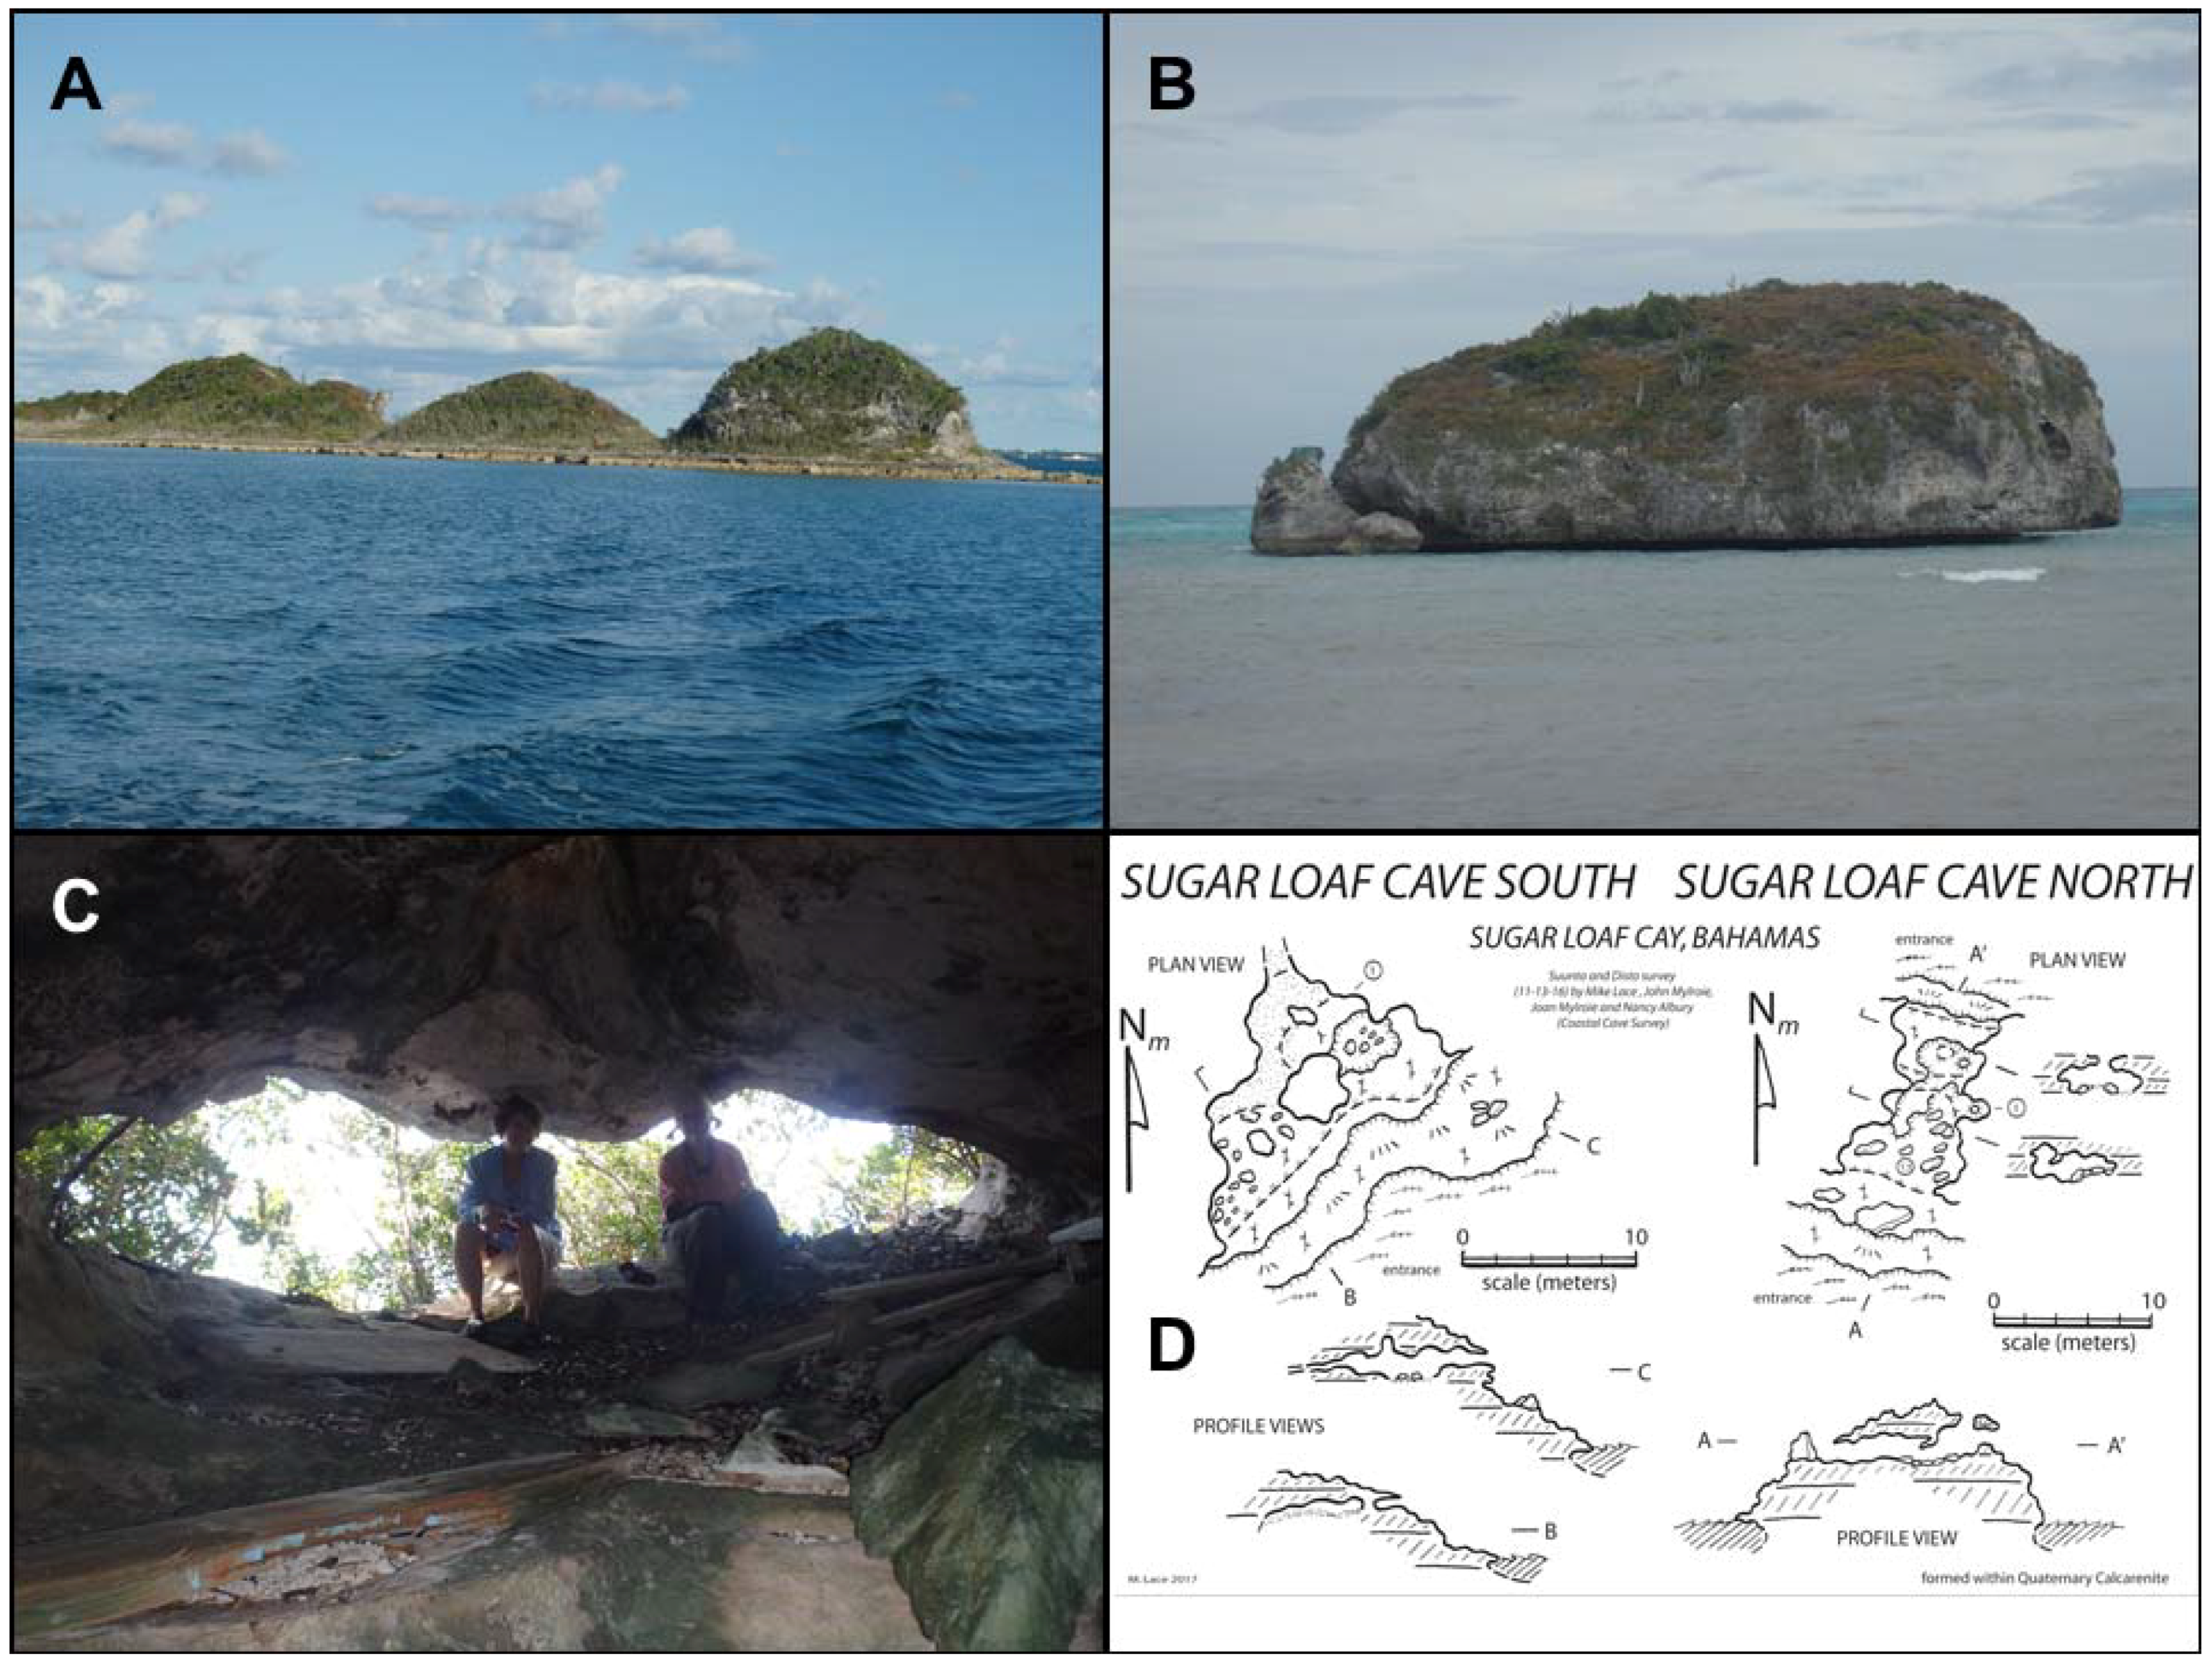
How small of an island can hold a freshwater lens? Eolian ridges in the Bahamian Archipelago contain dry flank margin caves. Most of those caves formed during the +6 m sea-level highstand of the last interglacial, Marine Isotope Stage 5e (MIS 5e), which occurred 115–124 ka [23]. In some cases, these ridges are only 10 m high, 20 m wide and 50 m long and would have been very small islands during MIS 5e. Yet, they contain flank margin caves formed in a small freshwater lens (Figure 6). The key issue then becomes how big does an island have to be in order to create a switch to conduit flow?
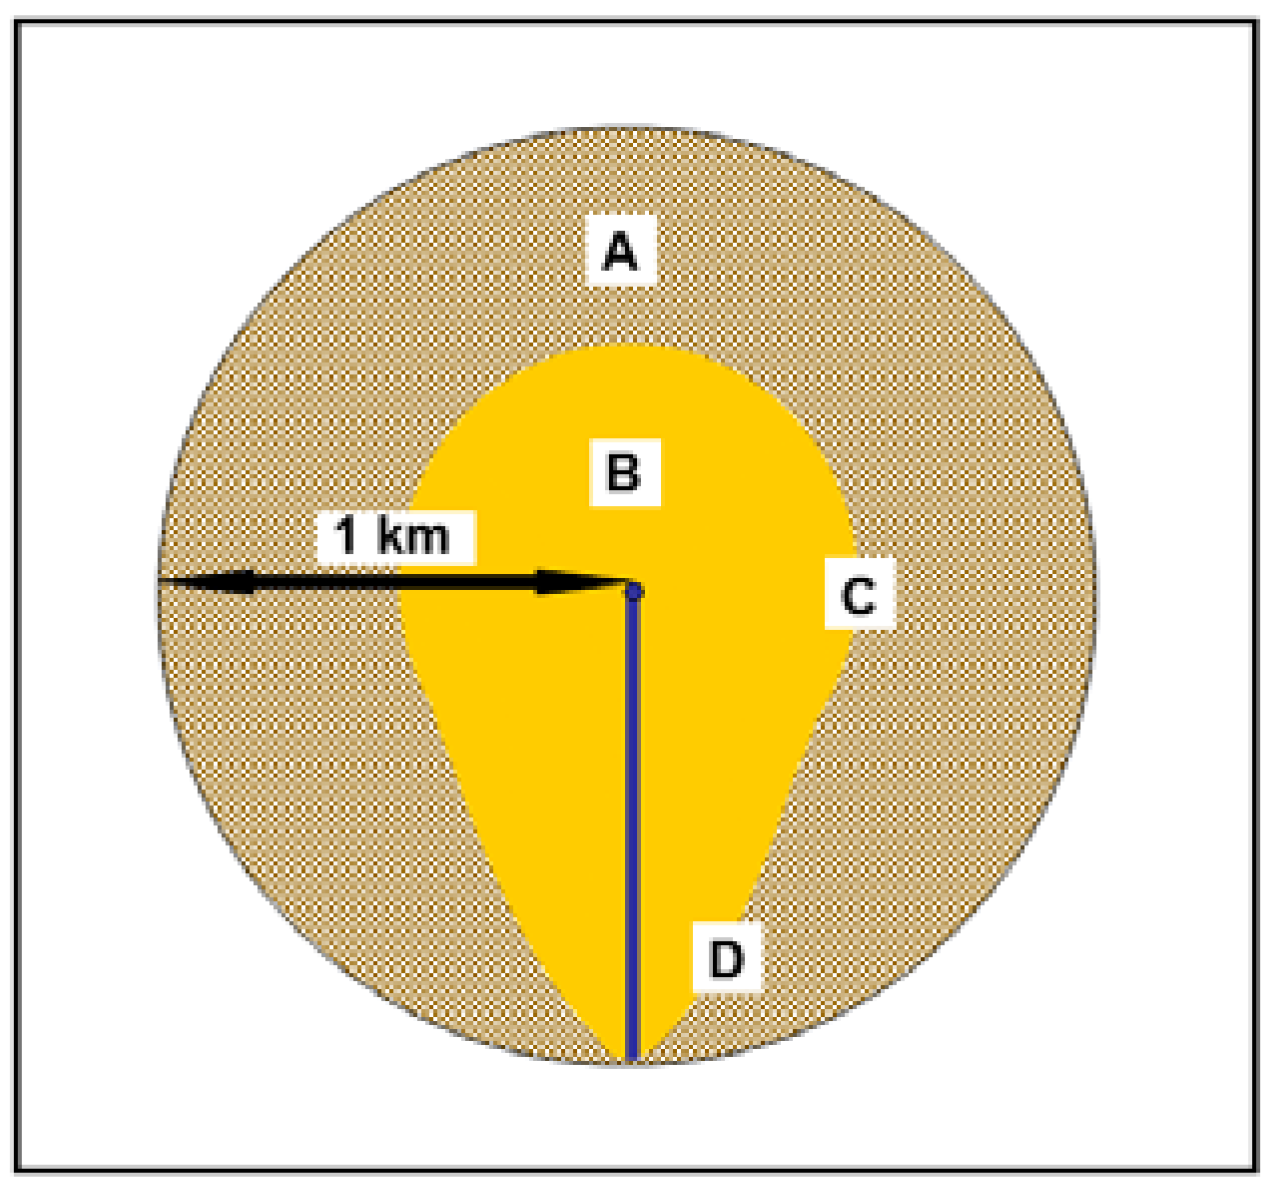
As islands become bigger, and the area to perimeter ratio makes diffuse flow inefficient, does conduit flow develop? Figure 7 presents an idealized scenario in which conduit flow drains an island interior, but the island periphery retains diffuse flow discharge to the sea. Initially, which direction meteoric recharge flows is a function of the specific recharge position on the island, and the distance to either the shoreline or the conduit. The high efficiency of the conduit flow route will thin the lens along the conduit flow path, as heads will not need to be as high to move the flow. This thinning of the lens will extend the influence of the conduit outward into the diffuse flow zone by creating a trough that will draw water to the conduit. Diffuse flow will remain viable only in coast proximal positions well away from the influence of the conduit.
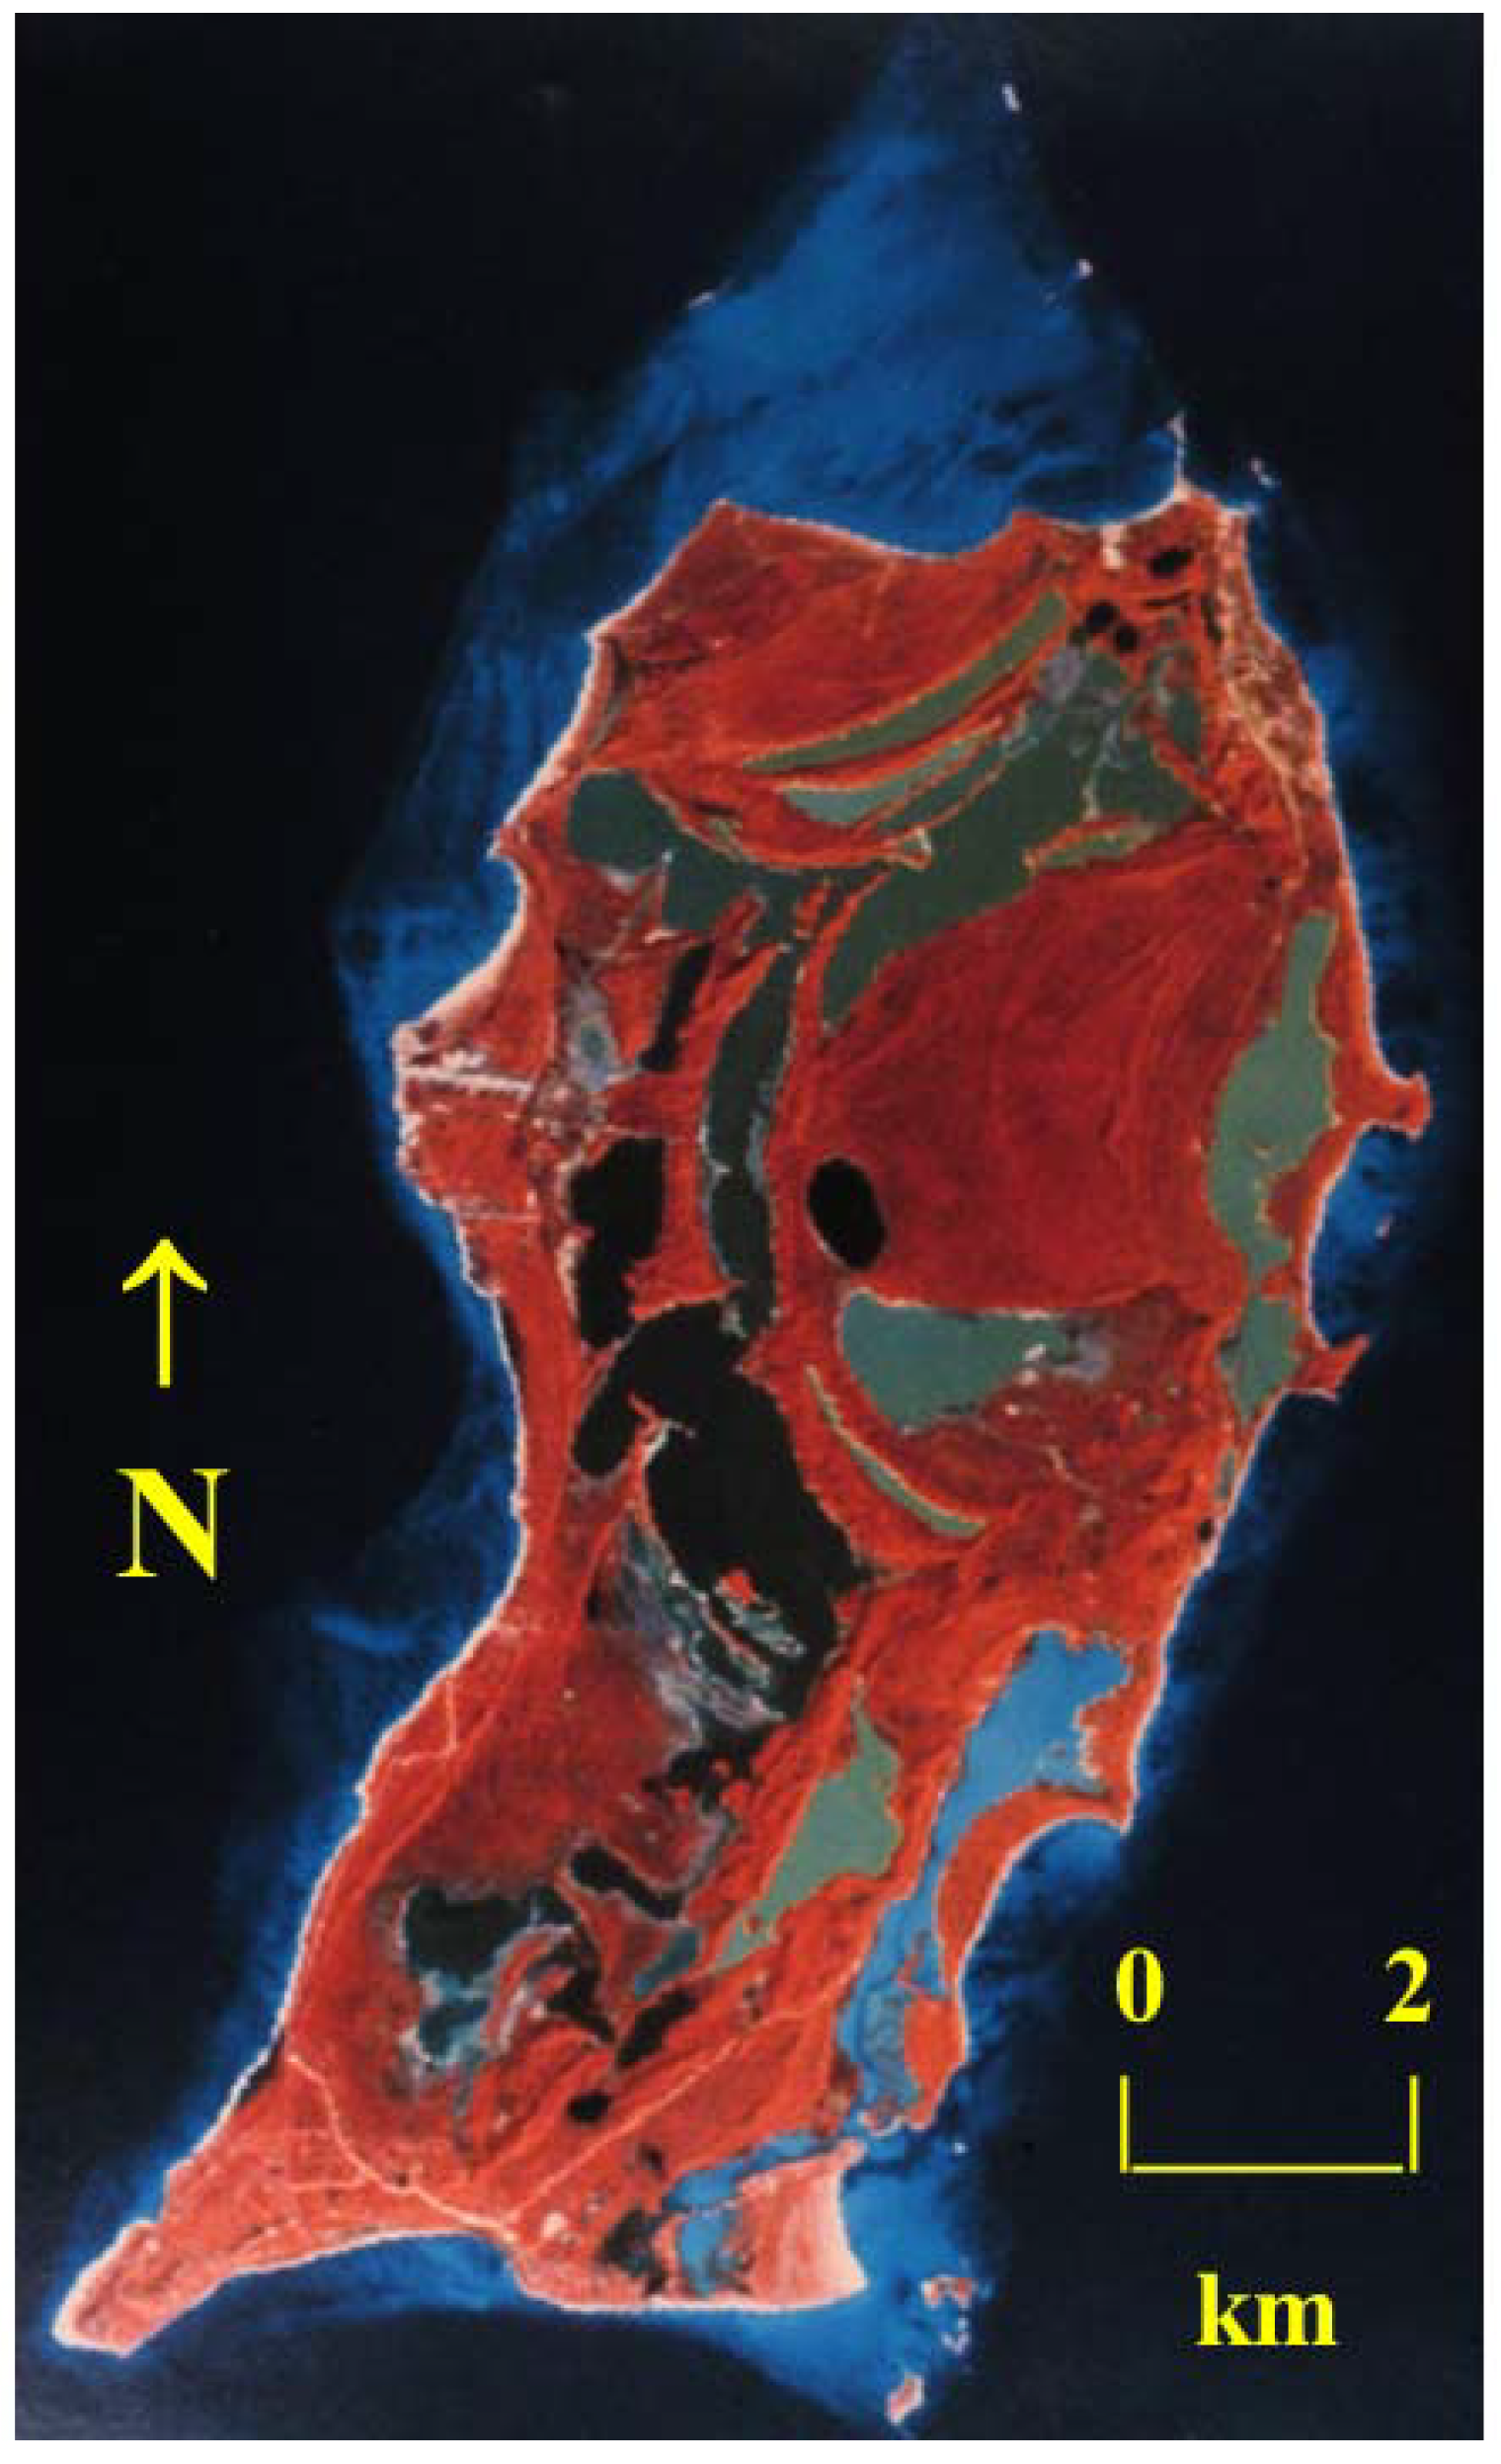
In reality, island size is only an approximation of actual lens function. Using only the simple carbonate islands category allows one to ignore the effects of non-carbonate rocks on the surface and in the subsurface. The Bahamian Archipelago, as simple carbonate islands in a tectonically-stable setting, avoids many of those problems associated with the other three island categories. Lagoons, inlets and embayments can allow surface sea water to penetrate deep into islands, effectively partitioning the lens (Figure 8). Interior island topography can contain areas below sea-level that become freshwater lakes and ponds in positive water budget islands, but in negative water budget islands (such as the southeastern Bahamas), evaporative upconing of marine water below the freshwater lens partitions the lens [24].

4. Blue Holes and Island Size

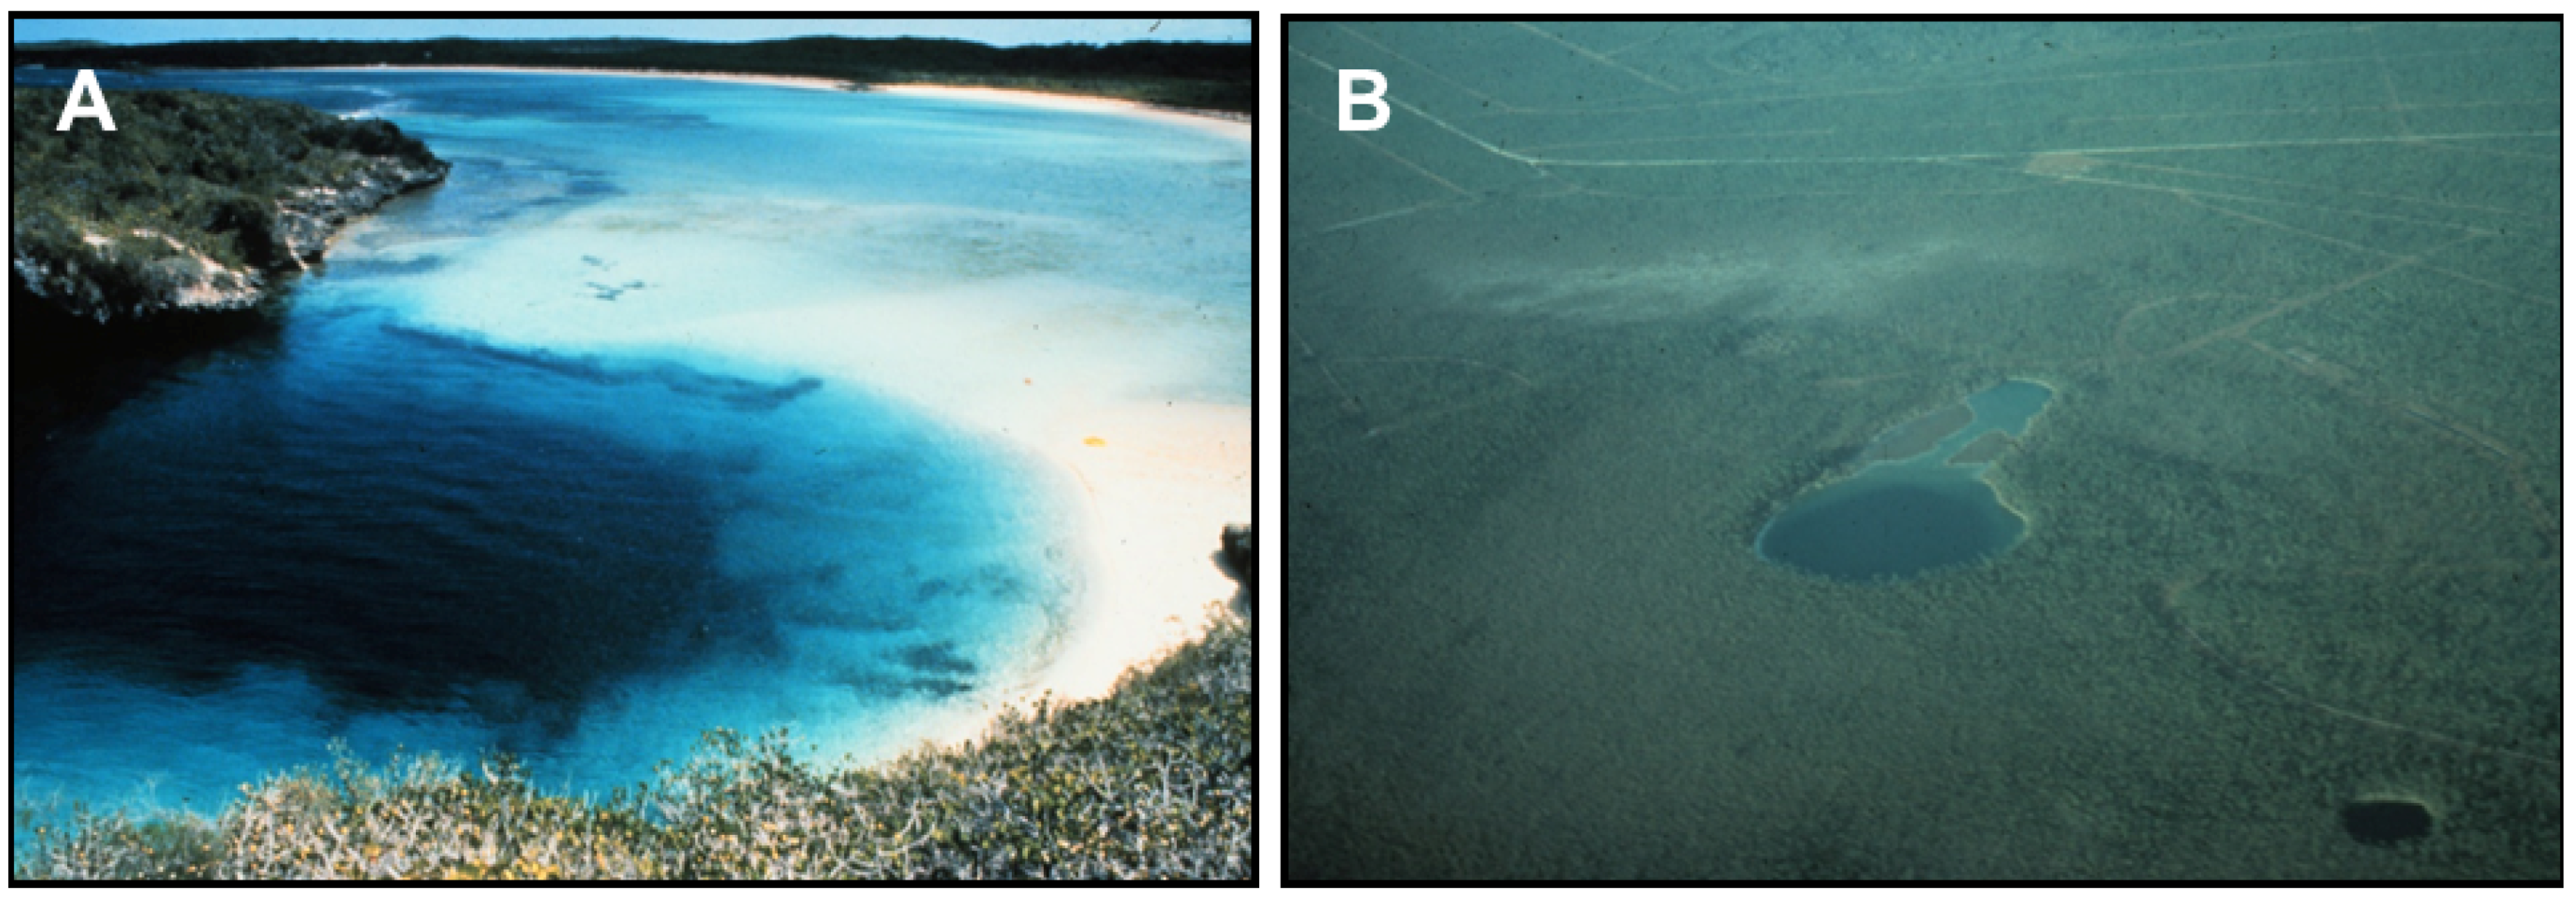
Blue holes are deep ponds and flooded shafts (Figure 9) that are found on land, called inland blue holes, and in near-shore shallow lagoons, called ocean holes [25]. They take their name from the deep blue color that distinguishes them from the browns and greens of the land surface for inland blue holes and the deep blue color that contrasts them from the turquoise color of shallow lagoons for ocean holes. Blue holes are not found out on the open banks of the Bahama platforms, as they have been infilled with Holocene carbonate sediment [26]; ocean holes are only found in protected near-shore environments where sediment loading is not a major factor. Blue holes form by three processes [25]: (1) many small and relatively shallow blue holes are sinkholes and pits that formed during glacioeustatic sea-level lowstands and have become flooded by the MIS 1 present-day sea-level highstand; (2) long, linear blue holes found near platform margins form from gravitational failure of the bank margin that produces graben-like features that can extend to depths of 100 m or more; (3) circular and deep blue holes form from progradational collapse of large conduit caves at depth. This last category is the one of interest. Cave divers have used these progradational collapse blue holes to enter conduit cave systems that can be kilometers in length and that exhibit classic phreatic dissolutional morphologies. In many places, these conduits show the effects of ceiling collapse processes; it is this collapse that can prograde to the surface to form a blue hole and provide an entrance to the cave system.
Deep progradational collapse blue holes and their associated cave conduit systems are found only on the large Bahama Banks, and not on the very small banks (Table 1) [23]. During glacioeustatic sea-level lowstands, the Bahama Banks become large dry islands after a sea-level drop of only ~10 m. On Grand Bahama Bank, small islands such as New Providence Island now become part of a large or mega island that also includes the Exumas, Andros, Long Island, Eleuthera and Bimini, among others. On Little Bahama Bank, Abaco and Grand Bahama, along with Moores Island and other cays, become a second mega island. A very large freshwater lens develops in these mega islands, and that lens drives conduit formation. Islands such as San Salvador (Figure 8), or Rum Cay, located on small isolated platforms, have their island size and hence their freshwater lens size increase by only a small amount as sea-level falls; they lack deep progradational collapse blue holes and associated conduit caves, as diffuse flow to the island perimeter is able to discharge the lens in these small platforms at all sea-level positions.
The caves found above modern sea-level in the Bahamian Archipelago today are primarily flank margin caves, as the islands that would have existed at that time would have been too small to support conduit formation, despite the fact that those islands could have been on large banks. As the banks are flooded during those sea-level highstands, they have no freshwater lens and therefore no cave development below sea-level. Flank margin caves develop in the remaining high ground, even if that ground is a very small island (e.g., Figure 6).

5. Modeling of Area Versus Perimeter Flow

5.1. Methods

To attempt to quantify the development of conduit caves in carbonate islands, and the island size at which the conduit (epigene) caves develop, simple first principle approaches and assumptions can be applied. In order to model the formation of conduit caves, the flow of water through the eogenetic host rock was treated as an equivalent porous medium, meaning that the aquifer host rock could be treated as a system of many small tubes (n-D tubes) [10]. Multiple circular island sizes were selected from very small to large islands (10–500,000 m radii) to determine if island size does in fact control conduit formation in the Bahamian Archipelago as Mylroie and Vacher [22] proposed.
Three different effective recharge rates were used, 0.5 m y−1, 1.0 m y−1 and 1.5 m y−1, which are similar to the water budget rates in the Bahamian Archipelago as calculated and measured by Whitaker and Smart [28]. The conduit sizes were viewed under three different conditions: initial (primary porosity), touching-vug porosity and full conduit systems (0.0005-m, 0.035-m and 0.75-m radii, respectively) based on work by Vacher and Mylroie [10], which then correlate with the hydraulic conductivities of the aquifers in the Bahamian Archipelago as described by Whitaker and Smart [25]: 5 m day−1, 500 m day−1 and 5000 m day−1, respectively. Conduit size growth rates (0.0002557 m y−1) were taken from Moore et al. [29], who analyzed allogenic eogenetic conduit growth rates in Florida (Figure 10). This model assumes all water entering into the aquifer is chemically aggressive (and remains so) and as such is effectively allogenic in origin.
The volume of recharge to the aquifer was calculated by multiplying the recharge rate by the land area. The number of n-D tubes used under the initial conditions was determined by calculating the area of the discharging face of the island, assuming a 25% starting porosity and counting the number of n-D tubes that would be required. Using the cross-sectional area of the tubes and the number of tubes, the velocity of water discharging from the system could then be calculated assuming all of the water in the lens drains (i.e., steady-state system). If the initial tubes were the primary porosity, then tube size started at 0.0005 m in radius. As flow develops, these tubes evolve in size and become larger, reaching the second condition of touching-vug size about a 0.035-m radius and finally conduit size end conditions beginning at a 0.75-m radius (Figure 10).
The number of tubes used for the second and third time interval conditions was arbitrarily determined as a function of conduits per island perimeter. It is expected that one conduit is unlikely and that 100,000,000 conduits are likely excessive. There is no reasonable way to know the number of conduit caves in the Bahamian Archipelago due to explorational bias; however, the possible range for the number of conduits modeled in this paper should cover the extremes of the idealized islands. These conduit systems then had to drain the various islands, and velocities of the discharging waters were calculated.
All of the velocities calculated were then converted to Reynolds numbers, as this allows for standardizing of the discharging velocities as a function of conduit size [30]:
Nr = ρvd/μ,
where Nr is the Reynolds number, ρ is the density of water, v is the velocity of the water, d is the diameter of the conduit and μ is the viscosity of water. The density and viscosity of water were taken at 25 °C.
The hydraulic conductivities observed in the Bahamian Archipelago by Whitaker and Smart [28] were also converted into Reynolds numbers and plotted onto the graphs of island size versus Reynolds number. When the Reynolds number for the hypothetical conduits exceeded the Reynolds number of the observed hydraulic conductivities of Whitaker and Smart [28], it indicates that the island may not efficiently drain the lens, causing pooling and over thickening of the lens, suggesting the increased development of conduit and turbulent flow in the system.
Additionally, for the last two conduit sizes, it was assumed that all of the water drained through the large conduits. However, in reality, not all of the water would drain through these conduit systems, and some of the water would continue to drain as diffuse flow, especially near the island perimeter (Figure 7). This explains the formation of conduit caves in association with flank margin caves (a diffuse flow phenomenon) in other carbonate islands, for example Australia and the Yucatan (e.g., [31,32,33]). Therefore, for each of the two final conduit sizes, the models were run three total times: (i) assuming all the water discharged through the conduits, (ii) half the water discharged through the conduits and (iii) a fourth of the water discharged through the conduits.

5.2. Results

Under the initial conditions where the aquifer is treated as an equivalent porous medium, the aquifer is able to drain at or below the hydraulic conductivity under all of the recharge rates (Figure 11). However, over time, the carbonate aquifer self modifies and no longer acts as an equivalent porous medium by developing touching-vug porosity (decreasing porosity, while increasing permeability). At the middle time stage (i.e., touching-vug porosity) under the various recharge rates, the larger islands have Reynolds numbers that are higher than the hydraulic conductivity. Whereas the smaller islands have Reynolds numbers that are less than the hydraulic conductivity (Figure 12). At the final time stage (i.e., conduits) under the various recharge rates, the larger islands have Reynolds numbers that are higher than the hydraulic conductivity. Whereas the smaller islands have Reynolds numbers that are less than the hydraulic conductivity, but all of the curves are closer to the field-observed hydraulic conductivity line (Figure 13). When not all of the water drains from modeled conduits as diffuse flow, the Reynolds number curves are pulled closer to the hydraulic conductivity line; however, in most cases, the flow through the conduits was still insufficient to drain the lens (Figure 14).
Conduit caves (and progradational collapse blue holes) in the Bahamian Archipelago are only found on the larger platforms and only found at depths exceeding 10 m. This result is because the size of the island must increase to catch more water, and the modern-day islands are too small. There does not appear to be a strong relationship between the amount of effective recharge and conduit cave development; island size appears to be more important, and the size cut-off is an island about 10–40 km in radius, the point at which the Reynolds numbers scatter plot curves over from being vertical to horizontal in Figure 12, Figure 13 and Figure 14. The point at which the graphs turn is significant because it is the point at which the water can no longer effectively drain from the lens through diffuse flow as island size (catchment area) has increased to a point where it is no longer able to discharge all of the water through the island perimeter. Larger islands support the conduit caves; smaller islands do not. This is supported by progradational collapse blue hole observations across the Bahamian Archipelago as being only on larger platforms (>20 km in radius; Table 1).
Most islands in the Bahamian Archipelago today are linear or ovoid in shape or have embayment’s that partition the freshwater lens (e.g., Figure 8), meaning that they are able to discharge their freshwater lenses more efficiently with a lower area/perimeter ratio than the circular islands modeled in this gedankenexperiment. However, by dropping sea-level 10+ m, these islands become much larger and take on more circular shapes and lack lagoons and internal lakes; as such, they become less efficient at discharging the lens, and the development of conduit caves is facilitated.

6. Discussion

The field evidence from the Bahamian Archipelago indicates that conduit flow systems of an epigenic nature have developed only on the large Bahama Bank platforms. This evidence is drawn from cave diver records, which, while extensive, cannot be considered thorough. Cave diving is a rigorous and dangerous activity with significant risk. Collecting data about conduit caves under the Bahama Banks is time consuming and somewhat restricted to those areas that have the logistical capability to support such activity. Explorational bias is always a possibility; conduit caves could exist on small platforms, but not have been discovered. Some small platforms, such as San Salvador Island, have been diligently examined by numerous cave divers for over three decades, and while small, unenterable tubes have been shown to exist and carry flow into and out of inland lakes (e.g., [34]), no deep blue holes or associated conduit caves have been discovered. The cave diver record is therefore not conclusive, but all data to date suggest that the basic observation regarding conduit cave development being restricted to large platforms is true (e.g., [26]).
Another issue regarding the cave diver data is the depth of these conduits. Such conduits should form at a position within a few meters of the freshwater lens margin elevation at the time of conduit genesis. Conduit caves at different locations on the same bank, and on other banks, should cluster at similar depths that correspond to glacioeustatic sea-level stillstands in the Quaternary. During rapid excursions of the sea-level curve, the freshwater lens is not stable at any given elevation to form large conduit caves (this situation is also true for flank margin cave development). Two issues confuse this data. First, cave diving is controlled in part by the depth to which the diver goes. The deeper the dive, the more air that is consumed (for open flow scuba systems, not true for re-breather systems) and the longer the decompression stops to avoid the bends (true for all air systems). For this reason, cave divers tend to stay high in the cave passages they explore. As many of these passages have undergone some degree of progradational collapse, the cave passage as traversed by the cave diver, who wishes to stay as shallow as possible, is commonly not the depth at which the initial dissolutional conduit formed, which was somewhere deeper and may be obscured by collapse rubble. Sections of tubular passage do exist, but it is not possible to reliably extract such information from cave diver log books. Still maps, photographs and video provided by cave divers document the conditions discussed above, as in Conch Sound Blue Hole, where an elliptical conduit can be followed for more than 700 m at a depth of 30 m [35].
The second issue is that the conduit systems of the Bahama Banks are overprinted by numerous glacioeustatic sea-level events of the Quaternary. A conduit cave formed during one glacioeustatic sea-level lowstand will be present during the next lowstand, and if that position places any portion of the younger freshwater lens in the vicinity of the pre-existing conduit, that route will be utilized for some, if not all of the freshwater flow in that portion of the lens, as opposed to generating a new conduit system. In such a case, while the conduit may accurately reflect the freshwater margin lens position at the earlier time, it may not reflect the freshwater lens margin position during the second, younger sea-level event. One of the reasons flank margin caves work well to establish glacioeustatic sea-level highstand positions is that only a few highstands have been higher than at present, so overprinting has been minimal. Flank margin caves form in a diffuse flow system as isolated void systems, and they offer little in the way of enhanced flow pathways to be utilized by a later freshwater lens. Flank margin caves can be found in small hills that once were tiny islands in which the lens was very thin (e.g., Figure 6). To overprint a flank margin cave in that setting requires that sea-level position and the freshwater lens to be at almost the exact same elevation. Most flank margin caves are found at positions consistent with the +6 m sea-level highstand of MIS 5e [36], but flank margin caves with elevations up to 20 m have been located and are believed to represent earlier highstands, such as MIS 11 [14,37].
As a result of these factors, attempts to determine glacioeustatic sea-level lowstand positions using the elevation/depth of epigenic conduit caves under the Bahama Banks has not been fruitful. The mere existence of these epigenic conduit caves demonstrates that large banks experience a diffuse to conduit flow transition that does not occur in small islands on small banks; that small islands do not have epigenic conduit flow has been clearly demonstrated. Over 360 flank margin caves above modern sea-level have been located and mapped in the Bahamian Archipelago; no conduit caves have been found above modern sea-level. Small islands with small lenses cannot form epigenic cave conduits.

Modeling Discussion

Based on quantitative modeling done on first principles, it would appear that subaerial island size is primarily responsible for the development of conduit caves in simple carbonate islands (e.g., the Bahamian Archipelago). Eogenetic islands need to be greater than about 10–40 km in radius (assuming a circular island with a single, continuous lens) to generate conduit flow due to the ineffective draining of the freshwater lens. Some of the current Bahamian islands have a major axis that exceeds 10–40 km; however, these islands have significantly smaller minor axes, and these islands would be able to drain more efficiently since their area to perimeter ratio is much smaller. Some islands are penetrated by lagoons and tidal inlets that disrupt and partition the lens, in effect creating “smaller” islands within a larger island mass (Figure 8); Andros Island is a good example of a large island with such segmentation of its freshwater lens. The southeastern Bahamas have a negative water budget such that inland depressions below sea-level have evaporative overload, resulting in marine water upconing and the development of hyper saline lakes; which also partition the freshwater lens (Figure 8).
During lowstand sea-level positions during the Quaternary, the subaerial island sizes increased significantly, and the banks stood out of the ocean as steep-sided plateaus. Inland depressions did not reach sea-level, and tidal channels and lagoons were non-existent. This setting allowed the Bahamian platforms to be fully exposed, increasing island area significantly for the northern Bahamas (e.g., Great Bahama Bank, Cay Sal Bank and Little Bahama Bank). Other islands in the southern Bahamas do not have large platforms and as such do not increase their island size significantly and therefore cannot develop conduit caves; e.g., San Salvador Island and Rum Cay. On the larger platforms, it is expected that both conduit and flank margin caves form at the same time, as in coastal areas between conduit flow paths, the meteoric water will have a more efficient flow path to drain out through diffuse flow rather than turbulent flow (Figure 7). Table 1 contains data on the platform size of the Bahamian Archipelago. It is clear viewing the table that the calculated island size (10–40 km in radius) based on first principles for determining which islands can support conduit caves matches the field data. This confirmation supports the basic premise of the simple model.
The water budget of islands also appears to have a minor role in the development of conduit caves on simple carbonate islands. The amount of recharge does not appear to be the primary controller of conduit cave development; catchment area (island size) is the primary controller; however, the water budget’s role cannot be discounted (e.g., Figure 14) as a secondary factor. Water budget apparently has had no role on the development of flank margin caves, which are found in similar numbers and sizes across the entire archipelago, from positive water budget areas in the northwest to negative water budget areas in the southeast. The mere existence of a freshwater lens seems to assure flank margin cave development. The flank margin cave develops embedded in a diffuse flow system and does not enhance lens flow dynamics the way turbulent, conduit flow does.
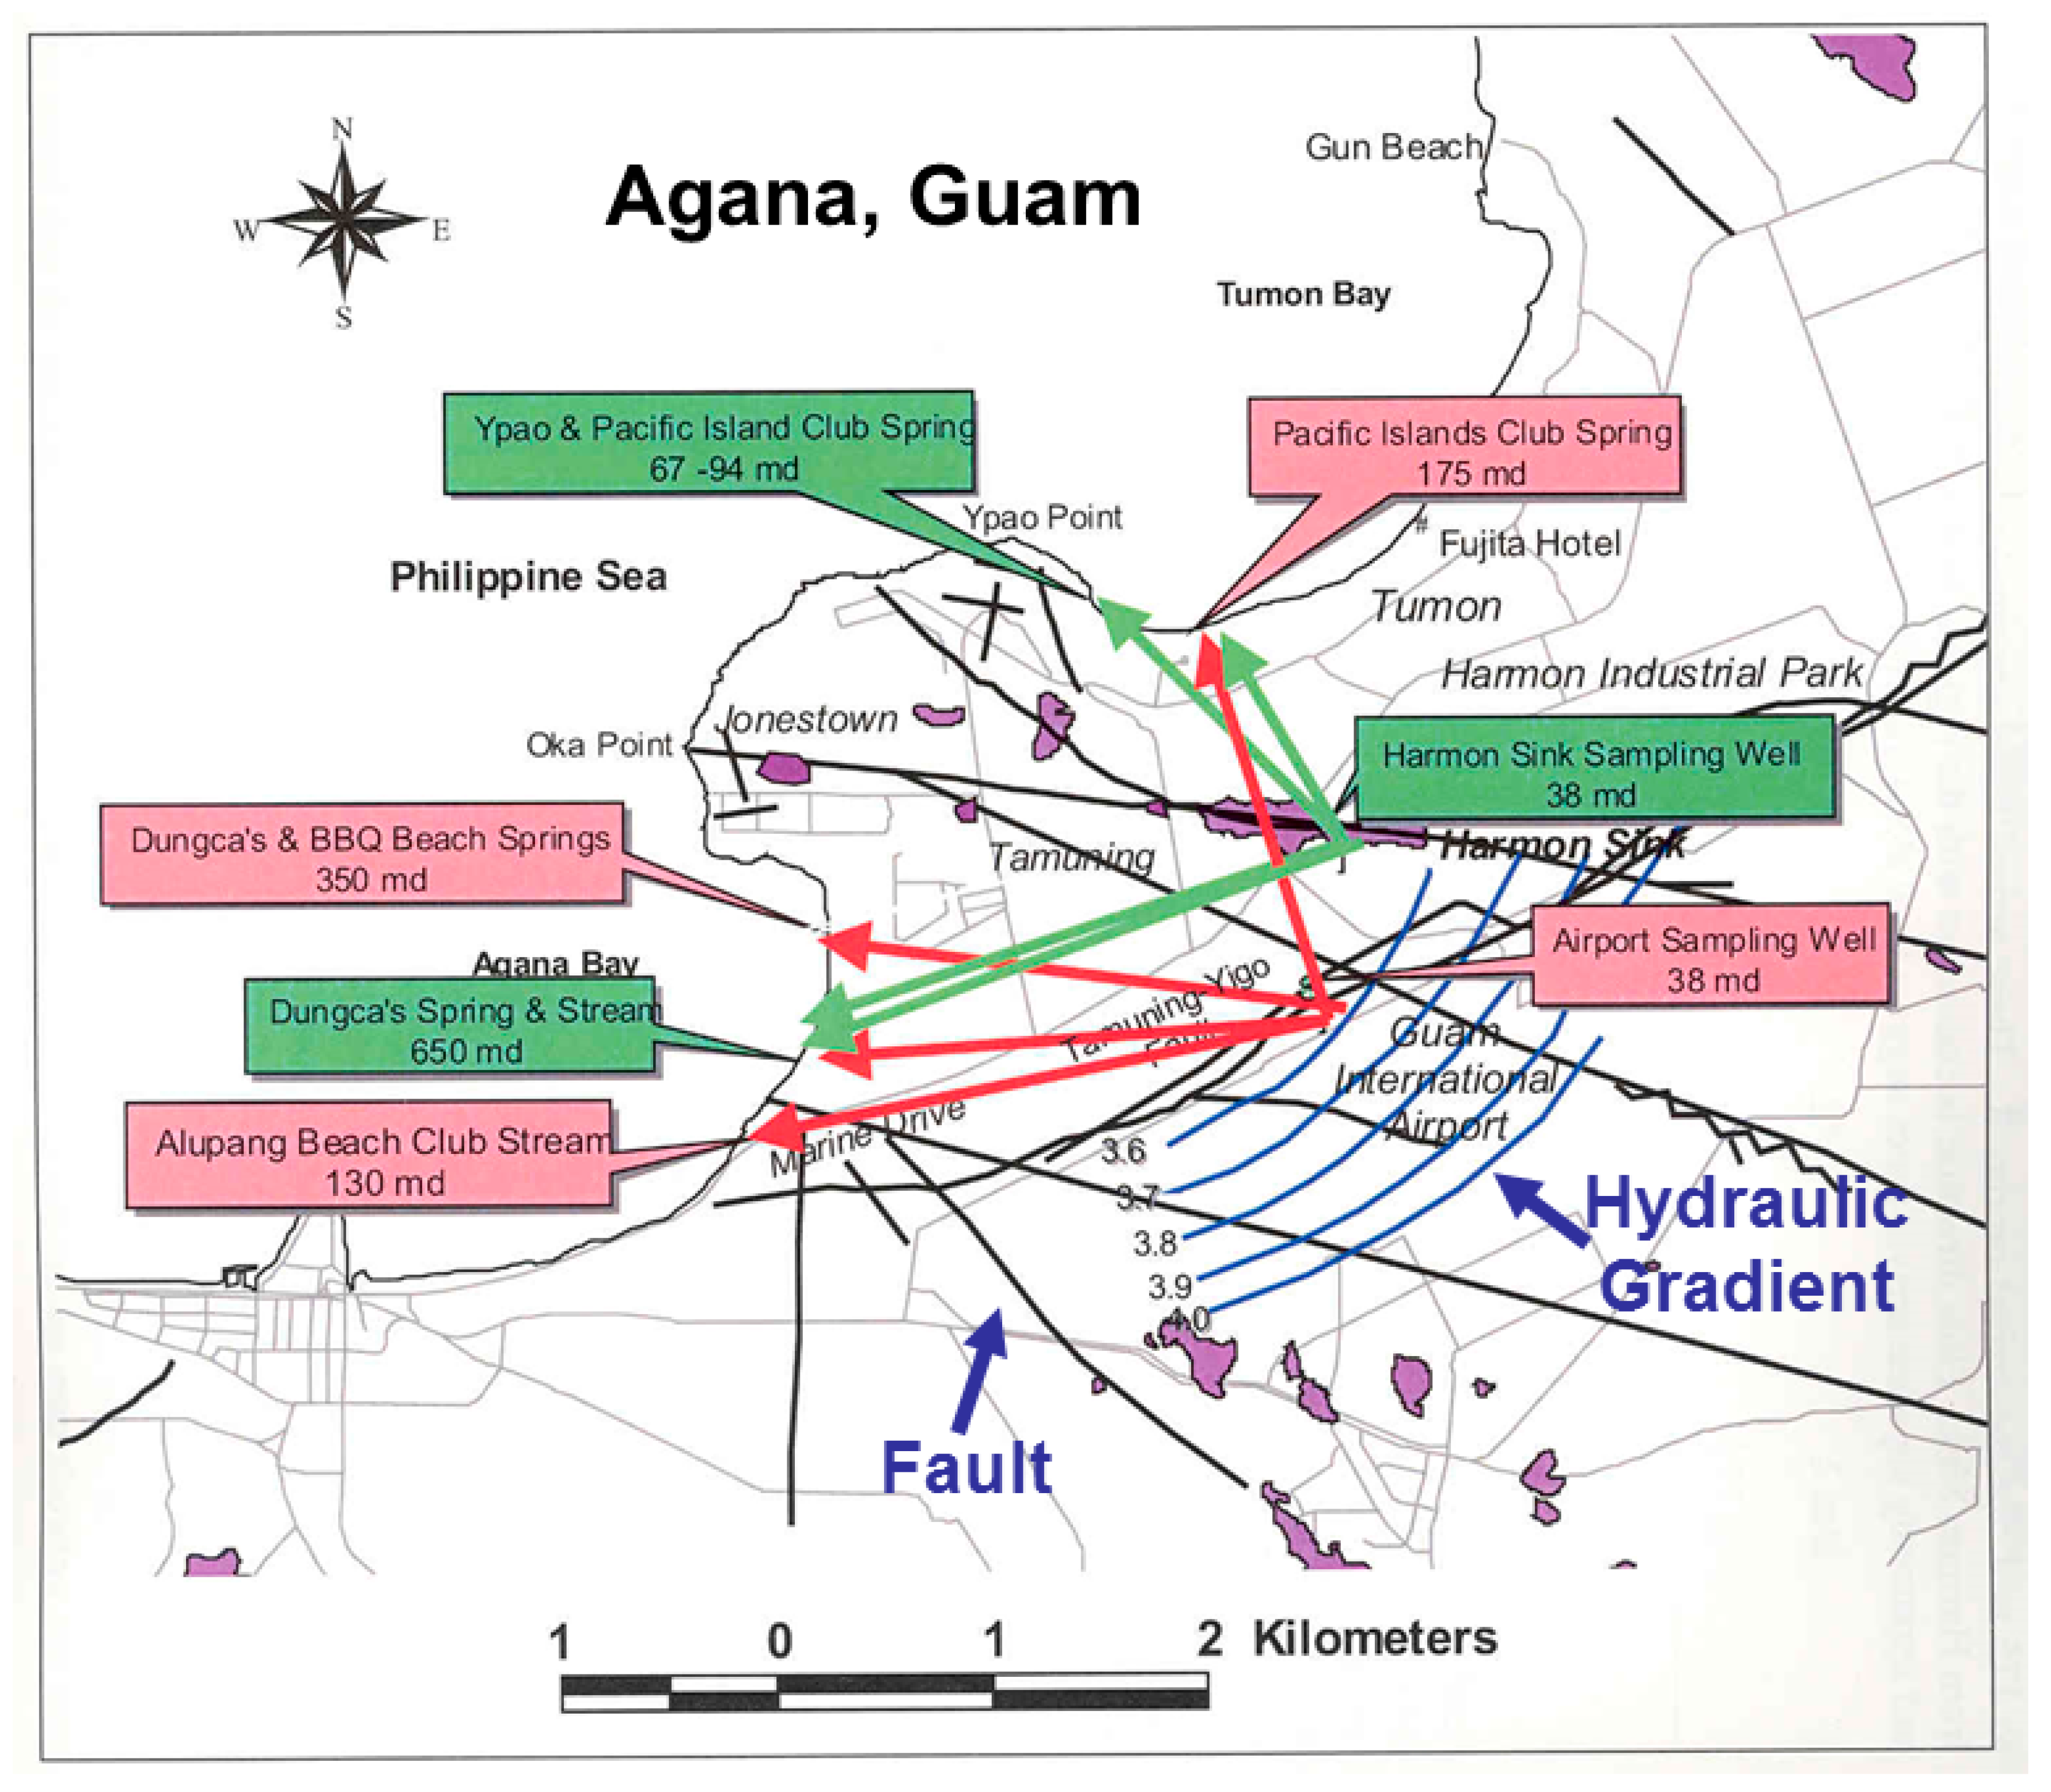
The issues for water management are quality and quantity. For island settings, quantity is finite, and every effort must be made to allocate water resources based on a fixed supply. Water quality therefore becomes paramount, as each drop of water lost due to contamination, either natural or artificial, is water lost to public use from a fixed supply. Carbonate islands, because of the development of karst flow systems, must be treated differently than non-karst islands and coasts. For small islands made of eogenetic carbonates, diffuse flow evolves from simple matrix flow to a higher hydraulic conductivity of touching-vug flow. As the eogenetic carbonates mature, joints and fractures and faults may develop, as on tectonically-active Guam, and a second fracture flow system can be superimposed on the original diffuse flow (Figure 15). In the Guam case, the diffuse flow component reliably flows down the freshwater lens gradient at modest speeds, but the fracture flow component flows much more rapidly both down gradient and at right angles to the gradient (Figure 15). For larger islands, the conduit flow dynamic appears: flow is concentrated in discrete flow paths. Contaminant transport can range from a slow, diffuse flow plume in a small island, to modest flow rates along a fracture system, to rapid flow rates in a conduit flow system. The latter two flow systems create discrete, identifiable flow routes. Salt water intrusion and marine water upconing can result from incorrect water extraction methods. A contaminant plume, for example, cannot be removed by pumping; the contaminant would be merely replaced by sea water.

7. Conclusions

Conduit caves in the Bahamian Archipelago are only found >10 m below modern sea-level, and only then on larger platforms. Conduit cave development on simple carbonate islands (e.g., the Bahamian Archipelago) is a function of island area. When sea-level dropped >10 m during the Pleistocene, the Bahamian banks were subaerially exposed, greatly increasing the catchment area of the islands and thereby facilitating the development of conduit caves. Based on simple modeling, it appears that the cut-off for the switch from diffuse flow to conduit flow for a simple carbonate island is in the 10–40-km radius range (assuming a circular island). The development of conduit caves on simple carbonate islands is also due, in small part, to the water budget of the island. In the case of islands with greater effective recharge, these islands are more likely to develop conduit caves than islands with a lesser effective recharge.

Author Contributions

Conceptualization, E.B.L. and J.E.M. Methodology, E.B.L. Analysis, E.B.L. and J.E.M. Original draft preparation, E.B.L. and J.E.M. Review and editing, E.B.L. and J.E.M.

Funding

This research received no external funding.

Acknowledgments

The authors wish to thank Shawnee State University and Mississippi State University for their support. The research in The Bahamas was conducted under permits from the Bahamas Environmental, Science and Technology Commission (BEST Commission) issued through the Gerace Research Centre on San Salvador Island. Deep appreciation is given to Nancy Albury, Tom Iliffe and Brian Kakuk for providing us with access to their diving logs and their wealth of experience cave diving in the Bahamian Archipelago. This manuscript was improved by the feedback of three anonymous reviewers.

Conflicts of Interest

The authors declare no conflict of interest.

References

  1. Choquette, P.W.; Pray, L.C. Geologic nomenclature and classification of porosity in sedimentary carbonates. Am. Assoc. Pet. Geol. Bull. 1970, 54, 207–250. [Google Scholar]
  2. Palmer, A.N. Origin and morphology of limestone caves. Geol. Soc. Am. Bull. 1991, 103, 1–25. [Google Scholar] [CrossRef]
  3. Palmer, A.N. Cave Geology; Cave Books: Dayton, OH, USA, 2007; ISBN 978-0939748662. [Google Scholar]
  4. Otonicar, B.; Buzijak, N.; Mylroie, J.E.; Mylroie, J.R. Flank margin cave development in carbonate talus breccia facies: An example from cres island, Croatia. Acta Carsologica 2010, 39, 79–91. [Google Scholar] [CrossRef]
  5. Arriolabengoa, M.; D’Angeoli, I.M.; De Waele, J.; Parise, M.; Ruggieri, R.; Sanna, L.; Madonia, G.; Vattano, M. Flank margin caves in telogenetic limestones in Italy. In Proceedings of the 17th International Congress of Speleology, Sydney, Australia, 22–28 July 2017; Moore, K., White, S., Eds.; Australian Speleological Federation: Sydney, Australia, 2017; pp. 289–292, ISBN 978-0-9808060-5-2-07-6. [Google Scholar]
  6. Lace, M.J.; Mylroie, J.E. Coastal Karst Landforms: Coastal Research Library 5; Springer: Dordrecht, The Netherlands, 2013; ISBN 978-94-007-5015-9. [Google Scholar]
  7. Carew, J.L.; Mylroie, J.E. A Stratigraphic and Depositional Model for the Bahama Islands. In Geological Society of America Special Paper 300, Terrestrial and Shallow Marine Geology of the Bahamas and Bermuda; Curran, H.A., White, B., Eds.; Geological Society of America: Boulder, CO, USA, 1995; pp. 5–31. ISBN 978-08-1372-300-6. [Google Scholar]
  8. Carew, J.L.; Mylroie, J.E. Geology of the Bahamas. In Geology and Hydrogeology of Carbonate Islands: Developments in Sedimentology 54; Vacher, H.L., Quinn, T., Eds.; Elsevier: Amsterdam, The Netherlands, 1997; pp. 91–139. ISBN 978-0444516442. [Google Scholar]
  9. Kindler, P.; Mylroie, J.E.; Curran, H.A.; Carew, J.L.; Gamble, D.W.; Rothfus, T.A.; Savarese, M.; Sealey, N.E. Geology of Central Eleuthera, Bahamas: A Field Trip Guide; Gerace Research Centre: San Salvador, Bahamas, 2010; ISBN 0-935909-91-5. [Google Scholar]
  10. Vacher, H.L.; Mylroie, J.E. Eogenetic karst from the perspective of an equivalent porous medium. Carbonates Evaporites 2002, 17, 182–196. [Google Scholar] [CrossRef]
  11. Mylroie, J.R.; Mylroie, J.E. Development of the carbonate island Karst model. J. Cave Karst Stud. 2007, 69, 59–75. [Google Scholar]
  12. Mylroie, J.E. Coastal Karst development in carbonate rocks. In Coastal Karst Landforms: Coastal Research Library 5; Lace, M.J., Mylroie, J.E., Eds.; Springer: Dordrecht, The Netherlands, 2013; pp. 77–109. ISBN 978-9400750159. [Google Scholar]
  13. Gulley, J.D.; Martin, J.B.; Moore, P.J.; Brown, A.; Spellman, P.D.; Ezell, J. Heterogeneous distributions of CO2 may be more important for dissolution and karsification in coastal eogenetic limestone than mixing dissolution. Earth Surf. Processes Landforms 2015, 40, 1057–1071. [Google Scholar] [CrossRef]
  14. De Waele, J.; D’Angeli, I.M.; Bontognali, T.; Tuccimei, P.; Scholz, D.; Jochum, K.P.; Columbu, A.; Bernasconi, S.M.; Fornós, J.J.; González, E.R.G.; et al. Speleothems in a north Cuban cave register Sea-level changes and pleistocene uplift pates. Earth Surf. Processes Landforms 2018. [Google Scholar] [CrossRef]
  15. Jenson, J.W.; Keel, T.M.; Mylroie, J.R.; Mylroie, J.E.; Stafford, K.W.; Taborosi, D.; Wexel, C. Karst of the Mariana Islands: The interaction of tectonics, glacioeustasy and fresh-water/sea-water mixing in island carbonates. In Perspectives on Karst Geomorphology, Hydrology, and Geochemistry—A Tribute Volume to Derek C. Ford and William B White; Geological Society of America Special Paper 404; Harmon, R.S., Wicks, C.M., Eds.; Geological Society of America: Boulder, CO, USA, 2006; pp. 129–138. ISBN 978-0813724041. [Google Scholar]
  16. Vacher, H.L. Dupuit-Ghyben-Herzberg Analysis of Strip-Island Lenses. Geol. Soc. Am. Bull. 1988, 100, 223–232. [Google Scholar] [CrossRef]
  17. Jenson, J.W.; Mylroie, J.E.; Mylroie, J.R.; Wexel, C. Revisiting the Carbonate Island Karst Model. In Proceedings of the Geological Society of America Annual Meeting, Denver, CO, USA, 22–25 October 2002. [Google Scholar]
  18. Jocson, J.M.U.; Jenson, J.W.; Contractor, D.N. Recharge and aquifer responses: Northern guam lens aquifer, Guam, Mariana Islands. J. Hydrol. 2002, 260, 231–254. [Google Scholar] [CrossRef]
  19. Mylroie, J.E.; Mylroie, J.R. Bahamian Flank margin caves as hypogene caves. In Hypogene Karst Regions and Caves of the World; Klimchouk, A.B., Palmer, A.N., De Waele, J., Aulwer, A.S., Audra, P., Eds.; Springer: Dordrecht, The Netherlands, 2017; pp. 757–768. ISBN 978-3319533476. [Google Scholar]
  20. Lace, M.J.; Kambesis, P.N.; Mylroie, J.E. Sistema Faro, Isla de Mona, Puerto Rico: Speleogenesis of the world’s longest flank margin cave. Boletín Geol. Minero 2016, 127, 205–217. [Google Scholar]
  21. Mylroie, J.E.; Mylroie, J.R. Telogenetic Limestones and Island Karst. In Coastal Karst Landforms: Coastal Research Library 5; Lace, M.J., Mylroie, J.E., Eds.; Springer: Dordrecht, The Netherlands, 2013; pp. 375–393. ISBN 978-9400750159. [Google Scholar]
  22. Mylroie, J.E; Vacher, H.L. A Conceptual View of Carbonate Island Karst. In Karst Modeling: Karst Waters Institute Special Publication 5; Palmer, A.N., Palmer, M.V., Sasowsky, I.D., Eds.; Karst Waters Institute: Charles Town, WV, USA, 1999; pp. 48–57. ISBN 978-0964025844. [Google Scholar]
  23. Thompson, W.G.; Curran, H.A.; Wilson, M.A.; White, B. Sea-level oscillations during the last interglacial highstand recorded by Bahamian corals. Nat. Geosci. 2011, 4, 684–687. [Google Scholar] [CrossRef]
  24. Mylroie, J.E.; Carew, J.L. Karst Development on Carbonate Islands. In Unconformities and Porosity in Carbonate Strata: American Association of Petroleum Geologists Memoir 63; Budd, D.A., Harris, P.M., Saller, A., Eds.; American Association of Petroleum Geologists: Tulsa, OK, USA, 1995; pp. 55–76. ISBN 978-0891813422. [Google Scholar]
  25. Mylroie, J.E.; Carew, J.L.; Moore, A.I. Blue holes: Definition and genesis. Carbonates Evaporites 1995, 10, 225–233. [Google Scholar] [CrossRef]
  26. Larson, E.B.; Mylroie, J.E. A review of whiting formation in the Bahamas and new models. Carbonates Evaporites 2014, 29, 337–347. [Google Scholar] [CrossRef]
  27. Wilson, W.L. Morphology and hydrology of the deepest known cave in the Bahamas: Dean’s blue hole, Long Island. In Proceedings of the 7th Symposium of the Geology of the Bahamas, Bahamian Field Station, San Salvador Island, Bahamas, 16–20 June 1994. [Google Scholar]
  28. Whitaker, F.F.; Smart, P.L. Hydrogeology of the Bahamian Archipelago. In Geology and Hydrogeology of Carbonate Islands: Developments in Sedimentology 54; Vacher, H.L., Quinn, T., Eds.; Elsevier: Amsterdam, The Netherlands, 1997; pp. 183–216. ISBN 978-0444516442. [Google Scholar]
  29. Moore, P.J.; Martin, J.B.; Screaton, E.J.; Neuhoff, P.S. Conduit Enlargement in an Eogenetic Karst Aquifer. J. Hydrol. 2010, 393, 143–155. [Google Scholar] [CrossRef]
  30. Smith, D.I.; Atkinson, T.C.; Drew, D.P. The Hydrology of Limestone Terrains. In The Science of Speleology; Ford, T.D., Cullingford, C.H.D., Eds.; Academic Press: London, UK, 1976; pp. 179–212. ISBN 978-0122625503. [Google Scholar]
  31. Beddows, P.A. Groundwater Hydrology of a Coastal Conduit Carbonate Aquifer: Caribbean Coast of the Yucatan Peninsula, Mexico. Ph.D. Thesis, University of Bristol, Bristol, UK, 2004. [Google Scholar]
  32. Burnett, S.; Webb, J.A.; White, S. Shallow Caves and Blowholes on the Nullarbor Plain, Australia—Flank margin caves on a low gradient limestone platform. Geomorphology 2013, 201, 246–253. [Google Scholar] [CrossRef]
  33. Kelley, K.N.; Mylroie, J.E.; Mylroie, J.R.; Moore, C.M.; Collins, L.R.; Ersek, L.; Lascu, I.; Roth, M.J.; Moore, P.J.; Passion, R.; Shaw, C. Eolianites and Karst Development in the Mayan Riviera, Mexico. In Proceedings of the 12th Symposium on the Geology of the Bahamas; Davis, R.L., Gamble, D.W., Eds.; Wallace Press: Concord, NH, USA, 2006; pp. 88–99, ISBN 0-935909-77-X. [Google Scholar]
  34. Martin, J.B.; Gulley, J.; Spellman, P. Tidal Pumping of Water Between Bahamian Blue Holes, Aquifers, and the Ocean. J. Hydrol. 2012, 416–417, 28–38. [Google Scholar] [CrossRef]
  35. Palmer, R. Blue Holes of the Bahamas; Jonathan Cape: London, UK, 1985; ISBN 0-224-02311-x. [Google Scholar]
  36. Carew, J.L.; Mylroie, J.E. Quaternary Tectonic Stability of the Bahamian Archipelago: Evidence from fossil coral reefs and flank margin caves. Quat. Sci. Rev. 1995, 14, 144–153. [Google Scholar] [CrossRef]
  37. Mylroie, J.E.; Mylroie, J.R. 2016, Quaternary Glacioeustatic Sea-level Highstands from the Bahamas: The Karst Signature. In Proceedings of the Geological Society of America Annual Meeting, Denver, CO, USA, 25–28 September 2016. [Google Scholar]
  38. Moran, D.; Jenson, J.W. Dye Trace of Groundwater Flow from Guam International Airport and Harmon Sink to Agana Bay and Tumon Bay Guam: WERI Technical Report No. 97; Water & Environmental Research Institute of the Western Pacific, University of Guam: Mangilao, Guam, USA, 2004. [Google Scholar]
Figure 1. Subdivisions of islands into four categories as described for the Carbonate Island Karst Model (CIKM): (A) simple carbonate island; (B) carbonate-cover island; (C) composite island; (D) complex island. There can be gradations of type between categories, and the classification can be used for portions of islands.
Geosciences 08 00268 g001
Figure 2. Three-dimensional expression of the CIKM model, modified from Jenson et al. [17]. (A) Schematic CIKM box with three axes: the long horizontal axis is the island category, based on the CIKM, with composite and complex categories combined; the short horizontal axis is the island size; and the vertical axis is the sea-level position. The island size transition to conduit flow is placed to the right based on the 10–40-km placement of island size for the diffuse to conduit transition presented in this paper. (B) Schematic CIKM box with island examples showing how island character changes as sea-level fluctuates; for example, becoming a new type of island within the CIKM classification scheme, or how their size changes with sea-level. See the text for a discussion.
Geosciences 08 00268 g002aGeosciences 08 00268 g002b
Figure 3. A map showing the location of the Bahamian Archipelago and the larger islands within it. A small decrease in sea-level causes a large and abrupt increase in island size due to the near vertical nature of the platform walls. With the platforms subaerially exposed, the modern day islands become mega islands. The gray area around the islands are shallow lagoons 20 m in depth; commonly ~10 m.
Geosciences 08 00268 g003
Figure 4. Schematic diagram of autogenic recharge on a carbonate island, modified from Jocson et al. [18]. Recharge at Point A in the water table descends by percolation through the eogenetic matrix of the carbonate rock; it can take six months to reach the top of the freshwater lens. Point B is adjacent to a vadose fast-flow route (pit cave); vadose water can reach the top of the lens within minutes of a meteoric event. Monitoring wells at Points A and B will record dramatically different time responses of the freshwater lens to a given meteoric event.
Geosciences 08 00268 g004
Figure 5. The plan view difference in cave orientation and configuration between diffuse flow in an eogenetic karst aquifer in a coastal setting dominated by diffuse flow (A) and a telogenetic continental aquifer dominated by turbulent conduit flow (B). In (A), cave voids are flank margin caves, which are irregular in shape, parallel to the strike of the coast, and are embedded in a diffuse flow system. In (B), cave voids are epigenic stream caves, which are linear and regular in shape, oriented perpendicular to the coast (in their distal portions), and are part of a turbulent flow regime. Field work on telogenetic coastal karst aquifers has demonstrated that flank margin caves can still form in the gaps between conduit flow paths (e.g., [21].
Geosciences 08 00268 g005
Figure 6. Evidence for geochemically-active freshwater lenses in small islands. (A) The right hill in the image is Sugar Loaf Cay, Abaco, approximately 10 m high. It would have been an isolated island at the +6 m sea-level of MIS 5e. (B) Small cay offshore Middle Caicos Island provides a present-day model for the condition of Sugar Loaf Cay during MIS 5e. The bioerosion notch visible in this cay is not present on Sugar Loaf Cay, a result of surface denudation in the 115 ka since MIS 5e. (C) Main chamber of Sugar Loaf Cave North, a flank margin cave. (D) Map of Sugar Loaf Cave North. The entrances have formed as a result of surface denudation of Sugar Loaf Cay since MIS 5e (or 115 ka); the cave originally formed as a sealed chamber.
Geosciences 08 00268 g006
Figure 7. A hypothetical circular simple carbonate island made of eogenetic carbonate rock, 1 km in radius. Assume a 0.3-m dissolutional conduit drains the center of the island to the coast (vertical blue line). Meteoric water falling at A will have a diffuse flow pathway to the coast that is shorter than the diffuse flow pathway to the conduit (textured outer rim of the figure). Meteoric water falling at B will have a diffuse flow pathway to the conduit shorter than the diffuse flow pathway to the coast (solid inner part of the figure). The A and B waters will take different flow paths, with different flow characteristics, to the coast. Water at C and D is on the flow path distance boundary. The more efficient conduit flow path would be expected to create a trough in the freshwater lens that would draw water at C and D towards the conduit. The degree to which such a trough extends out into the rim of the island (texture part of the figure) depends on many variables: rock hydraulic conductivity, recharge rates and volumes, tidal forcing, etc.
Geosciences 08 00268 g007
Figure 8. Satellite false-color image of San Salvador Island, Bahamas, courtesy of NASA. The image displays the problems of assuming the freshwater lens size is equivalent to island size. The light blue water body on the southeast side of the island is Pigeon Creek, a sea water lagoon. Dark bodies of water are inland lakes with normal or slightly elevated marine salinities. The light gray/green water bodies are hypersaline lakes (commonly 80 ppt). The freshwater lens exists as multiple lenses that are found only in the land masses that separate the inland water bodies. Also note that the island occupies about 80% of the small platform it rests on (light blue rim around the island, largest to the north). A sea-level drop will increase island size by only a small amount, but will eliminate the interior lakes, which are all shallow.
Geosciences 08 00268 g008
Figure 9. Blue holes in the Bahamian Archipelago. (A) Dean’s Blue Hole, an ocean hole on Long Island, Bahamas, connected to the open sea by a shallow lagoon, which has restricted sediment transport that would infill the blue hole. The water column is entirely marine. The depth is 202 m [27]. The blue hole collapse prograded upward to reach the surface, including removing part of an overlying dune ridge (under the letter A). (B) Inland blue hole in the interior of North Andros Island. It is protected from marine infill processes and contains freshwater on top of a halocline/mixing zone, which is on top of marine water. Depth is over 30 m. In both (A) and (B), the depth results in a dark blue color; in both cases, shallow adjacent water has the classic light blue color of Bahamian lagoons.
Geosciences 08 00268 g009
Figure 10. Conduit growth rates based on Moore et al. [29] along with the discrete porosity sizes indicated. The middle conditions are touching-vug porosity, and the end conditions are conduit flow. The time spent at a stable lowstand through the Pleistocene is about 10,000 years, sufficient enough time to at least theoretically allow for the formation of large conduit caves. Additionally, several sea-level lowstands were repeatedly experienced during the Pleistocene allowing for re-activation of old conduits and continued dissolution.
Geosciences 08 00268 g010
Figure 11. The initial condition (radius = 0.0005 m) trial Reynolds numbers under the three different recharge rates. Note that the Reynolds numbers for all of the different island sizes are below the hydraulic conductivity suggested by Whitaker and Smart [28], 5 m day−1. This suggests that the islands regardless of size can all discharge the aquifer through diffuse flow as n-D tubes. However, karst aquifers are heterogeneous, non-isotropic, and self-modifying, and as such, they will self-organize, developing touching-vug porosity and cavernous porosity (e.g., conduits) given sufficient time and flow.
Geosciences 08 00268 g011
Figure 12. The touching-vug porosity (radius = 0.035 m) trial Reynolds numbers plotted against island size (the scatter plot). Note that for small island sizes, the Reynolds numbers are plotted below the hydraulic conductivity suggested by Whitaker and Smart [28] (the horizontal line), 500 m day−1, whereas for the larger island sizes, the Reynolds numbers are plotted above the hydraulic conductivity. (A) Assuming a recharge rate of 0.5 m y−1. (B) Assuming a recharge rate of 1.0 m y−1. (C) Assuming a recharge rate of 1.5 m y−1. Note that as recharge increases, the Reynolds numbers increase slightly; however, the effect is minimal.
Geosciences 08 00268 g012aGeosciences 08 00268 g012b
Figure 13. The conduit flow (radius = 0.75 m) trial Reynolds numbers plotted against island size (scatter plot). Note that for small island sizes, the Reynolds numbers are plotted below the hydraulic conductivity suggested by Whitaker and Smart [28] (the horizontal line), 5000 m day−1, whereas for the larger island sizes, the Reynolds numbers are plotted above the hydraulic conductivity. (A) Assuming a recharge rate of 0.5 m y−1. (B) Assuming a recharge rate of 1.0 m y−1. (C) Assuming a recharge rate of 1.5 m y−1. Note that as recharge increases, the Reynolds numbers increase slightly; however, the effect is minimal.
Geosciences 08 00268 g013aGeosciences 08 00268 g013b
Figure 14. The effect of reducing the amount of water from draining from the aquifer through the conduits (radius = 0.75 m) as exemplified by the 1-m y−1 recharge rate (the scatter plot). (A) Assuming the entire amount of recharge drains through the conduits (note this is the same as Figure 13B). (B) Assuming that only half of the water drains through the conduits. (C) Assuming that only one-quarter of the water drains through the conduits. Note that as more water is diverted to diffuse flow, the Reynolds numbers are deflected closer to (or below) the hydraulic conductivity that Whitaker and Smart [28] observed (5000 m day−1), showing that the aquifer is able to drain more effectively. The examples shown here are more realistic in that the aquifer can and will drain through both conduit and diffuse flow, as is seen in carbonate islands that have both conduit and flank margin caves present.
Geosciences 08 00268 g014aGeosciences 08 00268 g014b
Figure 15. Map of the Agana area, Guam, modified from Moran and Jenson [38]. Flow routes and times from two separate dye traces are shown. Flow though the matrix of the eogenetic limestones displays longer transit times than flow along faults and fractures, demonstrating a dual flow system in this karst aquifer.
Geosciences 08 00268 g015
Table 1. The major banks in the Bahamian Archipelago along with their sizes and the presence of conduit caves as mapped through cave diving (data from Larson et al. [26]). All banks in the Bahamas support flank margin caves. Great Bahama Bank was divided at the Tongue of the Ocean to more accurately represent its size.
PlatformMajor Axis (km)Minor Axis (km)Hosts Conduit CavesHosts Flank Margin Caves
Rum Cay1710NoYes
San Salvador2512NoYes
Mayaguana5015YesYes
Cat Island7520YesYes
Acklins and Crooked8070YesYes
Cay Sal11570YesYes
Little Bahama Bank240100YesYes
E. Half of Great Bahama Bank300120YesYes
W. Half of Great Bahama Bank525150YesYes

