Towards National Archaeological Mapping. Assessing Source Data and Methodology—A Case Study from Scotland


Historic Environment Scotland, John Sinclair House, 16 Bernard Terrace, Edinburgh EH8 9NX, UK
*
Author to whom correspondence should be addressed.
Geosciences 2018, 8(8), 272; https://doi.org/10.3390/geosciences8080272
Submission received: 6 July 2018
/
Revised: 20 July 2018
/
Accepted: 24 July 2018
/
Published: 26 July 2018
(This article belongs to the Special Issue Earth Observation, Remote Sensing and Geoscientific Ground Investigations for Archaeological and Heritage Research)
Abstract
:While the National Record of the Historic Environment (NRHE) in Scotland contains valuable information on more than 170,000 archaeological monuments, it is clear that this dataset is conditioned by the disposition of past survey and changing parameters of data collection strategies over many decades. This highlights the importance of creating systematic datasets, in which the standards to which they were created are explicit, and against which the reliability of our knowledge of the material remains of the past can be assessed. This paper describes issues of data structure and reliability, then discussing the methodologies under development for expediting the progress of national-scale mapping with specific reference to the Isle of Arran. Preliminary outcomes of a recent archaeological mapping project of the island, which has been used to develop protocols for rapid large area mapping, are outlined. The primary sources for the survey were airborne laser scanning derivatives and orthophotographs, supplemented by field observation, and the project has more than doubled the number of known monuments of Arran. The survey procedures are described, followed by a discussion of the utility of ‘general purpose’ remote sensed datasets, focusing on the assessment of strengths and weaknesses for rapid mapping of large areas.
1. Introduction
Approaches to archaeological survey and mapping of the historic environment in Scotland range from broad-brush characterisation, such as Historic Land-use Assessment (HLA) [1,2], to exploration through archaeological survey of landscapes and sites in varying degrees of detail [3,4,5]. The former has achieved national coverage, providing generalised mapping of Scotland’s historic environment that is useful for strategic purposes such as feeding into national planning policy and management [6]. Archaeological survey has provided systematic and detailed information, which is valuable for site and landscape management and understanding of Scotland’s past, for relatively small areas of the country. For example, field survey projects by the former Royal Commission on the Ancient and Historical Monuments of Scotland (RCAHMS) since the mid-1980s, and currently run by Historic Environment Scotland (HES), have covered about 10% of Scotland’s landmass. These surveys, which mapped the visible topographic archaeological remains at various scales may add in these areas anything between 50% and over 200% of the previously known inventory of sites to the National Record of the Historic Environment (NRHE—formerly known as the National Monuments Record of Scotland (NMRS)). This shows that the contents of the NRHE are unrepresentative when considered at regional and national scales, and that the majority of the archaeological sites and monuments that survive in Scotland’s landscape are not on record (Figure 1). RCAHMS/HES’ established approaches to archaeological survey cannot realistically expect to achieve national levels of systematic data collection without either a massive increase in human resourcing or conducting such survey over very long periods of time, measured in centuries. This means that the prospect of creating systematic national coverage of archaeological information at a level that can inform site and landscape-scale management and understanding is a very distant prospect, leaving us with the knowledge that large numbers of sites and large areas of archaeological landscape remain unrecorded.
For HES, as the lead public body for the historic environment in Scotland, the knowledge that the existing data available in the NRHE is biased, and only very generally representative of what survives in the landscape, is a challenge. Knowing that established approaches to field survey are not scalable, a response, supported by the increasing availability of remotely sensed datasets, has been proposed. Using the Isle of Arran as a case study, this paper presents a methodology under development in which remote sensing data is the primary source for archaeological prospection of large areas. This approach aims to make best use of the resources available in Scotland, responding to variability in local environmental conditions and addressing the challenges of developing survey practice.
The paper begins by outlining the history and character of Scotland’s NRHE, within a context of other national mapping programmes in Scotland and beyond (Section 2). Thereafter, we explain why Arran was chosen as an outdoor laboratory for scoping our approach to rapid large area mapping (Section 3). This is followed by discussion of the remote sensed datasets that were used, and the desk-based and field survey methodologies (Section 4). Preliminary results from the Arran survey are presented (Section 5), providing context for elaboration of initial survey outcomes, in particular addressing the reliability of desk-based interpretation and the roles of targeted field observation (Section 6). The paper concludes with a discussion of the utility of the available remote sensing datasets and outlines some next steps in scoping our approach to national archaeological mapping (Section 7).
2. A National Archaeological Record—Setting the Scene
Reliable and systematic information about the distribution and character of the archaeological record are amongst the principal foundations of effective heritage management and sound research. However, critical analysis of heritage datasets will usually quickly reveal how unrepresentative they are, constituted as they may be from multiple sources. This issue is the central objective that the development of national archaeological mapping protocols seeks to address—by leveraging the proliferation of remote sensed data and devising appropriate survey methodologies to generate systematic data. In Scotland, this means exploring the potential to address the current limitations of the NRHE through systematic archaeological survey, at a national scale, and in a timescale of years rather than many decades or even centuries.
2.1. The National Record of the Historic Environment—Origins and Character
Scotland’s NRHE, delivered online through an interface known as Canmore [7], is many things. It is an index to the Historic Environment Scotland archive—a national collection of material relating to archaeology, buildings, industrial and maritime heritage. It is a catalogue of images relating primarily, but not exclusively, to Scotland and it is an inventory of recorded historic monuments, archaeological fieldwork and architectural and aerial surveys [8,9,10]. It is important to recognise that it is not a single, comprehensive survey, but has grown organically with roots linking it to numerous sources of information This work spans over 200 years of investigation and collection and includes the work of map makers who wished to depict archaeological landmarks, inventorying programmes, and emergency surveys in response to land use change, amongst others. Each had different motivations and specifications for what they included, and these continue to have a profound impact on the character of the incomplete and patchy information that makes up the NRHE.
Early modern surveyors, such as Timothy Pont in the late 16th century [11], were some of the first to record archaeological monuments in Scotland on an ad hoc basis. William Roy, the military cartographer, took a more systematic approach, publishing his “Military Antiquities of the Romans in North Britain”, in 1793 [12]. Between 1843 and 1882 the Ordnance Survey (OS) carried out the first nationwide survey of Scotland [13]. This included many of the more prominent archaeological monuments, but was not necessarily systematic, drawing on the knowledge of local informants. The depiction of archaeological sites on OS maps continued on an ad hoc basis with subsequent editions until the 1920s when the OS appointed O.G.S. Crawford as their first archaeology officer, a position he grew and developed into what became the Ordnance Survey Archaeology Division [14]. This body was responsible for documenting the ancient monuments that were included on the OS maps in a card index [15], with field checking and inspection of aerial photographs in support. When the Ordnance Survey embarked on a Scotland wide map revision, this included the OS Archaeology Division carrying out a nationwide programme of field survey between 1947 and 1983 [14].
The establishment of the Society of Antiquaries of Scotland in 1780 provided another focus for growing antiquarian work, including the results of field survey work [16]. This growing interest in ancient monuments became a driver for State funded survey, with the establishment in 1908 of RCAHMS to, “…make an inventory of the ancient and historical monuments…” [9]. Work on a national inventory began by creating a series of regional inventories, beginning with the publication of the County of Berwick in 1909 [17], in a programme that was stopped in the mid-1980s, and replaced with an area-based approach to field survey.
In 1983 the OS Archaeology Division was disbanded, and its functions passed to other organisations. At the same time the antecedent of the NRHE was created, with at its core, the OS record cards [18]. This record continues to be a primary repository for archaeological survey and other information derived from a range of sources. Significant contributors include the Council for Scottish Archaeology (CSA) who since 1947 have published an annual list of fieldwork and discoveries [19]. This, along with an online recording environment known as OASIS, provide the public, academics and commercial organisations with a mechanism by which to contribute new information to Canmore [20].
The archaeological survey work of RCAHMS/HES has developed over the years. Field recording has moved away from creating inventories to recording smaller areas. Field survey has been complemented by the addition of an Aerial Survey programme initiated in 1975 [9,21]. Desk-based projects, such as the First Edition Survey Project (FESP) which assimilated evidence of unroofed buildings and other remains from the mid-19th century maps into the NRHE [22], have also contributed (Figure 2 and Figure 3). And, as might be expected, the definitions of what comprises an archaeological site have changed, with the progressive routine inclusion of 19th century remains and military archaeology of 20th century date [23,24,25].
It should be clear from these examples of the many sources of information which make up the NRHE that the Record’s holdings do not represent a comprehensive survey of Scotland. It is an inventory of what has been recorded. It reflects the interests and recording policies of those that created it, with clear bias in contents as a result [26]. Thus, areas of systematic survey can be identified (Figure 2), with areas that have attracted less attention also evident, such as the northwest Highlands. While the latter may be in part due to the terrain in this area, it does also reflect a lower intensity of survey activity. A bias towards the lowland areas of Scotland is reinforced by the aerial reconnaissance programme which has long maintained a focus on lowland agricultural landscapes, most conducive to cropmarking. Most biases in the NRHE are subtle and may reflect the aims of the individuals involved in the recording, or the focus of a specific project (Figure 3).
2.2. Scoping a National Archaeological Mapping Programme
When the national programme of County Inventories for Scotland was initiated in 1908 there was an aspiration to cover the entire country, though it was quickly recognised that this was not readily achievable [9]. Since then, broad brush characterisation and desk-based assessments like FESP and HLA have achieved national coverage at a resolution of 1:10,000 and 1:25,000, respectively. However, aspirations to achieve systematic national archaeological mapping have been a distant hope. Indeed, resourcing constraints and survey policy have rather focussed on discrete area surveys. Thus, nothing has taken place in Scotland like the National Mapping Programme (NMP) developed in England [27,28,29] to identify, map, record, and better understand archaeological sites and landscapes through effective use of remotely sensed data. This programme is being reviewed at the time of writing, but it covered just over half of England’s land mass, documenting over 120,000 newly discovered archaeological sites over several decades with significant human resourcing. This is due, in part, to its aspiration to basic line work and polygonised depiction of the visible archaeological features. A rather different approach has been taken in Baden-Württemberg, Germany, where rapid mapping based on airborne laser scanning (ALS) derivatives by a single operator has generated large area coverage and some 600,000 monuments over less than a decade [30]. These are amongst a number of approaches to large area or national mapping, and have most relevance to a Scottish context.
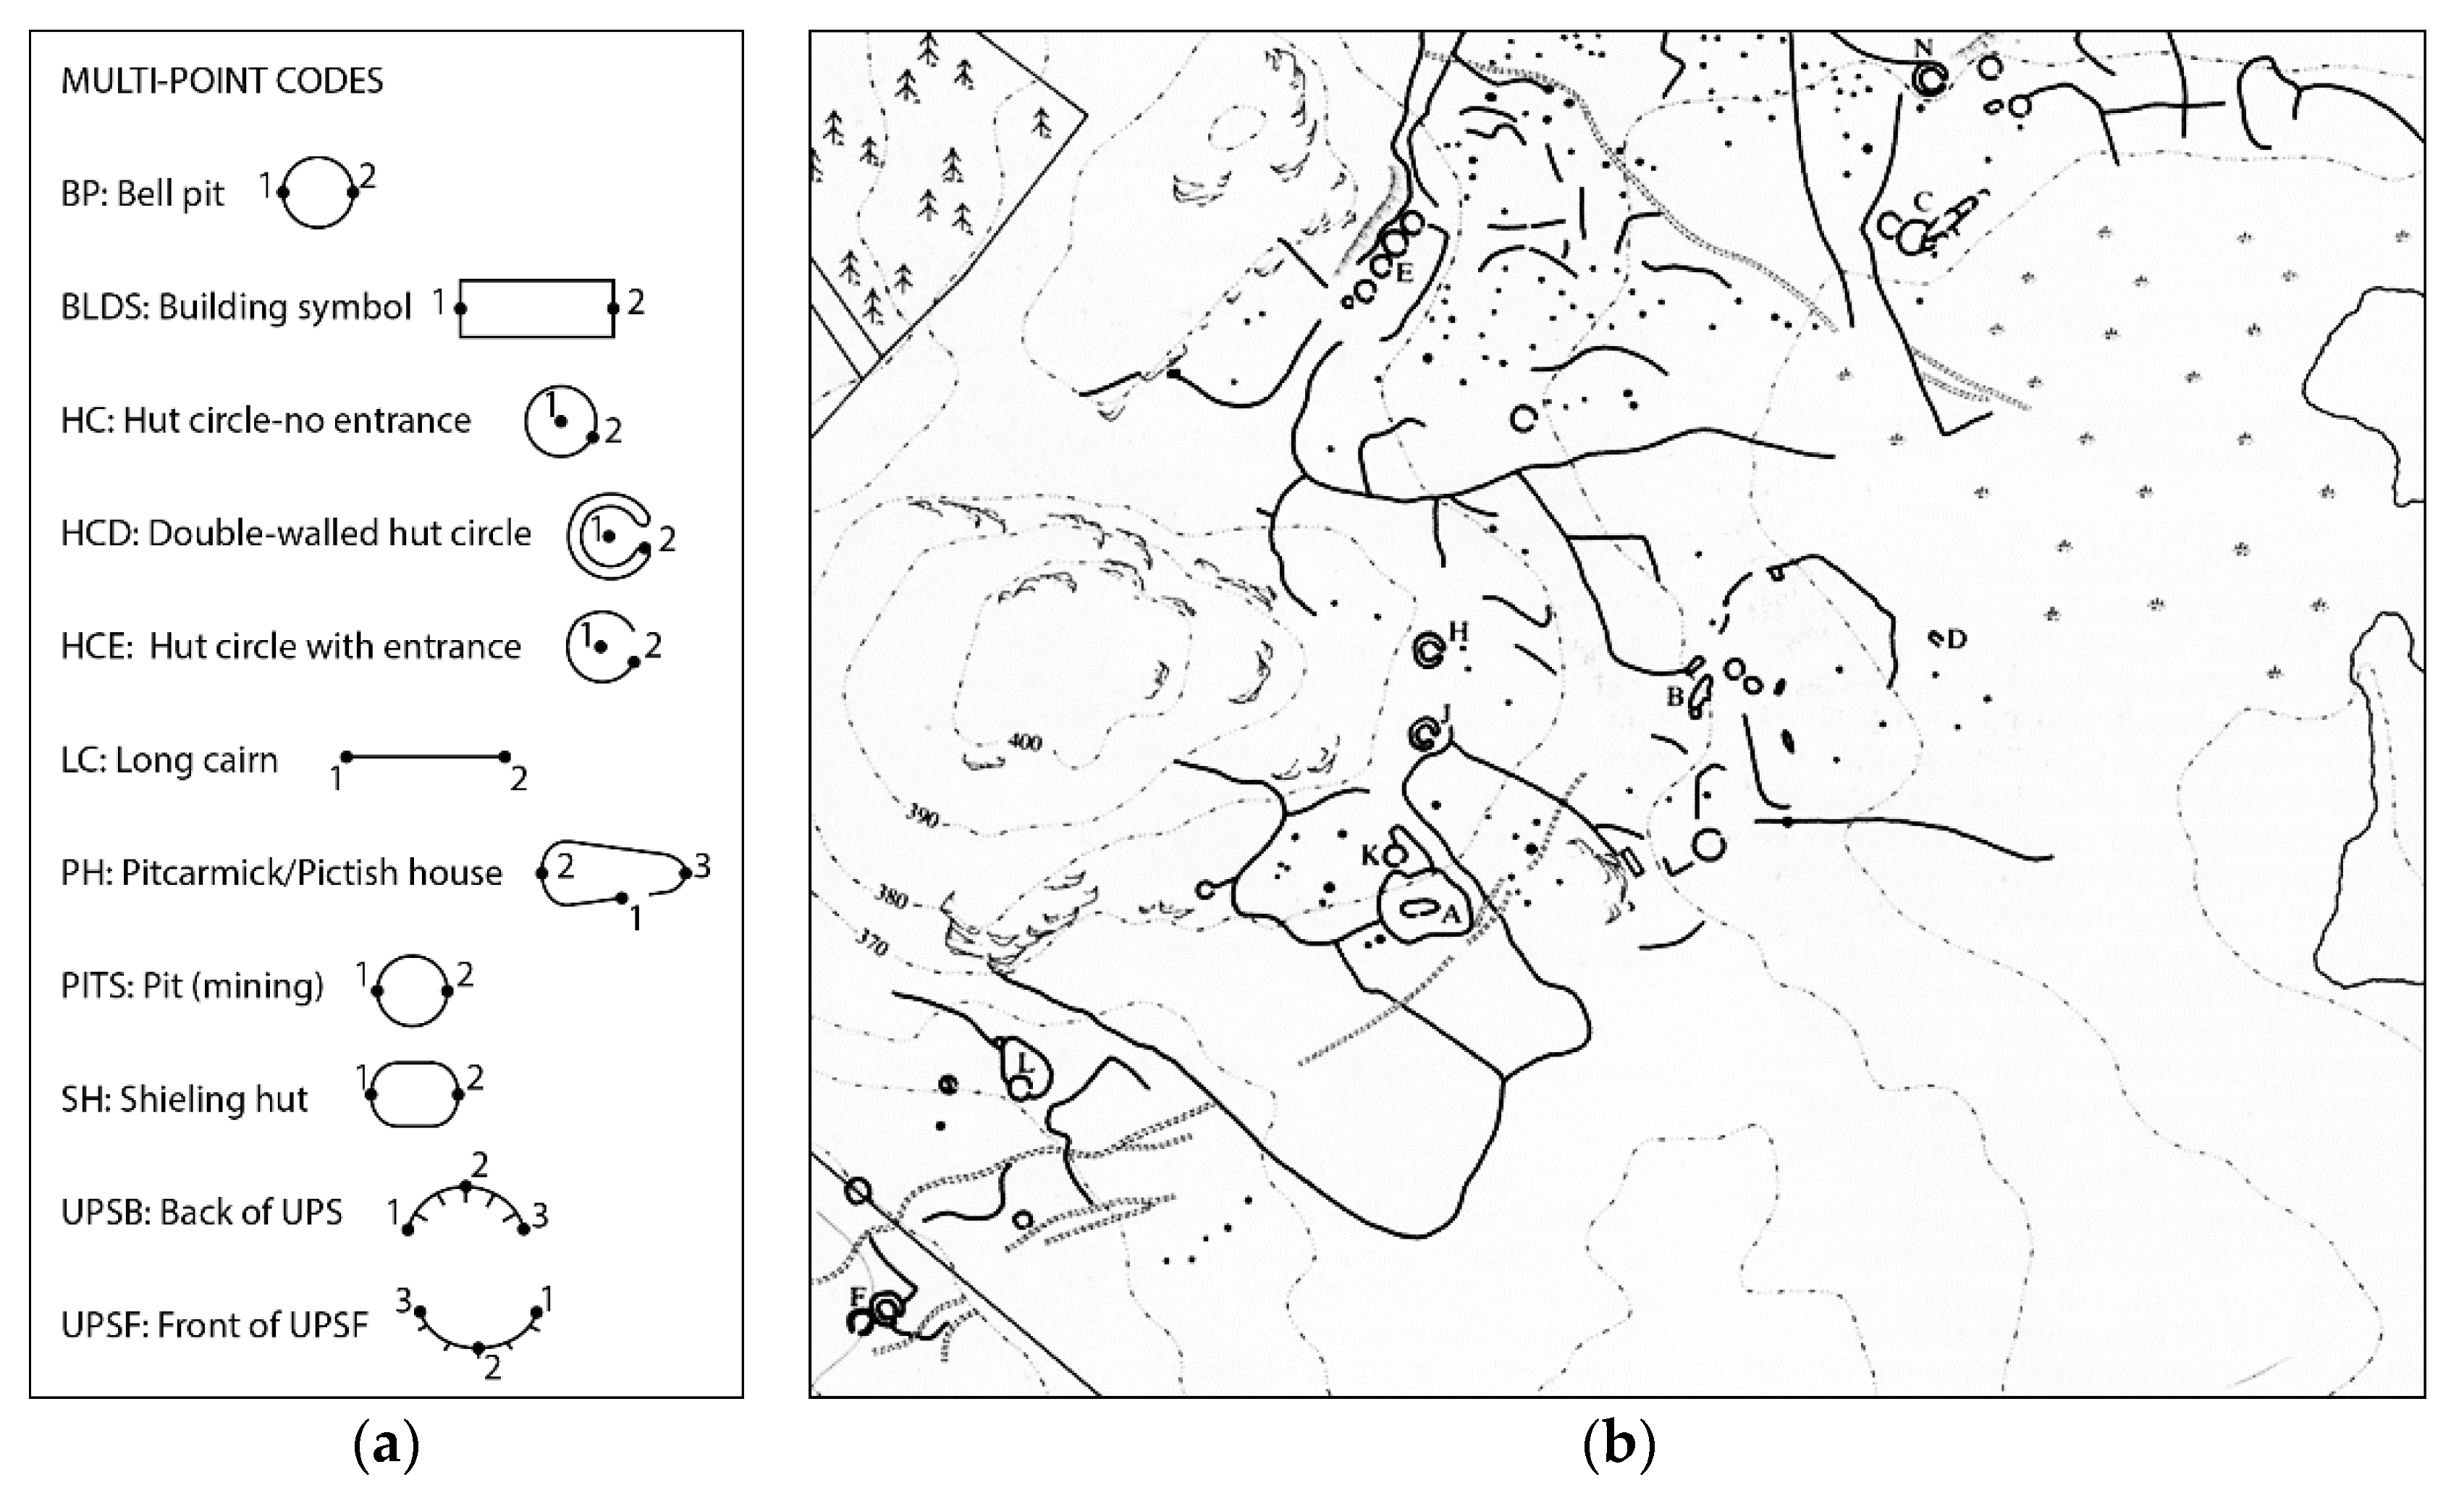
These examples of very large area mapping have a bearing on considerations of how to frame an approach to rapid national archaeological mapping in Scotland. The need to balance area coverage and rapidity of work with the level of detail recorded has been identified as a central issue. Indeed, a tendency to record in increasing degrees of detail can be identified in some of the survey projects shown on Figure 1. The second-named author (DCC) started working in field survey in the late 1980s in a project aiming to sample areas at general threat from afforestation. This Afforestable Land Survey initially used basic survey techniques to map coordinates and site areas quickly, supplemented by text descriptions. In the late 1980s an electronic theodolite was acquired, representing a big improvement in the metrical accuracy that could be achieved in site location. Initially, rapid mapping methods were maintained, using one- and two-point codes to map rectangular and round buildings at 1:10,000 map scale (Figure 4). However, in fairly short order, the team moved to more detailed recording, for example mapping all four corners of a building, and its partitions and other internal features. Therefore, what had started as recording a single centre point, or two points at either end of a building that took one minute to record, became a five-minute exercise collecting eight or more survey points. This, in microcosm, illustrates a tendency for archaeological recording to be drawn into detail, with consequent implications for the resource required, and a drift in the survey specification from rapid mapping to more detailed considered treatment. While this had a benefit in detail of record, the casualty was the rate of area coverage.
Keeping in mind the tendency for a drift to detail, the specification for the development of a modern national archaeological mapping emphasises speed and economy over detail, recognising that it is one approach in a nested set of levels of survey.
3. Case Study Area: ‘Scotland in Miniature’
The requirement to develop an approach to national archaeological mapping, as one strand of HES’ survey programmes, is underpinned by a belief that the NRHE should be as comprehensive as possible to inform understanding and management; including within the planning system and for designation. The increasing availability of high-resolution topographic (e.g., ALS) and optical (e.g., colour orthophotographs) data provides an opportunity to explore methods of area archaeological survey that can achieve rates of coverage considerably in excess of existing approaches. Economy and speed are key considerations if national coverage archaeological survey is to be achieved, and this foregrounds the efficient use of remote sensing (RS) data. Moreover, the RS data are ‘general purpose’ ALS and orthophotographs, that are freely or cheaply available, supplemented by oblique aerial photographs, historic aerial photographs and field observation. The island of Arran has been used as a laboratory to develop protocols for a National Archaeological Mapping Programme (NAMP), where the use of remote sensing data has been prioritised in the methodology, using ALS data as the primary source, with orthophotographs, field reconnaissance and field observation in supporting roles to address particular issues, such as poor RS data quality, dubiety in interpretation, or monument types that will not register in a digital terrain model (e.g., very small structures).
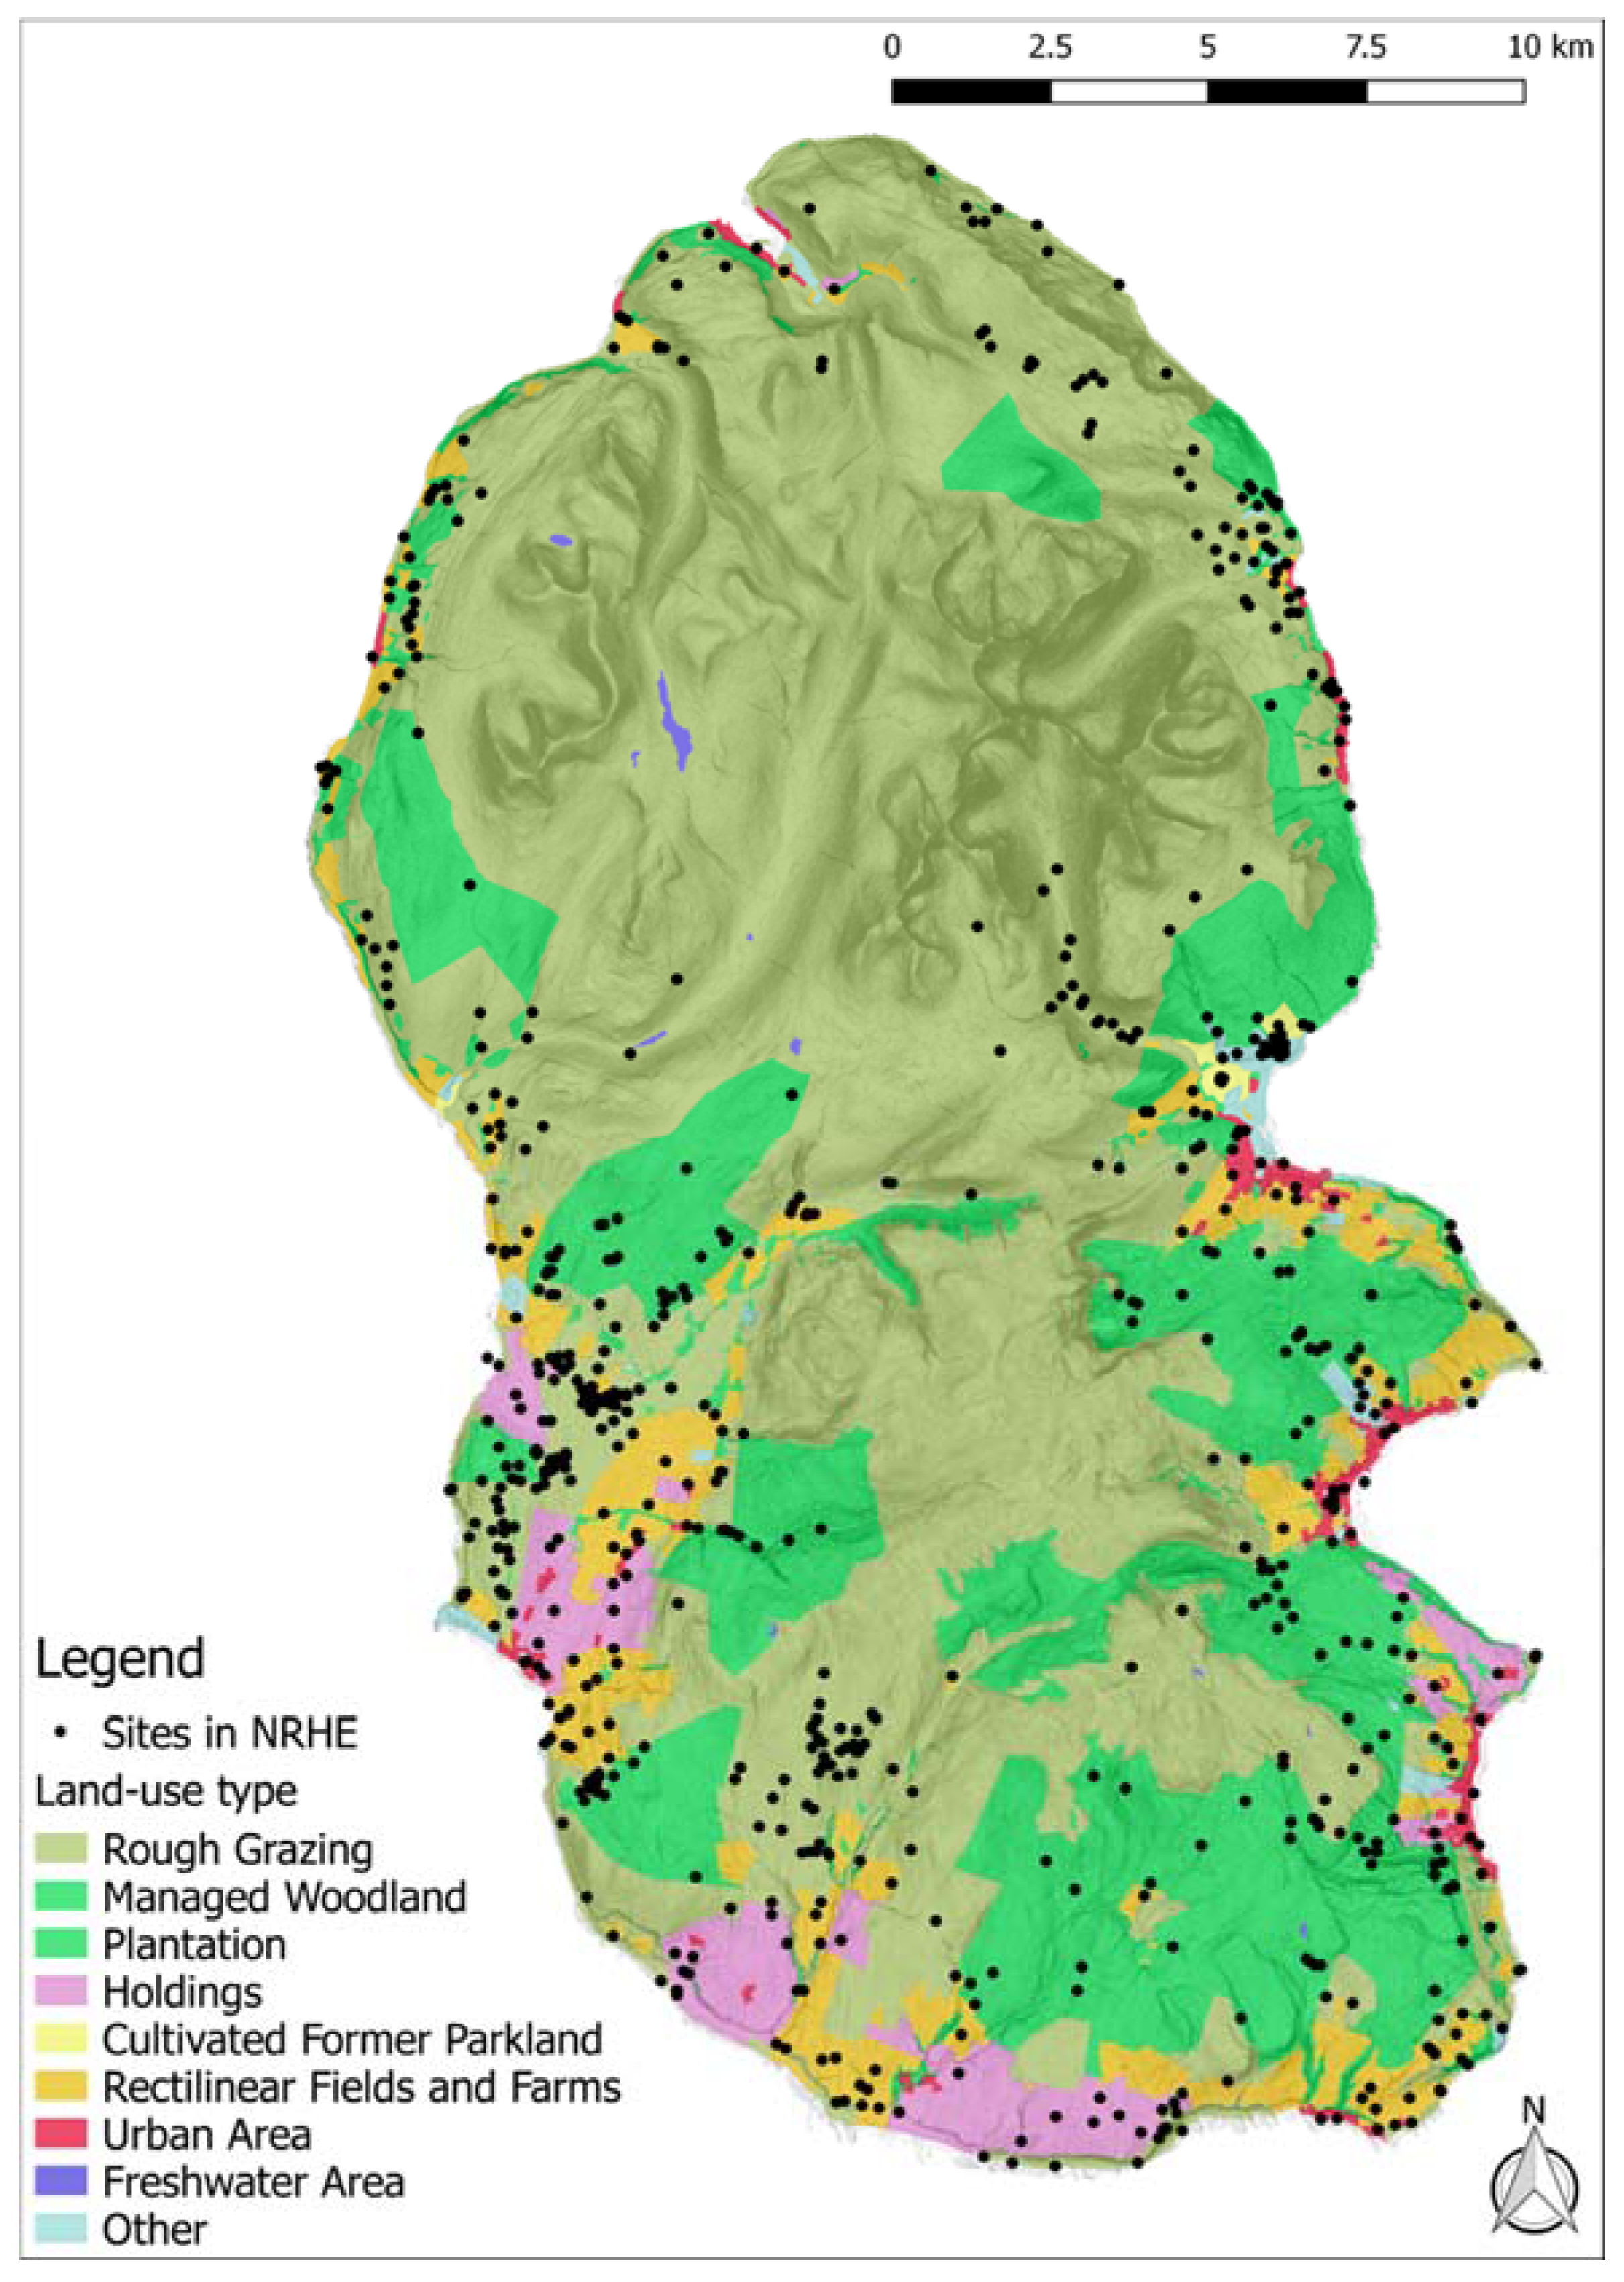
Arran, which is often referred to as ‘Scotland in Miniature’ because of its range of topographic and land use types, extends to some 432 km2 and lies in the Firth of Clyde, on the west coast of Scotland. It has been selected as a laboratory for developing and testing NAMP approaches for several reasons. Firstly, it has been entirely covered with publicly available ALS data, orthophotographs, and historic aerial images (cf. Section 2.1). Secondly, the island represents a broad range of topographic, geological and land use types (Figure 5). Thirdly, there is a great diversity of archaeological remains on the island, which mirror the evidence across Scotland, ranging from the Neolithic to the Cold War. Fourthly, given the available resources, the size of the island was ideal to undertake a survey in a relatively short time. Finally, Arran is easily accessible from mainland, simplifying fieldwork logistics.
4. Materials and Methods
As digital topographic datasets have become more readily available in Scotland, there has been a growing recognition of their value for landscape survey. Preliminary assessment of the Arran ALS data in July 2017 indicated its effectiveness in capturing many archaeological features and also the textures of the landscape [32]. This is in marked contrast to the available orthophotographs where summer vegetation (e.g., bracken) obscures many areas and lighting conditions in winter imagery are variable in the extent to which they enhance archaeological remains, though they provided other valuable information. Following preliminary assessment in 2017, the work was structured around a desk-based mapping phase (Section 4.2) in late 2017 and early 2018, followed by a field survey phase in spring 2018 (Section 4.3).
4.1. Data Sources
Keeping in mind that the methodology under development requires to be scaled up to a national programme, the survey of Arran made use of general purpose RS datasets [33]. This approach has significant implications, primarily accepting that the ALS data specification was not optimised for archaeological purposes. However, while recognising the importance of controlling data acquisition parameters in ideal situations [33,34,35], since the core objective is to achieve national coverage, using freely available data is very important. This is because it is highly unlikely that commissioning bespoke ALS survey of the entire country for archaeological purposes would ever be affordable.
General purpose ALS data have been already collected for some of Scotland, with full coverage planned in the future. To date, two data collections of Scottish Public Sector ALS (Figure 6) have been commissioned by Scottish Government, Scottish Environment Protection Agency, Scottish Water (phase I only), sportscotland (phase II only), and 13 local authorities (phase II only) collectively. In the second phase, the data was acquired between November 2012 and April 2014 for 66 areas across Scotland, including Arran, covering a total of 3,516 km2. The commissioned point density was a minimum of 1 pts/m2, and approximately 2 pts/m2 on average. However, the data collected for Arran is notably higher quality, with an overall point density of 4.67 pts/m2, with last echoes at 3.86 pts/m2, and average ground point density of 2.95 pts/m2.
Modern orthophotographs were also used in the project, supplied to HES as part of a Service Level Agreement, also administered through the Scottish Government. This comprises tiled imagery, at 25 cm ground sampling distance, derived from two surveys in winter 2008 and June 2011. In addition, aerial photographs taken from light aircraft and those from the aerial photographic archives of HES have been used as supporting information, with images dating back to the 1940s.
4.2. Desk-Based Survey Methodology
The ALS data was processed to produce a digital terrain model (DTM) at 0.5 m spatial resolution, based on ALS point clouds of 0.58 m ground point spacing. Next, several DTM) visualisations were generated using the Relief Visualisation Toolbox [36,37], and uploaded to the ArcGIS environment, where all digital datasets were analysed and interpreted.
Before the survey the NRHE contained 774 archaeological records on Arran, including stray finds (i.e., axeheads, flint tools, pottery), earthworks and standing remains (i.e., castles, buildings, huts, cairns), and a range of other monument types (historic drainage, field systems, quarries, standing stones, tracks, etc.). Stray finds were excluded from further processing and during preparatory work the remaining 671 site locations in the NRHE had site areas polygons produced with reference to paper record maps, orthophotographs and the ALS data. As a result, the locations and extents of known archaeological features were determined and informed later phases of the project.
Thereafter, in preparation for a programme of field survey in Spring 2018, eight interpreters with field survey experience undertook rapid interpretative mapping on the basis of ALS derivatives (Table 1), orthophotographs, and supporting information such as 19th century maps. The interpreters had different backgrounds and levels of experience in dealing with aerial imagery and/or remote sensing products. Within a defined timeframe (3 days), an average coverage of 90 km2 per person was achieved. All areas were covered by at least two observers, and an experienced interpreter examined the entire island and undertook some validation of initial outcomes. Apart from demarcating the extent of the archaeological features identified during the desk-based work, the interpreters were asked to provide basic classifications of site type and to assess how confident they felt about their observations. Three different levels of confidence were established (Figure 7). Features clearly visible on the ALS and/or the orthophotographs and easily classified were assigned the highest confidence. Less certain interpretation was marked with a medium level of confidence, while ambiguous features that nevertheless appeared to be of potential interest, were identified with the lowest confidence level. The initials of interpreters were documented in each record to support subsequent analysis of results.
4.3. Field Survey Methodology
The fieldwork phase of the project was conducted over six weeks in Spring 2018 by three teams each of 2–3 members, amounting to a total field input of about 150 person days. The teams, mainly made up of staff that were involved in the desk-based mapping phase, were supplied with personal GPS units and pen computers with a fully operational ArcGIS. Thus, whilst surveying, team members had access to the RS data and layers of current NRHE records as well as the outcomes of desk-based assessment. Field survey was directed towards visiting and assessing the identified low confidence level targets. Polygons marked with the highest level of confidence (level 1) were not investigated unless these were in the vicinity of level 2 and 3 targets and could be easily accessed or where there was another factor, e.g., obvious misinterpretation. In the same manner, existing NRHE records were not visited, since the project aimed to maximise the returns of previously unknown sites. Basic attribute data fields were used to document the identities of those who undertook the field observation and basic notes of observations. All field workers documented routes taken during field investigation using personal GPS units. The fieldwork teams were also encouraged to explore the landscape, especially in gaps in desk-based identifications and areas where the ALS might not be as effective (e.g., areas of woodland), to establish what additional sites might be identified.
5. Results
The desk-based mapping identified about 2100 targets (Figure 8), of which more than half (ca. 59%) were given a high level of confidence in interpretation, with nearly 27% given a medium level of confidence and about 14% with the lowest level of confidence. During the field survey weeks nearly 94% of the low confidence identifications and about 10% of the highest confidence targets were visited and evaluated. However, the above figure does not represent the number of newly discovered archaeological monuments on Arran. Whereas some of the identified features were recognised by more than one interpreter, resulting in multiple polygons (Figure 8), other targets were dismissed during the field reconnaissance and observation phase and classified as natural objects or identified as current land use.
In addition, more than 300 sites were recorded during field reconnaissance only. Amongst these were: (a) small monuments, which could not be recognised in the ALS derivatives due to poor survey point distribution, (b) structures indistinguishable within boulder fields and scree, (c) sites in dense coniferous woodland, where ALS penetration capacity was limited, and (d), monuments visible in the ALS visualisations, but which were not noticed during desk-based mapping.
The recording of most walking by personal GPS units demonstrate extensive patterns of walking (Figure 8). It is clear that most of the island where targets had been identified during desk-based mapping were covered. This excludes areas in the centre and southeast where nesting birds created exclusion zones (to be visited at a later date), and high-altitude areas in the north, where potential targets identified during desk-based mapping were judged with the benefit of field experience as likely to represent geological features rather than archaeological monuments.
6. Discussion: What the Laser Saw, What the Lens Saw, and What the Surveyor Saw
The methodology outlined above represents a shift from the predominant reliance of HES area archaeological survey on field survey and ground observation, informed and supported by available aerial photographs. Rather, the approach foregrounds remote sensing data, in this instance, ALS, as the primary source for identification of earthworks and other archaeological remains, with targeted field reconnaissance and observation to explore specific issues of identification and weaknesses in the ALS data.
This methodology is not without risks and challenges. By limiting time spent in the field, and not visiting the majority of identified sites, the approach requires the development of experience and trust in interpreting RS data. This is built on field observation skills and knowledge, but nonetheless requires additional training in reading ALS derived visualisations. It is clear that there are differences between the products of the individuals undertaking the desk-based interpretations, an issue that will need to be addressed to produce coherent standardised results if the approach is to be scaled to a national level. This will include the need to develop clear protocols for defining site extents and classifications and for collecting metadata, for example, on which visualisations were used. Additionally, archaeological sites which were identified only during fieldwork, yet were clearly evident in ALS derivatives, demonstrate that improving skills in interpretative desk-based mapping is required to efficiently use data. Nevertheless, in many cases, the relatively high-resolution Arran data was not sufficient to visualise small archaeological features, such as huts and kilns, that were identified during field reconnaissance. In other areas, with sparse ALS ground points, site classifications from desk-based mapping were not correct and thus modified in the field. These are among the issues which demonstrate the importance of the analysis of data characteristics and survey methodology to inform the understanding of biases in the outputs of such survey [38]. Indeed, given the variability from area to area in factors such as data quality, the character of archaeological remains and vegetation cover, local assessments of data characteristics, including point density, are vital to analysing the levels of confidence of the survey outputs.
For instance, poor ALS penetration of coniferous plantations significantly limited the productiveness of the desk-based interpretation in such areas. For this reason, targeted field reconnaissance was undertaken in accessible areas of plantations (e.g., gaps in the trees along water courses, thin plantings). In particular, prospective ground reconnaissance was undertaken along small valleys in the knowledge that medieval and post-medieval shieling huts might be expected in such locations. This proved to be the case, with the discovery of groups of huts which were entirely invisible in the ALS data. In addition, other archaeological monuments were recorded solely through field observation in open land with good point densities. For example, sites lying within boulder fields and scree were often not identified during the desk-based mapping because of the ‘noise’ created by the random distribution of boulders and survey points which obscured the archaeological structures. These examples clearly demonstrate that field observation is necessary to examine areas where the ALS data is identifiably poor, or where land use or topographic factors may conspire to obscure features of interest. The identification of these factors at a landscape scale is key to allocating resources in a cost-effective way; for example, recognising that large areas of open land are very effectively documented in the ALS derivatives, while in other discrete areas where the ALS is less effective, targeted field observation can be deployed to very good effect.
In many cases where the ALS data proved less effective, alternative remotely sensed data sources also proved limited in their utility. For the extensive coniferous plantations established in the second half of the 20th century the recent orthophotographs only document the extent of the trees. However, there is coverage of these areas on historic vertical aerial photographs taken in the 1940s. While the systematic examination of this imagery for Arran has not yet been undertaken, preliminary assessment demonstrates that they have value in providing archaeological information for areas that are otherwise largely a closed book. Utilising such imagery is not without its challenges, as, for instance, the photographs need to be georeferenced and variable scales and quality of imagery are present.
This variability in potential utility is also a characteristic of the modern orthophotographs, where land use, vegetation cover, the date of photography and the conditions at the time affect the visibility of archaeological features. While the available orthophotographs for Arran provided additional information, for example in documenting vegetation, that was valuable during the desk-based interpretation, it is clear that ALS derived visualisations offer better visibility of the earthworks and other types of monuments. Like the ALS, these orthophotographs are general purpose in that they were not collected with archaeological imperatives in mind. They vary in their utility for archaeological survey, depending on the conditions under which they were taken, and for Arran they certainly provided useful corroborative information in many cases. Indeed, the aerial imagery was used to build confidence in interpretation of remains that were not clearly observable in the ALS derivatives and benefited from this additional source of information. However, it is worth noting that no archaeological topographic remains were identified solely from the orthophotographs. Furthermore, a rapid assessment of the varying visibility of remains between the orthophotographs and the ALS derivatives for Arran demonstrates that the ALS was overwhelmingly more effective at capturing the topographic archaeological remains (i.e., disregarding areas where vegetation proxies are the main source of archaeological information). This statement should, of course, be qualified as specifically relating to Arran and those particular orthophotographs, recognising also that the extent to which it applies elsewhere will vary from region to region. It would be wrong to downplay the importance of the orthophotographs for archaeological survey, though it is worth restating that the ALS for Arran was an overwhelmingly superior source of archaeological information within the scope of the survey described here.
7. Conclusions: On the Utility of General Purpose Remote Sensed Data for Archaeological Survey
Scoping a National Archaeological Mapping Programme for Scotland requires identification of appropriate expertise and resourcing, and defining protocols and time-scales. The Arran survey described here has used the island and the ALS-derived record of its topography as a laboratory to explore these issues. The survey has demonstrated the strengths and weaknesses of the available general purpose remote sensed data. It has also highlighted the variability of desk-based interpretation between individuals, as well as the necessity for targeted field observation in areas with poor data coverage and where background noise obscures the visibility of archaeological features in the ALS derived visualisations. In general, the survey has established that relying primarily on ALS data, where it is available, for archaeological survey is an effective approach that will be applicable in a broader context, and when suitable ALS data is collected for the entire country, to a national level. Skills in interpretation of remote sensed data will need to be practised in tandem with explicit protocols to ensure consistent outputs from desk-based mapping and effective deployment of field observation. Nevertheless, this is not to downplay the important supporting roles of other sources of information, such as historic aerial photographs that document landscapes which have since been heavily modified. For these areas such sources are unique. It is, however, clear that the survey of Arran has provided a massive improvement in the knowledge base for the island, and that it is the ALS derivatives that have provided the majority of this information dividend.
While this paper has focused on the development of protocols for desk-based mapping and field work in pursuit of large-area mapping, a further element of the project in support of national scaled archaeological mapping has been a proof of concept to test the contribution from developments in computer vision and deep learning. This is a work in progress in collaboration with the Norwegian Computer Center to test the utility of Deep Learning and Neural Networks to provide heavily automated identifications of archaeological remains. This is an approach that offers great potential dividends in increasing rates of coverage far beyond what the essentially manual approaches to mapping described above can achieve [39,40,41]. The outcomes of the Arran proof of concept are encouraging, with good performance for the morphologically distinctive remains of prehistoric round houses. However, the more challenging variable remains of small field clearance cairns and huts illustrate the challenges of identifying morphologically diverse groups of monuments.
The survey of Arran is a first step in the definition of an approach to national archaeological mapping, and the protocols developed during this work will be further tested on different landscapes and data. These will include assessment of areas with high ALS data point density (e.g., 25 pts/m2), as well as much lower point densities (e.g., 1 pt/m2). These assessments will be designed to further explore the relationships between source data quality and the range of data sources, including orthophotographs, to better understand the variability of the archaeological survey outputs, and the impact that has on the reliability of the NRHE for those areas.
Author Contributions
Conceptualization, D.C.C.; Formal analysis, Ł.B., D.C.C. and M.M.; Investigation, D.C.C., Ł.B.; Methodology, D.C.C., Ł.B. and M.M.; Project administration, D.C.C.; Resources, Ł.B. and M.M.; Visualization, Ł. B.; Writing—original draft, Ł.B., D.C.C. and M.M.; Writing—review & editing, Ł.B. and D.C.C.
Acknowledgments
Many people have contributed to the scoping of the Arran survey, ALS data processing, the desk-based mapping stages and fieldwork, namely Ł.B., Georgina Brown, Andreas Buchholz, D.C.C., Piers Dixon, Angela Gannon, George Geddes, Alex Hale, Luke Hooper, Žiga Kokalj, Adara López-López, Alison McCaig., Peter McKeague, M.M., John Sherriff, Robin Turner and Sasya Zeefat. The ALS point cloud is licensed under the Non-Commercial Government Licence v2.0, copyright Scottish Government and SEPA (2014). We are grateful to Piers Dixon and Robin Turner for their comments on the paper, and to the reviewers for their input to improving it.
Conflicts of Interest
The authors declare no conflict of interest.
References
- Watson, F.; Dixon, P. A History of Scotland’s Landscapes, 1st ed.; Historic Environment Scotland: Edinburgh, UK, 2018; ISBN 978-1902419930. [Google Scholar]
- Millican, K.; Dixon, P.; Macinnes, L.; Middleton, M. Mapping the Historic Landscape: Historic Land-Use Assessment in Scotland. Landscapes 2017, 18, 71–87. [Google Scholar] [CrossRef]
- RCAHMS. ‘Well Shelterd & Watered’: Menstrie Glen, A Farming Landscape Near Stirling, 1st ed.; RCAHMS: Edinburgh, UK, 2001; ISBN 978-1902419251. [Google Scholar]
- RCAHMS. In the Shadow of Bennachie: A Field Archaeology of Donside, Aberdeenshire, 1st ed.; RCAHMS: Edinburgh, UK, 2009; ISBN 978-1902419619. [Google Scholar]
- Cavers, G.; Barber, J.; Ritchie, M. The survey and analysis of brochs. Proc. Soc. Antiq. Scotl. 2015, 145, 153–176. [Google Scholar] [CrossRef]
- Landscape Character Assessment. Available online: https://www.nature.scot/professional-advice/landscape-change/landscape-character-assessment (accessed on 19 July 2018).
- Canmore. The National Record of the Historic Environment. Available online: https://canmore.org.uk/ (accessed on 25 June 2018).
- McKeague, P.; Thomas, D. Evolution of national heritage inventories for Scotland and Wales. J. Cult. Herit. Manag. Sustain. Dev. 2016, 6, 113–127. [Google Scholar] [CrossRef]
- Dunbar, J.G. The Royal Commission on the Ancient and Historical Monuments of Scotland: The First Eighty Years. Trans. Anc. Monum. Soc. 1992, 36, 1–58. [Google Scholar]
- McKeague, P.; Cowley, D.C. From paper to digital, and point to polygon—The application of GIS in a national body of survey and record. Int. J. Herit. Digit. Era 2013, 2, 677–694. [Google Scholar] [CrossRef]
- Cunningham, I. The Nation Survey’d: Timothy Pont’s Maps of Scotland, 1st ed.; John Donald: Edinburgh, UK, 2006; ISBN 978-0859766807. [Google Scholar]
- William Roy—Military Antiquities of the Romans in North Britain. 1793. Available online: https://maps.nls.uk/roy/antiquities/romans.html (accessed on 25 June 2018).
- Ordnance Survey Maps—Six-Inch 1st Edition, Scotland, 1843–1882. Available online: https://maps.nls.uk/os/6inch/ (accessed on 25 June 2018).
- Bowden, M.; MacKay, D. Archaeology and the Ordnance Survey Revisited: Field Investigations by the Ordnance Survey Archaeology Division 1947–1983. North. Archaeol. 1999, 17, 1–14. [Google Scholar]
- Davidson, J.L.; Cowley, D.C.; Barneveld, J.; Ferguson, L.M. Archaeological Mapping in the North of Scotland. In ‘We Were Always Chasing Time’ Papers Presented to Keith Blood; Frodsham, P., Topping, P., Cowley, D., Eds.; Northumberland Archaeological Group: Newcastle, UK, 1999; pp. 15–21. [Google Scholar]
- The Society of Antiquaries of Scotland. Available online: https://www.socantscot.org/ (accessed on 3 July 2018).
- First Report and Inventory of Monuments and Constructions in the County of Berwick. Available online: http://canmore-pdf.rcahms.gov.uk/wp/00/WP003901.pdf (accessed on 25 June 2018).
- Ordnance Survey Archaeology Division Revision Programme. Available online: https://canmore.org.uk/project/1014509 (accessed on 25 June 2018).
- Discovery and Excavation in Scotland. Available online: https://archaeologyscotland.org.uk/join-us/discovery-and-excavation-scotland (accessed on 3 July 2018).
- OASIS Scotland. Available online: https://oasis.ac.uk/pages/wiki/Scotland (accessed on 25 June 2018).
- Cowley, D.C. Creating the cropmark archaeological record in East Lothian, southeast Scotland. In Prehistory without Borders: Prehistoric Archaeology of the Tyne-Forth Region, 1st ed.; Crellin, R., Fowler, C., Tipping, R., Eds.; Oxbow: Oxford, UK, 2016; Volume 1, pp. 59–70. ISBN 978-1785701993. [Google Scholar]
- Dixon, P. But the Walls Remained: A Survey of Unroofed Rural Settlement Depicted on the First Edition of the Ordnance Survey 6-inch Map of Scotland, 1st ed.; RCAHMS: Edinburgh, UK, 2002; ISBN 978-1902419275. [Google Scholar]
- Stell, G. Orkney at War: Defending Scapa Flow, 1st ed.; Orcadian Limited: Kirkwall, UK, 2011; ISBN 978-1902957487. [Google Scholar]
- Barclay, G. If Hitler Comes: Preparing for Invasion: Scotland 1940, 1st ed.; Birlinn: Edinburgh, UK, 2013; ISBN 978-1843410621. [Google Scholar]
- Kilpatrick, A. World War I Remains in Scotland: Aerial Photography as Heritage. In Conflict Landscapes and Archaeology from Above, 1st ed.; Stichelbaut, B., Cowley, D.C., Eds.; Routledge: Abingdon, UK, 2016; Volume 1, pp. 59–72. ISBN 1472464389. [Google Scholar]
- Cowley, D.C. What do the patterns mean? Archaeological distributions and bias in survey data. In Digital Methods and Remote Sensing in Archaeology—Archaeology in the Age of Sensing, 1st ed.; Campana, S., Forte, M., Eds.; Springer: New York, NY, USA, 2016; Volume 1, pp. 147–170. ISBN 3319406566. [Google Scholar]
- A Strategy for the National Mapping Programme. Available online: http://www.english-heritage.org.uk/content/imported-docs/a-e/astrategyforthenationalmappingprogramme2009.pdf (accessed on 28 March 2010).
- Horne, P.D. The English Heritage National Mapping Programme. In Remote Sensing for Archaeological Heritage Management, 1st ed.; Cowley, D.C., Ed.; Archaeolingua: Budapest, Hungary, 2011; Volume 1, pp. 143–151. ISBN 9789639911208. [Google Scholar]
- Winton, H.; Horne, P. National archives for national survey programmes: NMP and the English Heritage aerial photograph collection. In Landscapes Through the Lens: Aerial Photographs and the Historic Environment, 1st ed.; Cowley, D.C., Standring, R., Abicht, M., Eds.; Oxbow: Oxford, UK, 2010; Volume 1, pp. 7–18. ISBN 1842179810. [Google Scholar]
- Hesse, R. The changing picture of archaeological landscapes: lidar prospection over very large areas as part of a cultural heritage strategy. In Interpreting Archaeological Topography. 3D Data, Visualisation and Observation, 1st ed.; Opitz, R.S., Cowley, D.C., Eds.; Oxbow: Oxford, UK, 2013; pp. 171–183. ISBN 978-1842175163. [Google Scholar]
- RCAHMS. North East Perth: An Archaeological Landscape, 1st ed.; HMSO: Edinburgh, UK, 1990; ISBN 0114934460. [Google Scholar]
- Cowley, D.C.; López-López, A. Developing an approach to national mapping—Preliminary work on Scotland in miniature. AARGNews 2017, 55, 19–25. [Google Scholar]
- Doneus, M.; Briese, C. Full-waveform airborne laser scanning as a tool for archaeological reconnaissance. In From Space to Place, Proceedings of the 2nd International Workshop on Remote Sensing in Archaeology, CNR, Rome, Italy, 4–7 December 2006; Campana, S., Forte, M., Eds.; Archaeopress: Oxford, UK, 2006; pp. 99–106. [Google Scholar]
- Doneus, M.; Briese, C. Airborne Laser Scanning in forested areas—Potential and limitations of an archaeological prospection technique. In Remote Sensing for Archaeological Heritage Management, Proceedings of the 11th EAC Heritage Management Symposium, Reykjavik, Iceland, 25–27 March 2010; Cowley, D.C., Ed.; Europae Archaeologiae Consilium: Brussels, Belgium, 2011; pp. 59–76. [Google Scholar]
- Opitz, R.S.; Cowley, D.C. Interpreting archaeological topography: Lasers, 3D data observation, visualisation and applications. In Interpreting Archaeological Topography. 3D Data, Visualisation and Observation, 1st ed.; Opitz, R.S., Cowley, D.C., Eds.; Oxbow: Oxford, UK, 2013; pp. 1–13. ISBN 978-1842175163. [Google Scholar]
- Kokalj, Ž.; Zakšek, K.; Oštir, K. Application of Sky-View Factor for the Visualization of Historic Landscape Features in Lidar-Derived Relief Models. Antiquity 2011, 85, 263–273. [Google Scholar] [CrossRef]
- Zakšek, K.; Oštir, K.; Kokalj, Ž. Sky-View Factor as a Relief Visualization Technique. Remote Sens. 2011, 3, 398–415. [Google Scholar] [CrossRef] [Green Version]
- Cowley, D.C.; Banaszek, Ł. Towards accountability and confidence in archaeological prospection and remote sensing archaeology. Remote Sens. 2018, in press. [Google Scholar]
- Cowley, D.; De Laet, V.; Bennett, R. Auto-extraction techniques and cultural heritage databases—Assessing the need, evaluating applicability and looking to the future. In Archaeological Prospection, Proceedings of the 10th International Conference on Archaeological Prospection, Vienna, Austria, 29 May–2 June 2013; Neubauer, W., Trinks, I., Salisbury, R.S., Einwögerer, C., Eds.; Austrian Academy of Sciences: Vienna, Austria, 2013; pp. 406–408. [Google Scholar]
- Bennett, R.; Cowley, D.C.; De Laet, V. The data explosion: tackling the taboo of automatic feature recognition in the use of airborne survey data for historic environment applications. Antiquity 2014, 88, 896–905. [Google Scholar] [CrossRef]
- Traviglia, A.; Cowley, D.C.; Lambers, K. Finding common ground: Human and computer vision in archaeological prospection. AARGnews 2016, 53, 11–24. [Google Scholar]
Figure 1.
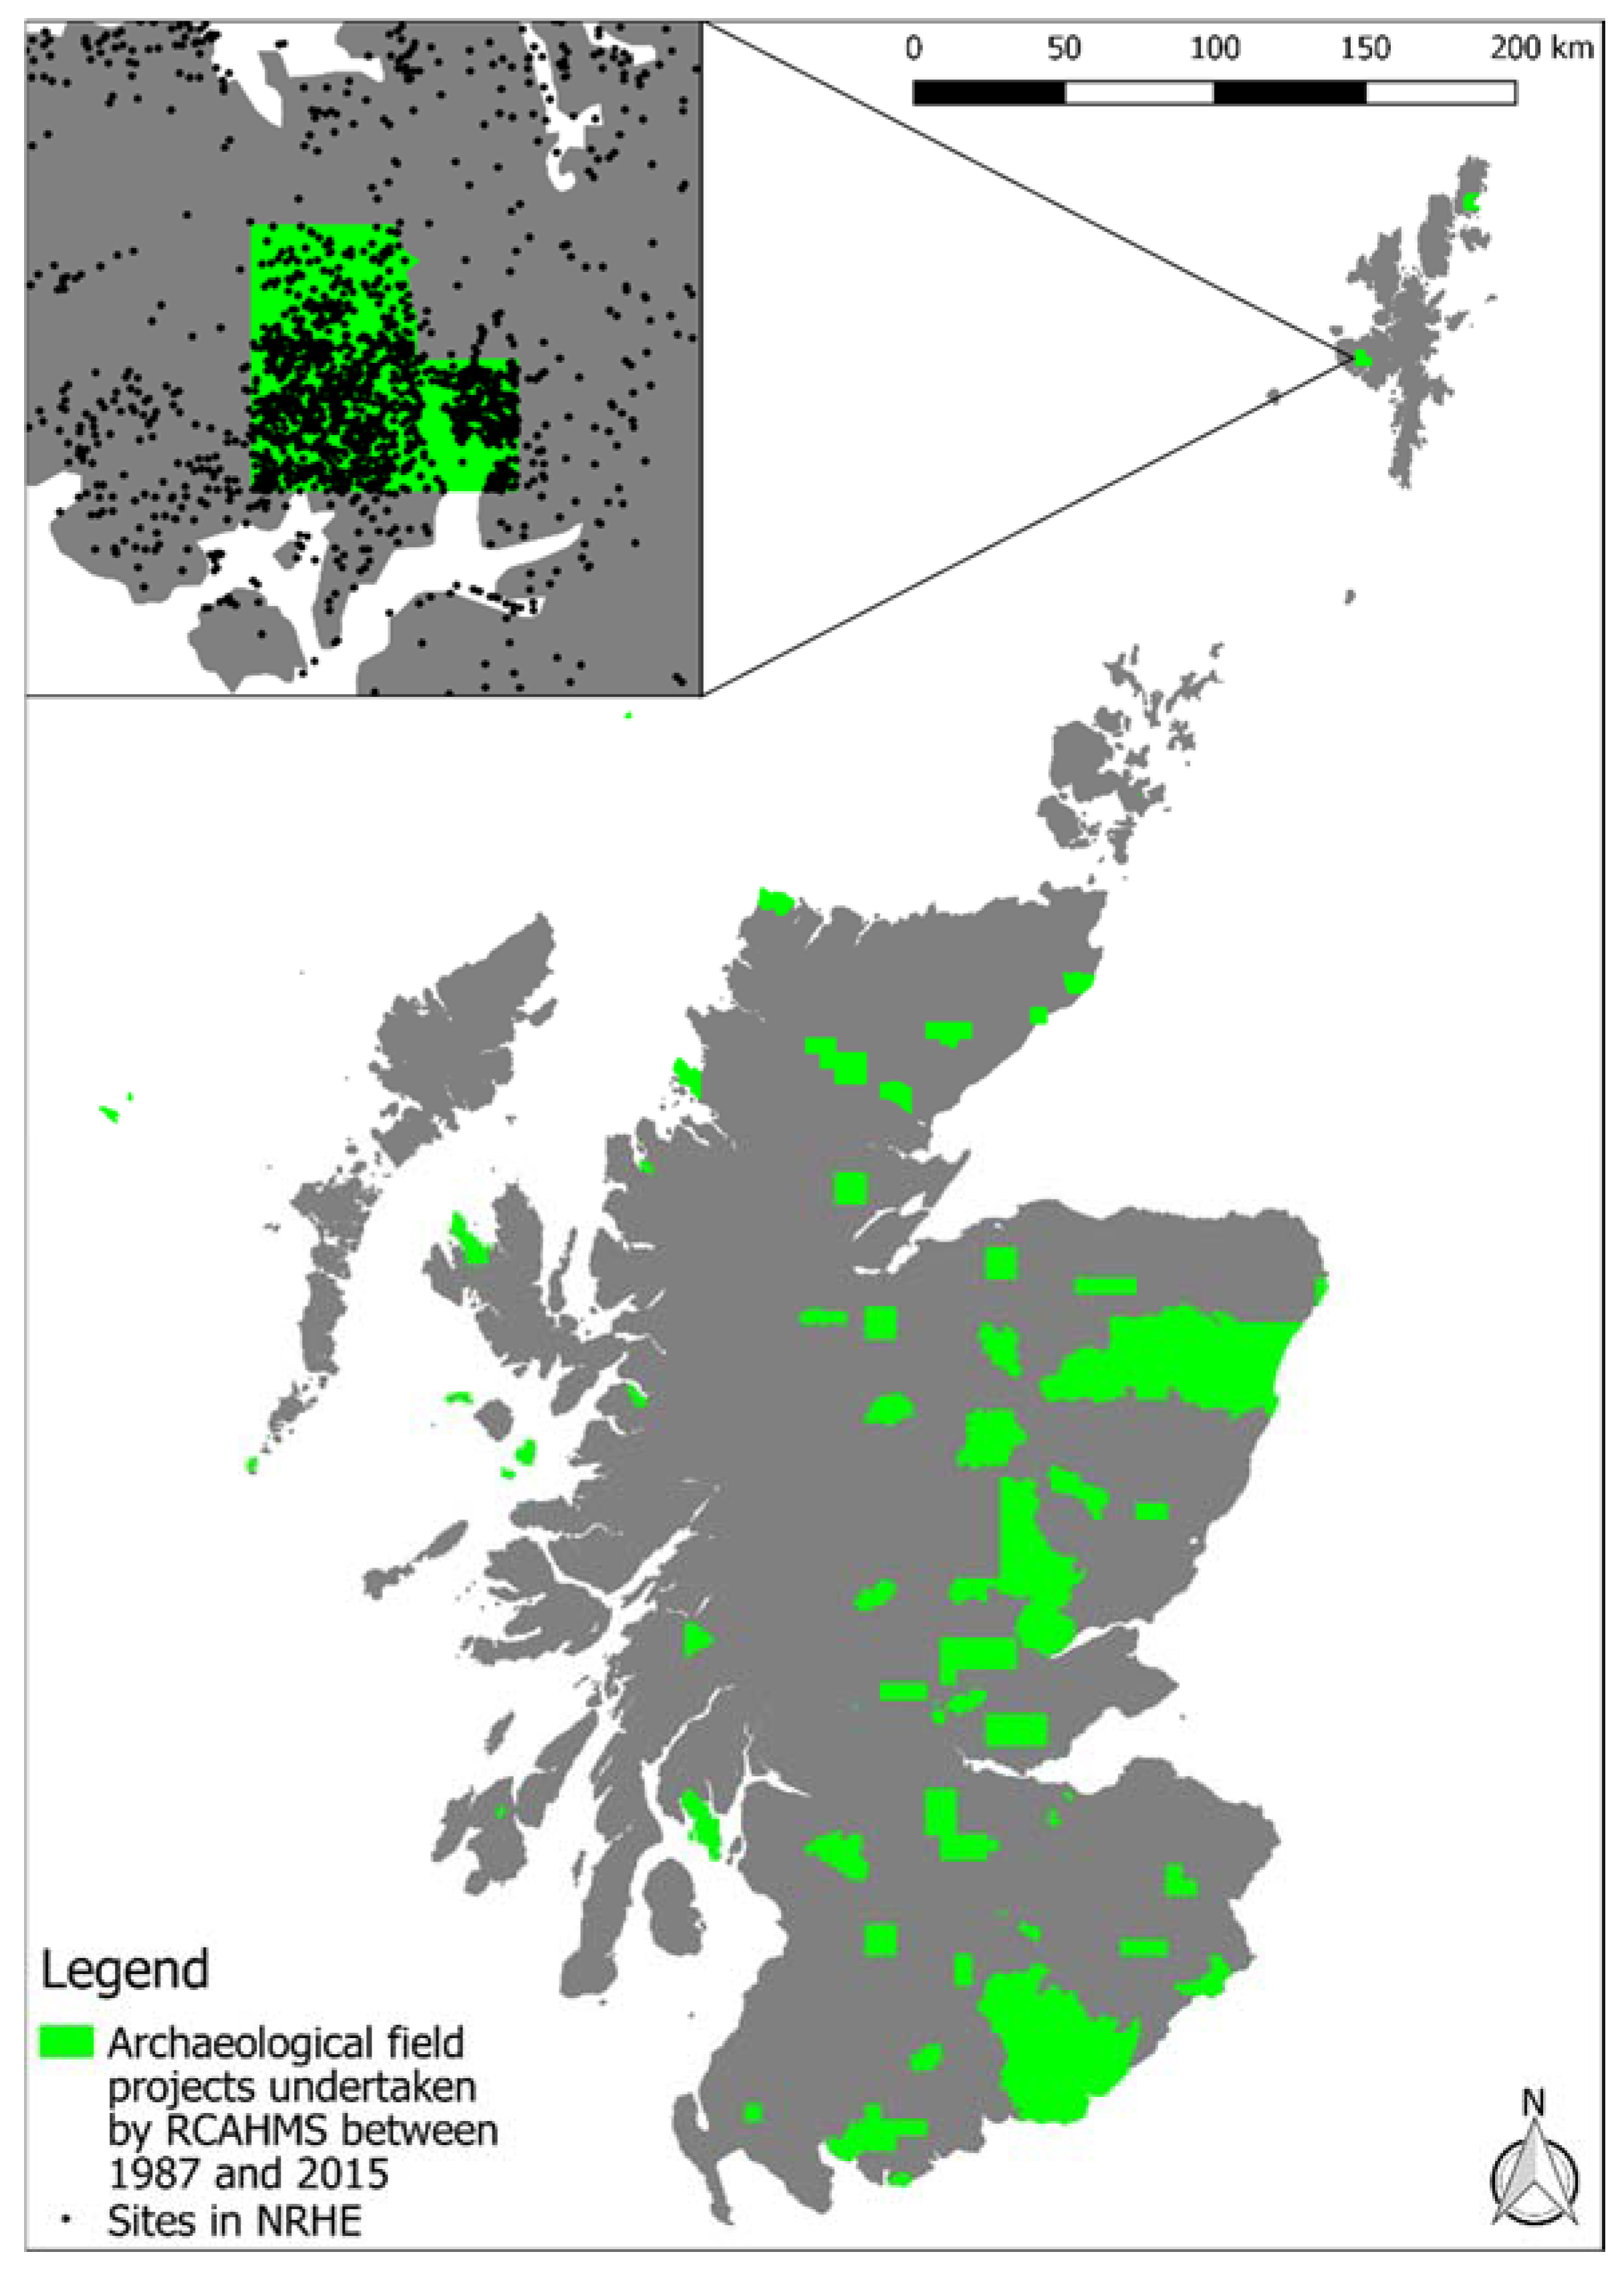
The areas of systematic, extensive field survey to modern standards undertaken over the last 30 years have covered some 10% of Scotland’s 80,077 km2 land mass, drawing on a variable human resource of anything up to eight field workers. This highlights the lack of scalability in traditional approaches to large area mapping, which rely heavily on human resources and field visits. The significant addition to the NRHE that systematic area survey can make is illustrated by West Mainland, Shetland (top left), where the discrete area investigated in 2010 is clearly visible in the increased density of site locations. © Historic Environment Scotland.
Figure 1.
The areas of systematic, extensive field survey to modern standards undertaken over the last 30 years have covered some 10% of Scotland’s 80,077 km2 land mass, drawing on a variable human resource of anything up to eight field workers. This highlights the lack of scalability in traditional approaches to large area mapping, which rely heavily on human resources and field visits. The significant addition to the NRHE that systematic area survey can make is illustrated by West Mainland, Shetland (top left), where the discrete area investigated in 2010 is clearly visible in the increased density of site locations. © Historic Environment Scotland.

Figure 2.
Map, by 10 km grid square, showing the density of archaeological records with an accuracy recorded as being within 10m. The east and southern lowlands are noticeable for having most records while the central and western highlands and islands have a noticeably lower density. Areas of intensive survey are apparent as areas of darker tones. © Historic Environment Scotland (Source: NRHE/Canmore).

Figure 3.
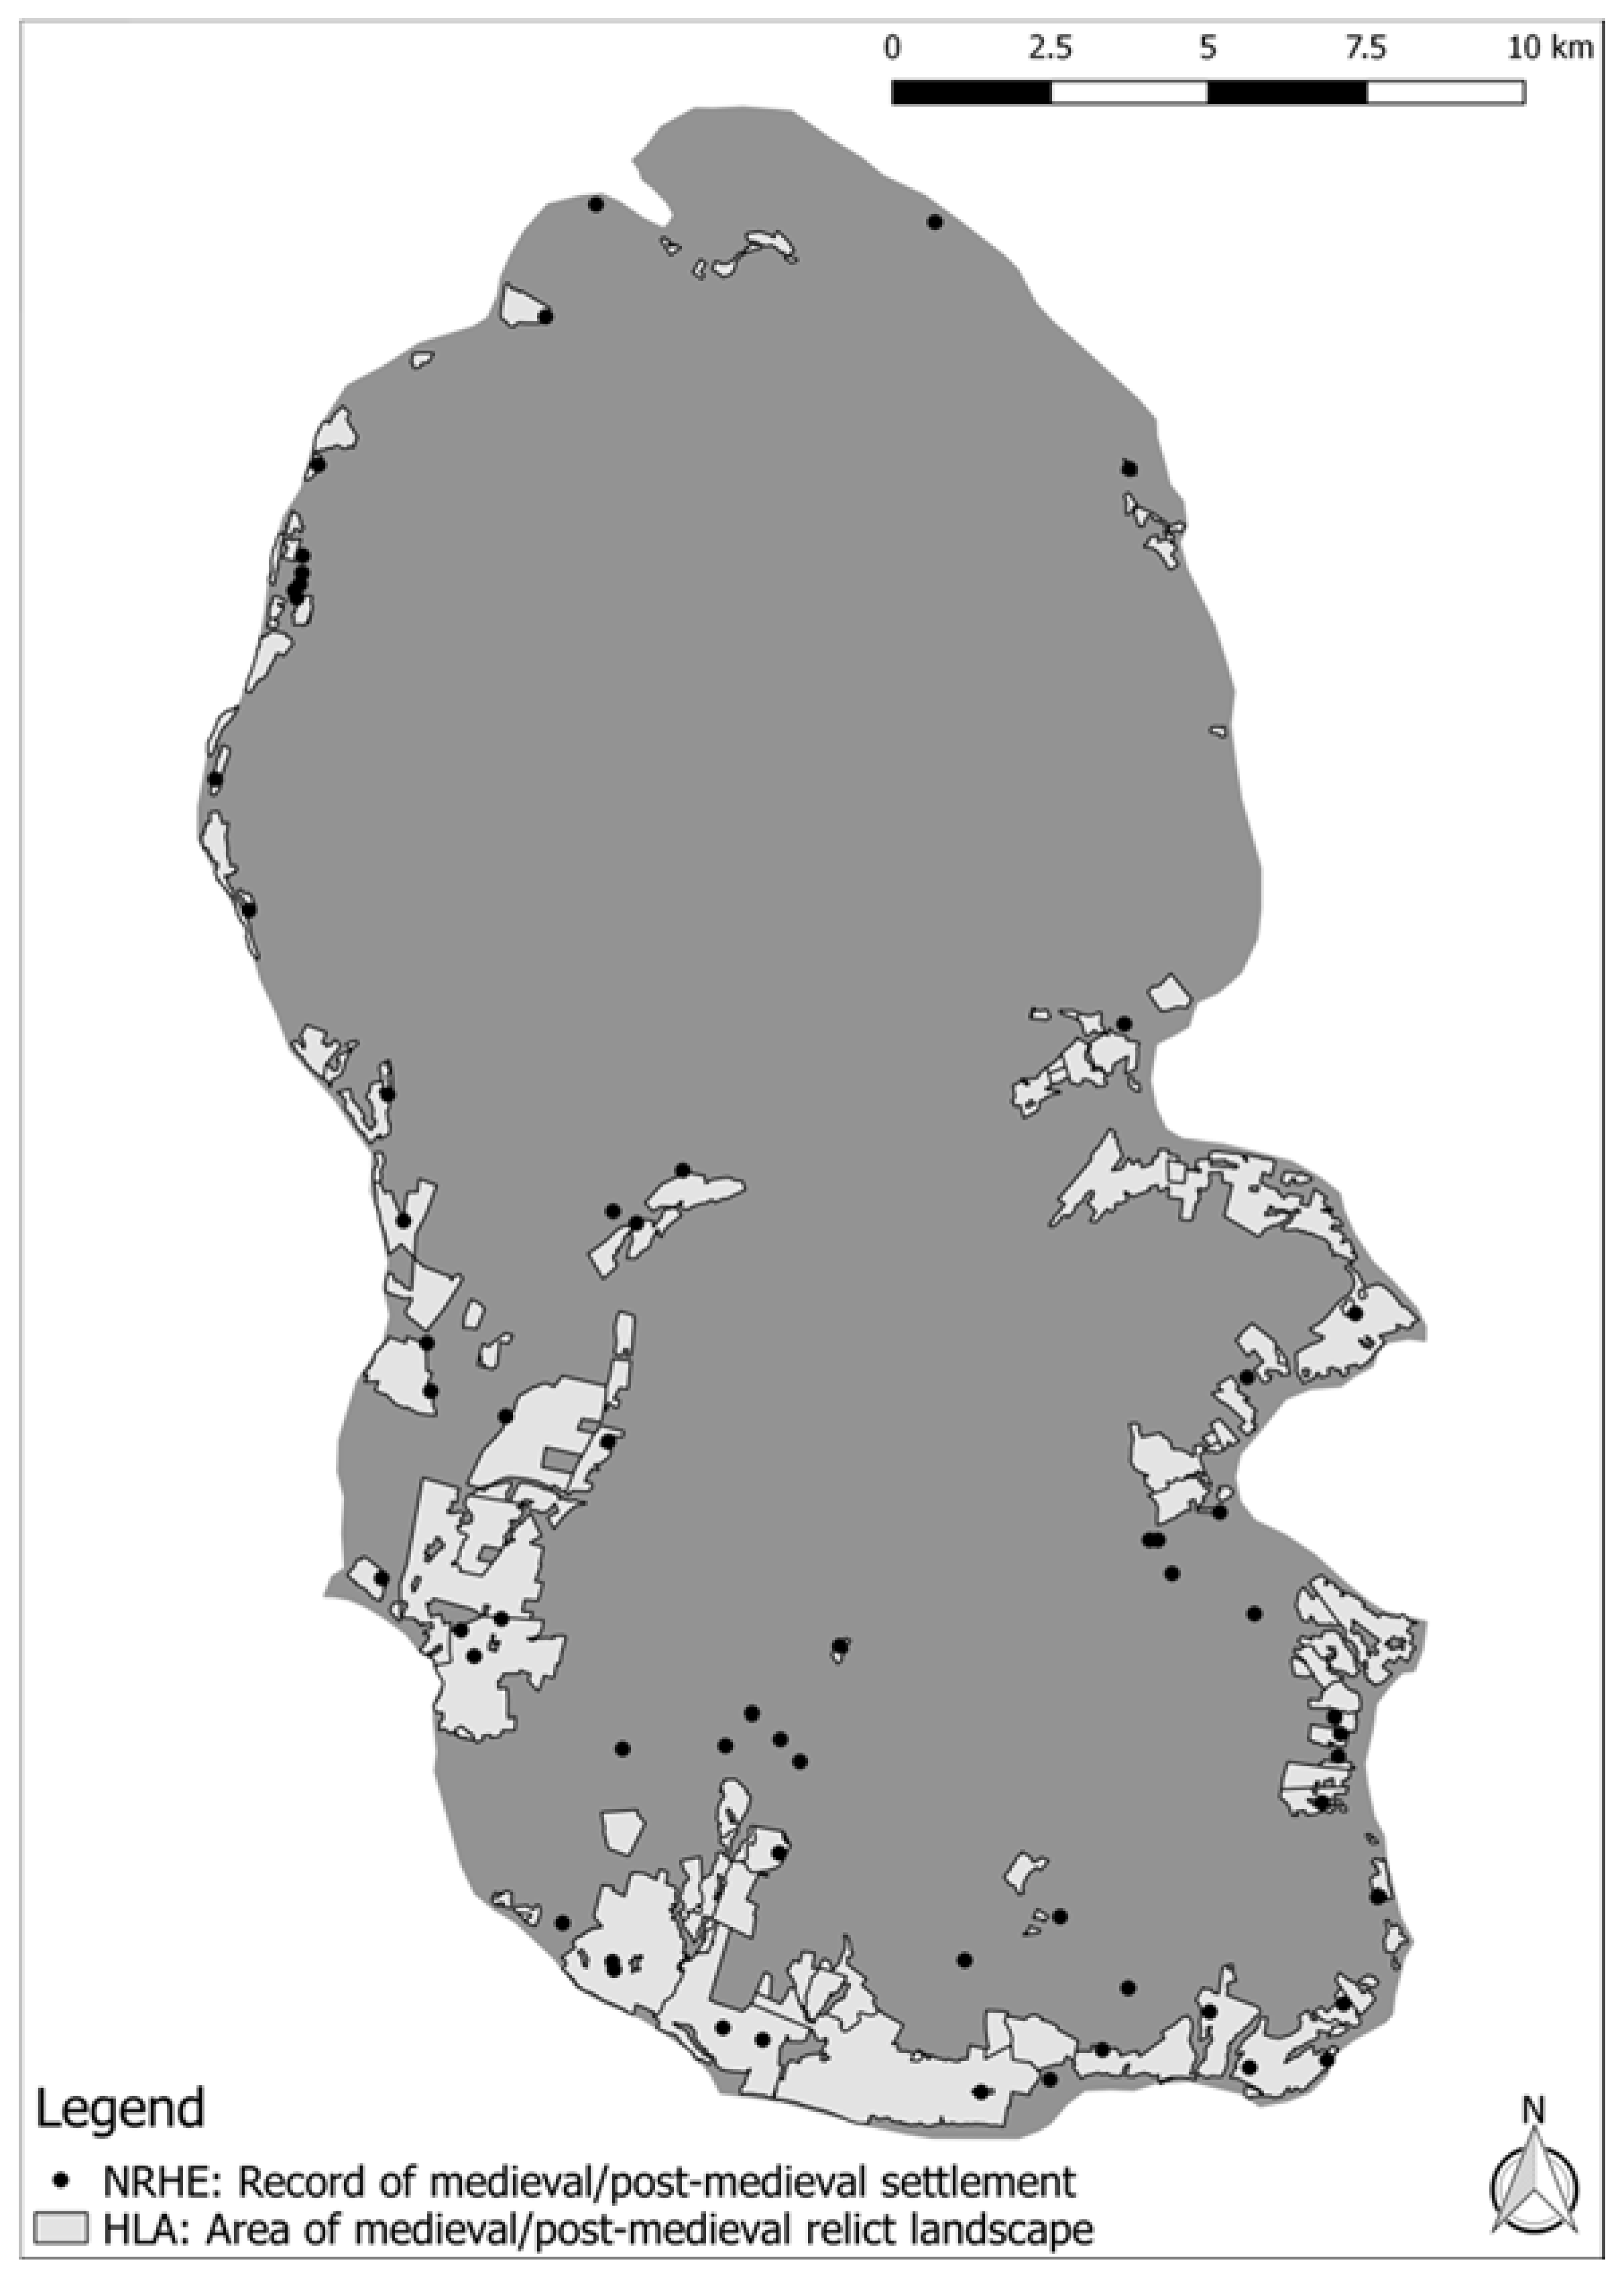
The NRHE and HLA record of medieval/post-medieval settlement and land use, as it was before the recent survey, provide two different views of the extent of known remains of these dates on Arran, both with their limitations depending on survey specification and source data. The distribution of township records is largely due to the First Edition Survey Project [22], which identified unroofed buildings on the earliest Ordnance Survey (OS) maps, but where decisions on what to map and what to ignore depended entirely on the work of the 19th century OS surveyors. They operated within specifications that included a minimum height requirement (0.3 m) before a feature qualified for inclusion on the map. These decisions still have an impact on the nature of the NRHE over 150 years later. The polygons from the HLA document crofting townships, medieval and post-medieval settlement and agriculture as recognised from a national land-use characterisation programme, primarily from aerial photographs and only for areas greater than one hectare. © Historic Environment Scotland (Sources: NRHE/Canmore and HLA).
Figure 3.
The NRHE and HLA record of medieval/post-medieval settlement and land use, as it was before the recent survey, provide two different views of the extent of known remains of these dates on Arran, both with their limitations depending on survey specification and source data. The distribution of township records is largely due to the First Edition Survey Project [22], which identified unroofed buildings on the earliest Ordnance Survey (OS) maps, but where decisions on what to map and what to ignore depended entirely on the work of the 19th century OS surveyors. They operated within specifications that included a minimum height requirement (0.3 m) before a feature qualified for inclusion on the map. These decisions still have an impact on the nature of the NRHE over 150 years later. The polygons from the HLA document crofting townships, medieval and post-medieval settlement and agriculture as recognised from a national land-use characterisation programme, primarily from aerial photographs and only for areas greater than one hectare. © Historic Environment Scotland (Sources: NRHE/Canmore and HLA).

Figure 4.
The use of simple codes for landscape mapping at 1:10,000 scale was designed to help expedite rapid coverage, as illustrated by an extract from a field reference sheet (a). However, a clear tendency can be identified towards mapping in more detail, with a shift in survey specification, sometimes underpinned by an implicit assumption that more detail is automatically ‘better’ illustrated (b) by an extract from mapping in north-east Perthshire [31]). © Historic Environment Scotland.

Figure 5.
The distribution of the archaeological sites known on Arran before the recent HES survey, shown against a land use character map superimposed on a terrain model. © Historic Environment Scotland (Sources: NRHE, HLA and airborne laser scanning (ALS)).
Figure 5.
The distribution of the archaeological sites known on Arran before the recent HES survey, shown against a land use character map superimposed on a terrain model. © Historic Environment Scotland (Sources: NRHE, HLA and airborne laser scanning (ALS)).

Figure 6.
Scottish Public Sector ALS coverage as of July 2018. Arran is the biggest island fully covered by ALS data. © Historic Environment Scotland.
Figure 6.
Scottish Public Sector ALS coverage as of July 2018. Arran is the biggest island fully covered by ALS data. © Historic Environment Scotland.

Figure 7.
An example of the results of desk-based interpretation of ALS derivatives (1–the highest level of confidence) superimposed over a multi-direction hill-shade visualisation. Note the differences between the outputs from three different interpreters (A, B, C). While some archaeological features were identified by a single person, others were recognized by many. In the latter case, a single monument might be dealt with differently by different interpreters including: (a) with a varied level of confidence; (b) with a variable extent; (c) by including nearby features and thus creating large polygons or by drawing multiple smaller outlines; and (d), in some cases where the same archaeological feature was identified with a similar extent by two or more observers, with different classifications. Thus, a hut circle, as interpreted by one person, could be a shieling according to another. Additionally, while some interpreters used a detailed description, others described the same features using more general terms. This provides an insight into the variability across different operators in interpreting the same datasets. © Historic Environment Scotland.

Figure 8.
The distribution of archaeological sites identified during the project, shown against features known before the survey and fieldwork tracks superimposed on a terrain model. This map does not show large areas of dense coniferous plantations, within which reconnaissance was limited to gaps in the forest, while many of the mountainous areas in the north were judged to be beyond the likely limit of surviving archaeological remains. Glen Rosa, the L-shaped trough valley in the northeast, was covered without a personal GPS unit and thus does not show any track. © Historic Environment Scotland (Sources: NRHE and ALS).


Table 1.
Three sets of DTM visualisations, developed by Žiga Kokalj (1, 2) and, Łukasz Banaszek (3), were used as the primary source for the desk-based interpretation.
Table 1.
Three sets of DTM visualisations, developed by Žiga Kokalj (1, 2) and, Łukasz Banaszek (3), were used as the primary source for the desk-based interpretation.
| Stack No. | Visualisations Stacked | Transparency (%) |
|---|---|---|
| 1 | Sky-view Factor (Radius–5 m; Directions–16) | 70 |
| Slope | 80 | |
| Multiple Hill-shade (Sun elevation 35 deg.; Red–band 14, Green–band 2, Blue–band 4) | 0 | |
| 2 | Sky-view Factor (Radius–5 m; Directions–16) | 25 |
| Openness-Positive (Radius–5 m; Directions–16) | 50 | |
| Slope | 50 | |
| Hill-shade (Sun elevation 35 deg.; Sun azimuth–315 deg.) | 0 | |
| 3 | DTM colour values | 80 |
| Local Dominance M10-20 DI1 A15 OH1.7 | 30 | |
| Hill-shade (Sun elevation 35 deg.; Sun azimuth–315 deg.) | 0 |
© 2018 by the authors. Licensee MDPI, Basel, Switzerland. This article is an open access article distributed under the terms and conditions of the Creative Commons Attribution (CC BY) license (http://creativecommons.org/licenses/by/4.0/).
Share and Cite
MDPI and ACS Style
Banaszek, Ł.; Cowley, D.C.; Middleton, M. Towards National Archaeological Mapping. Assessing Source Data and Methodology—A Case Study from Scotland. Geosciences 2018, 8, 272. https://doi.org/10.3390/geosciences8080272
AMA Style
Banaszek Ł, Cowley DC, Middleton M. Towards National Archaeological Mapping. Assessing Source Data and Methodology—A Case Study from Scotland. Geosciences. 2018; 8(8):272. https://doi.org/10.3390/geosciences8080272
Chicago/Turabian StyleBanaszek, Łukasz, Dave C. Cowley, and Mike Middleton. 2018. "Towards National Archaeological Mapping. Assessing Source Data and Methodology—A Case Study from Scotland" Geosciences 8, no. 8: 272. https://doi.org/10.3390/geosciences8080272
Note that from the first issue of 2016, this journal uses article numbers instead of page numbers. See further details here.