Article

Geological Model of a Storage Complex for a CO2 Storage Operation in a Naturally-Fractured Carbonate Formation

1
Geogreen, 2 rue des Martinets, 92569 Rueil Malmaison, France
2
Fundación Ciudad de la Energía, Avenida del Presidente Rodríguez Zapatero, 24492 Cubillos del Sil, Spain
*
Author to whom correspondence should be addressed.
Geosciences 2018, 8(9), 354; https://doi.org/10.3390/geosciences8090354
Submission received: 23 May 2018 / Revised: 11 September 2018 / Accepted: 12 September 2018 / Published: 19 September 2018
(This article belongs to the Special Issue Geological Storage of Gases as a Tool for Energy Transition)

Abstract

:
Investigation into geological storage of CO2 is underway at Hontomín (Spain). The storage reservoir is a deep saline aquifer formed by naturally fractured carbonates with low matrix permeability. Understanding the processes that are involved in CO2 migration within these formations is key to ensure safe operation and reliable plume prediction. A geological model encompassing the whole storage complex was established based upon newly-drilled and legacy wells. The matrix characteristics were mainly obtained from the newly drilled wells with a complete suite of log acquisitions, laboratory works and hydraulic tests. The model major improvement is the integration of the natural fractures. Following a methodology that was developed for naturally fractured hydrocarbon reservoirs, the advanced characterization workflow identified the main sets of fractures and their main characteristics, such as apertures, orientations, and dips. Two main sets of fracture are identified based upon their mean orientation: North-South and East-West with different fracture density for each the facies. The flow capacity of the fracture sets are calibrated on interpreted injection tests by matching their permeability and aperture at the Discrete Fracture Network scale and are subsequently upscaled to the geological model scale. A key new feature of the model is estimated permeability anisotropy induced by the fracture sets.

1. Introduction

CO2 geological storage has reached industrial scale in sites, such as Sleipner (Norway), In-Salah (Algeria), and Decatur (IL, USA). These sites represent examples approaching the ideal conditions for establishing a commercial site according to criteria established in the SACS project [1]. Other CO2 injection pilots also achieved notable scientific results for example, including Otway (Vic, Australia), Ketzin (Germany), Nagaoka (Japan), and Rousse (France) [2].
The Hontomín pilot is the only current onshore injection site in Europe for CO2 geological storage, recognized by the European Parliament [3] as key test facility for Carbon Capture and Storage (CCS) technology development. It is located close to Burgos in the north of Spain, and is operated by Fundación Ciudad de la Energía (CIUDEN, Cubillos del Sil, Spain).
The Hontomín storage reservoir comprises naturally fractured limestones and dolomites. The injection of CO2 into fractured carbonate rocks for dedicated storage is unique in a European context, although considerable experience of injection into carbonates was gained in association with enhanced oil recovery (EOR) operations, as, for example, in the Weyburn-Midale CO2 project (SK, Canada) [4] and the Uthmaniyah CO2-EOR demonstration project (Saudi Arabia) [5].
Prior to dynamically modeling the CO2 migration, a detailed modeling of the characteristics of the storage complex is required as a key first step workflow for CO2 storage site characterization [6]. The storage complex boundaries, defined in the European Storage Directive [7] as “the storage site and surrounding geological domain which can have an effect on overall storage integrity and security; that is, secondary containment formations”.
This paper presents the main features of the geological model of the storage complex with its stratigraphic and petrophysical properties. The characterization workflow applied to fractured sandstone formations at In-Salah [8] is transposed to naturally fractured carbonate. These reservoirs are particularly challenging to handle because of their high level of heterogeneity that conditions the reservoir behaviour during the injection. In particular, natural fractures have a significant impact on well performance. Furthermore, the understanding of the processes that are involved in CO2 migration within relatively low-permeability storage influenced by fractures and faults is essential for enabling safe storage operation [9]. This work integrates the characterization (size, conductivities) of the natural fracture networks by its modeling in the drainage volume of the wells [10].
As part of the European project “Enabling Onshore CO2 Storage in Europe” (ENOS) [11], the site geological model is updated by integration of the recently acquired data, such as the image log interpretations from injection and observation newly-drilled wells. The geological model is generated through the analysis and integration of data, including borehole images and well test data. Following a methodology developed for naturally fractured hydrocarbon reservoirs [12], the image log analysis identified two sets of diffuse fractures. Discrete Fracture Network (DFN) [13] were built within the drainage volume of the newly-drilled wells that encompass the caprock, storage and underburden formations.
The fracture characteristics of the two sets of diffuse fractures, such as orientations, densities, and conductivities, are calibrated upon the interpretation of the injection tests. For each facies, the DFN characteristics were then upscaled and propagated to the full-field reservoir simulation model as three-dimensional (3-D) fracture properties (fracture porosity, fracture permeability, and equivalent block size).

2. Geological Modeling

2.1. Geological Context

The storage site represents a structural dome where the cap rock and reservoir belong to the Jurassic formations Marly Lias and Sopeña, respectively. Keuper is the underlying seal and Dogger, Purbeck and Weald form the overburden [14]. Pair seal-reservoir is located at the depth of 900 in the top of the dome and 1832 m in flanks. During the site construction two wells were specifically drilled and monitored reaching the depth of 1600 m (Keuper Formation), one for injection (HI) and other for observation (HA) [15]. Four legacy wells are also located in the study area (H1, H2, H3, and H4).
Marly Lias and Pozazal formations are mainly comprised of highly carbonated marls (close to 50%) with uniaxial strength values equal or higher than 130 × 106 Pa and Young modulus values in the range 15–30 × 109 Pa. The Sopeña formation is comprised of limestone in the upper part of reservoir and dolomite at the bottom. Their geomechanical properties correspond to rocks with high values of uniaxial strength, as the cap rock case, being the values for limestones and dolomites equal or higher than 180 × 106 Pa and 190 × 106 Pa, respectively. As regards the Young Modulus values, they are in the ranges of 30–60 × 109 Pa and 50–85 × 109 Pa [16]. The overlaying formation Dogger has similar properties. Consequently, post fracture behaviors for the seal, overlaying formations, and the reservoir should be different, while taking into account the tectonic effects induced in the rock layers during the formation of the dome. Uniaxial strength values are really high for a carbonated marl, but the Young Modulus range reveals that despite being a hard rock its behavior should be of type “strain softening”, with significant deformations pre and post fracture. On other hand, carbonates in Sopeña and Dogger formations show also high values of uniaxial strength, but Young Modulus values support an “elastic brittle” behavior that means no significant strains take place after rock fracture.
These assumptions were confirmed by the acoustic Televiewer logging [17] that was conducted during the well drilling at Hontomín pilot, which revealed the existence of faults and associated fractures that mainly affect the overburden without continuity through the cap rock and reservoir what ensures its integrity except in two cases described below. High degree of fracture within the reservoir was also proven [18].
The petrophysical properties, such as effective porosity and gas permeability, were determined by laboratory tests conducted with reservoir core samples acquired during well drilling. These tests were conducted under reservoir conditions (pressure and temperature) injecting CO2 and brine to assess the hydrodynamic and geochemical effects [19]. The results revealed that fluid transmissivity is dominated by carbonate fractures. Subsequent tests conducted at field scale on site during the hydraulic characterization were performed injecting brine to determine the permeability in several intervals of the open hole of each well and the hydraulic connectivity between wells. The interpretation of the results using SaphirTM supported the assumption that fluid migration is dominated by fractures [18].
In the development of the static model, which will be described later, all of the peculiarities analyzed above were considered. Two main faults cross the storage complex from the reservoir to the overburden, which limit the south-eastward extension of the storage. Ubierna fault, located at the southern part of Hontomín area, and East fault are shown in Figure 1. The storage formation is dipping towards the north and north-west, with its apex around H2 well. Future works will be carried out to determine whether both faults are sealing or transmissible to flow.

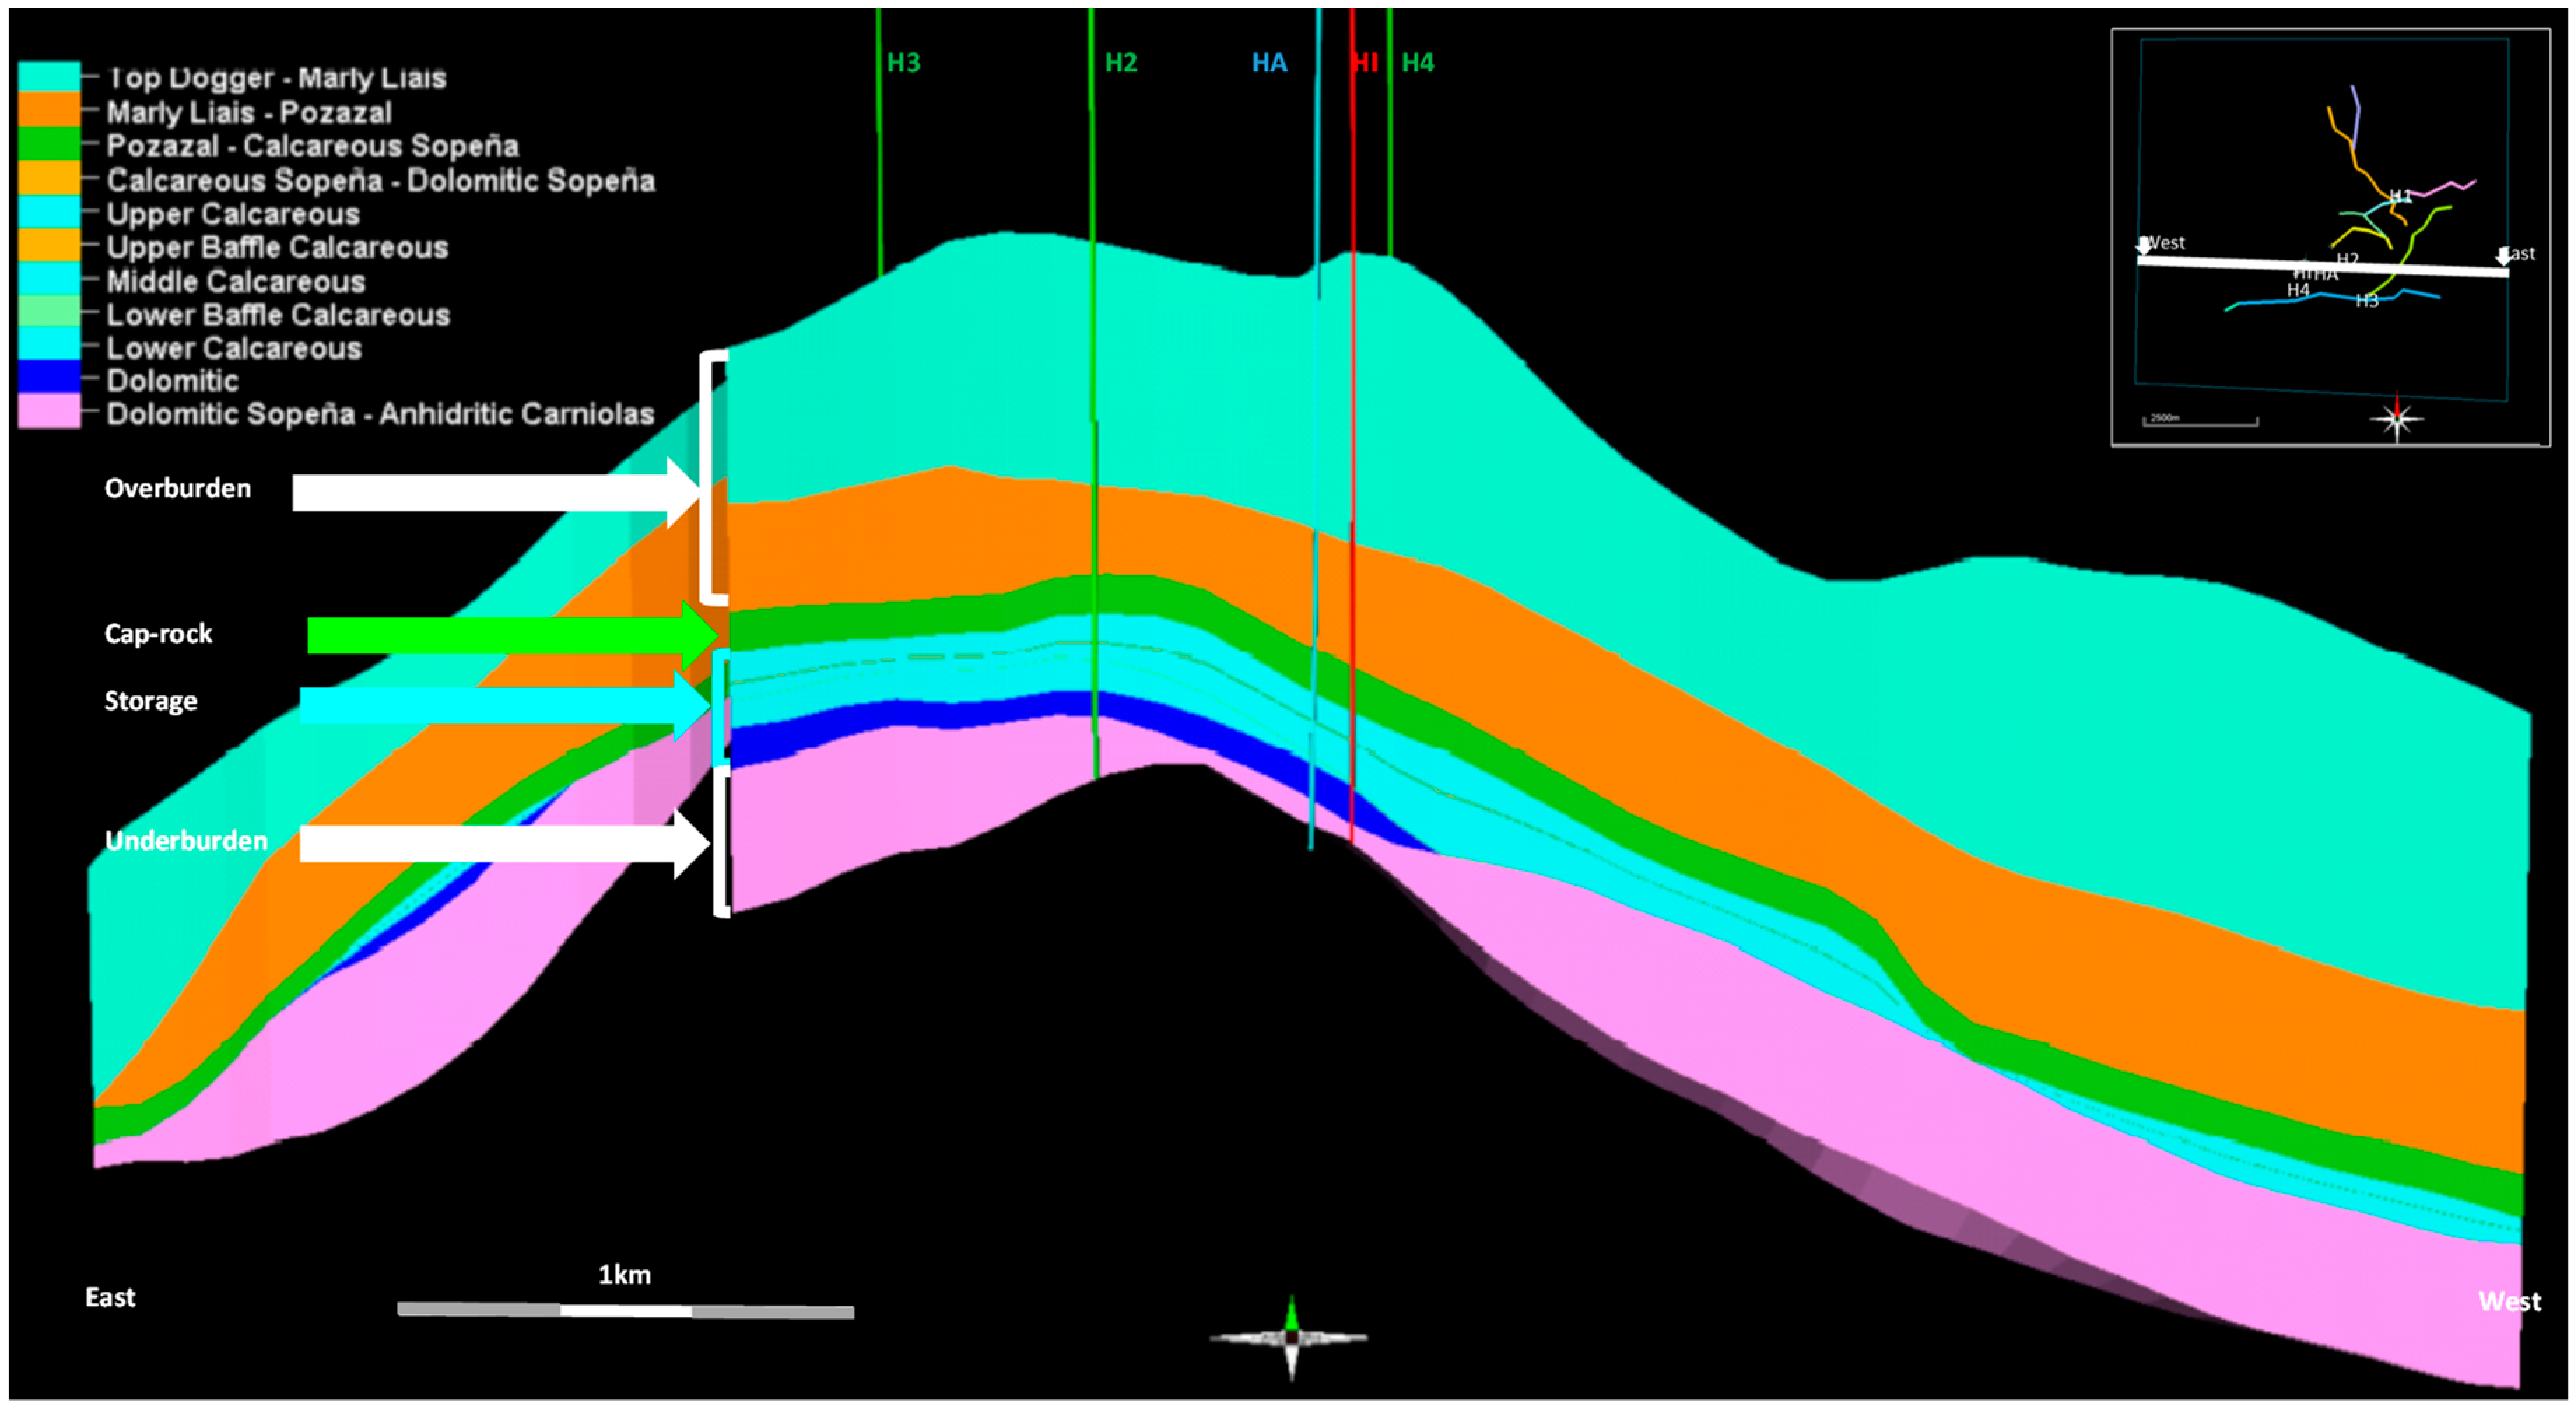
2.2. Geological Model

The geological model covers the whole storage complex from the overburden (Dogger formation) down to the storage (Sopeña formation) and the underburden (Keuper formation), as shown in Figure 2.

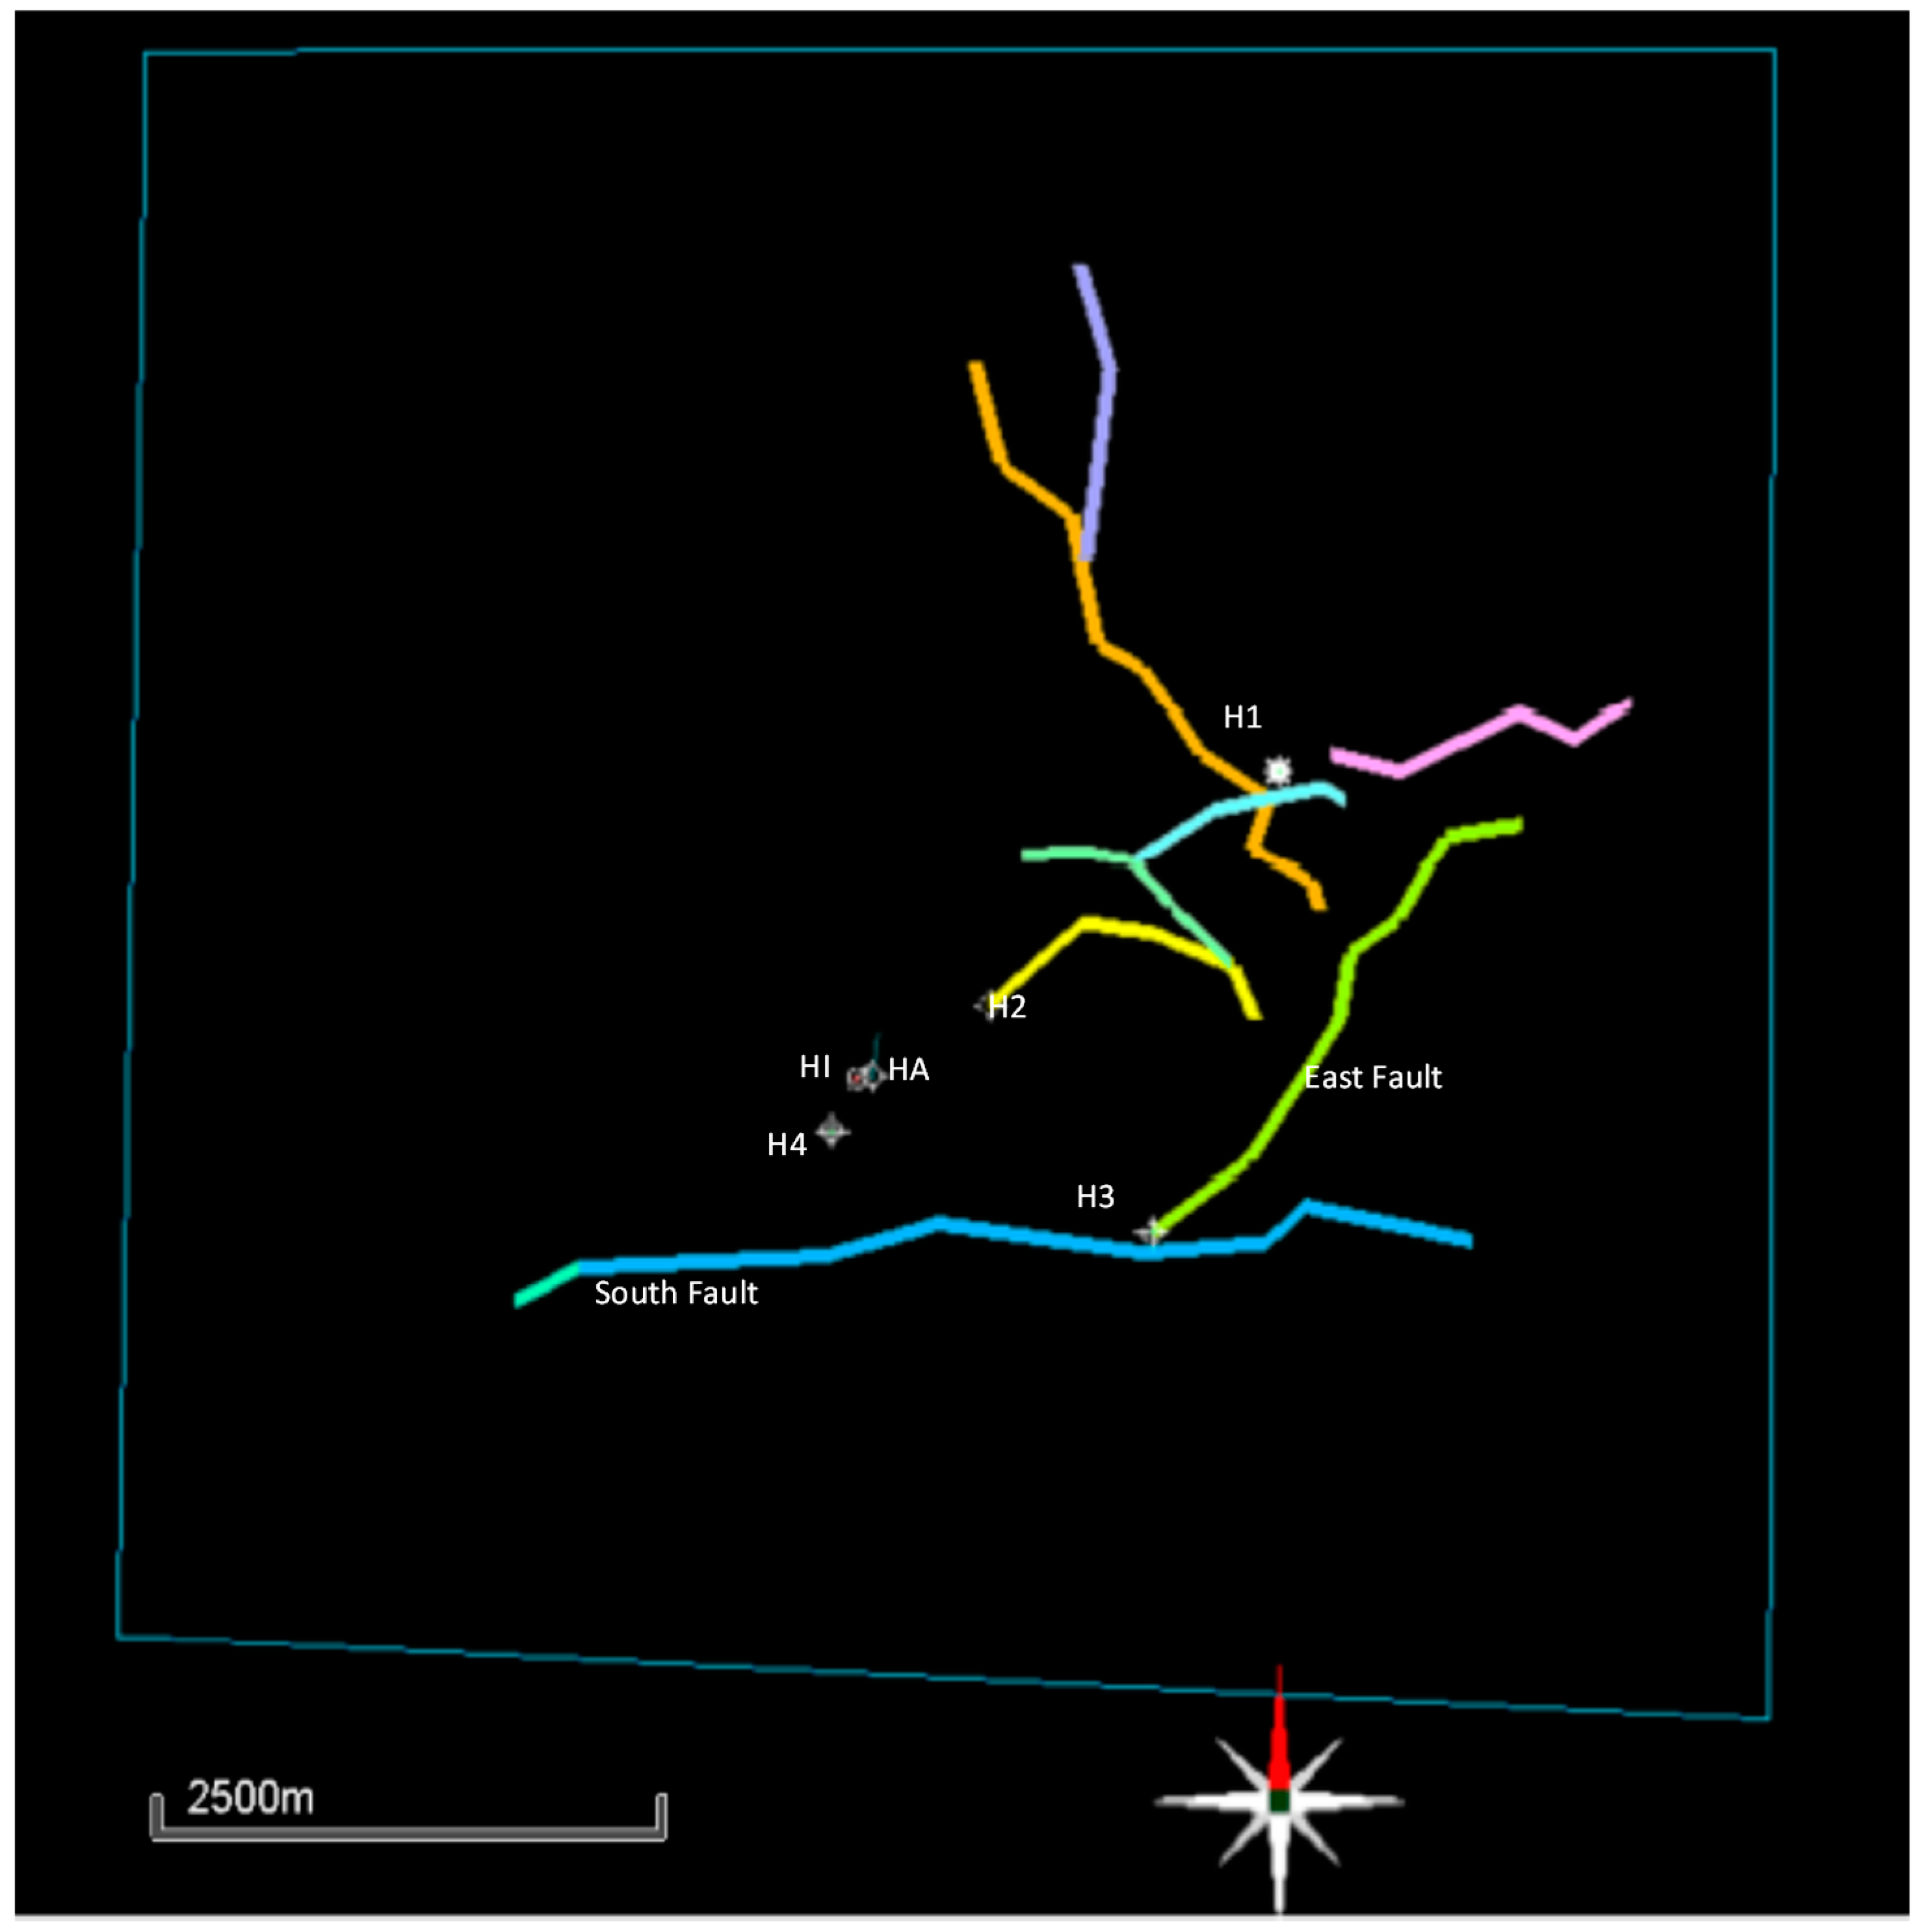
2.3. Structural Model

A 3-D seismic reflection survey was acquired in 2010, which parameters included 22 source lines (cross-lines), deployed East-West (E-W), perpendicular to 22 receiver lines (in-lines) deployed North-South (N-S), with intervals of 25 m between sources and between receivers; the inline and crossline spacing was 250 m and 275 m, respectively, covering a total extent of 36 km2. Due to the complex geological setting of the Hontomìn site and the existence of an unexpected sharp velocity inversion near the surface, which was associated to the Upper-Lower Cretaceous contact [20], the 3-D seismic only identified the main horizons below the Dogger. These horizons were matched to the corresponding makers for legacy and newly-drilled wells.
The faults are only interpreted at the top of the storage formation from the 3-D seismic interpretations and are assumed to be vertical within the reservoir.
The grid of the geological model was designed to follow the facies vertical heterogeneities (Figure 3). The storage formation is modeled with 39 layers, which thicknesses range between 1 and 10 m. The lateral facies heterogeneities representations are coarser due to the lack of well correlations and because they represent a significant uncertainty in the modeling approach.

2.4. Petrophysical Model
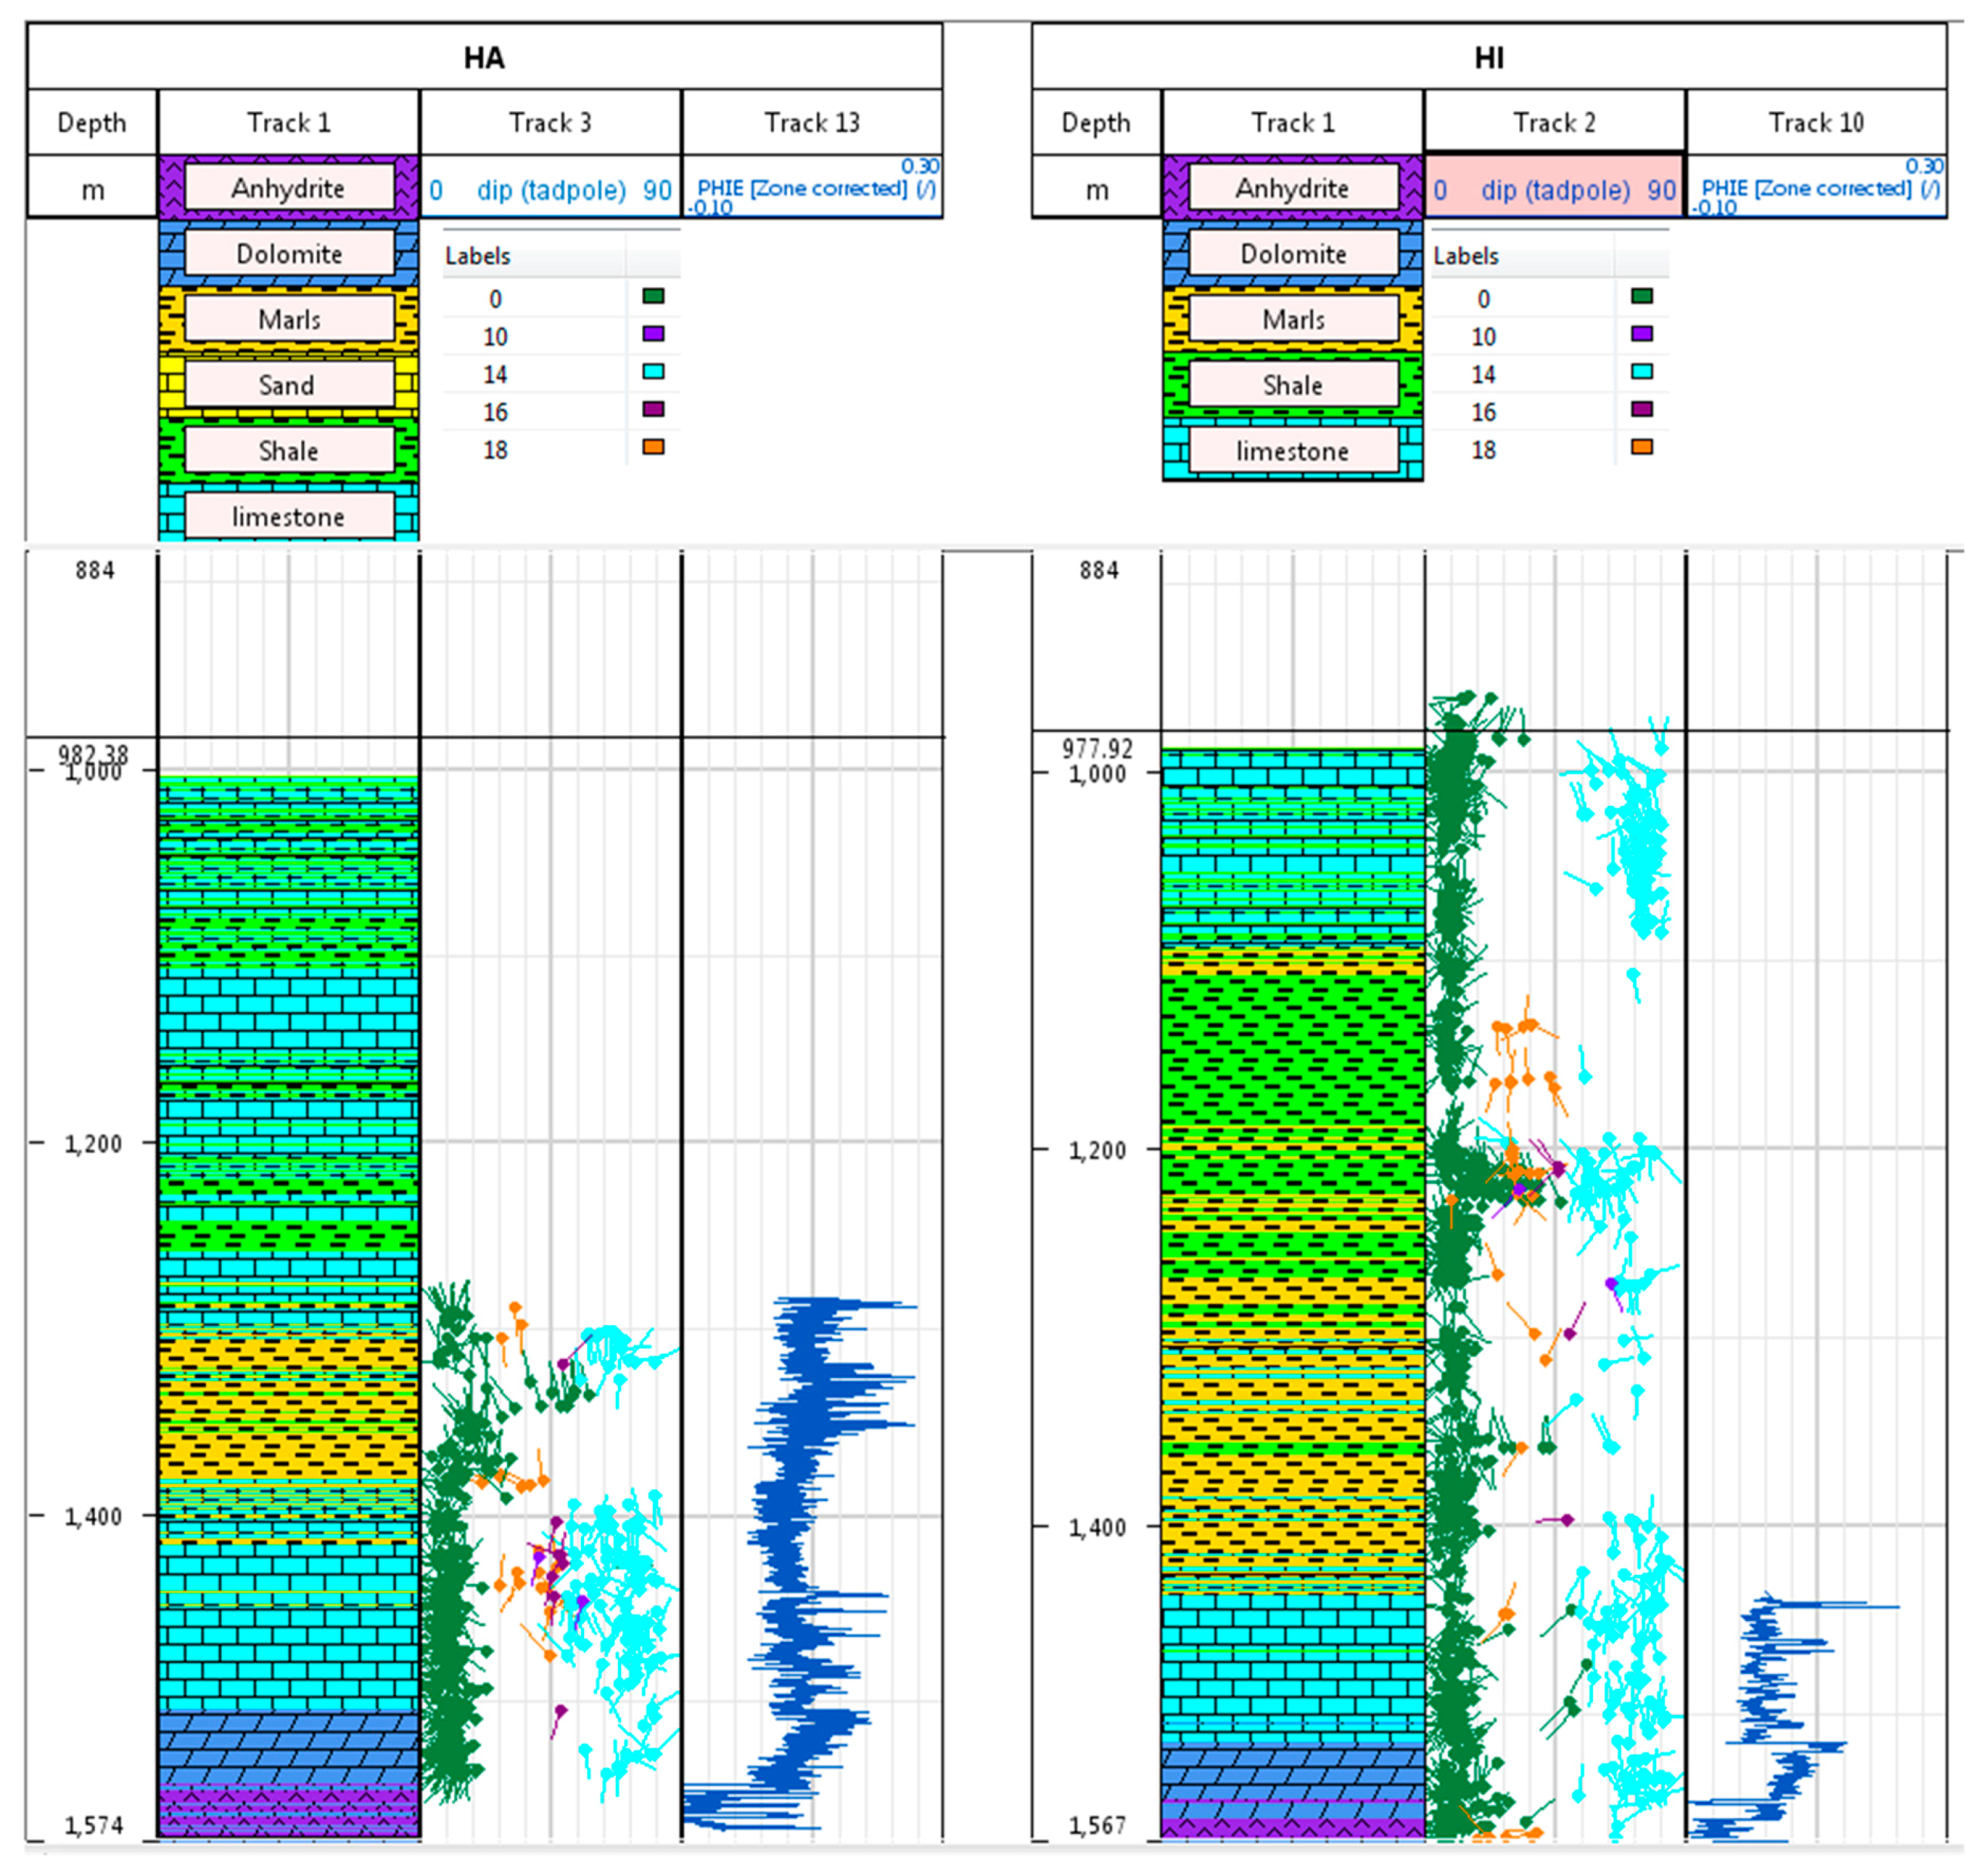
The petrophysical model is established from the facies and neutron porosity log available from HA and HI wells and laboratory results. Since only the two newly-drilled wells have facies and porosity information, a simple modeling approach is selected for property modeling, as detailed next.

2.4.1. Facies

The facies are based upon horizontally-isotropic spherical variograms with an assumed correlation length that is equal to 100 m, while still being constrained at the wells. Due to the lack of correlation, the vertical correlation length of the facies is assumed to be limited to the formation thicknesses as shown in Table 1. This is particularly important in the Pozazal and Marly Lias formations (main cap rock) which show successions of shales, limestones, and marls. The vertical correlation length may alter the vertical connectivity between the formations. Consequently, the grid thickness is quite small in the Pozazal formation, which shows alternations of marl and shale layers, as illustrated in Figure 3.

2.4.2. Porosity

The porosity log at the newly-drilled wells is upscaled to the grid vertical size. The upscaled porosity is distributed within the grid based upon a moving average algorithm that is constrained by the facies.

2.4.3. Permeability

The permeability is assumed to be constant per facies (Table 2). The matrix permeability is mainly available from core measurements [16,21] that may be complemented for some facies by literature data [22], which is consistent with the core measurements.
Previous dynamic modeling shows a minor contribution of the matrix in the history matching of the pressure response. The fracture permeability is the main driver to the history matching of the pressure response.

3. Fracture Modeling

3.1. Fracture Characterization and Modeling

A study on fracture characteristics in both wells was conducted during the well logging campaigns which particularly focused on the reservoir strata [18]. The acoustic Televiewer is composed of an acoustic transducer and a rotating acoustic mirror to scan the borehole walls. The amplitude and travel time of the reflected acoustic signal are recorded simultaneously as separate image logs. Features, such as fractures, reduce the reflected amplitude and often appear as dark sinusoid traces on the log [23,24]. Data that were gained from the acoustic Televiewer log were provided as type of fractures and their distribution along the well.

3.2. Discrete Fracture Network Modeling

As summarized by Jing [25], the DFN method is a special discrete model that considers fluid flow and transport processes in fractured rock masses through a system of connected fractures. The DFN are particularly well suited to characterize of the permeability of fractured rocks and generic studies of fracture influences, and the design of rock engineering works for near-field problems.
The stochastic simulation of fracture systems is the geometric basis of the DFN approach and it plays a crucial role in the performance and reliability of the DFN model. The key process is to create probability distribution functions of fracture parameters that are relating to the densities, orientations, and sizes, based on field mapping results while using borehole logging data and scanline or window mapping techniques, and generate the realizations of the fractures systems according to these probability distribution functions and assumptions about fracture shape (circular discs, ellipses, or polygons).
To include the fractures that are identified in the Televiewer log, a specialized software, FracaFlow™ [10] is used to better integrate the different fractures into the flow model and to calibrate their conductivities on the well test interpretations. The DFN approach that was implemented in FracaFlow™ [10] is based upon a pipe model that represents a fracture as a pipe of equivalent hydraulic conductivity starting at the disc center and ending at the intersections with other fractures, based on the fracture transmissivity, size, and shape distributions [26]. Depending upon the geological context, different types of objects may be identified at different scales (diffuse fractures, fault-associated fractures, faults), which may be intercepted by the wells [27].
The diffuse fractures are identified during the interpretation of the Televiewer log (Figure 3). The fault-associated fractures correspond to the fault damage zones and the faults themselves are easy identified in Televiewer log. In general, horizontal wells provide the best source of information on the fractures. However, at Hontomìn, all wells, including the newly-drilled ones, are sub-vertical wells, thus limiting the intercepted fractures to the set of diffuse fractures and the fault zones that were identified during well drilling, which occurs once in the Marly Lias above the storage formation for the HI well.
The approach relies upon a DFN construction from the identified fracture and calibration of the various parameters, such as permeability of each fracture set in all directions, aperture of each fracture set, upon the well tests [12]. A fracture is characterized by its attributes, such as orientation (dip and strike), length, aperture, and origin or morphology. In this work, the fracture attributes that are used are the orientations, length, aperture, and fracture density. A fracture set is a group of fractures having similar attributes. The fracture set can be described with the previous attributes and its density of fractures. The fracture characteristics may be associated to the facies that are generated on the grid. Consequently, each facies shows a different level of fracture corresponding to different fracture density and occurrence of each set.
The grid and its properties (facies, porosity, and permeability distribution) for the matrix, the main horizons (Top Dogger, Top Lias, Top Calcareous Sopeña, and Top Keuper), the fault maps at Top Calcareous Sopeña and the well trajectories and logs (facies, porosity) are imported into FracaFlow™. All of the fractures characteristics for HI and HA from Televiewer log [18] were also imported as fracture logs (type, dip, and azimuth) as a function of depth from the Dogger to the well shoes (Sopeña/Keuper formations), as shown in Figure 3.

3.3. Fracture Analysis

The pole analysis (Figure 4) is based on the statistical analysis of the dip and the strike of the mean pole of each set of fractures. The mean poles are analyzed according to their main orientations (dip, strike), as shown in Table 3.
Most of the fractures identified in the wells (light blue in Figure 4) are sub-horizontal and reflects the formation bedding. Two main sets of diffuse fractures are identified (Table 3):
  • one with an approximate North-South (N-S) orientation (strike ~176 N); and,
  • one with an approximate East-West (E-W) orientation (strike ~85 N).
The attributes of these two sets of diffuse fractures identified in HA well are shown in Figure 5. The diffuse fracture sets are then associated with the facies in terms of fracture densities, as shown in Table 4. There is no fracture identified in the anhydrite facies, but all the other facies exhibit some level of facture.
The estimated thickness of the various beds may be obtained from the density of the bedding fracture of the reservoir, which is about 1 m for the limestone and dolomite. The apertures and conductivities of each set of fracture are fairly uncertain and poorly constrained at this stage. Therefore, interpreted well tests will be used to reduce these uncertainties, as shown in the following section.

3.4. Discrete Fracture Network Modeling

A DFN is a realization of the statistical model and it is a 3-D representation of the fracture model, which includes the two sets of fractures. FracaFlow™ uses an “automated KH calibration” method (detailed in [28]) to calibrate the fracture model, in order to be as close to reality as possible. Some of its parameters are indeed very uncertain (flow capacity for example). This calibration is based upon the interpreted well tests. The automated flow capacity (KH) calibration is an analytical calibration of the DFN parameters on the well test interpretations. The algorithm will find the values of the flow capacity and eventually other parameters that are necessary to match the well test. The calibration is based on an analytical upscaling of the permeability [28]:
  K e q = K m i n   ×   K m a x
where Keq (m2) is the equivalent permeability between the minimum, Kmin (m2), and the maximum, Kmax (m2), permeabilities respectively. A DFN within drainage volume of HI well and limited to the Upper Calcareous Sopeña is used for the flow capacity calibration.
The parameters that were considered in the automated KH calibration are the flow capacity of E-W and N-S diffuse fractures. In order for the calibration algorithm to converge, a large enough number of initial solutions, i.e., greater than 500, must be computed to ensure a global optimum solution. The results reported in Table 5 are computed for at least 1000 generations of the genetic algorithm [29], which is significantly beyond the expected default convergence. The calibration is performed on Upper Calcareous Sopeña with the matrix properties, as described previously (Table 2).
As shown in Table 5, convergence of the algorithm was only obtained on the last of the well tests for both diffuse fracture sets given the DFN generated, the random number that was used to generate the analytical calibration. This value will be used to validate the DFN properties based upon the Upper Calcareous Sopeña properties. The results obtained for the March 2015 test (Table 5) indicates that a horizontal anisotropy is generated by the diffuse fracture network: the horizontal anisotropy ratio is about 5 between North-South and East-West directions.
The automated KH calibration options of FracaFlow™ are designed for conventional fractured reservoirs. The computed flow capacity of the fracture sets is very low and the inversion algorithm within the analytical automated KH calibration does not always converge towards physically meaningful and data-consistent fracture properties.
The final step is the upscaling of the DFN properties (fracture permeabilities and porosities) over the whole model. Upscaling enables calculating the equivalent parameters that are linked to diffuse fractures (permeability, porosity, and block dimensions) while using an analytical upscaling method. Consequently, the fracture properties will be spread to all facies (except anhydrite) and all zones of the geological model. Equivalent properties are then computed for the fracture media at the scale of the grid block of the geological model while the matrix properties are not modified.

4. Discussion

As detailed above, the model of the storage complex established will serve as a basis for the ENOS project partners. The primary goal was to integrate and quality check the data provided to the project by the site operator, CIUDEN. The structural model is based upon the re-interpreted legacy 3-D seismic data, which was provided by the site operator and that identified the main horizons in the storage complex between the Dogger and Keuper formations and the faults at the top of the storage (Sopeña) formation. The Hontomìn site has undergone a very complex and tectono-sedimentary evolution that developed fractures under successive deformation stages in the reservoir and seal formations (see [30] and references therein). This work follows the interpretation methodology that was proposed by Alcade et al. [20]. The model established differs mainly with respect to fault interpretation at the top of the Sopeña formation. In the current model, the fault model is simplified and only include two main faults, Ubierna and East faults (Figure 1), as all others do not play any significant hydraulic role [31] and when considering the uncertainty that is associated with the complex geology and low quality of the seismic data, which limits the application of conventional horizon picking [32]. The horizons are tied to the well markers. The vertical discretization of storage complex model is consistent with the facies log at the injection and observation wells, as detailed previously. However, the lateral correlation of the facies and the petrophysical properties are still quite uncertain and would require detail petrophysical characterization studies, which are not currently available.
The major improvement of the model is the fracture characterization and dynamic calibration following a workflow proposed by de Joussineau et al. [10]. From the acoustic Televiewer log at each of the nearly-drilled wells, two main sets of diffuse fracture are identified besides the fracture reflecting the formation bedding:
  • one with an approximate North-South orientation (strike ~176 N); and,
  • one with an approximate East-West orientation (strike ~85 N).
A DFN was constructed within the drainage volume of the wells that was used to calibrate the fracture flow capacity with respect to interpreted well tests. The convergence of the calibration algorithm towards physically meaningful and data-consistent fracture properties lead to different flow capacity for each of the two sets of fracture (Table 5), which imply a permeability anisotropy during the upscaling to the reservoir grid. Given the calibrated flow capacity in Table 5, CO2 migration will be favored in the north-south direction.
As the approaches to elaborate and calibrate the DFN are statistically based, the results presented in this paper shall only be considered as initial and it will serve as the basis to the future full-field history matching of the CO2 and brine injection tests which will be performed within the ENOS project [33].

5. Conclusions

A geological model encompassing the whole storage complex was established based upon newly-drilled wells, legacy wells and 3-D seismic interpretation of the Hontomìn site. The matrix characteristics were mainly set from the newly drilled wells (HA the observation well and HI the CO2 injection well), which were fully characterized by a complete suite of log acquisitions, laboratory works, and hydraulic tests. The model major improvement is the integration of the diffuse fractures. Most of facies within the reservoir were fractured and two main sets of fracture are identified. The flow capacity of the fracture networks are calibrated on the interpreted injection tests by matching their characteristics such as permeability and aperture at the DFN scale. The porosities and permeabilities of the DFN are subsequently upscaled to reservoir scale and included to the geological model. A key new feature of the model is the estimation of the permeability anisotropy associated with the diffuse fracture sets, which should favor the CO2 migration in the north-south direction.
This model of the storage complex of the Hontomìn will later be used as a basis for the history matching of the dynamic model for the injections planned in ENOS project and in subsequent works to be conducted on site.

Author Contributions

Conceptualization, J.C.d.D., Y.L.G.; Methodology, Y.L.G.; Software, Y.L.G.; Validation, Y.L.G., J.C.d.D.; Data Curation, J.C.d.D.; Writing-Original Draft Preparation, Y.L.G., J.C.d.D.; Writing-Review & Editing, Y.L.G., J.C.d.D.

Funding

This research was funded by European Union Horizon 2020 Framework Programme under grant agreement No 653718. Sole responsibility lies with the authors, so the European Commission is not responsible for any use that may be made of the information contained in this article.

Acknowledgments

The authors acknowledge ENOS project partners (http://www.enos-project.eu) that allowed this work and authorized its publication. The authors thank Ch. Aug for his support and guidance to efficiently use FracaFlow™ software. The authors wished to thank two anonymous reviewers whose comments were quite valuable to improve this paper.

Conflicts of Interest

The authors declare no conflict of interest. The funders had no role in the design of the study; in the collection, analyses, or interpretation of data; in the writing of the manuscript, and in the decision to publish the results.

References

  1. Chadwick, A.; Arts, R.; Bernstone, C.; May, F.; Thibeau, S.F.; Zweigel, P. (Eds.) Best Practice for the Storage of CO2 in Saline Aquifers-Observations and Guidelines from the SACS and CO2STORE Projects; British Geological Survey: Nottingham, UK, 2008; pp. 15–20. ISBN 978-0-85272-610-5. Available online: https://core.ac.uk/download/pdf/63085.pdf (accessed on 14 May 2018).
  2. Kovacs, T.; Poulussen, D.F.; de Dios, J.C. Strategies for Injection of CO2 into Carbonate Rocks at Hontomìn; GCCSI Final Technical Report; GCCSI: Canberra, Austrilia, 2015; 66p, Available online: https://hub.globalccsinstitute.com/sites/default/files/publications/193428/strategies-injection-co2-carbonate-rocks-hontomin-final-technical-report.pdf (accessed on 14 May 2018).
  3. European Parliament Resolution. Implementation Report 2013: Developing and Applying Carbon Capture and Storage Technology in Europe (2013/2079(INI)). Available online: http://www.europarl.europa.eu/sides/getDoc.do?type=REPORT&reference=A7-2013-0430&language=EN (accessed on 14 May 2018).
  4. Whittaker, S.; Rostron, B.; Hawkes, C.; Gardner, C.; White, D.; Johnson, J.; Chalaturnyk, R.; Seeburger, D. A decade of CO2 injection into depleting oil fields: Monitoring and research activities of the IEA GHG Weyburn-Midale CO2 Monitoring and Storage Project. Energy Procedia 2011, 4, 6069–6076. [Google Scholar] [CrossRef]
  5. Liu, H.; Tellez, B.G.; Atallah, T.; Barghouty, M. The role of CO2 capture and storage in Saudi Arabia’s energy future. Int. J. Greenh. Gas Control 2012, 11, 163–171. [Google Scholar] [CrossRef]
  6. Delprat-Jannaud, F.; Pearce, J.; Akhurst, M.; Nielsen, C.M.; Neele, F.; Lothe, A.; Volpi, V.; Brunsting, S.; Vincké, O. SiteChar—Methodology for a fit-for-purpose assessment of CO2 storage sites in Europe. Oil Gas Sci. Technol. 2015, 70, 531–554. [Google Scholar] [CrossRef]
  7. EC Storage Directive 2009/31/EC. 2009. Available online: https://eur-lex.europa.eu/LexUriServ/LexUriServ.do?uri=OJ:L:2009:140:0114:0135:EN:PDF (accessed on 14 May 2018).
  8. Deflandre, J.P.; Estublier, A.; Baroni, A.; Daniel, J.M.; Adjémian, F. In Salah CO2 injection modeling: A preliminary approach to predict short term reservoir behavior. Energy Procedia 2011, 4, 3574–3581. [Google Scholar] [CrossRef]
  9. Iding, M.; Ringrose, P. Evaluating the impact of fractures on the performance of the In Salah CO2 storage site. Int. J. Greenh. Gas Control 2010, 4, 242–248. [Google Scholar] [CrossRef]
  10. De Joussineau, G.; Barrett, K.R.; Alessandroni, M.; Le Maux, T.; Leckie, D. Organization, flow impact and modeling of natural fracture networks in a karstified carbonate bitumen reservoir: An example in the Grosmont Formation of the Athabasca Saleski leases, Alberta, Canada. Bull. Can. Pet. Geol. 2016, 64, 291–308. [Google Scholar] [CrossRef]
  11. Gastine, M.; Berenblyum, R.; Czernichowski-Lauriol, I.; de Dios, J.C.; Audigane, P.; Hladik, V.; Poulsen, N.; Vercelli, S.; Vincent, C.; Wildenborg, T. Enabling onshore CO2 storage in Europe: Fostering international cooperation around pilot and test sites. Energy Procedia 2017, 114, 5905–5915. [Google Scholar] [CrossRef]
  12. Ray, D.S.; Al-Shammeli, A.; Verma, N.K.; Matar, S.; De Groen, V.; De Joussineau, G.; Le Maux, T.; Al-Khamees, W. Characterizing and modeling natural fracture networks in a tight carbonate reservoir in the Middle East: A methodology. Bull. Geol. Soc. Malays. 2012, 58, 29–35. [Google Scholar]
  13. Bourbiaux, B.; Basquet, R.; Daniel, J.M.; Hu, L.Y.; Jenni, S.; Lange, A.; Rasolofosaon, P. Fractured reservoirs modelling: A review of the challenges and some recent solutions. First Break 2005, 23, 33–40. [Google Scholar] [CrossRef]
  14. Rubio, F.M.; Garcia, J.; Ayala, C.; Rey, C.; García Lobón, J.L. Gravimetric characterization of the geological structure of Hontomín. In Proceedings of the Asamblea Hipano-Lusa de Geodesia y Geofísica, Évora Portugal, 29–31 January 2014. [Google Scholar]
  15. De Dios, J.C.; Delgado, M.A.; Marín, J.A.; Martinez, C.; Ramos, A.; Salvador, I.; Valle, L. Short-term effects of impurities in the CO2 stream injected into fractured carbonates. Int. J. Greenh. Gas Control 2016, 54, 727–736. [Google Scholar] [CrossRef]
  16. Kovács, T. Characterization of the Hontomín reservoir and seal formations. In Proceedings of the 4th Spanish-French Symposium on CO2 Geological Storage, Bordeaux, France, 13–14 May 2014. [Google Scholar]
  17. Zemanek, J.; Glenn, E.E.; Norton, L.J.; Caldwell, R.L. Formation Evaluation by inspection with the borehole Televiewer. Geophysics 1970, 35, 254–269. [Google Scholar] [CrossRef]
  18. De Dios, J.C.; Delgado, M.A.; Martínez, C.; Ramos, A.; Álvarez, I.; Marín, J.A.; Salvador, I. Hydraulic characterization of fractured carbonates for CO2 geological storage: Experiences and lessons learned in Hontomín Technology Development Plant. Int. J. Greenh. Gas Control 2017, 58, 185–200. [Google Scholar] [CrossRef]
  19. Valle, L. Hontomin reservoir condition tests. In Proceedings of the 4th Spanish-French Symposium on CO2 Geological Storage, Bordeaux, France, 13–14 May 2014. [Google Scholar]
  20. Alcalde, J.; Marzán, I.; Saura, E.; Martí, D.; Ayarza, P.; Juhlin, C.; Pérez-Estaún, A.; Carbonell, R. 3D geological characterization of the Hontomín CO2 storage site, Spain: Multidisciplinary approach from seismic, well-log and regional data. Tectonophysics 2014, 627, 6–25. [Google Scholar] [CrossRef]
  21. Dávila, G.; Luquot, L.; Soler, J.M.; Cama, J. Interaction between a fractured marl caprock and CO2-rich sulfate solution under supercritical CO2 conditions. Int. J. Greenh. Gas Control 2016, 48, 105–119. [Google Scholar] [CrossRef]
  22. Bennion, D.B.; Bachu, S. Permeability and relative permeability measurements at reservoir conditions for CO2-water systems in ultra-low permeability confining cap rocks. In Proceedings of the EUROPEC/EAGE Conference and Exhibition, London, UK, 11–14 June 2007. [Google Scholar] [CrossRef]
  23. Williams, J.H.; Johnson, C.D. Acoustic and optical borehole-wall imaging for fractured-rock aquifer studies. J. Appl. Geophys. 2004, 55, 151–159. [Google Scholar] [CrossRef]
  24. Collier, H.; Ridder, M. Utilization of the borehole Televiewer in fracture analysis. Ground Water Manag. 1992, 13, 765–779. [Google Scholar]
  25. Jing, L. A review of techniques, advances and outstanding issues in numerical modelling for rock mechanics and rock engineering. Int. J. Rock Mech. Min. Sci. 2003, 40, 283–353. [Google Scholar] [CrossRef]
  26. Cacas, M.C.; Ledoux, E.; Marsily, G.D.; Tillie, B.; Barbreau, A.; Durand, E.; Feuga, B.; Peaudecerf, P. Modeling fracture flow with a stochastic discrete fracture network: Calibration and validation: 1. The flow model. Water Resour. Res. 1990, 26, 479–489. [Google Scholar] [CrossRef]
  27. Ali, A.M.; Kumar, K.; Murty, C.R.; Lemaux, T.; Ranjan, A.; Dejoussineau, G.; Bertrano, C.; Behira, H. Integrated reservoir connectivity study of Ahmadi fractured reservoir in Bahrain Field. In Proceedings of the SPE/EAGE Reservoir Characterization & Simulation Conference, Manama, Bahrain, 15–18 March 2009. [Google Scholar] [CrossRef]
  28. Daniau, F.; Aug, C.; Lemaux, T.; Lalou, R.; Lemaire, O. An Innovative and Multi-disciplinary Methodology for Modelling Naturally Fractured Reservoirs. In Proceedings of the 70th EAGE Conference and Exhibition Incorporating SPE EUROPEC, Rome, Italy, 9–12 June 2008. [Google Scholar] [CrossRef]
  29. Lange, A.; Bruyelle, J. A multimode inversion methodology for the characterization of fractured reservoirs from well test data. In Proceedings of the SPE EUROPEC/EAGE Annual Conference and Exhibition, Vienna, Austria, 23–26 May 2011. [Google Scholar] [CrossRef]
  30. Alcalde, J. 3D Seismic Imaging and Geological Modeling of the Hontomin CO2 Storage Site. Ph.D. Thesis, Universitat de Barcelona, Barcelona, Spain, 2014; 171p. [Google Scholar]
  31. Le Gallo, Y.; de Dios, J.C.; Salvador, I.; Acosta Carballo, T. Dynamic characterization of fractured carbonates at the Hontomín CO2 storage site. In Proceedings of the EGU General Assembly Conference, Vienna, Austria, 24–28 April 2017. [Google Scholar]
  32. Alcalde, J.; Martí, D.; Calahorrano, A.; Marzán, I.; Ayarza, P.; Carbonell, R.; Juhlin, C.; Pérez-Estaún, A. Active seismic characterization experiments of the Hontomín research facility for geological storage of CO2, Spain. Int. J. Greenh. Gas Control 2013, 19, 785–795. [Google Scholar] [CrossRef]
  33. De Dios, J.C.; Le Gallo, Y.; Marín, J.A. Innovative CO2 injections in carbonates and advanced modelling for numerical investigation. Submitted to Fluids. Preprints 2018, 2018070537. [Google Scholar] [CrossRef]
Figure 1. Hontomín geological model extension. The South fault, i.e., Ubierna fault (in dark blue), and East fault (in light green) control the structural south-eastward extension of the storage formation.
Geosciences 08 00354 g001
Figure 2. Vertical cross-section of the geological model of the Hontomìn storage complex; The HA and HI newly-drilled wells are the observation and CO2 injection wells, respectively, while H2 to H4 wells are legacy wells.
Geosciences 08 00354 g002
Figure 3. Facies, fracture dip–Televiewer log (Courtesy of Instituto de Ciencias de la Tierra Jaume Almera) and porosity logs for HI and HA wells.
Geosciences 08 00354 g003
Figure 4. Poles stereo diagram for the bedding (blue), N-S (yellow), and E-W (green) fracture sets.
Geosciences 08 00354 g004
Figure 5. Facies, fracture dip (bedding in dark green), interpreted N-S (purple), and E-W (light green) fracture sets and porosity logs for HA well.
Geosciences 08 00354 g005
Table 1. Matrix facies characteristics for the different formations in the storage complex model.
FaciesVertical Correlation Length (m)
MarlsDogger: 51
Marly Lias: 7.5
Pozazal: 1.6
ShaleDogger: 51
Marly Lias: 7.5
Pozazal: 1.6
Upper Baffle Calcareous Sopeña: 4.4
LimestoneDogger: 51
Marly Lias: 7.5
Pozazal: 1.6
Upper Calcareous Sopeña: 79.7
Upper Baffle Calcareous Sopeña: 4.4
Middle Calcareous Sopeña: 83.5
Dolomitic Sopeña: 27.3
Lower Baffle Calcareous Sopeña: 3
Lower Calcareous Sopeña: 100.2
Dolomitic Sopeña: 59.6
DolomiteMiddle Calcareous Sopeña: 83.5
Lower Baffle Calcareous Sopeña: 3
Lower Calcareous Sopeña: 100.2
Dolomitic Sopeña: 59.6
Carniolas: 13.5
AnhydriteDolomitic Sopeña: 59.6
Carniolas: 13.5
Table 2. Permeability of the matrix facies.
FaciesHorizontal Permeability (m2)Reference
Marls10−21Dávila et al. [21]
Shale1.5 × 10−20Bennion and Bachu [22]
Limestone4.9 × 10−16Kovács [16]
Dolomite5.9 × 10−16Kovács [16]
Anhydrite 3.5 × 10⁻¹⁹Bennion and Bachu [22]
Table 3. Mean pole of the fracture family as a function of orientation.
Fracture Orientation Number of FracturesStrike 1Strike Standard DeviationDip 2Dip Standard Deviation
E-W278850.5840.35
N-S481760.3820.25
1 Degree with respect to North. 2 Degree with respect to horizontal.
Table 4. Mean fracture density (Number of fractures /meter) as a function of facies.
Fracture OrientationDolomiteLimestoneMarlShaleAnhydrite
E-W Orientation0.320.580.040.230
N-S Orientation0.980.930.090.200
Table 5. Simulated flow capacity in different fall-off tests for HI well.
Date of the Injection Test (de Dios et al. [18])Interpreted KH (m3) (de Dios et al. [18])Simulated KH (m3)E-W Fracture KH (m3)N-S Fracture KH (m3)
June 20146.9 × 10−147.5 × 10⁻¹⁴NC (*)NC (*)
August 20141.1 × 10−131.1 × 10−131.1 × 10−157.9 × 10⁻¹⁶
October 20141.6 × 10−131.6 × 10⁻¹³NC (*)1.4 × 10⁻¹⁵
December 20141.5 × 10−131.5 × 10⁻¹³NC (*)1.3 × 10⁻¹⁵
March 20152.4 × 10−132.4 × 10−134.9 × 10−162.4 × 10⁻¹⁵
(*) NC: no convergence for a minimum fracture flow capacity of 10−21 m3.

