Remote Sensing Analyses on Sentinel-2 Images: Looking for Roman Roads in Srem Region (Serbia)


1
Domaine Universitaire, Maison de l’Archéologie, Institut Ausonius (UMR 5607), Université Bordeaux Montaigne, 8 Esplanade des Antilles, 33600 Pessac, France
2
Independent Researcher, via XXV Aprile 16, 87053 Celico CS, Italy
*
Author to whom correspondence should be addressed.
Geosciences 2019, 9(1), 25; https://doi.org/10.3390/geosciences9010025
Submission received: 25 November 2018
/
Revised: 22 December 2018
/
Accepted: 28 December 2018
/
Published: 5 January 2019
(This article belongs to the Special Issue Earth Observation, Remote Sensing and Geoscientific Ground Investigations for Archaeological and Heritage Research)
Abstract
:The present research is part of the project “From Aquileia to Singidunum: reconstructing the paths of the Roman travelers—RecRoad”, developed at the Université Bordeaux Montaigne, thanks to a Marie Skłodowska-Curie fellowship. One of the goals of the project was to detect and reconstruct the Roman viability between the Roman cities of Aquileia (Aquileia, Italy) and Singidunum (Belgrade, Serbia), using different sources and methods, one of which is satellite remote sensing. The research project analyzed and combined several data, including images produced by the Sentinel-2 mission, funded by the European Commission Earth Observation Programme Copernicus, in which satellites were launched between 2015 and 2017. These images are freely available for scientific and commercial purposes, and constitute a constantly updated gallery of the whole planet, with a revisit time of five days at the Equator. The technical specifications of the satellites’ sensors are particularly suitable for archaeological mapping purposes, and their capacities in this field still need to be fully explored. The project provided a useful testbed for the use of Sentinel-2 images in the archaeological field. The study compares traditional Vegetation Indices with experimental trials on Sentinel images applied to the Srem District in Serbia. The paper also compares the results obtained from the analysis of the Sentinel-2 images with WorldView-2 multispectral images. The obtained results were verified through an archaeological surface survey.
1. Introduction
This paper aims to present the research methodology developed within the “RecRoad—Reconstructing the Paths of the Roman Travelers from Aquileia to Singidunum” project, funded through a Marie Skłodowska-Curie Individual Fellowship at the Université Bordeaux Montaigne. The project, started in February 2016 and ended in January 2018, aimed to retrace, with the highest possible reliability level, the Roman itinerary between Aquileia (Italy) and Singidunum (Belgrade, Serbia), following the course of the Sava River.
Between the 2nd century BC and the 4th century AD, Aquileia was an important military base and the main port of the Northern Adriatic basin, particularly for its relationships with the people living in Hystria and in the basin of the Danube (Strab. V, 1, 8, 214 C). Singidunum, established at the confluence of the Sava and Danube Rivers, where Belgrade is now located, was an important city and one of the main military camps in the province of Moesia Superior. The Romans traced several itineraries to connect Northern Italy to the Danube area: the travelers could choose the one they preferred according to their personal needs. These routes are described in the itinerary sources, namely the Itinerarium Antonini [1] (pp. 1–85), [2,3], the Itinerarium Burdigalense [1] (pp. 86–190), [4,5] and the Tabula Peutingeriana [6,7,8,9,10,11].
According to these resources, two main routes led from Aquileia to Singidunum; both crossed the Alps at the Ad Pirum pass (Hrušica, Slovenia), in the Julian Alps, to reach Emona (Ljubljana). The road, as reported in the Itinerarium Antonini and Itinerarium Burdigalense, subsequently headed north-east towards Celeia (Celje) and Poetovio (Ptuj), where it started following the valley of the Drava River across Croatia, to reach its confluence with the Danube. On the other hand, the Tabula Peutingeriana shows another itinerary, passing by Emona and turning to south-east, in the direction of the Sava River, that is reached at Siscia (Sisak). Then, it follows the course of the Sava until it flows into the Danube in front of Singidunum. This latter is the itinerary that was mapped within the RecRoad Project: and it was the first to be traced by the consul P. Cornelius Lupus in BC 156, in its attempt to reach Segestica (the Celtic settlement nowadays covered by the modern Sisak), as Appian (Illyr. 22 and 135) and Polibius (fr. 64) have reported [12] (pp. 437–438). Octavian’s armies took the same direction in BC 36–35, when he decided to conquer Segestica and to temporarily take control of the Iapodes [13] (pp. 29,30).
Notwithstanding the importance of this itinerary, its topographical layout and the location of its remains are partially unknown, and a precise mapping of its archaeological traces has never been accomplished in detail along its whole extension. Due to the length of the route (about 650 km), it was necessary to design a methodology to integrate different sources of information and different techniques, with a strong use of digital methods and the development of a GIS platform to manage the whole dataset. Satellite remote sensing techniques played a central role, enabling the scanning and analysis of very large areas, and to identify the buried remains of the Roman road and other nearby archaeological sites within a distance of about 2 km from the road itself. Among the data used, we decided to compare the results obtained from the images produced by the Sentinel-2 mission for the detection and identification of archaeological remains, to the analysis outcomes for other types of images. We then performed a final reliability assessment of the hypothetical reconstruction of the road mapping, through an archaeological surface surveys.
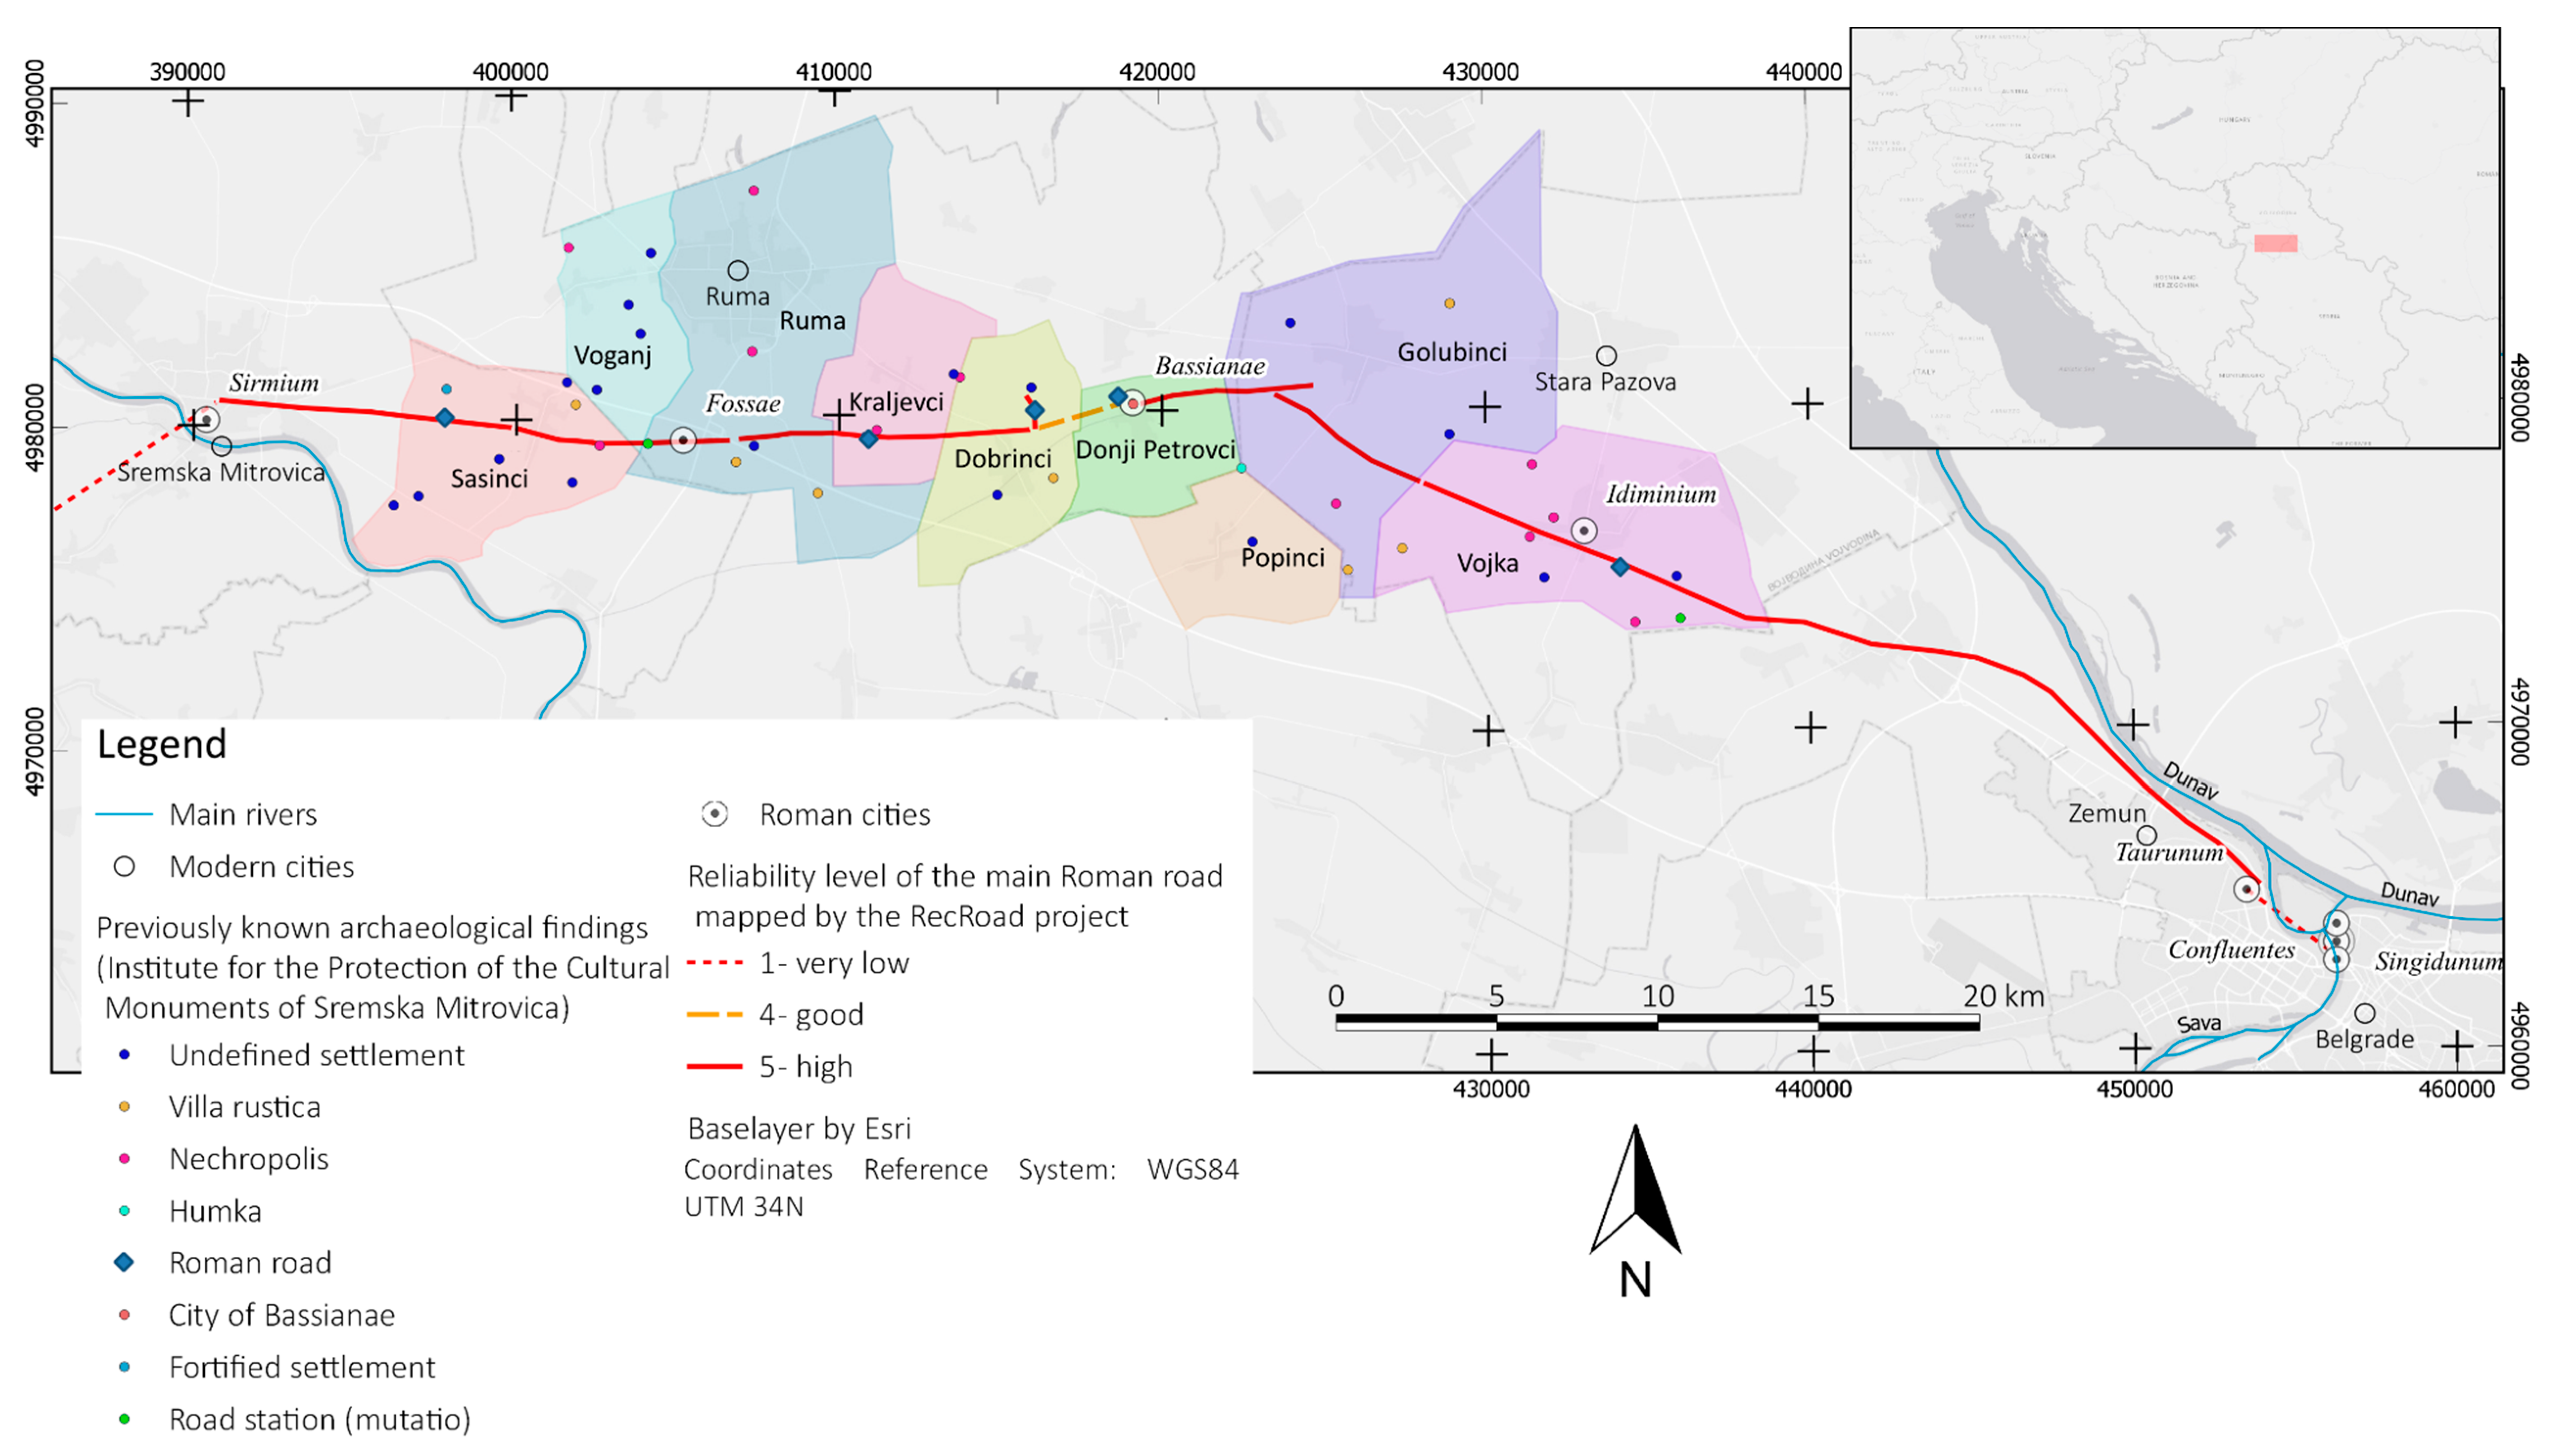
This paper focuses on the results obtained in the region of Srem, in Serbia, where today’s road network has completely changed its layout in comparison to the Roman one, so that the Roman itinerary currently lays under the cultivated fields: this is the best condition to ensure good visibility conditions. Otherwise, in other regions involved in this project, the modern roads lay on top of the Roman ones, preventing an effective detection of the archaeological remains. More specifically, the paper is focused on the territories depending on the settlements of Šašinci, Voganj, Ruma, Kraljevci, Dobrinci, Donji Petrovci, Popinci, Golubinci, and Vojka (Figure 1). The analysis of multi-spectral Sentinel-2 images led to the identification of sixty crop-marks possibly related to the presence of buried archaeological remains in this area.
1.1. Geographic and Historical Framing
The Srem District is one of the seven administrative districts of the autonomous province of Vojvodina. Srem is the western part of the province and its name derives from the Roman city of Sirmium, that stood in the location of the modern city of Sremska Mitrovica. Vojvodina is bound by three main rivers: the Drava at the north, the Danube at the east, and the Sava at the south. It is a part of the Pannonian plain and is a very fertile region, where 70% of crops are cereals [14]. In the northern part of the Srem District, the Fruška Gora mountain is a part of the National Park that includes 35 orthodox monasteries. Before the Roman conquest at the end of the 1st century BC, the region was inhabited by Illyrians. The fortress of Sirmium was built beside the Sava River, and played an important role in the Great Illyrian Revolt in AD 6–9. When Pannonia was finally conquered, Sirmium became its economic capital, thanks to its strategic position. In AD 293, when Diocletian established the Tetrarchy, Sirmium became one of the four capitals of the Empire.
The Roman province of Pannonia had a great strategic relevance and commercial importance. Its north-eastern border was the River Danube, that became the eastern frontier of the Roman Empire, protected by an imposing number of military camps and fortresses connected by a necessary communication network. Among these communication lines, the itinerary from Aquileia to Singidunum, had a central role, linking Italy to the limes, following the course of the Sava River. The region is crossed by some of the major European waterways that were integrated within the land road network. The city of Aquileia, located in the Augustan X Regio, had a key role in spreading the Roman culture eastward, and counted among the Empire’s main ports and crossroads [15,16]. The communication network of the province was primarily designed in response to the military and economical needs of Rome as the political capital of the Empire [17] (pp. 7–12).
Historical sources report the existence of two land routes linking Aquileia to the Danube River, and to the city of Singidunum. They followed the courses of the two main rivers flowing from the west towards the east: one ran along the Drava River, while the second along the Sava River. Both the Itinerarium Antonini (It. Ant. 128-6–132.1) and Itinerarium Burdigalense (It. Burd. 559.11–563.14) report the stages of the Drava itinerary, which passes by Poetovio (Ptuj, Slovenia) and Celeia (Celje, Slovenia). A third source, the Tabula Peutingeriana, provides information about the Sava itinerary. This true road map of the Roman Empire shows the main cities and towns crossed by the route between Aquileia and Singidunum, among which we can count Neviodunum, Siscia, Marsonia, Sirmium, and Bassianae, the main cities on the course of the Sava river [18] (pp. 150–152).
1.2. State of the Art
At the beginning of the RecRoad project, it was possible to map the already known rests of the Roman main road in the territories of the towns of Šašinci, Voganj, Ruma, Kraljevci, Dobrinci, Donji Petrovci, Popinci, Golubinci, and Vojka, under the jurisdiction of the Institute for the Protection of Cultural Monuments of Sremska Mitrovica. The analysis of the Institute’s archive enabled the identification of five locations where the existence of the Roman road had been previously assessed during archaeological surface surveys. The extension of the area of interest of the RecRoad project in the Srem district, and the location of the precedent findings can be seen in Figure 1. The presence of the road was documented in the Šašinci, Kraljevci, Dobrinci, Donji Petrovci, and Vojka territories. Even if this information enabled a general knowledge of its direction, it was not possible to map the layout of the Roman road in full detail, especially concerning its path at the exit from the site of the Roman city Bassianae (located to the north of Donji Petrovci modern settlement) eastward.
In the 1960s, a survey of the eastern section of the road, from Taurunum (Klisina) to Vojka was performed by the Regional Museum of Zemun [19,20,21]. This research was closely followed, in 1969–1971, by the prospections of the Yugoslav–American “Sirmium Project” [22,23,24], that identified on the ground the road in Tovarnik, close to the border between Croatia and Serbia, to Zemun. It was documented that the road was trackable thanks to surface linear dispersions of pebbles of an approximately 15-m-wide surface, mostly even with the ground level and only in some places slightly elevated at 0.5–1 m from the surrounding ground level [23] (p. 261). The reported width of the Roman road’s trace encouraged the use of Sentinel-2 images for the remote sensing analysis, since their spatial resolution can be sufficient to detect a mark 15-m-wide. Within the same project, a first excavation of the Roman road was carried out between August and September 1969 [23].
More recent scientific works and research projects focused on the road from Aquileia to the Danube River, with a specific focus on the segment from Sirmium to Singidunum. Some work published by Petar Milošević in 1988 [25] reported important information for the recognition of the road’s segment linking Sirmium to Bassianae: the focus of the paper was on the topographical evidence of the two roads connecting Sirmium with Mutatio Fossis—which is the initial part of the road Sirmium–Singidunum—and with Bononia. The author discussed the previously affirmed theory according to which the Roman road followed the course of the Sava River down to its crossing with the Jarčina channel in Jarak. This interpretation had already been questioned by the finding of two milestones in the field of Crepovac, between Sremska Mitrovica and Šašinci. By the end of the 19th century, Ignat Jung—representative of the National Museum of Zagreb and teacher in Mitrovica—had remarked the correct direction of the Roman road, through a surface survey, but it was finally accepted in the literature only much later [22] (p. 102). Only in 1981 did a second archaeological excavation document the Roman road in Rumska Petlja [26] (p. 96), [27] (p. 187), with good results especially for the lower layers of the road’s foundation, while the upper levels had been destroyed by the agricultural works.
In 2010, Hrvoje Gračanin made a broad analysis of the historical and itinerary Latin sources about the Roman road network in Pannonia, identifying the stations mentioned by the sources and the relative distances [28]. Two years later, a new survey campaign was performed by the Institute for the Protection of the Cultural Monuments of Sremska Mitrovica within the “Study for the protection of archaeological sites for the needs of the South Stream pipeline construction” [29]: this led to the identification of the traces of the Roman road in the area of Međice, south of Kraljevci, over a length of about 2 km. The trace, 10-m-wide, was marked by circular stones and pebbles [29] (pp. 39,40). The results of the survey were reported in the scientific deliverable of the “ARCHEST Project: Developing archaeological audiences along the Roman route Aquileia–Emona–Sirmium–Viminacium” (www.archest.eu).
In 2017, one of the most recent efforts in the analysis of the epigraphic and geographic knowledge about the Roman itinerary from Aquileia to Singidunum was undertaken by Florin Fodorean. He published two studies focused on the analysis of the epigraphic and geographic sources referring to the road passing by Emona, Siscia, Sirmium, and Taurunum [30], and analysis of the information about the road Emona–Singidunum in the Tabula Peutingeriana, Itinerarium Antonini, and Itinerarium Burdigalense [31].
It is clear that the most recent works regarding the Roman road from Sirmium to Singidunum are focused on two different trends: the first one is analysis of the information contained in the historical sources, while the other remains much more connected to the topographical research. Even if, in comparison with other regions interested by the RecRoad project, the Srem district presented a much detailed and established knowledge of the road path, there were still some questions that required an answer and a need for the precise mapping of the main road’s traces, in order to better plan the monument’s protection in case of future public works in the area.
First of all, it was necessary to understand whether the Roman road maintained a straight direction from Šašinci to Kraljevci, the two locations where it had been identified and documented at the west of Bassianae. The second problem that needed addressing was, of course, the exact behavior of the road between Bassianae and Vojka, where its presence had already been verified. Thanks to the collaboration with the Institute for the Protection of the Cultural Monuments of Sremska Mitrovica, it was possible to identify and map the whole extent of the Roman road from the outskirts of Sremska Mitrovica to the entrance of Zemun, through the analysis of satellite images and a focused archaeological surface survey.
2. Materials and Methods
The RecRoad project raised from its beginning several issues regarding the collection of the necessary geographical data to accomplish the foreseen analysis, and complete the mapping and the reconstruction of the Roman itinerary from Aquileia to Singidunum. The itinerary, extended on an overall distance of 650 km, crossed five different countries: Italy, Slovenia, Croatia, Bosnia Herzegovina, and Serbia. Providing an exhaustive documentation of aerial images has raised, on its own, several issues in terms of delivery time of the materials and of their availability to the public, together with the problem of the dispersion of the documentation in different institutes and countries with different policies for the use and publication of the data.
The beginning of the RecRoad project temporally followed only a few months from the launch of the Sentinel-2A satellite (23 June 2015), the first of the twin satellites making up the Sentinel-2 constellation. Sentinel-2B was launched on 7 March 2017. The images produced by the Sentinel-2 mission immediately attracted our attention, because of their free availability through the Copernicus Open Access Hub (https://scihub.copernicus.eu/), and whole planet coverage. This was especially relevant for the project, due to the extension of the area of interest. The revisit time of the Sentinel-2 mission of five days enabled a continuous coverage over the different stages of the crops’ growth. The two satellites carry a wide swath high-resolution multispectral imager with 13 spectral bands (see Table 1 for detailed spectral characteristics): four bands, corresponding to RGB and NIR, with a resolution of 10 m; six bands corresponding to Vegetation Red Edge (VRE) and SWIR, with a resolution of 20 m; and three bands with a resolution of 60 m (Coastal aerosol, Water Vapour and SWIR—Cirrus). The spectral characteristics of the imagers, resumed in the following table, had been assessed as especially suitable for the identification of crop-marks due to the presence of buried archaeological remains, before the launch of the satellites [32].
Since the images produced by the Sentinel-2 satellites had only been recently released for public use, the research team decided to test their capabilities in the archaeological research field. This was the first testbed for the Sentinel-2 images, since the previous publication record only tried to assess the theoretical archaeological potential of the images based on their spectral characteristics released by the European Commission Earth Observation Programme Copernicus to the scientific community before the launch [32]. Other applications in the cultural heritage field have recently been experimented, with a special focus on the monitoring and protection of archaeological sites [33].
In the Srem District, the satellite remote sensing analysis focused on the area where, according to past research activities, the Roman road would most likely lie, within a strip 10-km-wide. Generally speaking, the research methodology included four steps:
- Satellite remote sensing analysis, resulting in the identification of 60 crop-marks in the Srem District;
- Examination of the data stored in the archive of the Institute for the Protection of the Cultural Monuments of Sremska Mitrovica, that led to the mapping of 50 archaeological sites previously identified during field research activities;
- Comparison of the data obtained during Steps 1 and 2: 13 archaeological sites already filed in the archive corresponded with the anomalies identified on the satellite images;
- Archaeological surface survey to assess the reliability of the data obtained in Step 1.
In some cases, the evidence documented during previous archaeological research could easily be integrated with the stretches of the Roman road visible on the satellite images. Consequently, the archaeological evidence already established increased the reliability level of the satellite remote sensing anomalies. The surface survey, organized in collaboration with the Institute for the Protection of the Cultural Monuments of Sremska Mitrovica, confirmed this hypothesis, allowing the collection of pottery fragments and other autoptic materials that testified to the exact path of the Roman road over the 70 km from Sirmium to the confluence of the Danube and the Sava Rivers, across the city of Bassianae.
2.1. Satellite Remote Sensing Analysis
2.1.1. Processing of Sentinel-2 Images
There are several techniques to map buried archaeological sites through the use of different typologies of satellite images, which have been broadly explained in many different publication that constitute a solid scientific literature [34,35,36,37,38]. Agriculture is the main economic activity in Srem and cereals are the main crop, covering around 70% of its extension [14]: for this reason, the research team considered that analyzing multi-spectral satellite images would have ensured better results in comparison with other kinds of data. To investigate the presence of buried archaeological remains, the researchers mainly used Vegetation Indices to measure crops’ health, which indirectly indicated the presence of buried structures, highlighted by the presence of anomalies in the plants’ growth and health [39]. The analysis of multi-spectral images would have enabled the identification of crop-marks, possibly due to the presence of buried archaeological features: their presence is connected to the concurrency of different factors, among which the soil composition and the vegetation phenological and biophysical cycles play a central role [39] (pp. 114–116). Indeed, crop-marks formation is a dynamic process that depends on vegetal species and on their growth stage: this characteristic was especially taken into account when we decided to use the Sentinel-2 images within the research project. Their revisit time of five days at the Equator actually permitted monitoring crop-marks evolution over the time [40]. Furthermore, the main goal of the Sentinel mission is to provide information for agricultural and forestry practices, with special attention to food security. Their imagers are especially designed to produce images suitable for the calculation of indices such as leaf area chlorophyll and water content indices [41].
Remote sensing analyses were performed over four images generated in 2016:
- S2A_OPER_MSI_L1C_TL_MPS__20160616T131744_A005138_T34TDQ, recorded on 16 June,
- S2A_OPER_MSI_L1C_TL_SGS__20160629T150301_A005324_T34TDQ recorded on 29 June,
- S2A_OPER_MSI_L1C_TL_MPS__20160407T131800_A004137_T34TDQ recorded on 4 July,
- S2A_OPER_MSI_L1C_TL_EPA_20160815T031336_A000426_T34TDQ recorded on 15 August.
Even if the images were all processed with the same techniques, the results obtained from the analysis of the image recorded on 16 June was selected for this publication, because it gave the best results and it could be compared to a WorldView2 image of the same area acquired thanks to an agreement with the European Space Agency (ESA) for the supplying of third party commercial missions’ data (Restrained Dataset Project n. 36166).
After exploring the potentiality of Sentinel-2 images for the first time, we decided to test the efficacy of different Vegetation Indices designed to enhance and exploit the contrast between different regions of the electromagnetic spectrum for archaeological purposes [39] (p. 119). Among those indices, the Normalized Difference Vegetation Index (NDVI) is often used to assess crops’ health through the comparison of Infra-Red and Red bands [35] (pp. 92–94), with the following formula:
NDVI = (NIR − Red)/(NIR + Red).
The index measures the spectral absorption of light performed by chlorophyll, in the Red band, and the reflection of light in the NIR, depending on the leaves’ structure. The resulting values are always less than one: the vegetation will be healthier where values are closer to 1, the ground will be less vegetated where values are closer to 0.
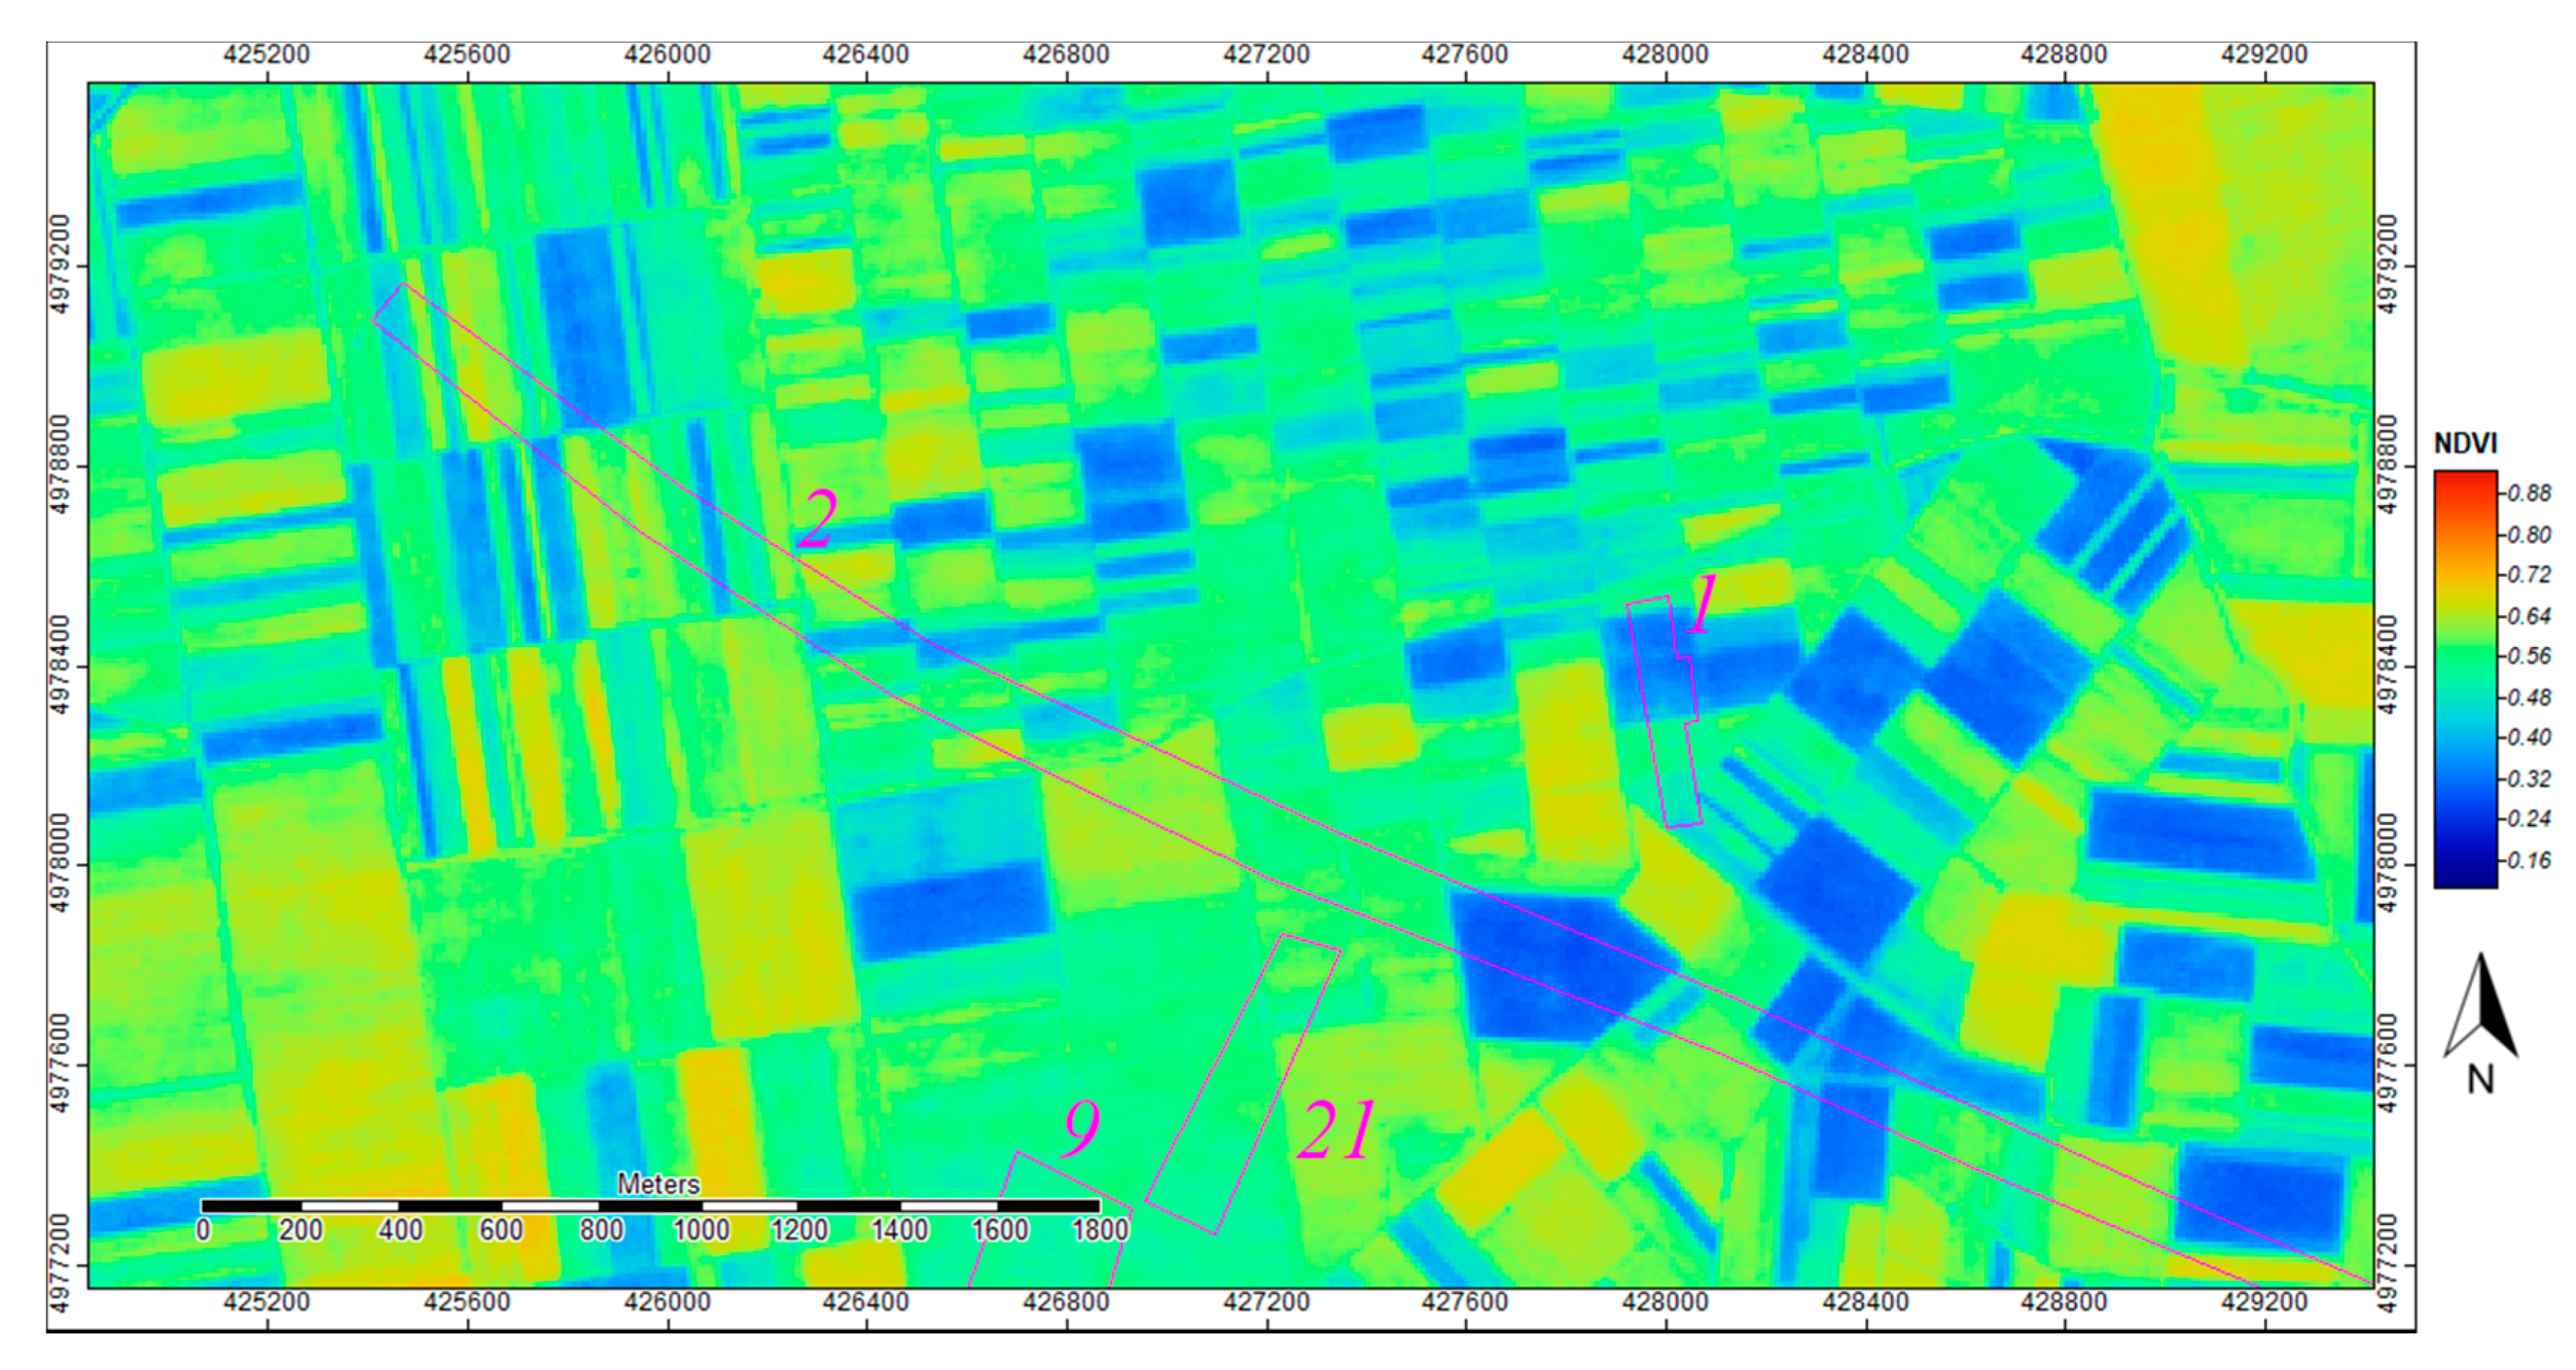
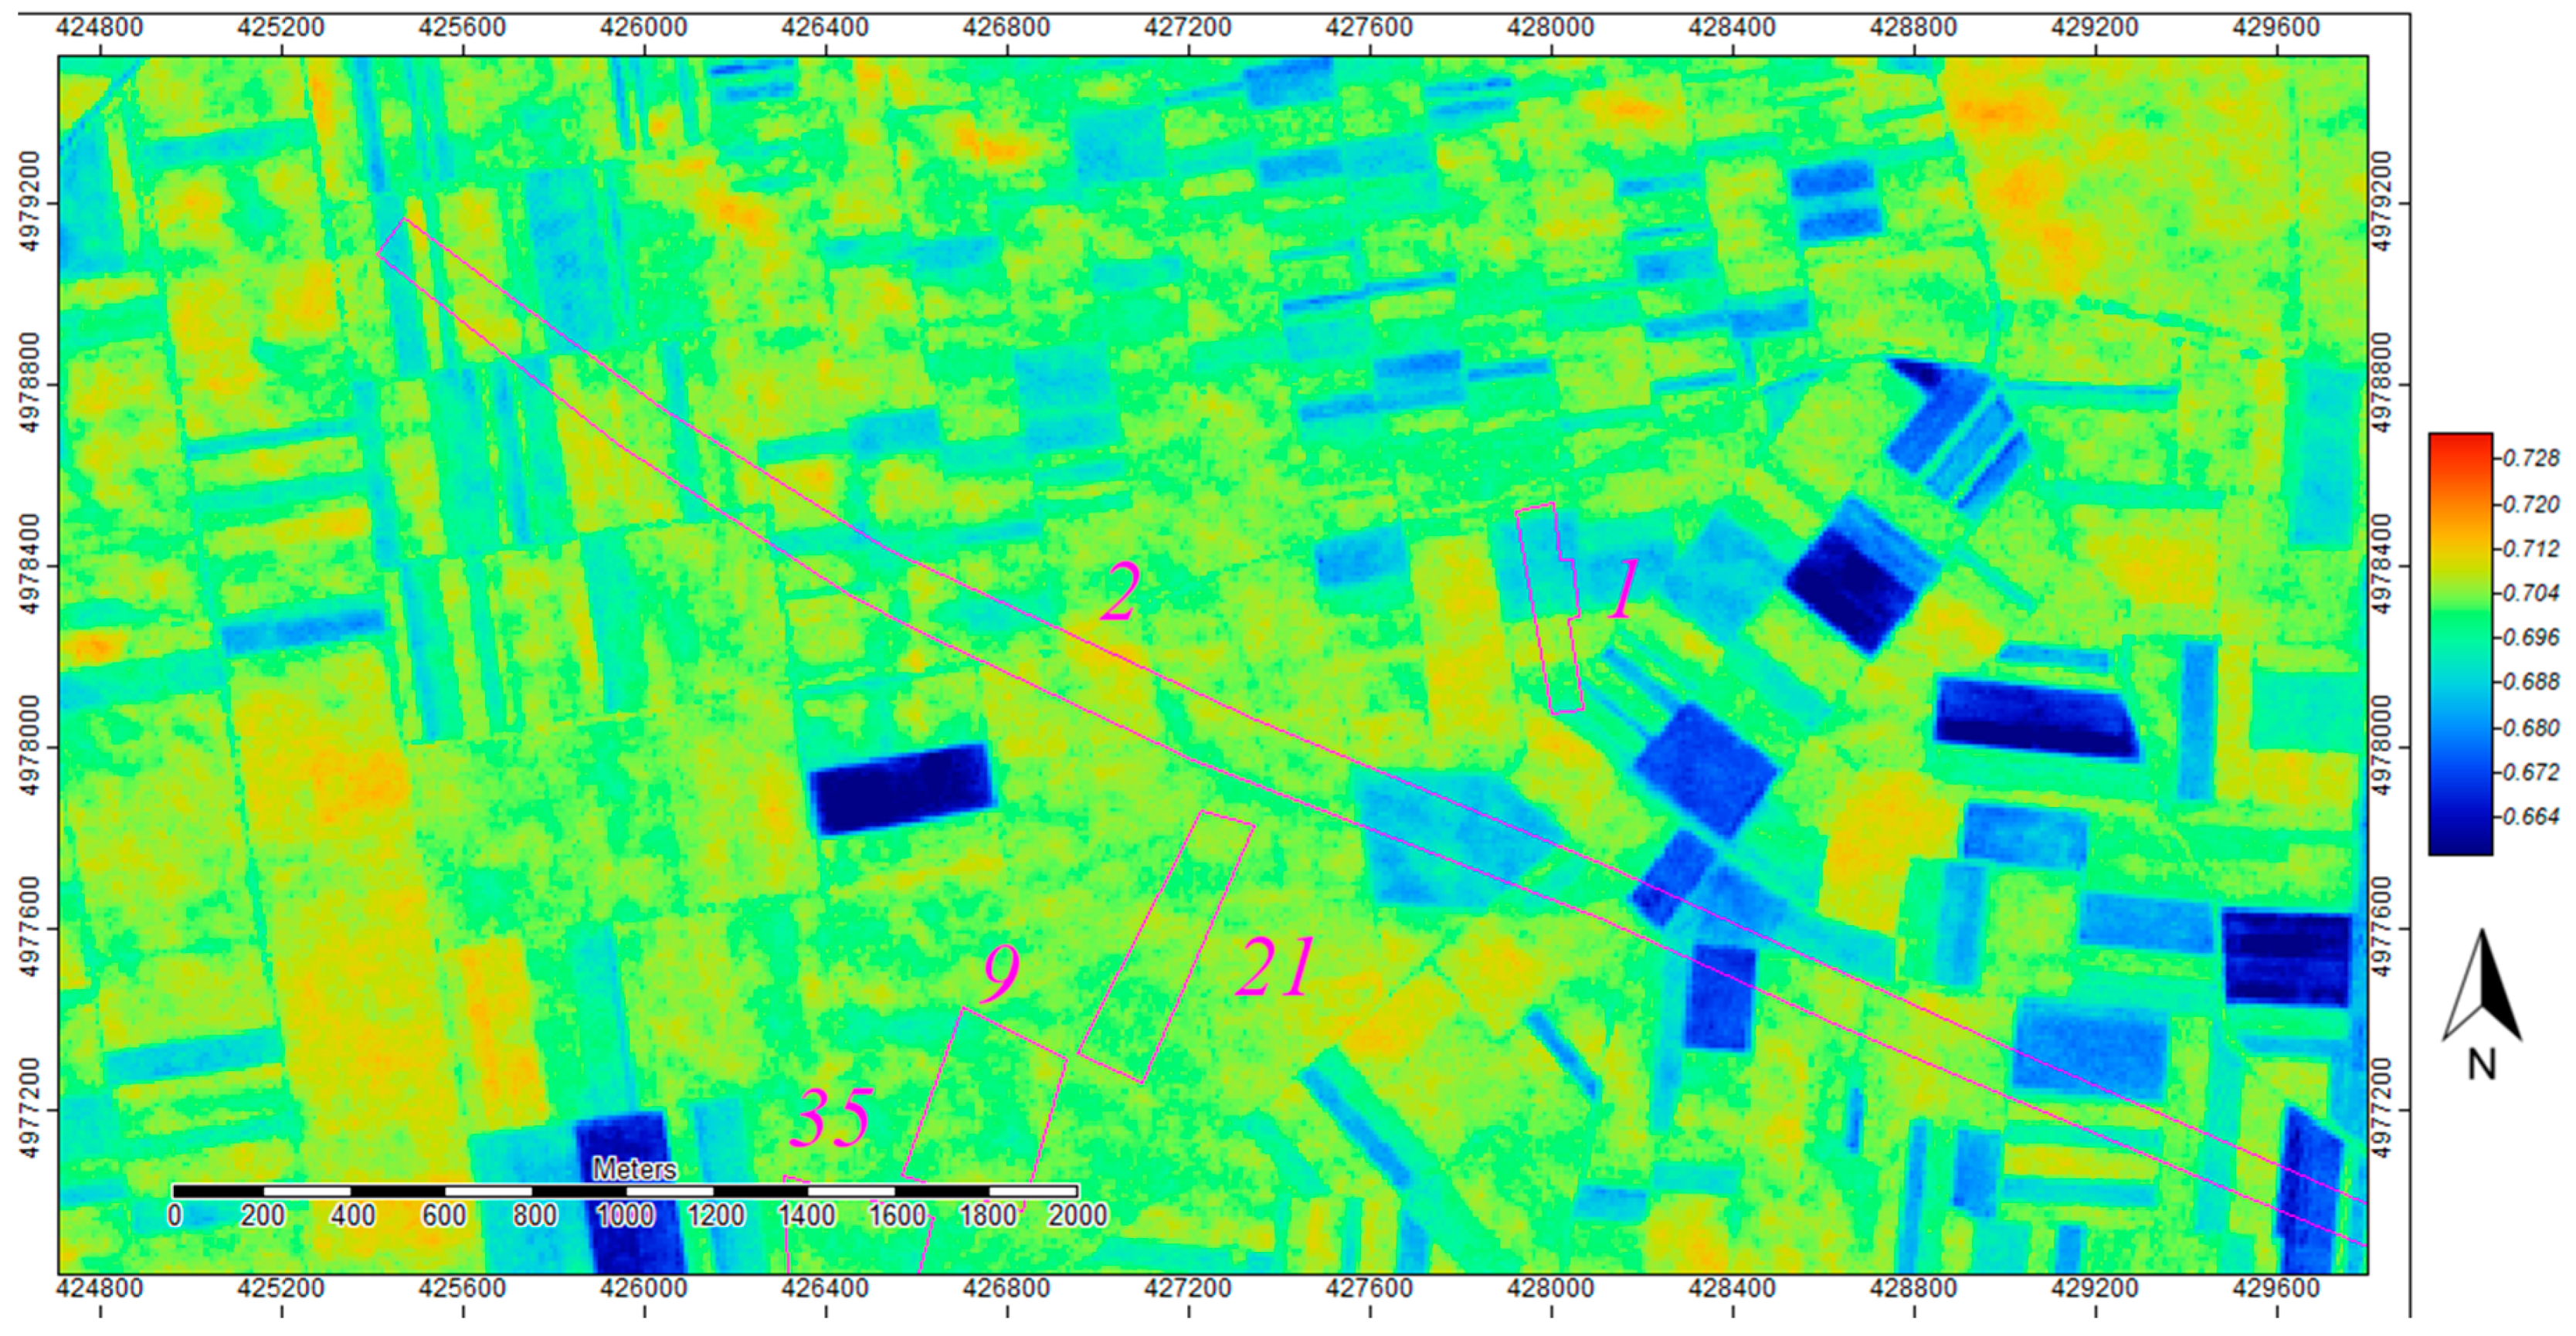
In Figure 2, we observe details of the NDVI index applied to the Sentinel-2 image, in the territory of Golubinci. The magenta polygons mark the location of the crop-marks that enabled the probable identification of the Roman road. The data show that even if some anomalies were visible, it was not possible to map the road through this image. This could be due to the spatial resolution of the original images: since the width of the Roman road has been measured between 10 and 15 m, it might be too small to be visible in an image in which pixel size is 10 m.
To take a step further and to get better results in the identification of crop-marks, we tried to apply different algorithms for processing the same image. The major issue in the use of the Sentinel-2 images to detect buried archaeological features was the spatial resolution of the bands in comparison with the dimensions of the features themselves. Agapiou et al. remarked that the most efficient reflectance region to detect archaeological crop-marks is included between 700 μm and 800 μm, and consequently elaborated the Normalized Archaeological Index to exploit the spectral characteristics of the Sentinel-2 imagers [32] (pp. 2183–2185). The algorithm thus elaborated applies the formula:
where 700 μm and 800 μm respectively stand for band 5 (VRE) and 7 (VRE). The NAI is a reformulation of the NDVI, based on the specific spectral characteristics of the Sentinel-2 bands in relationship with the optimum archaeological spectral region (700 μm and 800 μm), accordingly with the analysis of Agapiou et al. [32] (pp. 2183–2185). The application of this equation did not give meaningful results, probably due to the low spatial resolution of bands 5 and 7: the output was an image with 20 m pixel size.
NAI = (800 μm − 700 μm)/(800 μm + 700 μm),
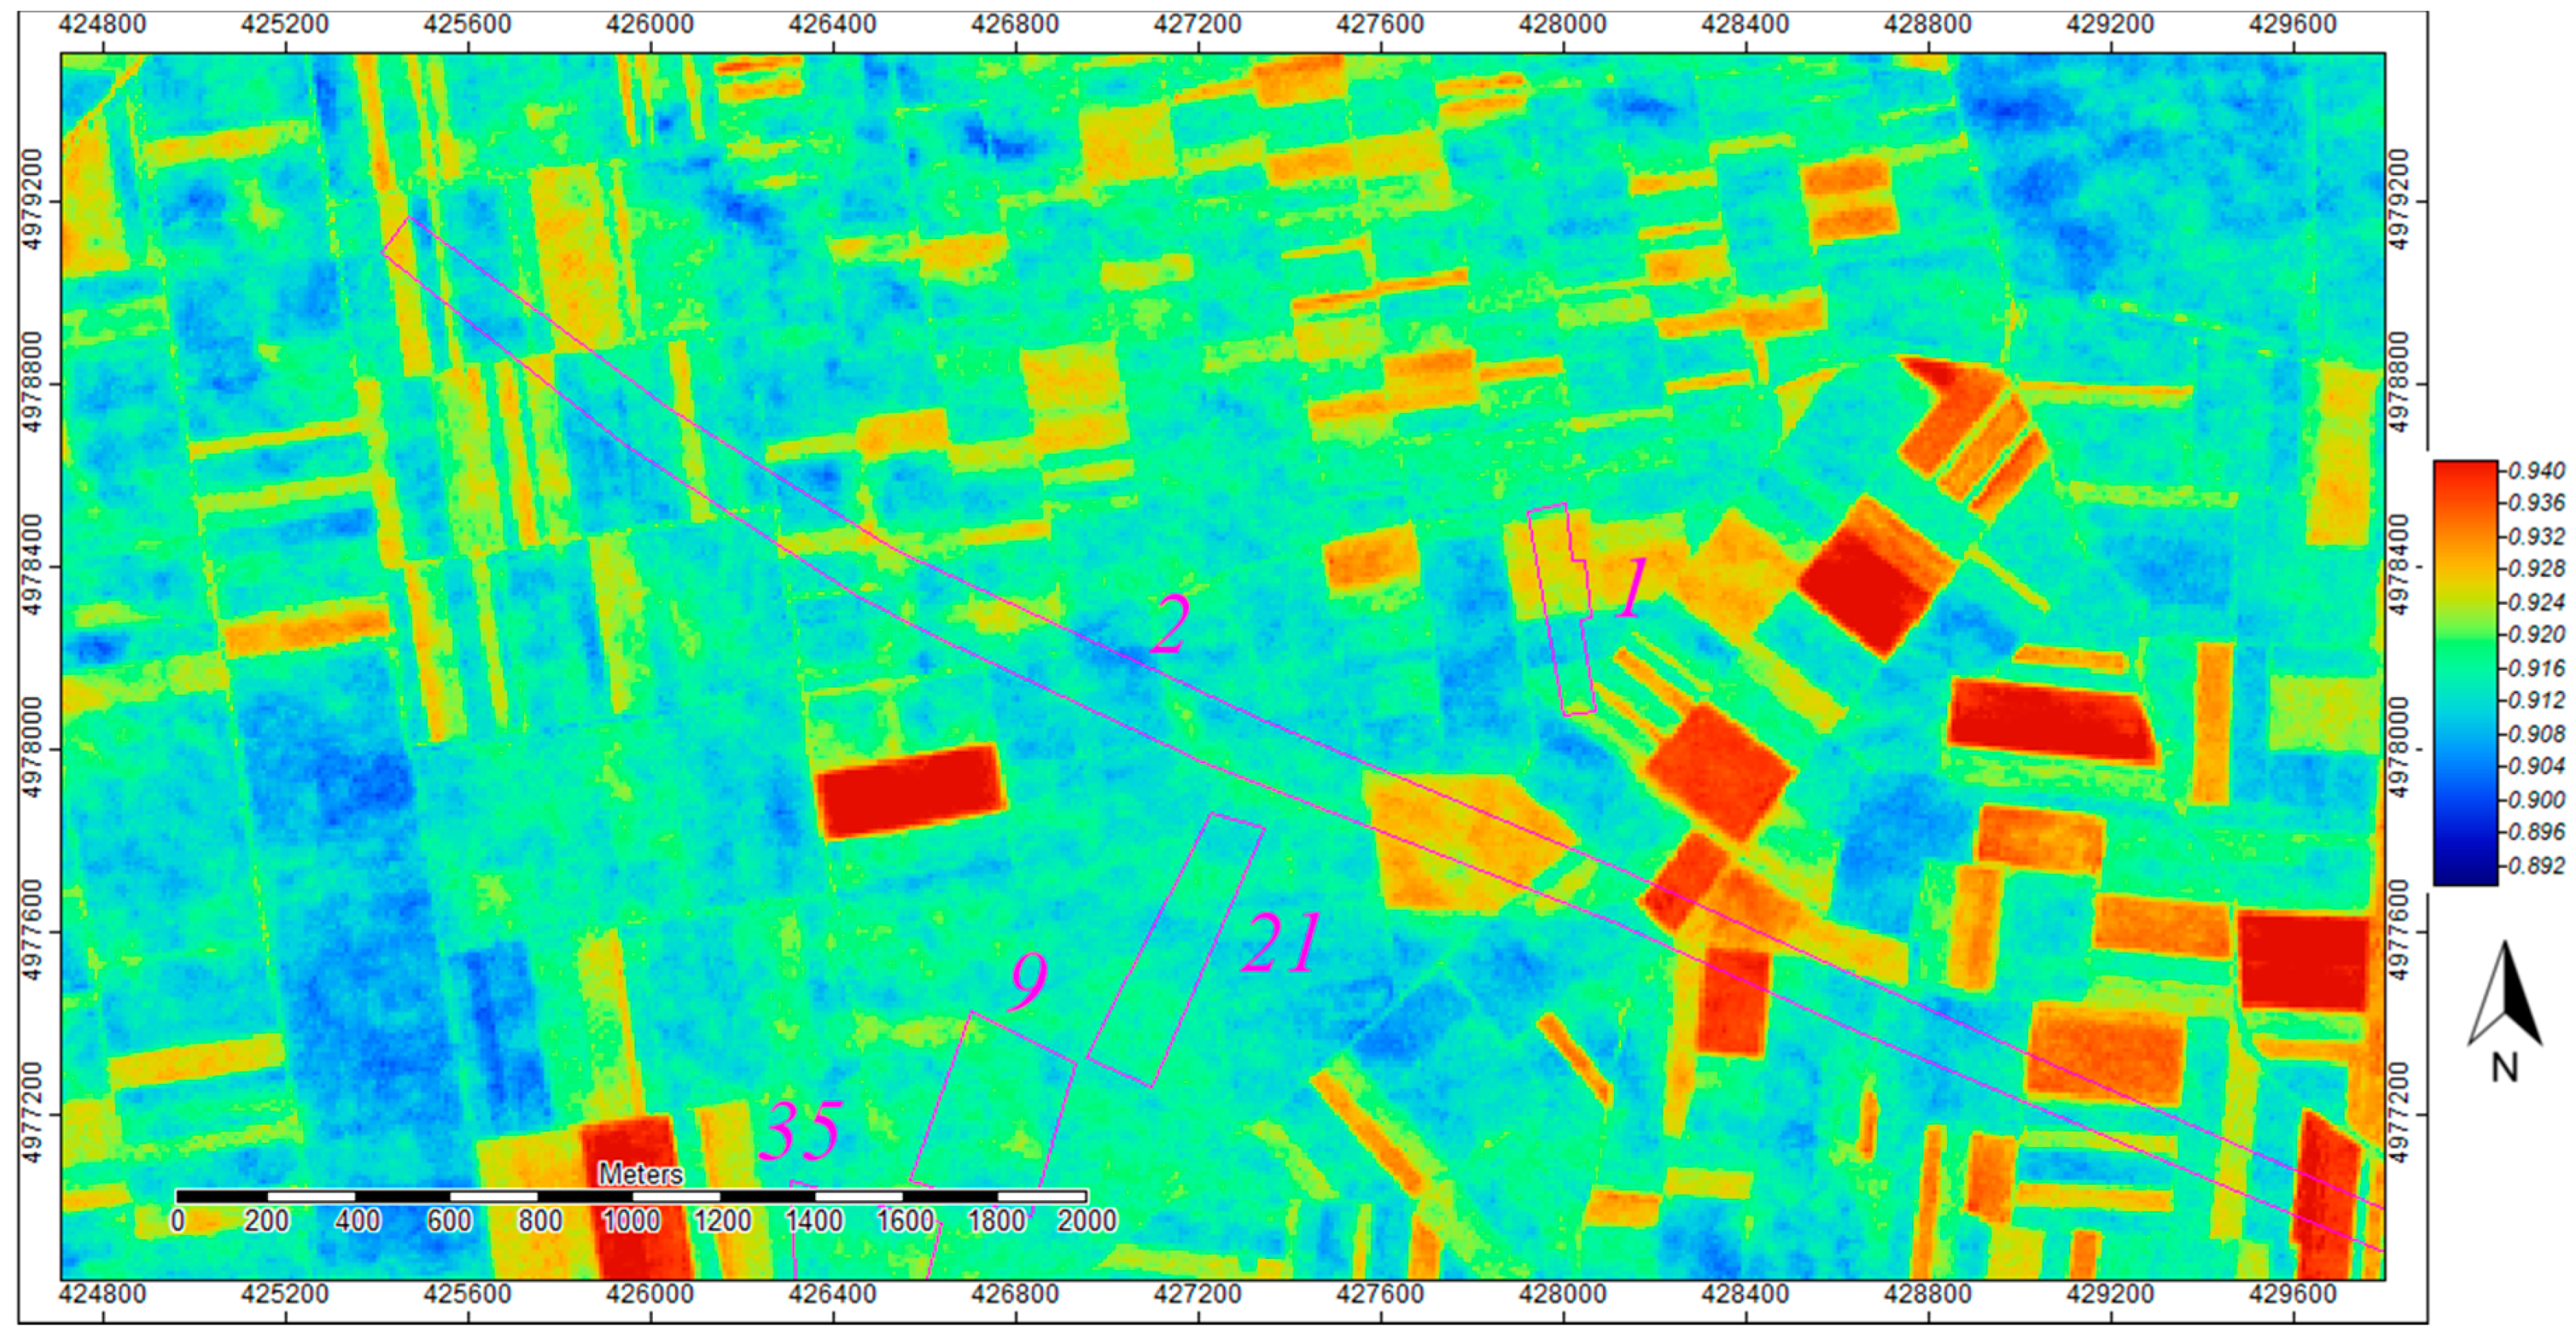
Trying to get most out of the data from the images, we tried a simpler combination of bands 4 (Red) and 8 (NIR), exploiting at once their spectral characteristics and their higher spatial resolution, obtaining a 10 m pixel size image after processing with the Semi-Automatic Classification Plugin [42] developed for QGIS [43]:
RN = Red + NIR.
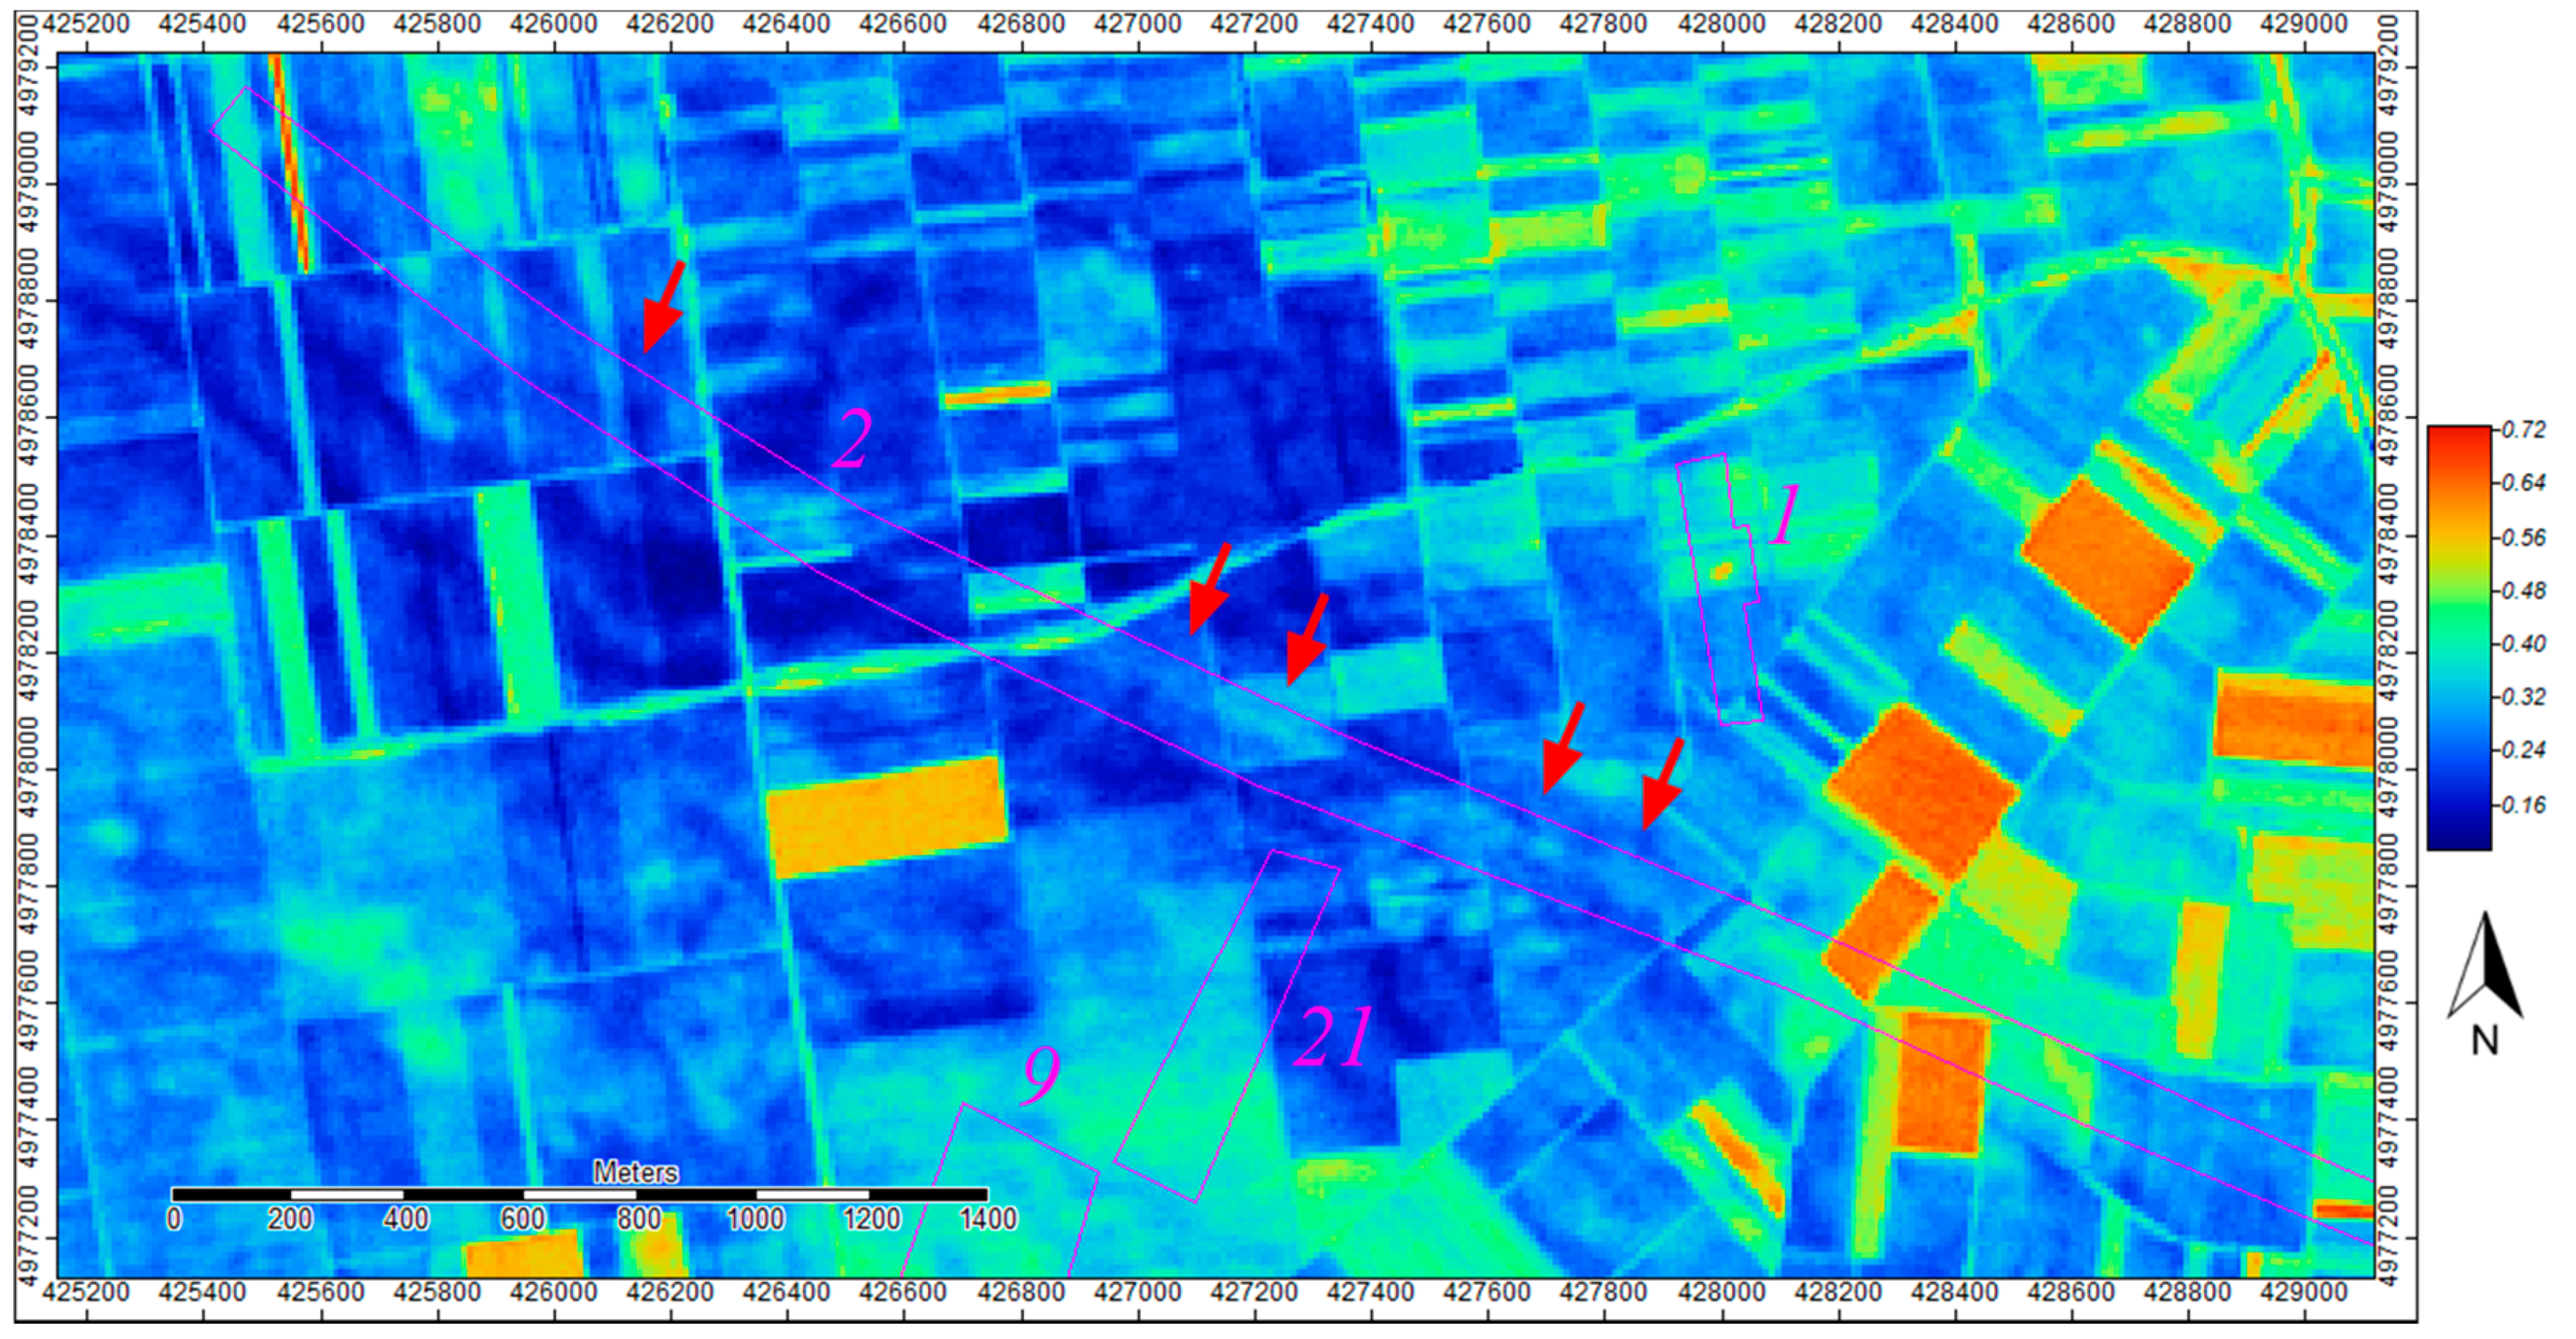
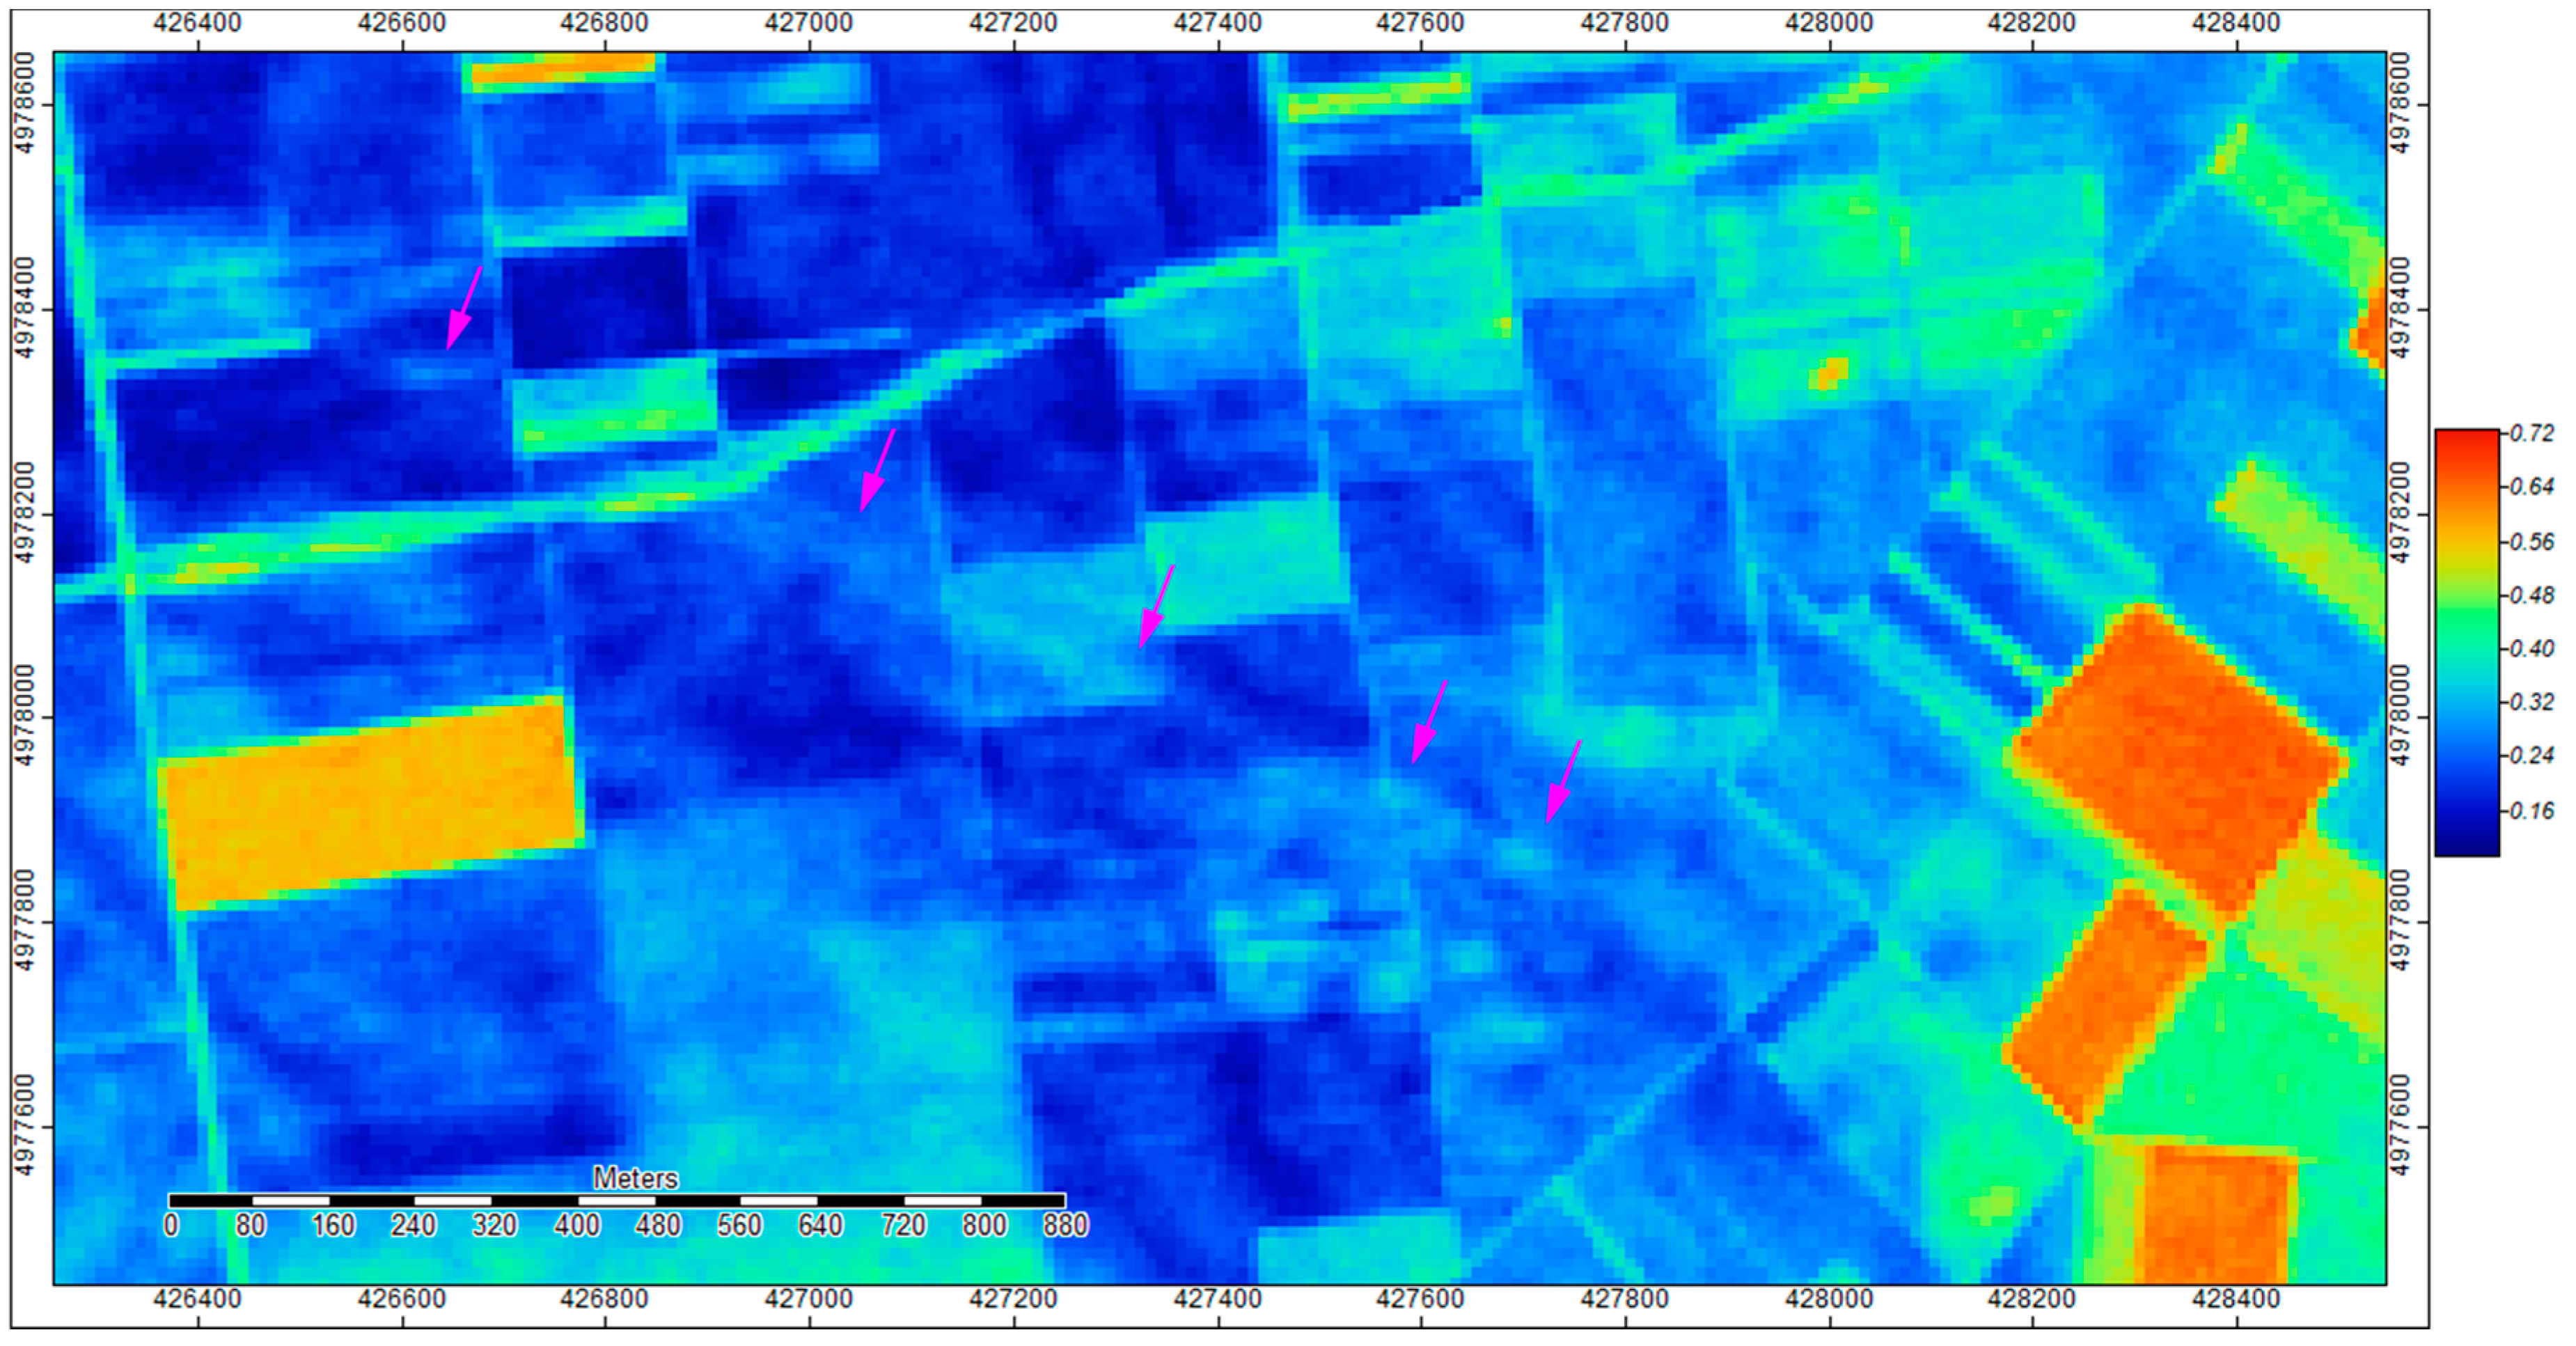
The combination of Red and NIR gave good results, as can be seen in Figure 3, where the crop-marks were better defined than in Figure 9. It was even possible to map additional crop-marks, not visible in the NDVI output. The magenta arrows mark the presence of a crop-mark indicating the presence of the Roman road (see a better detail in Figure 4). The visibility of the crop-marks did not depend only on the pixel size of the images, but varied based on the different processes of band manipulation, like in this case.
Finally, we attempted a test using orthogonal equations, developed from the Tasseled Cap transformation [44,45,46], and designed to detect the presence of archaeological remains [47]. The equations, among which the Crop Coefficient 3 (CC3) has a specific relevance, had already been tested on the images recorded by third party missions (Quickbird, IKONOS, Worldview-2, GeoEye-1, ASTER, Landsat 4TM, Landsat 5TM, and Landsat 7ETM), with good results in the archaeological field [45]. Nevertheless, the original formula [47] (pp. 6568,6569) needed adaptation to the new Sentinel-2 images to test its reliability with the new data:
CC3 = 0.19 × ρBand 1TM + 0.56 × ρBand 2TM − 0.81 × ρBand 3TM − 0.04 × ρBand 4TM.
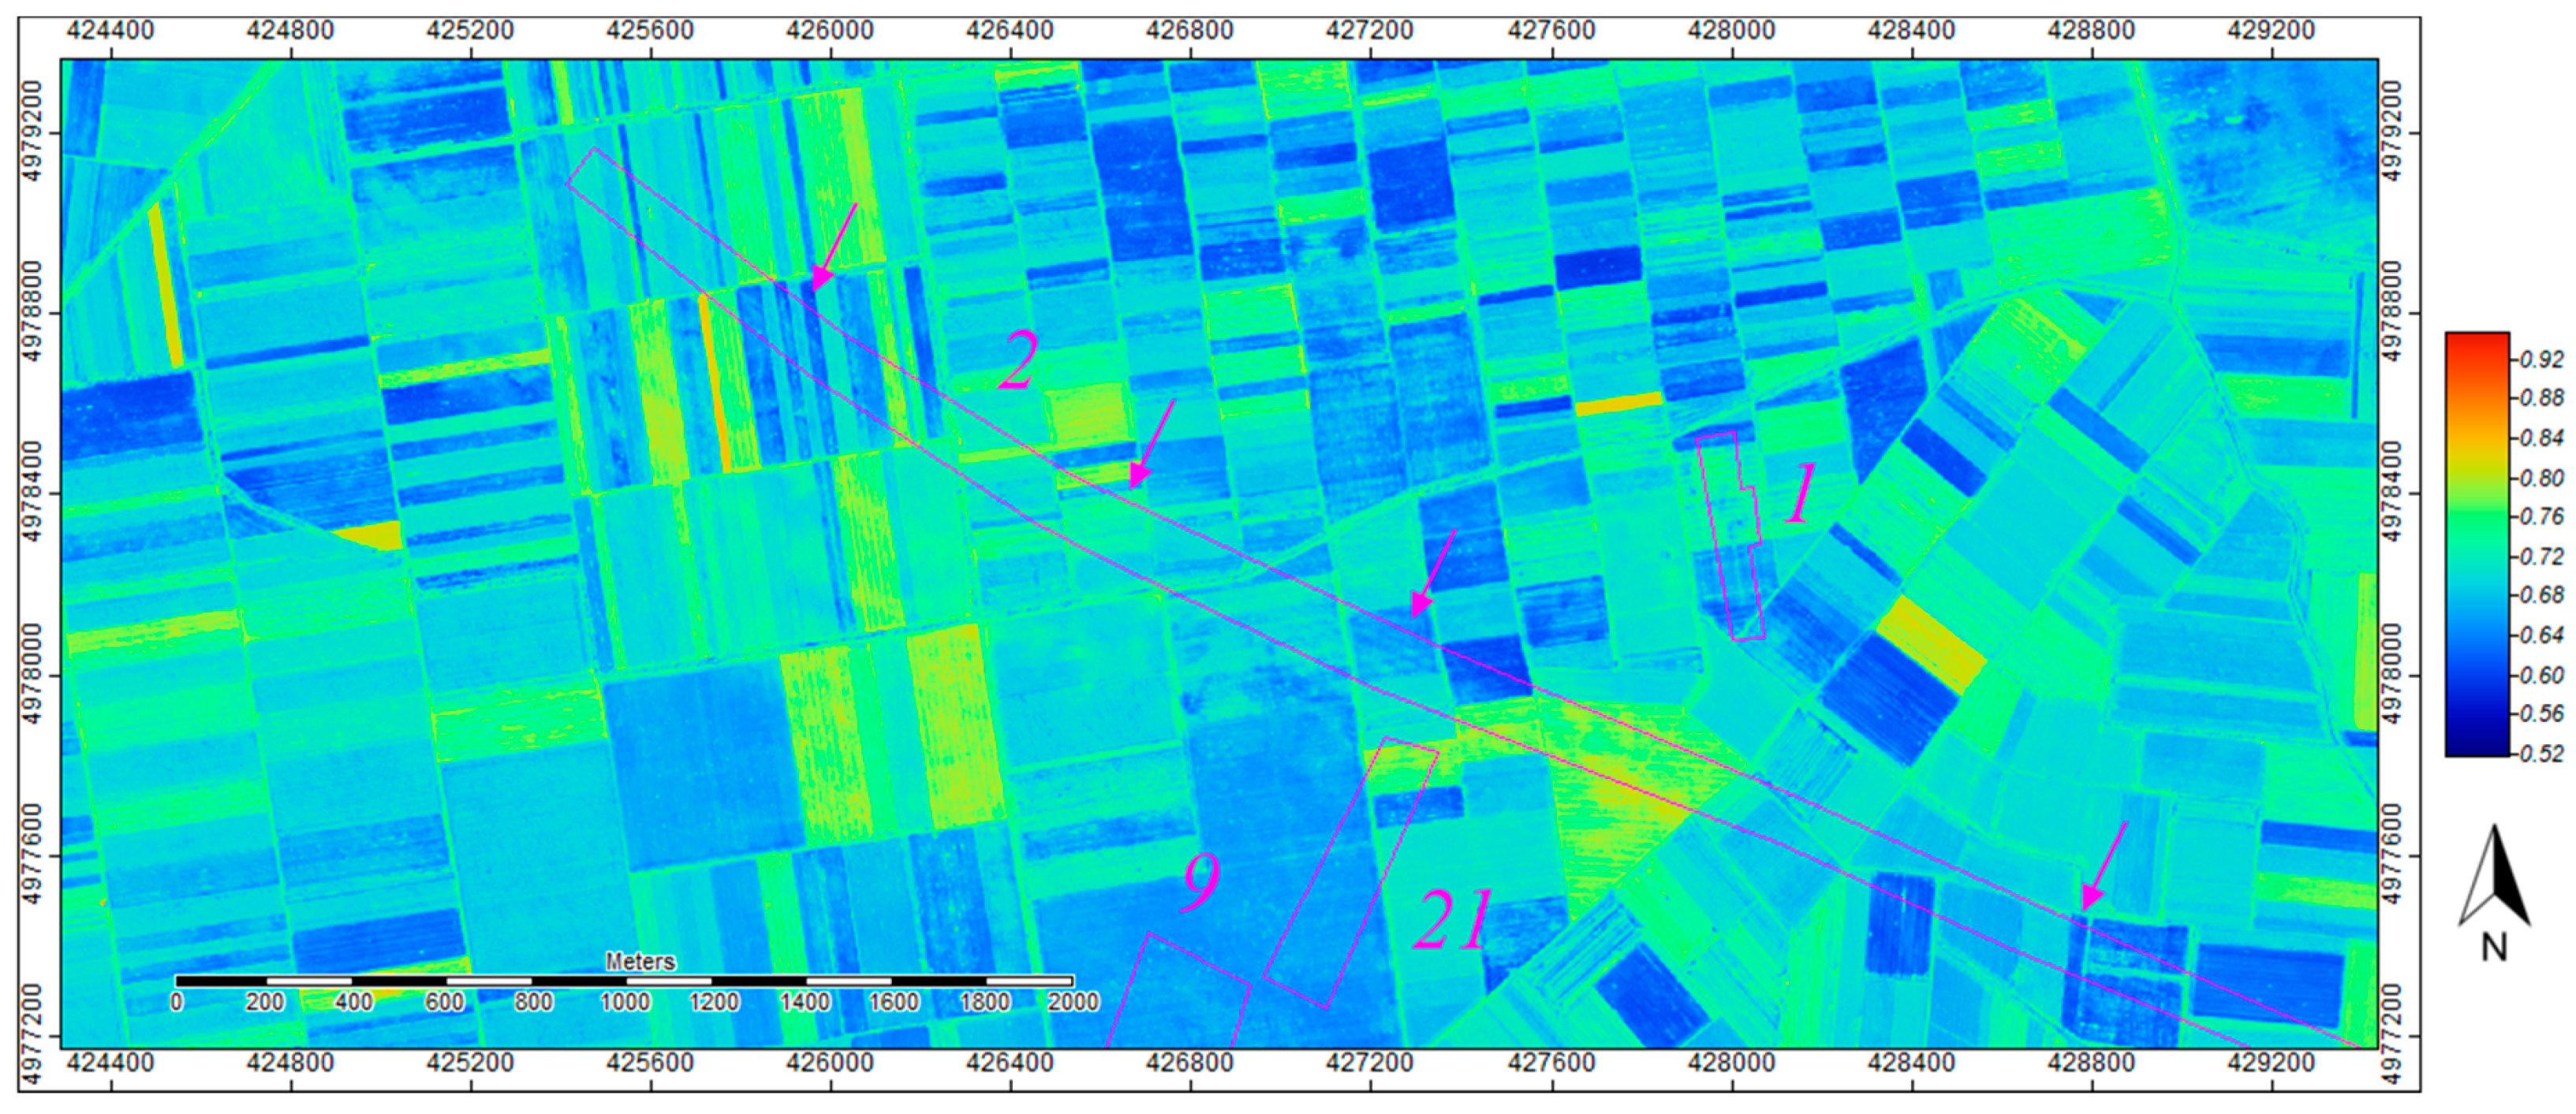
In Figure 5, we can observe the resulting image from the application of this formula. Indeed, it was impossible to distinguish any meaningful crop-marks. Subsequently, we tried to further improve the results by introducing a variant to the formula:
CC3_DR = (0.19 × ρBand 1TM + 0.56 × ρBand 2TM)/(− 0.81 × ρBand 3TM − 0.04 × ρBand 4TM).
The image resulting from the application of the Equation (5) is shown in Figure 6. The variant changed the ratio among the components of the algorithm’s structure, producing an output with a higher definition of the crop-marks and ground principal components. The CC3_DR algorithm, applied on images recorded by other sensors (GeoEye-1, Worldview-2, Quickbird) produced better outputs in the archaeological perspective, while the Sentinel-2 images showed once again their main limit: a lower spatial resolution that prevented the improvement of the results.
Once again, Figure 6 does not show any clear improvement in comparison to previous tests.
To conclude, the only algorithm that really enabled the identification of crop-marks generated by the presence of the Roman road was the combination of Red and NIR bands. Nevertheless, also in that case, the low spatial resolution of the Sentinel-2 images did not allow the detection of many anomalies that are clearly visible on other images, as we exemplify by comparing these results with the elaboration of a WorldView-2 image of the same area, but it was enough to map the Roman road.
2.1.2. Comparison with the Results Obtained with a WorldView-2 Image
Together, with the assessment of the efficacy of the Sentinel-2 images in the archaeological perspective, the research still needed to deal with mapping the traces and remains of the Roman road from Sirmium to Singidunum. Thanks to an agreement with ESA for the acquisition of a WorldView-2 multi-spectral image, it was possible to map the path of the road to the East of Bassianae, where its layout was completely under the question.
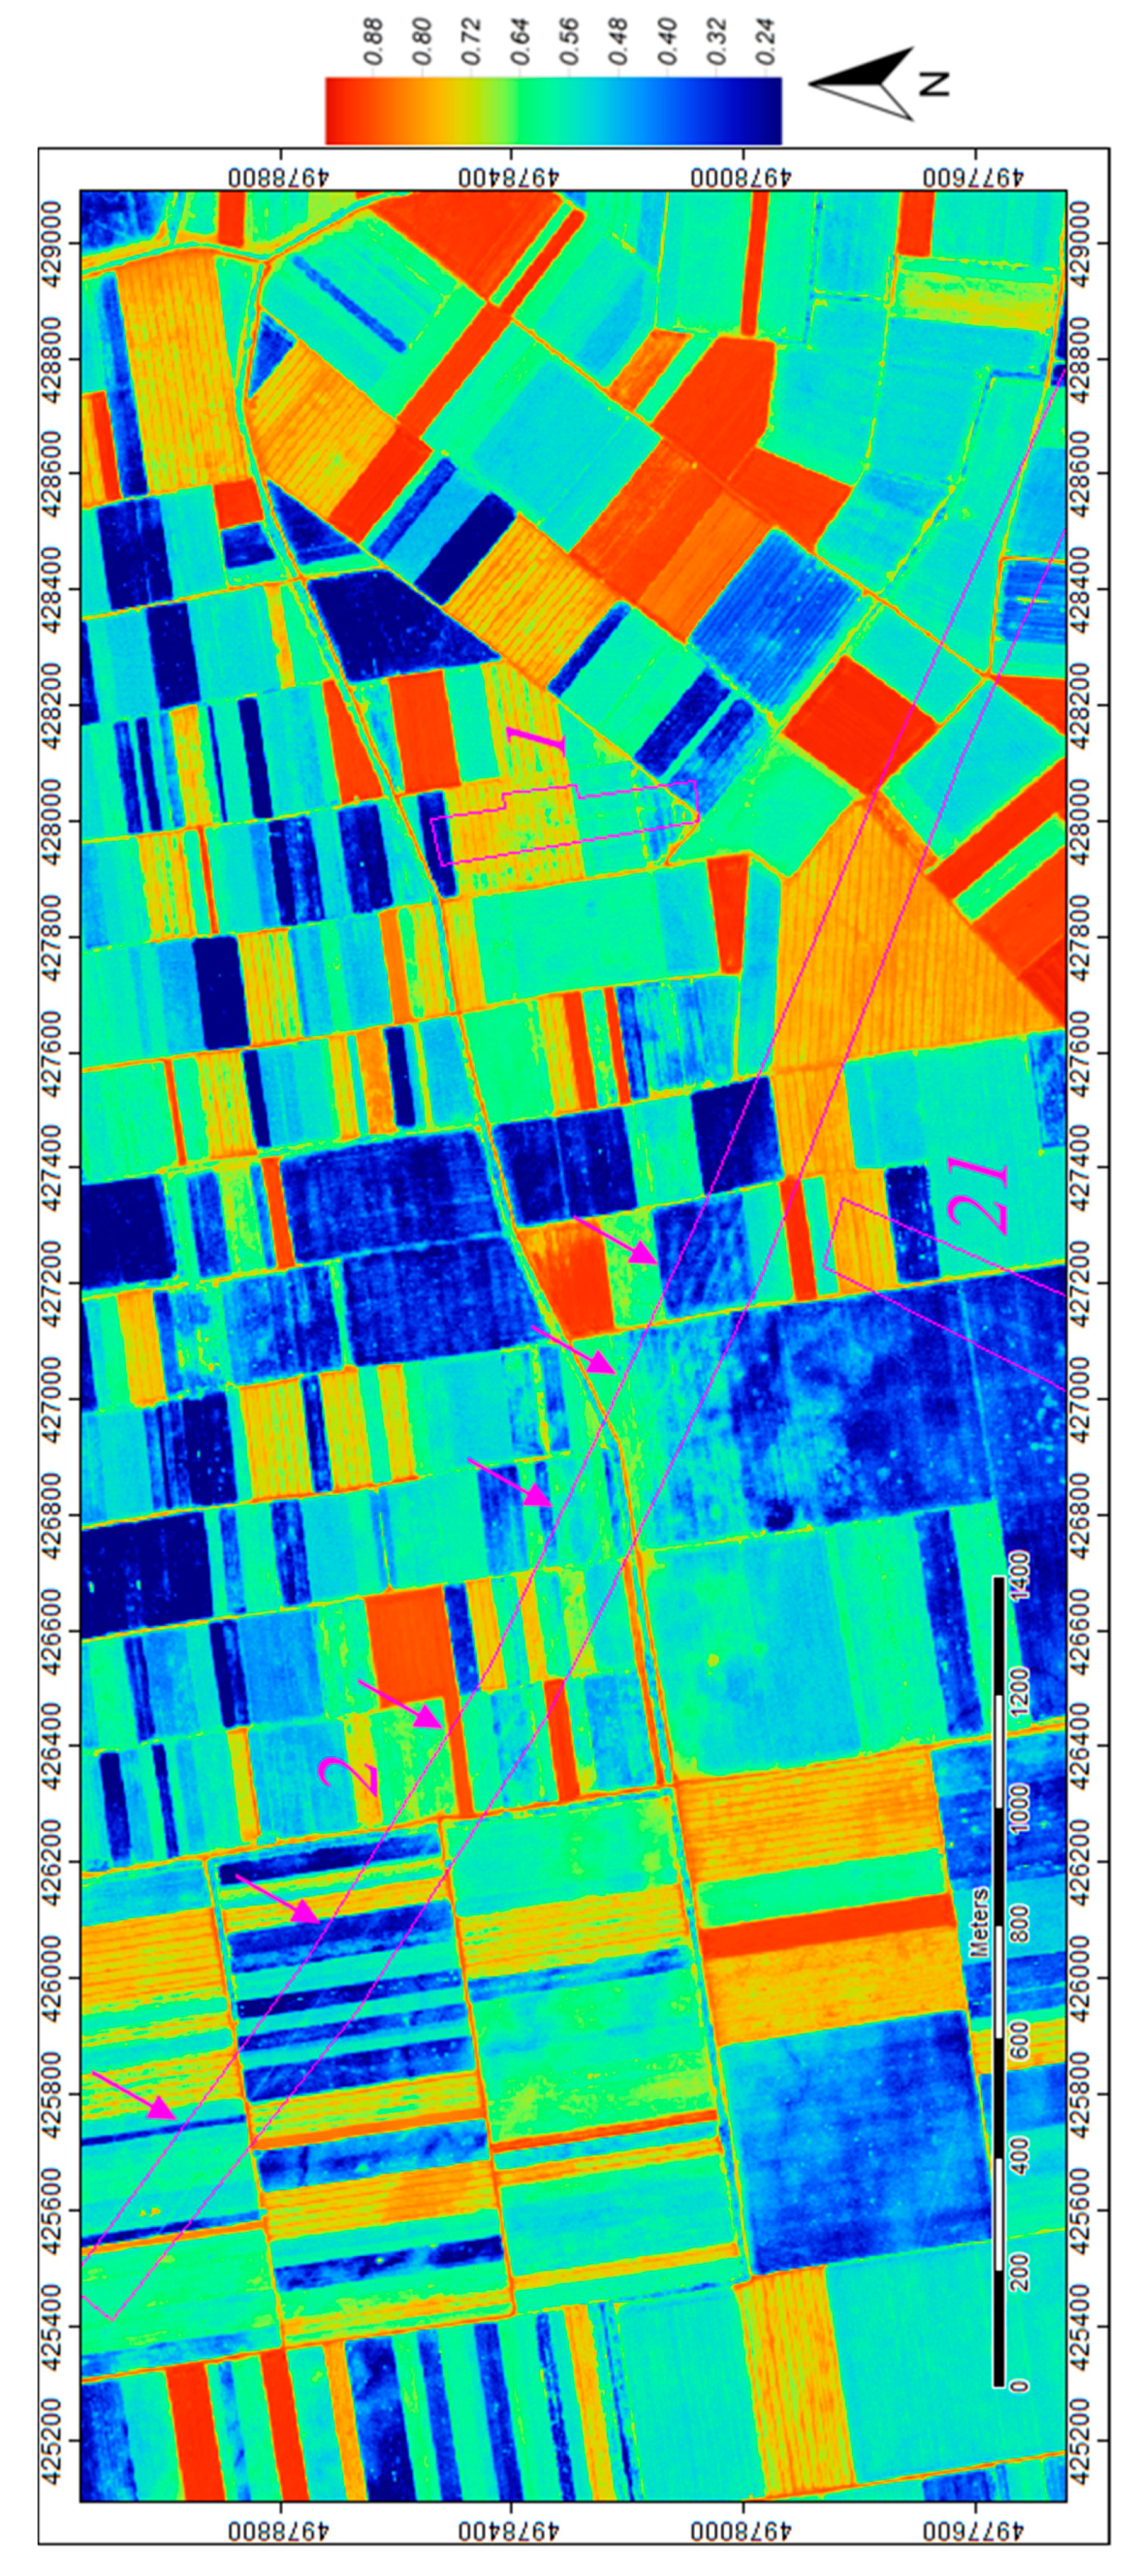
The 15JUL23095803-P3DS-056453190020_01_P001 WorldView-2 image was recorded on 15 July 2016 (for its spectral and spatial characteristics, see: Table 2), and it was processed using both the CC3 (Figure 7) and the CC3_DR (Figure 8) algorithms. It can be argued from the comparison of the two images, that the advantage of the CC3_DR algorithm consists in generating a much better detailed output. Thanks to the latter, it was possible to determine the direction and path of the Roman road between Bassianae and Singidunum.
3. Results
Thanks to the specific distribution of modern settlements in the area of interest, the Srem district revealed to be particularly favorable for the application of satellite remote sensing to detect Roman roads and buried archaeological remains.
The combined analysis of Sentinel-2 and commercial missions images led to the identification of 60 crop-marks, hypothetically due to buried archaeological features in the portion of territory stretching from Sremska Mitrovica to Zemun (Figure 1). Figure 9 shows that some of these anomalies were linear, possibly connected to the Roman road or to other historical branches of the road network, while others were polygonal. It was necessary, once we established this fact, to verify the reliability of these data and to assign a more precise chronology to the remains that originated the crop-marks. To this end, an archaeological surface survey campaign was organized in collaboration with the Institute for the Protection of the Cultural Monuments of Sremska Mitrovica.
The survey was planned after combining the information derived from previous research, stored in the Institute’s archive, with the results from remote sensing analysis. A procedure integrating mobile mapping technologies was established in order to optimize the available resources in terms of funding and time.
During the field research, it was possible to map several archaeological sites dating to different chronological periods, falling within the area of interest, in addition to the Roman road from Sirmium to Singidunum. More precisely, 13 crop-marks correspond to already known archaeological sites and stretches of the Roman road, whereas, 47 crop-marks remain unmatched. Some of them, of course, can be due to the presence of artifacts of geo-pedological or artificial nature. On the other hand, 36 files from the Institute’s archive did not correspond to any anomaly. This is probably due to the small dimensions of the sites and their inconsistency in terms of visibility (e.g., isolated graves, hearth remains, …). Nevertheless, integrating the results coming from the remote sensing analysis with the archive information, allowed the researchers to focus on the areas where it was most probable to identify archaeological, and particularly Roman sites, evidence of the Roman road and sites connected with the road itself.
4. Discussion
The District of Srem is well known from an archaeological point of view, also due to the relevance held by the city of Sirmium during Roman times. Several field research projects have been developed before the beginning of the RecRoad project in 2016, and they generated general knowledge of the layout of the main Roman road from Sirmium to Singidunum, passing through the city of Bassianae [19,20,21,22,23,24]. Nevertheless, some relevant questions remained unanswered: indeed, the Roman road path was documented only in five points and there was no certainty about its precise layout. This was an issue especially for the protection of the archaeological remains.
Satellite remote sensing techniques, applied to Sentinel-2 images and to other kinds of images (WorldView-2, OrbView, QuickBird), enabled mapping of 70 km of the Roman road and the development of an integrated survey methodology. It is desirable to include in further research new kinds of multi-spectral images with higher pixel resolution, such as PlanetScope images. Thanks to the integration of remote sensing data and mobile mapping technologies, the researchers were able to verify the layout of the Roman road and to identify buried archaeological sites along its 70 km path in only six days of effective field work. Furthermore, the survey enabled the collection of archaeological materials that are proving to be very useful for the interpretation of crop-marks. An important issue regarding archaeological remote sensing must be noted: where remote sensing techniques can prove their usefulness for archaeological research, they cannot provide any information about the chronology, cultural pertinence, and function of the buried archaeological remains. Only the direct prospect of the sites, analysis of pottery fragments, and other archaeological materials can lead to an interpretation of the remains.
Concerning the efficacy of Sentinel-2 images for archaeological research, especially in the research of Roman roads, as it has been shown in this paper, the spatial resolution of the images is a major limitation. This is due to the average width of the Roman road in this area, since it is comprehended between 9 and 15 m [29]. Nevertheless, Sentinel-2 images have proven to be very useful in the detection of different kinds of archaeological remains in the same area, enabling the identification of previously undocumented archaeological sites [48,49]. The recent introduction of the Sentinel-2 images, has led to the testing of several algorithms to process them. The ones that gave the best results were the combination of Red and NIR bands and the CC3_DR Equation (4). The combination of Red and NIR bands enabled a better exploitation of both the spectral characteristics and the spatial resolution of this kind of images, enhancing their capabilities of showing crop-marks and allowed the mapping of the remains of the Roman road.
On the other hand, in comparison with the CC3 formula, in the CC3_DR formula, the contribution of the NIR band results were almost irrelevant, since it was weighted on a minor coefficient than the others. Thus, we obtained the weighted sum of 1TM and 2TM bands, normalized by the 3TM band. This practically eliminated the effect of band 3TM in the image. These elements increased the capabilities of showing the presence of buried archaeological features. Furthermore, the introduction of the ratio strengthened the formula at the variation of the coefficients. Nevertheless, it is true to be said that the potentialities of the CC3_DR formula have given better results when applied to higher resolution images (Figure 8).
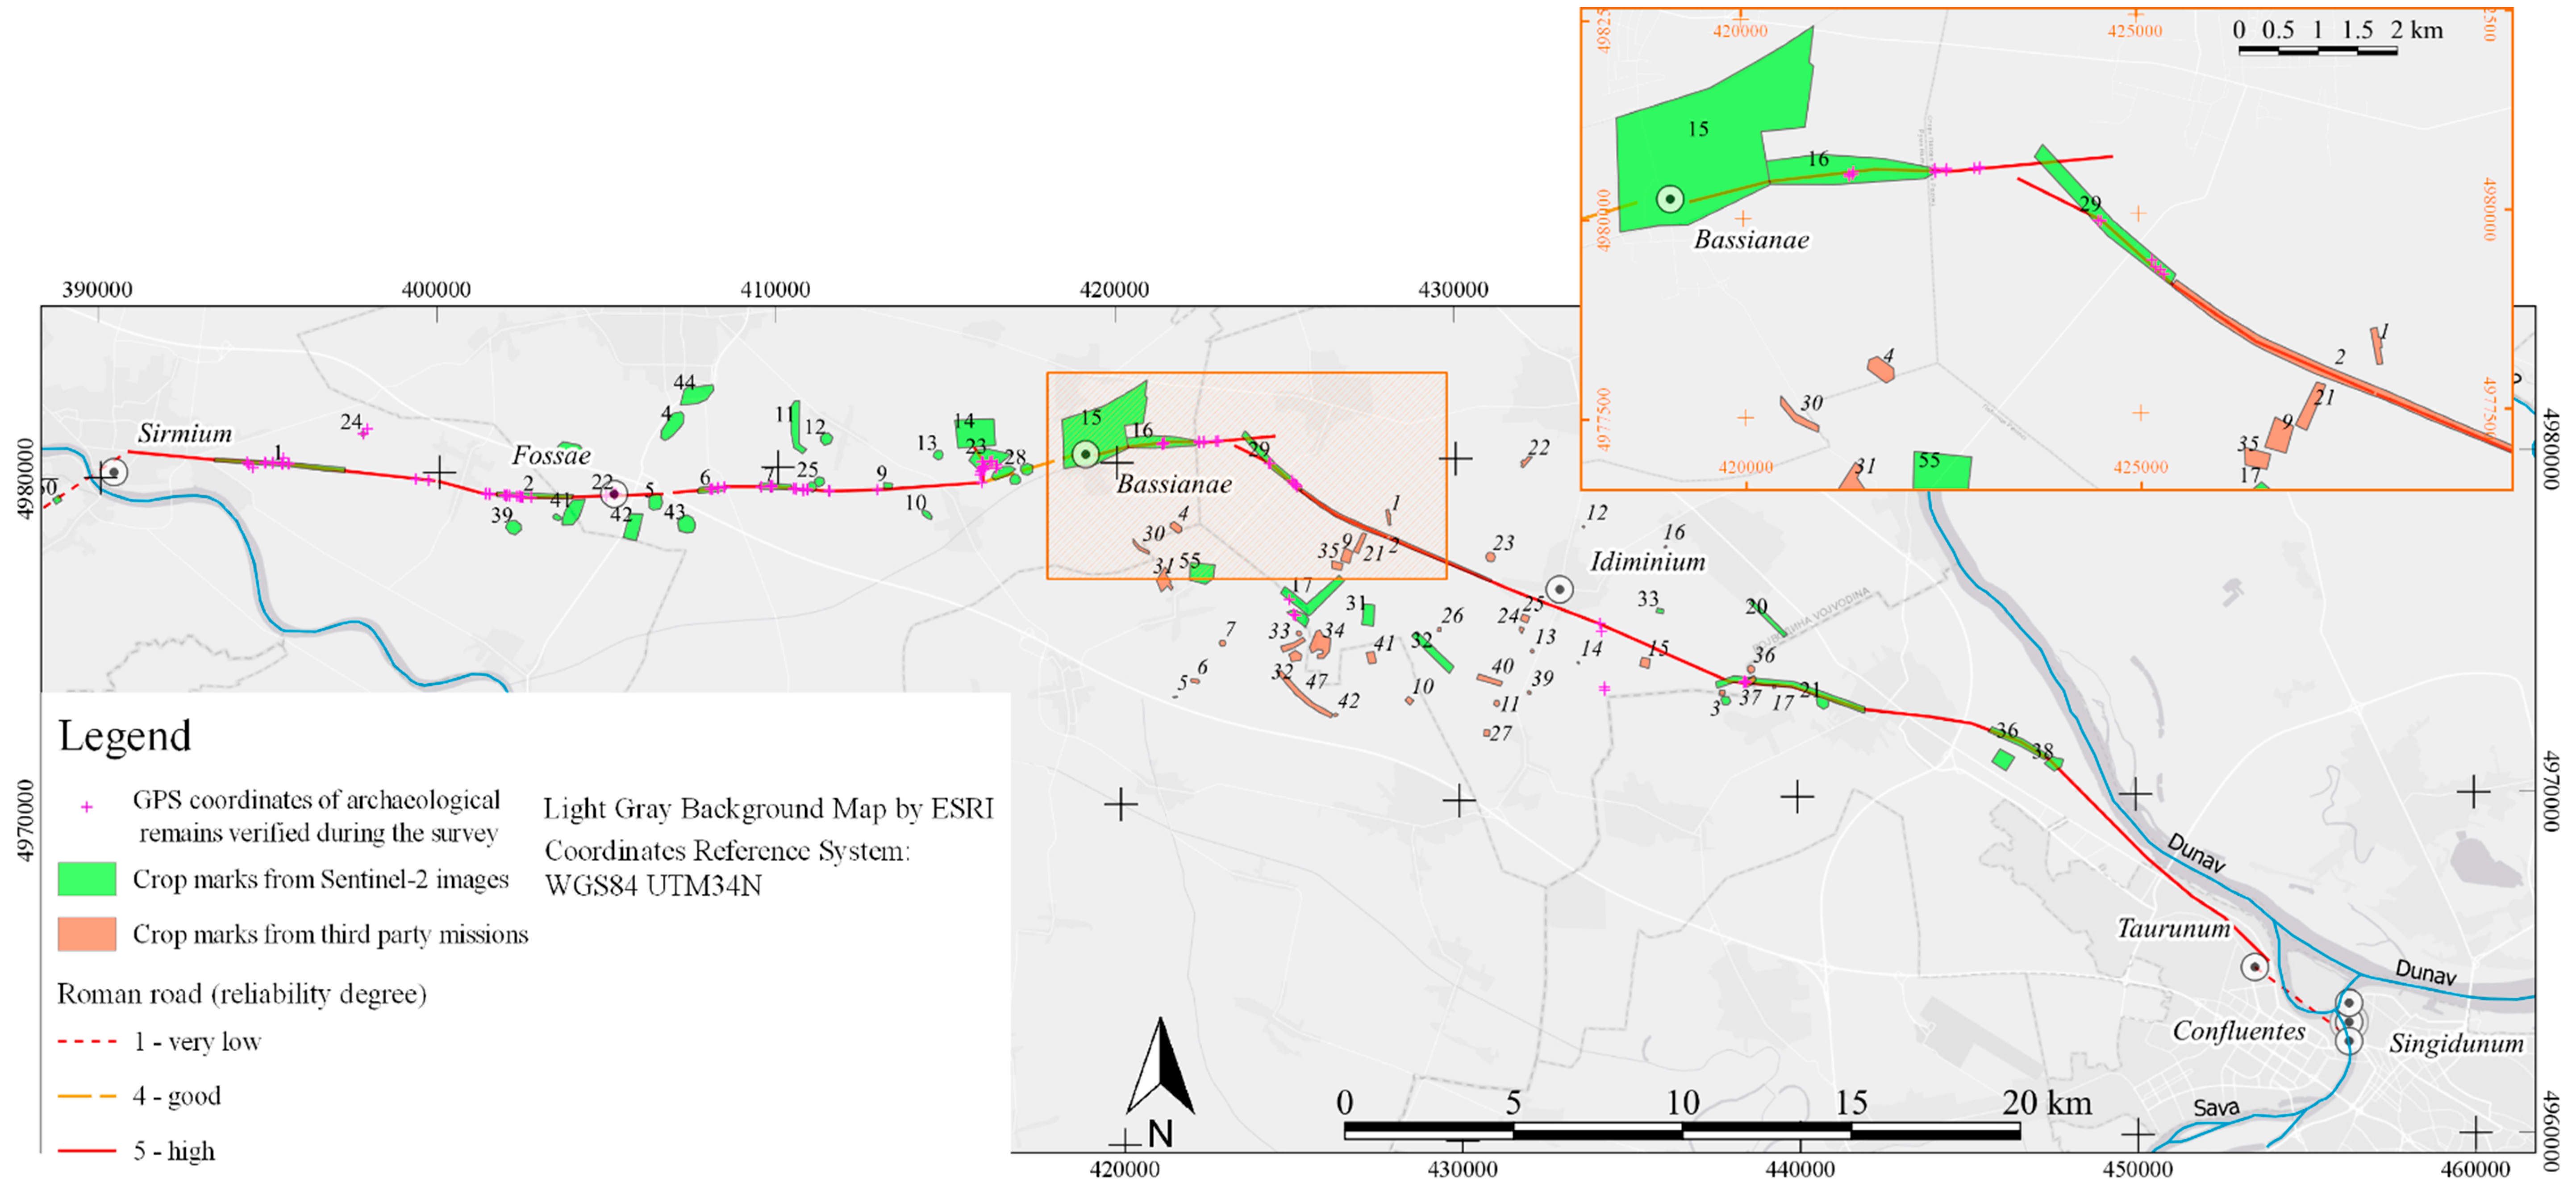
To conclude, the integration of data coming from the systematic archaeological survey and research in the Srem District [50] was an opportunity to test the capabilities of Sentinel-2 images in this field. The combined methodology also improved the positioning of the segments of the main Roman route that connected Sirmium with Bassianae and Singidunum, and gave hints for future exploration of the Roman road network in the area. It would be especially interesting to investigate the connection of the main road from Bassianae to Singidunum with the limes road that functioned as main communication tool among the military camps and forts along the Danube border. The first segment of this connection was already documented during the survey, shown in Figure 9, but the remaining part requires mapping.
The data obtained through the analysis of multi-spectral images were also important for identifying broader archaeological site areas, proving that the combination of field survey and remote sensing analysis often gives a limited understanding in the case of poorly known sites. New perspectives of research could be imagined integrating the analysis of more high-resolution multi-spectral images, recorded by satellite imagers or by drones equipped with multi-spectral cameras, improving also the data detail.
Author Contributions
Conceptualization, methodology, software, and validation, S.Z. and A.D.R.; writing—original draft preparation, S.Z.; writing—review and editing, A.D.R.; supervision and project administration, S.Z.; funding acquisition, S.Z.
Funding
This work received funding from the European Union’s Horizon 2020 research and innovation programme under the Marie Skłodowska-Curie grant agreement No 660763. Also with the support of the Marie Curie Alumni Association.
Acknowledgments
The authors acknowledge Biljana Lučić and the Institute for the Protection of the Cultural Monuments of Sremska Mitrovica, for the archive data and archaeological material analysis; the European Space Agency for providing WorldView-2 images; and Antonio Augimeri for the discussing the images processing methodology.
Conflicts of Interest
The authors declare no conflicts of interest. The funders had no role in: the design of the study; in the collection, analyses, or interpretation of data; in the writing of the manuscript, or in the decision to publish the results.
References
- Cuntz, O. Itineraria Romana, 1990th ed.; Vieweg+Teubner Verlag: Wiesbaden, Germany, 1929; Volume 1. [Google Scholar]
- Arnaud, P. L’Itinéraire d’Antonin: Un témoin de la littérature itinéraire du Bas Empire. Geogr. Antiq. 1993, 2, 33–50. [Google Scholar]
- Calzolari, M. Introduzione allo Studio Della Rete Stradale dell’Italia Romana: l’Itinerarium Antonini; Atti della Accademia Nazionale dei Lincei: Roma, Italy, 1996; Volume 7.4. [Google Scholar]
- Douglass, L. A new look at the Itinerarium Burdigalense. J. Early Christ. Stud. 1996, 4, 313–333. [Google Scholar] [CrossRef]
- Calzolari, M. Ricerche sugli Itinerari Romani. L’Itinerarium Burdigalense. Studi onore Nereo Alfieri. Atti dell’Accademia Scienze Ferrara 1997, 74, 125–189. [Google Scholar]
- Miller, K. Die Weltkarte des Castorius genannt die Peutingerische Tafel; Nabu Press: Charleston, SC, USA, 1887. [Google Scholar]
- Cuntz, O. Die Grundlagen der Tabula Peutingeriana. Hermes 1895, 29, 586–594. [Google Scholar]
- Miller, K. Itineraria Romana; HATHI TRUST Digital Library: Stuttgart, Germany, 1916. [Google Scholar]
- Weber, E. Tabula Peutingeriana (Faksimileausgabe); Akademische Druck- und Verlagsanstalt: Graz, Austria, 1976. [Google Scholar]
- Pontrera, F. (Ed.) Tabula Peutingeriana: Le Antiche vie del Mondo; Olschki: Firenze, Italy, 2003. [Google Scholar]
- Talbert, R. Rome’s World: The Peutinger Map Reconsidered; Cambridge University Press: Cambridge, UK, 2010. [Google Scholar]
- De Sanctis, G. Storia dei Romani; Milano Bocca: Torino, Italy, 1923; Volume IV.1. [Google Scholar]
- Pavan, M. Aquileia città di frontiera. Antich. Altoadriatiche 1987, 29, 17–55. [Google Scholar]
- Mihailović, B.; Cvijanović, D.; Milojević, I.; Filipović, M. The role of irrigation in development of agriculture in Srem district. Econ. Agric. 2014, 61, 989–1004. [Google Scholar] [CrossRef] [Green Version]
- Zaccaria, C. Il ruolo di Aquileia e dell’Istria nel processo di romanizzazione della Pannonia. In Proceedings of the Atti del Convegno La Pannonia e l’Impero Rom, Roma, Italy, 13–16 January 1994; pp. 51–70. [Google Scholar]
- Cencig, D. Elementi Topografici Notevoli sulle vie di Accesso di Aquileia Romana e Sull’antica Viabilità sud Orientale del Friuli Venezia Giulia; Archeomedia-Rivista di Archeologia Online a cura di Mediares: Torino, Italy, 2018. [Google Scholar]
- Burghardt, A.F. The origin of the road and city network of Roman Pannonia. J. Hist. Geogr. 1979, 5, 1–20. [Google Scholar] [CrossRef]
- Zanni, S. La route d’Aquileia à Singidunum: Aspects méthodologiques. Du terrain à la publication et à la mise en valeur. In Proceedings of the Table Ronde Internationale La Route Antique et Médiévale: Nouvelles Approche, Nouveaux Outils, Bordeaux, France, 15 November 2016; pp. 145–164. [Google Scholar]
- Dimitrijević, D. Nekoliko podataka o rimskom limesu u istočnom Sremu. In Limes u Jugoslaviji; Arheolosko drustvo Jugoslavije Beograd: Belgrade, Serbia, 1961; Volume I. [Google Scholar]
- Dimitrijević, D. Vojka–Ugrinovci, Stara Pazova–Zemun, lok. Brestove Međe. Arheol. Pregl. 1966, 8, 124–127. [Google Scholar]
- Dimitrijević, D. Istraživanja rimskog limesa u isstočnom Sremu s posebnim osvrtom na pitanje komunikacija. Osiječki Zb. 1969, 12, 87–112. [Google Scholar]
- Popović, D. Glavna antička komunikacija u Sremu u svetlu arheoloških istraživanja, Putevi i komunikacije u antici. Materijali 1980, XVII, 101–108. [Google Scholar]
- Popović, D.; Vasiljević, M. Rekognosciranje I sondiranje rimskog puta Sirmium-Bassianae. Arheol. Pregl. 1969, 11, 261–262. [Google Scholar]
- Popović, D.; Vasiljević, M. Rekognosciranje u Sremu. Arheol. Pregl. 1970, 12, 193–194. [Google Scholar]
- Milošević, P. O traci puta Sirmium-Fossis i Sirmium-Bononia/Sur le trace de la route Sirmium-Fossis et Sirmium-Bononia. Starinar 1988, 39, 117–123. [Google Scholar]
- Brukner, O. Žirovac, Ruma—Rimski Put. Arheol. Pregl. 1982, 23, 95–97. [Google Scholar]
- Brukner, O. Rimski put Sirmium—Singidunum (11). Archaeological Investigations along the Highway Route in Srem. Available online: http://archest.eu/wp-content/uploads/2016/06/Archest-WP3-Task-3.1-%E2%80%93-Historiographic-research-update-on-the-Roman-route_28.7.2016.pdf (accessed on 25 November 2018).
- Gračanin, H. Rimske prometnice i komunikacije u kasnoantičkoj južnoj Panoniji. Scr. Slavon. 2010, 10, 9–69. [Google Scholar]
- Lučić, B. Contribution to the research of the main Roman road through Srem. In Archest—Developing Archaeological Audiences along the Roman Route Aquileia-Emona-Sirmium-Viminacium; Historiographic Research Update on the Roman Route; Muzej in galerije mesta Ljubljane: Ljubljana, Slovenia, 2016; pp. 37–44. [Google Scholar]
- Fodorean, F. Praetorium and the Emona–Siscia–Sirmium–Tauruno road in the ancient geographical and epigraphic sources. Arheol. Vestn. 2017, 68, 337–348. [Google Scholar]
- Fodorean, F. Listing settlements and distances: The Emona-Singidunum road in Tabula Peutingeriana, Itinerarium Antonini and Itinerarium Burdigalense. Starinar 2017, 95–108. [Google Scholar] [CrossRef]
- Agapiou, A.; Alexakis, D.D.; Sarris, A.; Hadjimitsis, D.G. Evaluating the Potentials of Sentinel-2 for Archaeological Perspective. Remote Sens. 2014, 4, 2176–2194. [Google Scholar] [CrossRef]
- Tapete, D.; Cigna, F. Appraisal of Opportunities and Perspectives for the Systematic Condition Assessment of Heritage Sites with Copernicus Sentinel-2 High-Resolution Multispectral Imagery. Remote Sens. 2018, 10, 561. [Google Scholar] [CrossRef]
- Wiseman, J.R.; El-Baz, F. (Eds.) Remote Sensing in Archaeology; Springer: Berlin, Germany, 2007. [Google Scholar]
- Parcak, S.H. Satellite Remote Sensing for Archaeology; Routledge: London, UK, 2009. [Google Scholar]
- Lasaponara, R.; Masini, N. (Eds.) Satellite Remote Sensing—A new tool for Archaeology; Springer Netherlands: Dordrecht, The Netherlands, 2012. [Google Scholar]
- Silver, M.; Törmä, M.; Silver, K.; Okkonen, J.; Nuñez, M. Remote sensing, landscape and archaeology tracing ancient tracks and roads between Palmyra and the Euphrates in Syria. ISPRS Ann. Photogramm. Remote Sens. Spat. Inf. Sci. 2015, II-5/W3, 279–285. [Google Scholar] [CrossRef]
- Traviglia, A.; Torsello, A. Landscape Pattern Detection in Archaeological Remote Sensing. Geosciences 2017, 7, 128. [Google Scholar] [CrossRef]
- De Guio, A. Cropping for a better future: Vegetation Indices in Archaeology. In Detecting and Understanding Historic Landscapes; Chavarria Arnau, A., Reynolds, A., Eds.; SAP: Società Archeologica srl: Mantova, Italy, 2015; pp. 109–152. [Google Scholar]
- Malenovský, Z.; Rott, H.; Cihlar, J.; Schaepman, M.E.; García-Santos, G.; Fernandes, R.; Berger, M. Sentinels for science: Potential of Sentinel-1, -2, and -3 missions for scientific observations of ocean, cryosphere, and land. Remote Sens. Environ. 2012, 120, 91–101. [Google Scholar] [CrossRef]
- Sentinel-2. Available online: http://www.esa.int/Our_Activities/Observing_the_Earth/Copernicus/Sentinel-2/Introducing_Sentinel-2 (accessed on 25 November 2018).
- Congedo, L. Semi-Automatic Classification Plugin Documentation. Available online: https://media.readthedocs.org/pdf/semiautomaticclassificationmanual-v3/latest/semiautomaticclassificationmanual-v3.pdf (accessed on 25 November 2018).
- Quantum GIS Development Team. Quantum GIS Geographic Information System. Open Source Geospatial Foundation Project. Available online: https://www.scirp.org/%28S%28vtj3fa45qm1ean45vvffcz55%29%29/reference/ReferencesPapers.aspx?ReferenceID=1515458 (accessed on 25 November 2018).
- Kauth, R.J.; Thomas, G.S. The Tasseled Cap—A Graphic Description of the Spectral-Temporal Development of Agricultural Crops as Seen by LANDSAT. LARS Symp. 1976, 1, 159. [Google Scholar]
- Agapiou, A.; Alexakis, D.D.; Sarris, A.; Hadjimitsis, D.G. Orthogonal Equations of Multi-Spectral Satellite Imagery for the Identification of Un-Excavated Archaeological Sites. Remote Sens. 2013, 5, 6560–6586. [Google Scholar] [CrossRef] [Green Version]
- Yarbrough, L.D.; Navulur, K.; Ravi, R. Presentation of the Kauth-Thomas transform for WorldView-2 reflectance data. Remote Sens. Lett. 2014, 5, 131–138. [Google Scholar] [CrossRef]
- Agapiou, A. Orthogonal equations for the detection of hidden archaeological remains de-mystified. J. Archaeol. Sci. Rep. 2017, 14, 792–799. [Google Scholar] [CrossRef] [Green Version]
- Zanni, S.; Lučić, B.; De Rosa, A. From the sky to the ground. A spatial approach to the archaeological research in the Srem region (Serbia). The case study of Pusta Dreispitz. In Proceedings of the Cultural Heritage and New Technology Conference (CHNT), Wien, Germany, 8–10 November 2017. [Google Scholar]
- Zanni, S. Seek and Ye Shall Find. A Spatial Approach to Mapping Roman Roads and Buried Archaeological Sites in the Srem Region. The Case Study of Tapavice Site 2018. Available online: https://www.researchgate.net/publication/327623205_Seek_and_Ye_Shall_Find_A_spatial_approach_to_mapping_Roman_roads_and_buried_archaeological_sites_in_the_Srem_region_The_case_study_of_Tapavice_site_XXIV_LIMES_Congress/download (accessed on 25 November 2018).
- Lučić, B. Roman viability through the Srem Region—Territory of the town of Sirmium. In Proceedings of the Actes du Colloque International, Bordeaux, France, 11–12 September 2017. [Google Scholar]
Figure 1.
Map of the area of interest in the presented research. The five blue squares identify the remains of the Roman road already known before the beginning of the RecRoad project (courtesy of the Institute for the Protection of the Cultural Monuments of Sremska Mitrovica).
Figure 1.
Map of the area of interest in the presented research. The five blue squares identify the remains of the Roman road already known before the beginning of the RecRoad project (courtesy of the Institute for the Protection of the Cultural Monuments of Sremska Mitrovica).

Figure 2.
Detail of the output of the NDVI application to the Sentinel-2 image recorded on 16 June 2016. The areas including the Roman road and other buried archaeological remains are marked in magenta, but it was not possible to detect traces of the Roman road in this image. For a geographical reference, see the crop-marks identification numbers and locations in Figure 9.

Figure 3.
Detail of the output of RN application to the Sentinel-2 image recorded on 16 June 2016. The areas including the Roman road and other buried archaeological remains are marked in magenta. The arrows indicate the visible traces of the road. For a geographical reference, see the crop-marks identification numbers and locations in Figure 9.

Figure 4.
Details of the output image of RN application to the Sentinel-2 image. The crop-mark n.2, identified as the Roman road, is marked by the magenta arrows.
Figure 4.
Details of the output image of RN application to the Sentinel-2 image. The crop-mark n.2, identified as the Roman road, is marked by the magenta arrows.

Figure 5.
Output details of CC3 algorithm application to the Sentinel-2 image. The areas including the Roman road and other buried archaeological remains are marked in magenta, but it was not possible to detect them through this image. For a geographical reference, see the crop-marks identification numbers and locations in Figure 9.

Figure 6.
Output details for CC3_DR algorithm application to the Sentinel-2 image. The areas including the Roman road and other buried archaeological remains are marked in magenta, but it was not possible do identify the Roman road in this image. For a geographical reference, see the crop-marks identification numbers and locations in Figure 9.

Figure 7.
Output details for CC3 algorithm application to the WorldView2 image. The crop-marks identifying the presence of the Roman road and of other buried archaeological remains are marked in magenta. Data provided by the European Space Agency. The arrows mark the visible traces of the road. For a geographical reference, see the crop-marks identification numbers and locations in Figure 9.

Figure 8.
Output details for CC3_DR application to the WorldView2 image. The crop-marks identifying the presence of the Roman road and other buried archaeological remains are marked in magenta. The arrows mark the best-defined traces of the road. Data provided by the European Space Agency. For a geographical reference, see the crop-marks identification numbers and locations in Figure 9.

Figure 9.
Map representing the results obtained during the archaeological survey in Srem. In the focus is the segment of the Roman road between Bassianae and Singidunum, mapped for the first time within the RecRoad project.
Figure 9.
Map representing the results obtained during the archaeological survey in Srem. In the focus is the segment of the Roman road between Bassianae and Singidunum, mapped for the first time within the RecRoad project.


Table 1.
Sentinel-2 bands with the corresponding central wavelengths and spatial resolution.
| Sentinel-2 Bands | Central Wavelength (μm) | Resolution (m) |
|---|---|---|
| Band 1—Coastal aerosol | 0.443 | 60 |
| Band 2—Blue | 0.490 | 10 |
| Band 3—Green | 0.560 | 10 |
| Band 4—Red | 0.665 | 10 |
| Band 5—Vegetation Red Edge | 0.705 | 20 |
| Band 6—Vegetation Red Edge | 0.740 | 20 |
| Band 7—Vegetation Red Edge | 0.783 | 20 |
| Band 8—NIR | 0.842 | 10 |
| Band 8A—Vegetation Red Edge | 0.865 | 20 |
| Band 9—Water Vapour | 0.945 | 60 |
| Band 10—SWIR—Cirrus | 1.375 | 60 |
| Band 11—SWIR | 1.610 | 20 |
| Band 12—SWIR | 2.190 | 20 |
Table 2.
Spectral characteristics and spatial resolution of the WorldView-2 spectral images.
| WorldView-2 Bands | Wavelength (μm) | Spatial Resolution (m) | |
|---|---|---|---|
| at nadir | 20° off-nadir | ||
| Panchromatic | 450–800 | 0.46 | 0.52 |
| Coastal | 400–450 | 1.85 | 2.07 |
| Blue | 450–510 | 1.85 | 2.07 |
| Green | 510–580 | 1.85 | 2.07 |
| Yellow | 585–625 | 1.85 | 2.07 |
© 2019 by the authors. Licensee MDPI, Basel, Switzerland. This article is an open access article distributed under the terms and conditions of the Creative Commons Attribution (CC BY) license (http://creativecommons.org/licenses/by/4.0/).
Share and Cite
MDPI and ACS Style
Zanni, S.; De Rosa, A. Remote Sensing Analyses on Sentinel-2 Images: Looking for Roman Roads in Srem Region (Serbia). Geosciences 2019, 9, 25. https://doi.org/10.3390/geosciences9010025
AMA Style
Zanni S, De Rosa A. Remote Sensing Analyses on Sentinel-2 Images: Looking for Roman Roads in Srem Region (Serbia). Geosciences. 2019; 9(1):25. https://doi.org/10.3390/geosciences9010025
Chicago/Turabian StyleZanni, Sara, and Alessandro De Rosa. 2019. "Remote Sensing Analyses on Sentinel-2 Images: Looking for Roman Roads in Srem Region (Serbia)" Geosciences 9, no. 1: 25. https://doi.org/10.3390/geosciences9010025
Note that from the first issue of 2016, this journal uses article numbers instead of page numbers. See further details here.