1. Introduction
Capture, transport, and subsequent injection of anthropogenic CO2 into deep geological horizons of highly-permeable sedimentary rocks effectively reduces atmospheric emissions of CO2 derived from the combustion of fossil fuels. The injection of CO2 into deep geological formations uses technologies that have been traditionally applied and verified by the oil and gas industry. However, validating potential storage reservoirs from the standpoint of environmental risks, which may arise from uncertainties in geometrical characteristics of leakage pathways from injection wells into adjoining stratigraphic intervals, is crucial. Leakage of CO2 could have various impacts, including contamination of groundwater, which affects local health and safety.
Considerable attention has been paid to the suitability of horizons at depths of approximately 1500 m in the central part of the Paris Basin (France) for supercritical CO
2 storage installation. These include 70–80-m-thick oolitic carbonate horizon from the Dogger and uppermost carbonate formation of Oolite Blanche Series [
1,
2], which lie directly beneath impermeable argillaceous rocks of Callovian–Oxfordian age. The Oolite Blanche Series can be observed in outcrops at the basin edges, wherein these limestones have been extensively excavated (e.g., in the vicinity of Poitiers and Chauvigny, where Lavoux limestone is still being quarried). This formation serves as an aquifer with moderate salinity that has been used for geothermal projects for more than 40 years.
In accordance with previous experiments [
3,
4,
5], the reactivity of Lavoux limestone (mainly composed of calcite) is sensitive to pH and, therefore, to the partial pressure (P) of CO
2 in the interstitial solution. Thermodynamic calculations [
4] have demonstrated that the volume of dissolved calcite is obviously limited by storage conditions due to the H
2O-CO
2-calcite equilibrium in closed systems. However, these limitations occur at some edges of the dissolution front away from the injection well, where CO
2 is transported along attractive planes of diffusion. Rahbari and Saberi [
6] introduced a mathematical model of the growth of this three-dimensional (3D) pattern, where diffusion process, as a 3D Brownian motion, was controlled by the attractive planes. Owing to the complex internal geometry of solute flow paths, including sink conduits and blind pockets, we can expect significant local, real-time deviations of pH-P conditions, which are responsible for dissolution and contemporaneous re-precipitation in some domains of the host rock. According to Fischer and Lüttge [
7], the heterogeneity of polycrystalline calcite causes a pattern of fluid flow velocity gradients that retroact on surface dissolution rates. Direct observations using atomic force microscopy, optical interferometry, surface spectroscopy, and related instrumental approaches have provided significant advancements in our understanding of mineral dissolution, in which kinetics are typically dominated by the distribution of defects and defect-driven reactions [
8], which may constitute a critical contribution to whole rock reactivity.
Since 2012, the French National Research Agency (ANR) launched the CO
2 DISSOLVED research project [
9,
10], employing the Carbon Capture and Storage (CCS) concept based on environmentally-friendly technology integrating a geothermal doublet system consisting of two wells targeted for a deep saline aquifer in a carbonate reservoir. The first injection well is used for injecting and storing CO
2 in dissolved form produced by low tonnage emitters, whereas the second production well is employed for simultaneous geothermal energy recovery. This study was conducted in the framework of the PILOT CO
2-DISSOLVED project (funded by the Scientific Interest Group Geodenergies) with the ultimate aim of careful site selection for understanding the geometrical characteristics of possible CO
2 leakage pathways from the injection well during implementation of the forthcoming industrial pilot demonstration project. For this purpose, a test bench (MIRAGES-2), mimicking an injection well at a 1/20 scale (rock/cement/tubing), was developed by the GeoResources Laboratory to allow the continuous radial injection of a CO
2-rich aqueous solution under geological storage conditions.
The characteristics of the dissolution network within reservoir rocks were produced by CO2-like and more complex fluid-carbonate rock alterations. These are critical for defining possible injection scenarios for feasibility studies related to installation and safe, long-term exploitation of a CCS industrial pilot demonstration project.
3. Experimental Results
Matrix acidizing of the carbonate rocks was triggered by the injection of aggressive fluids in a set of eight different experiments. These experiments generated sets of dissolution arrays, which appeared to be due not only to continuous uniform alteration or the stochastic branch working in porous limestone medium, but also to the physical and chemical competition between enlarging unitary flow paths and tectonically-induced conduits and barriers, involving both fluid-reservoir rock dissolution and precipitation interactions.
3.1. Reactivity of Lavoux Limestone after Comptuted Tomography Inspection
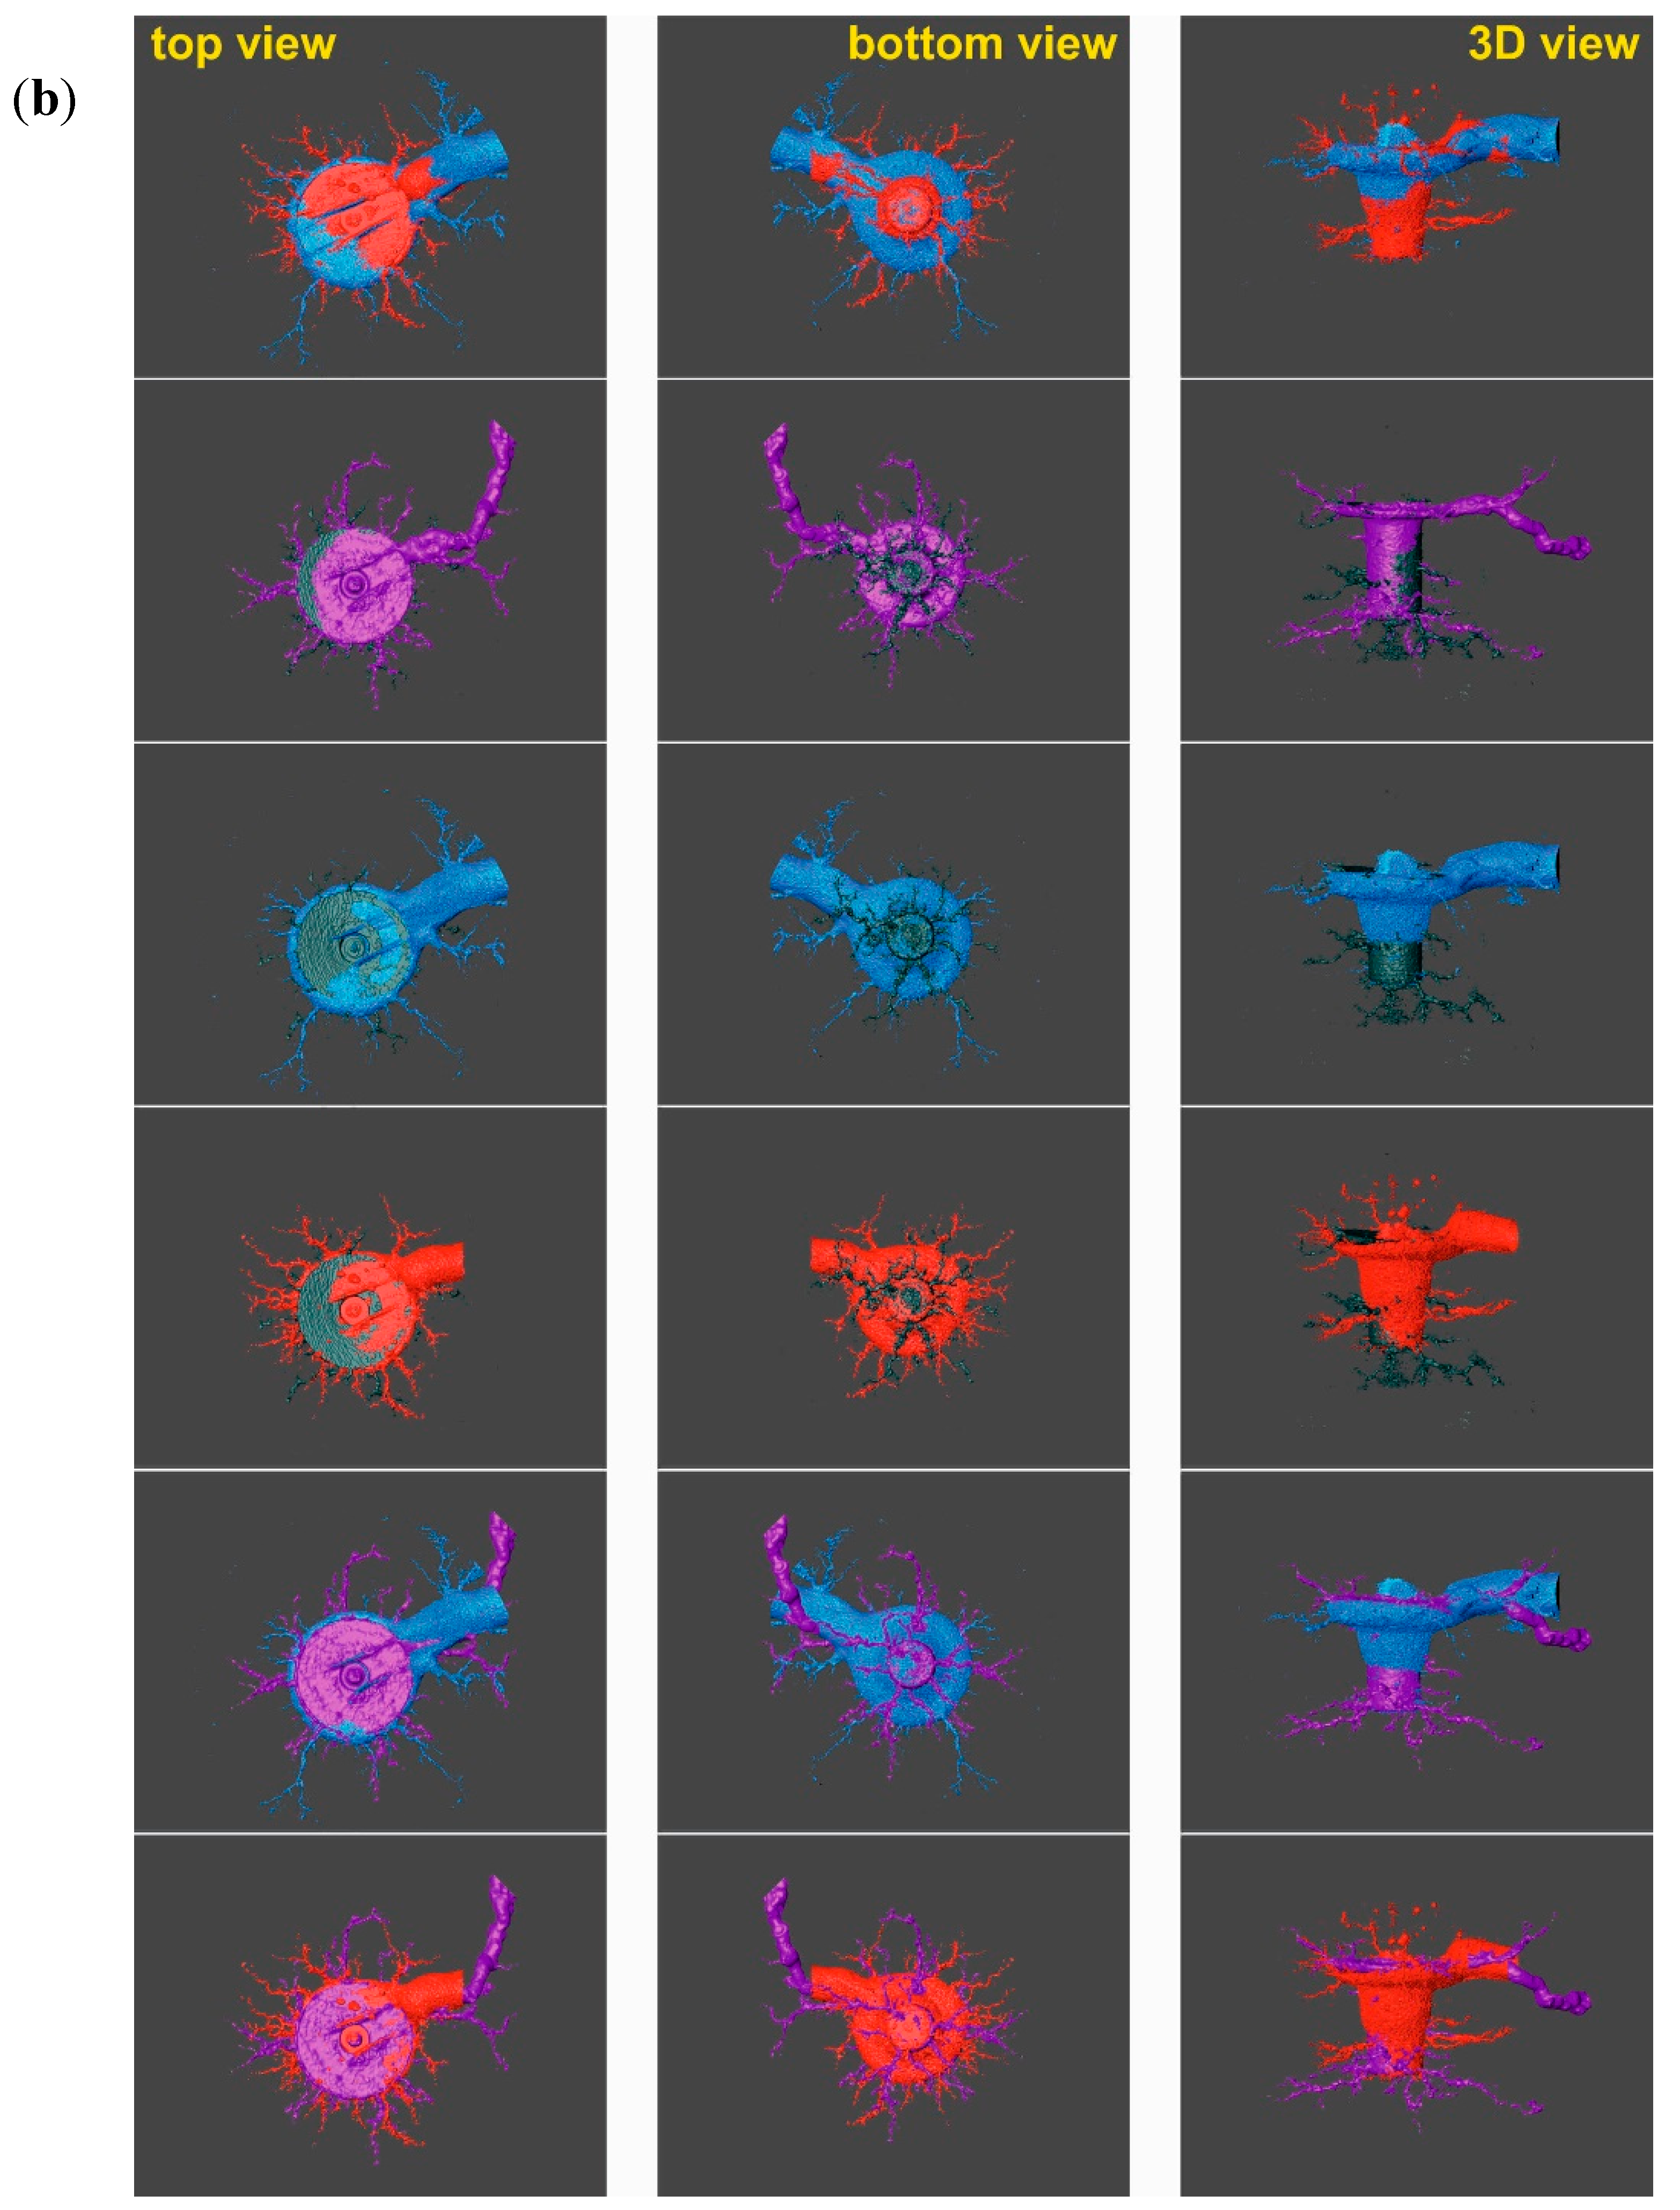
The injection of aggressive fluids promoted dissolution of the limestone in the studied samples from the injection point to the exterior of the samples. After CT inspection, the core plugs demonstrated dissolution networks visible on the CT scans and 3D models (
Figure 2).
Notably, prominent anisotropy of the multilevel dissolution pathways was observed, whereas the injection process was basically isotropic from the bottom hole. This strongly suggests the presence of an initial anisotropy in the samples of the Lavoux formation even before experimental treatment. Despite the dramatic differences in the initial experimental conditions, including the duration of the treatment under reservoir conditions and different compositions of injected fluids, the results identify recurrent directional control of patterns in each dataset. It appears that the similarity of the dissolution pathways repeated in all experiments must be more than a coincidence. Specifically, the experiments demonstrated that preferential directions “attracted” dissolution and resulted in systems of highly conductive channels, referred to as wormholes. Especially prominent, similar patterns in the dissolution arrays can be seen by comparison of the CT scans with related 3D models in pairs of experiments (#1, #2, #3, and #4) presented in
Figure 2.
Prior to the experiments, we considered the existence of pre-existing fabrics and related preferential directions that were pronounced in the samples. These directions could facilitate wormhole propagation and the overall growth of the entire dissolution pattern.
3.2. Similarities of Subsequent Dissolution Development in Natural Environments and Artificial Wormhole Propagation from the Standpoint of the Influence of Pre-Existing Structural Discontinuities
Researchers have been looking for the mechanism for wormhole formation and various models to describe this process have been proposed [
14,
15,
16,
17,
18,
19]. However, there is still no consensus on global wormhole theory. Most of the traditional models [
14] advocate the hypothetic random distribution of pores in the shape of cylindrical tubes, with their enlargement being a response to aggressive fluid injection.
Experimental studies of wormhole formation have used a variety of porous systems, including plaster dissolved by water [
15], limestone cores treated with acid [
16], and salt packs dissolved with under-saturated salt solution [
17]. Multiple types of dissolution networks along discreet rock fractures and their zones have been reported [
17,
18,
19]. This approach to wormhole distribution analysis resembles the conduit initiation and growth of cavities in a karst system, and can be referred to as the principal mechanism of a preferable dissolution pattern nucleation developed along zones of structural weakness represented by faults and fractures of different scales.
The high-permeability subsurface horizons are typically derived from biological and igneous processes and chemical reactions between rocks and fluids, including greenhouse gases, such as carbon dioxide. In sedimentary basins, natural accumulations of relatively pure CO2 and CO2 dissolved in formation waters have been found in a number of different types of sedimentary rocks, especially in limestones, dolomites, and sandstones, with a variety of seals and a range of trap types, reservoir depths, and CO2-bearing phases. Geological storage of CO2 dissolved in formation waters occurred as a natural process in carbonate rocks (e.g., limestones) for millions of years and this natural laboratory provides a basis for understanding possible scenarios of the behavior of industrial CO2 storage in carbonate lithology formations.
More specifically, long-term natural storage of CO
2 in carbonate rock aquifers are most likely accompanied by artificial karstification due to acidic water-rock interactions. Conduit initiation and progressive growth of cavities in a karst system are usually assumed to be controlled by non-linear kinetics [
20] that allow CO
2-enriched aggressive water to penetrate geological formations. In most cases, this process mainly occurs along zones of structural weakness represented by faults and fractures on different scales [
21,
22].
Moreover, competition exists between conduit evolution along different fractures, and many karst corridors are closely related, not only with open tension fractures, but also with relatively tight strike-slip faults [
20]. The structural network of faults and fractures, recognizable both at the surface and inside the karst systems in the transpressional structure of the Italian Dolomites, has been interpreted to be consistent with a Riedel shear system [
23]. The existence of preferential orientations of conduits within karst networks has been demonstrated [
24]. The structural relationship between fault families and the preferential orientation of cave survey data was identified within the Picos del Europa Mountains (Spain) [
22] and a dextrally reactivated shear zone was recognized [
25].
Reactions of dissolution—precipitation during experimental injection of CO
2 into a limestone reservoir—predominantly occur within the fractures, which serve as preferential paths for fluid flow [
26]. However, the specifics of the laboratory equipment being used in this study [
26] forced unidirectional transport of aggressive liquid into the specimen, with subsequent propagation of the dissolution pattern within fractures exclusively oriented along the maximal gradient of the fluid flow. This means that the effect of natural sample heterogeneity and permeability anisotropy caused by fracturing and layering on dissolution pattern structure is beyond the scope of such experiments. The ability to induce radial fluid flow in relation to an injection point is one of the major advantages offered by the MIRAGES-2 device, which ultimately helps to identify and quantify experimental results from the standpoint of understanding the spatial relation between the fracture distribution in a specimen and the subsequent dissolution development in natural environments of limestones reservoirs.
3.3. Structural Arrangement of Planar Microfractures in Samples of the Lavoux Limestone from X-ray Computed Tomography
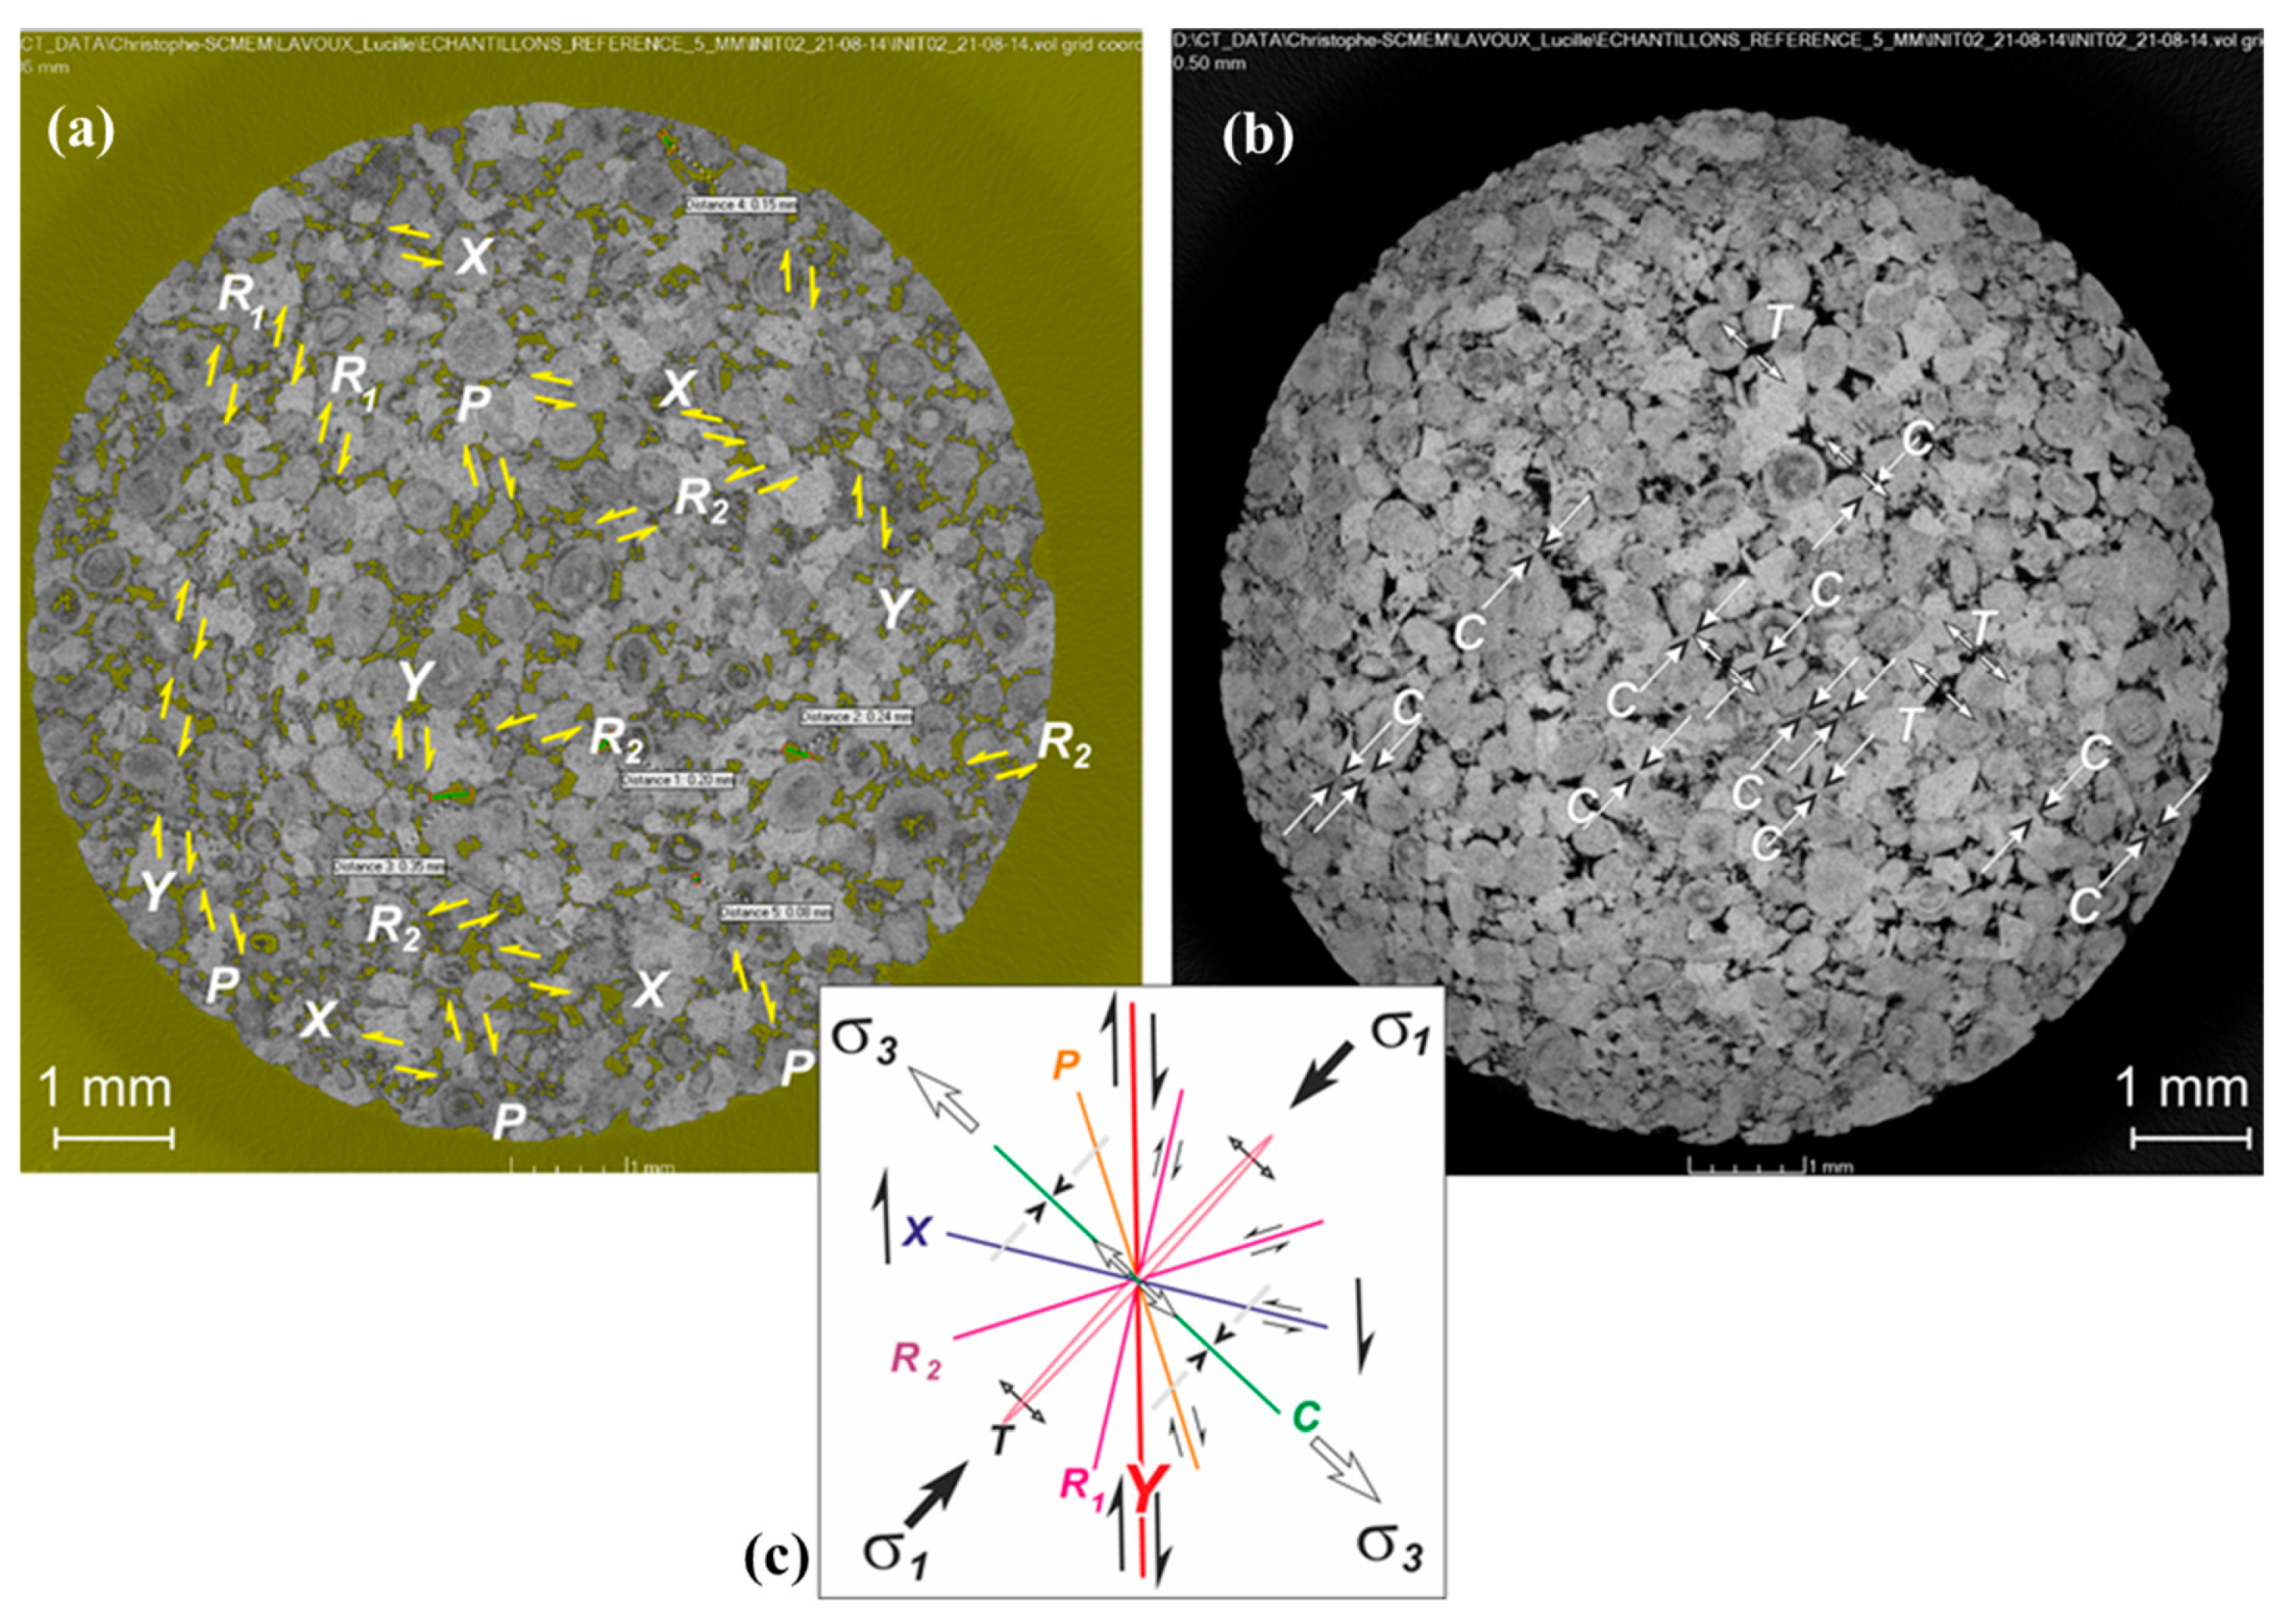
We performed a detailed examination of CT scans of fresh samples of Lavoux limestones with a 5 µm resolution in sub-horizontal sections and observed regularly arranged microscale planar fractures along which we recorded small amounts of dextral and sinistral shear displacements (
Figure 3a).
These shear-stress-affected surfaces contain minute brecciated fragments abraded from larger ooids grooved and cracked particles. Fractures propagated mainly along ooidal grain boundaries, but also several intra-ooidal cracks with lateral shifting of grain fragments are recognised (
Figure 3a). Also, tension fractures (T) or dilatational joints with no displacement parallel to the sidewalls of the fracture and tectonically-induced stylolitic contacts of ooids, as a product of intergranular pressure-solution, are visible (
Figure 3b).
The presence of stylolitic planes (C) in horizontal sections is often an indication of a volume loss within the deforming material under main compressive tectonic stress (σ
1) perpendicular to the stylolites. The tectonic stylolites in the WNW–ESE direction in the mid-Jurassic oolitic reservoirs in the Paris Basin were described previously by Granier and Staffelbach [
28], who indicated that compressional stress (σ
1) was applied from NNW–SSE directions (azimuth N150° E). Also, specific lineations, orthogonal to stylolites, have been delineated and interpreted as dilatational joints (T). Here, fracture surfaces exist normal to the main tensile stress during joint formation.
A total set of fractures identified within horizontal CT scans could be generated within the dextral strike-slip zone with the principal direction, Y, in the classical framework scheme of development of the set of subsidiary structures within the strike-slip zone [
27]. These subsidiary structures consist of:
Conjugated dextral synthetic (R1) and sinistral antithetic (R2) Riedel shears;
conjugated dextral synthetic P and sinistral antithetic X shears; and
stylolitic planes (C) perpendicular to the main compressive stress, σ1.
Tension fractures (dilatational joints) were T perpendicular to the main tensile stress, σ3, which formed parallel to the strain ellipse short axis, C.
All these fissures or microfaults are connected to one another, forming the specific pattern of an anastomosing network of fissures (
Figure 3c). Additional support for the presence within the studied samples of microcracks induced by strike slip faulting may be obtained from the analysis of the vertical sections of Lavoux limestones with the help of binary filtration of CT scans. The vertical section (
Figure 4a) demonstrates the presence of both features, i.e., elements of intra-stratification and characteristic shapes of minute-scale flower structures [
29], which can be interpreted as upward splaying shear microfaults. These findings are in good agreement with previously published results of geostructural surveys within the Saint-Maixent-l’École mapping sheet located in the vicinity of Chauvigny [
30]. The faults inferred from the Mesozoic formations tend to join downward into single strands in the same way (
Figure 4b), as we documented for high-resolution CT scans of millimeter-scale fragment of Lavoux limestone specimen.
Here, localization of discrete microfractures corresponds to inherited mechanical anisotropy caused by millimeter-scale sedimentary layering. From our premise of preferential direction of dissolution arrays obtained within the results of MIRAGES-2, experiments should be related to precursors of brittle microcracks nucleation, resulting from the influence of the natural strike-slip stress field that affected the Lavoux limestones in-situ within the Chauvigny quarry location.
The azimuthal referencing systems of revealed microcracks in the Lavoux samples were derived using scale invariance and regional tectonic and geomorphic patterns analyses.
3.4. Scale Invariance, Regional Tectonic, and Geomorphic Patterns Analyses as Tools for Azimuthal Referencing of Experimentally Obtained Dissolution Arrays and Connection with Fault and Fracture Networks at Different Scales
The scale invariance of geological phenomena is one of the first concepts taught to students of geology [
31]. Without the scale bar, it is mostly impossible to determine whether the delineated fracture pattern is a result of the interpretation of satellite imagery, aerial photographs, outcrop-scale documentation, or fault damage zone inspection after visual core observation, even if these are nano-fissure systems obtained from X-ray CT scans. There is ground truth of experimentally-derived similarities between shear zones of different magnitudes [
25]. Zooming into details of arrangements of discrete brittle and semi-brittle fractures within shear zones of different scales [
27,
29,
32] proves that there is no principal difference between processes of crustal mega-scale, local meso-scale, and even micro-scale shear zone formation in terms of the arrangement of subsidiary faults and their kinematic types.
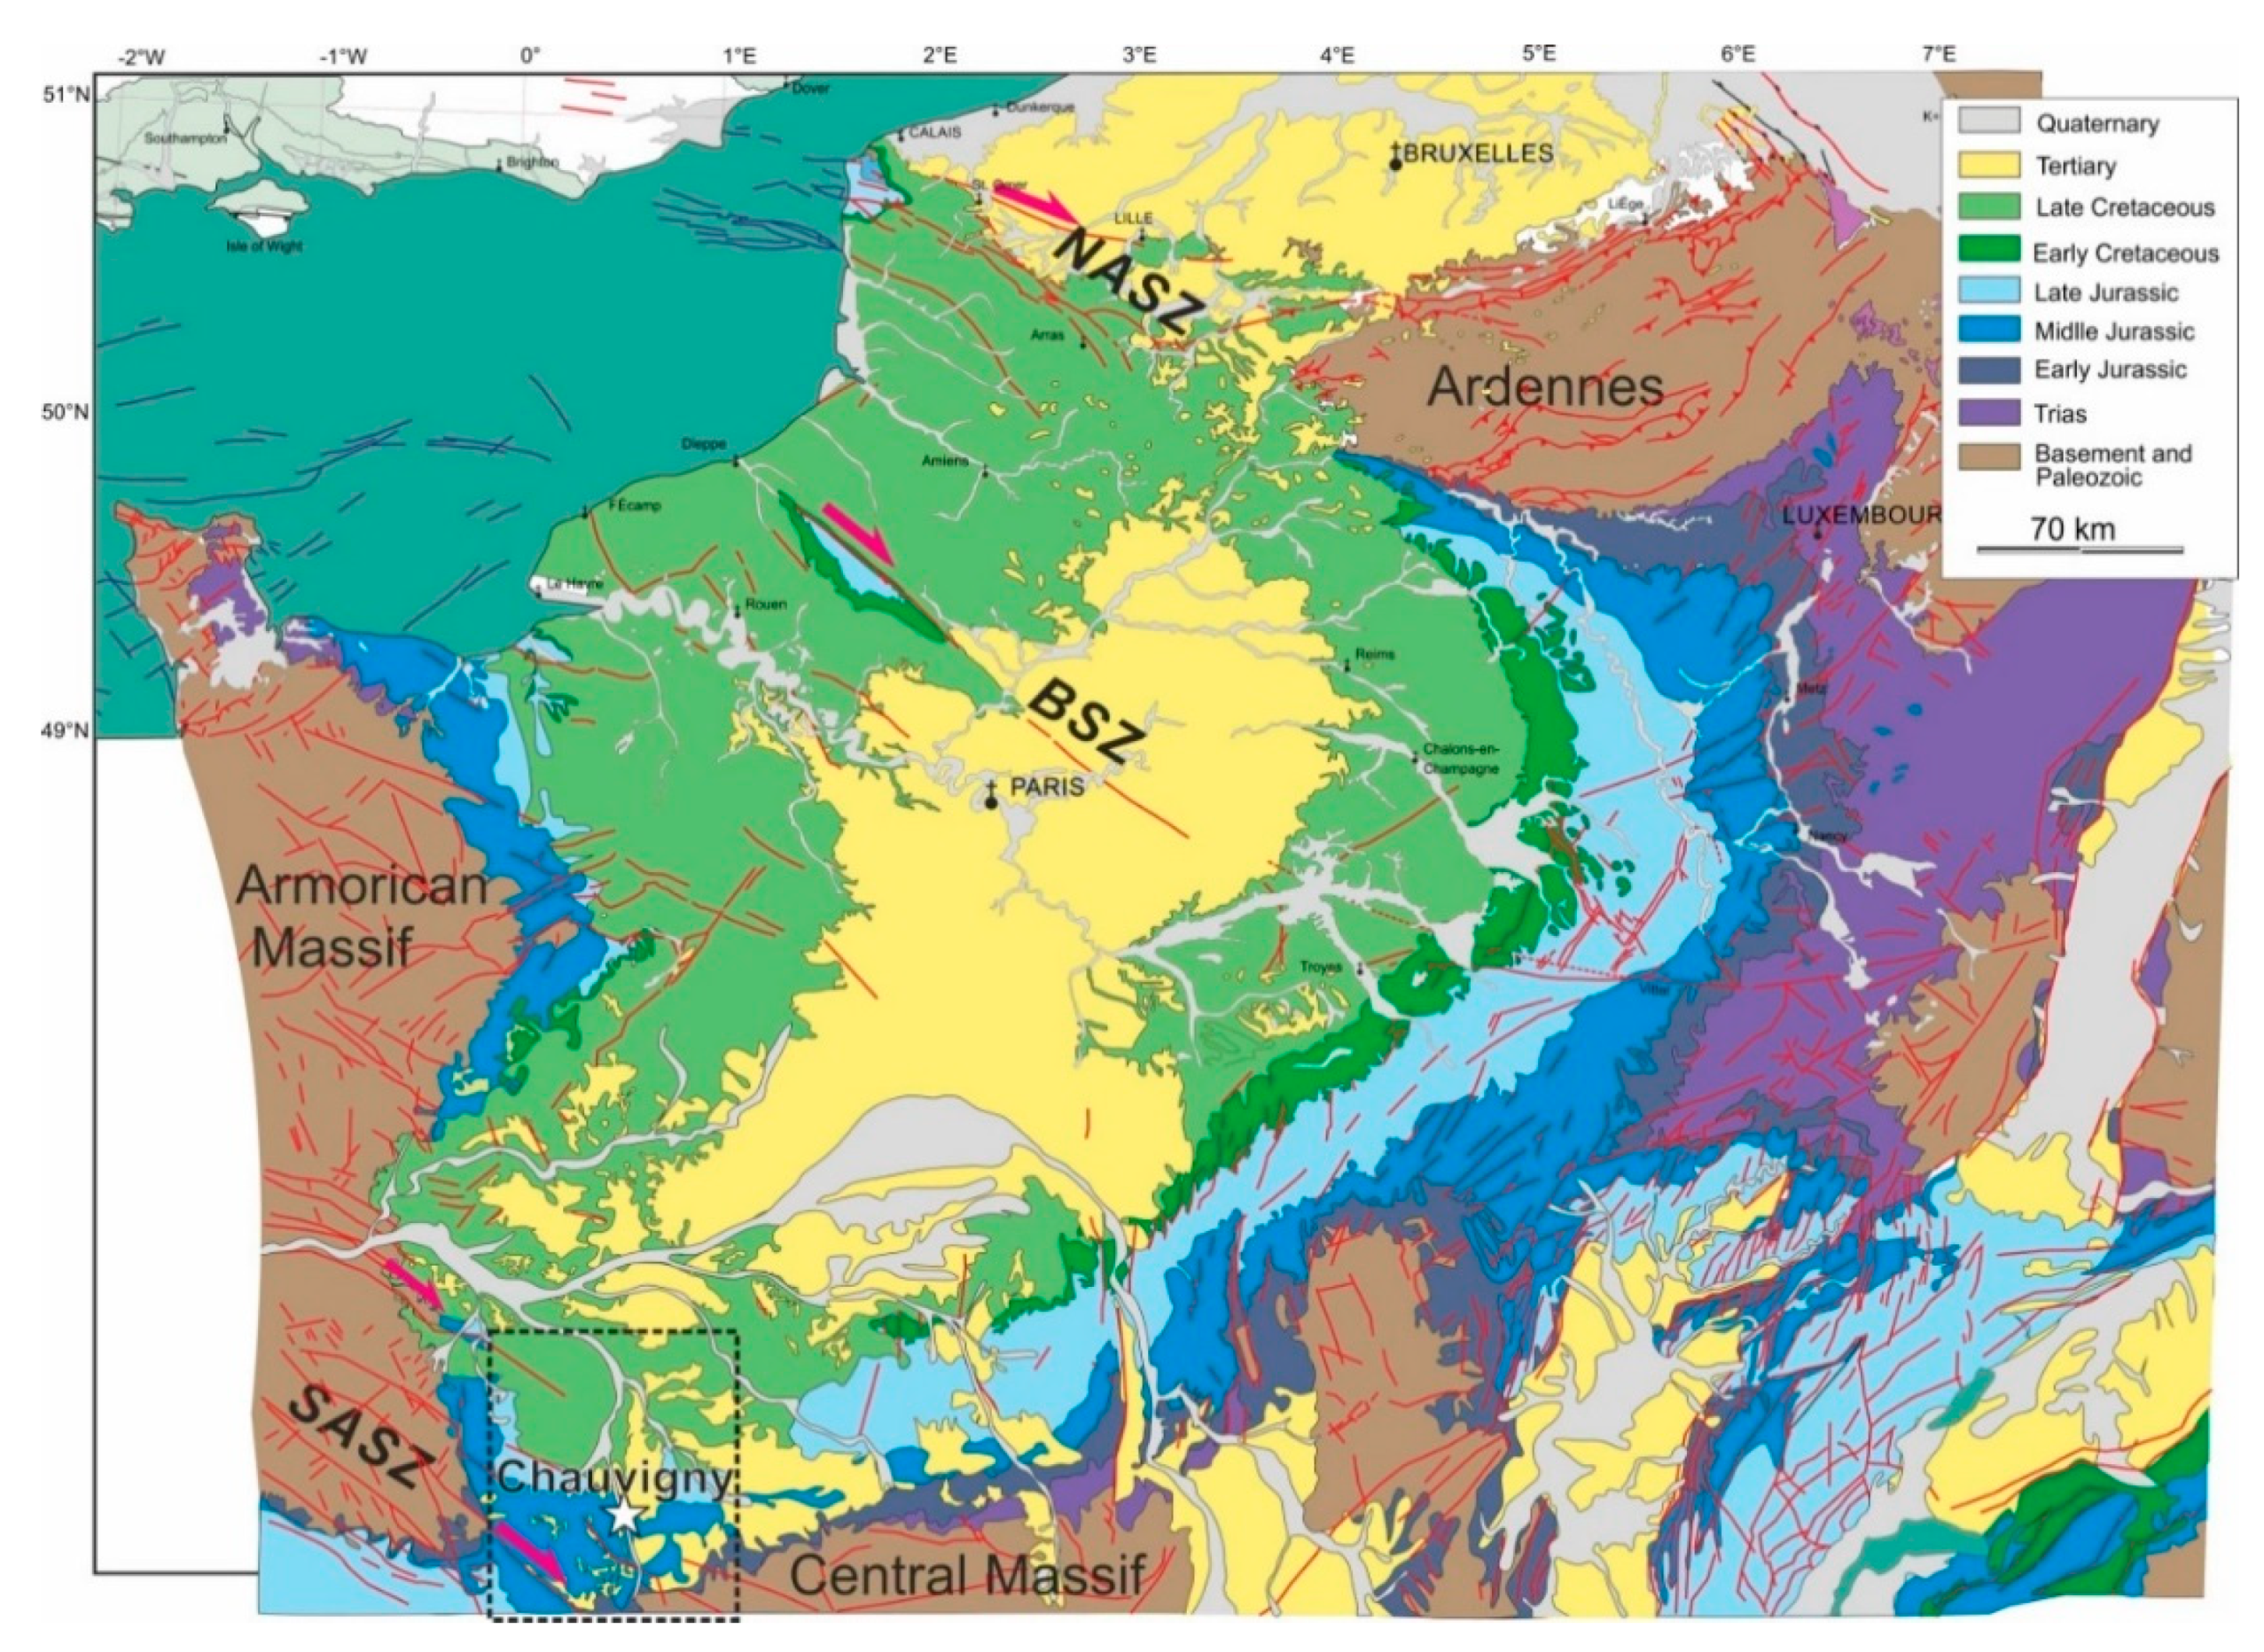
Can we use this scale invariance phenomenon to derive a suitable solution for azimuthal referencing systems of microcracks deduced from CT scans in the samples of the Lavoux limestone? We think this is possible if we consider the information about trends of tectonic structures, topography, and drainage patterns of the area of the adjoining place of sampling. The Chauvigny site and the related quarry are located within the Vienne River valley. The outcrop and quarry, formed during the Jurassic period, rests in a depression between two Variscan structural highs: The Armorican Massif and the French Massif Central (
Figure 5).
The tectonic patterns and kinematic characteristics of the Dogger formation are poorly understood. However, the typical underlying structural grain recognized in both the Southern Armorican Massif and the north-western edge of the French Massif Central is the presence of dextral transcurrent strike-slip faults within the frame of the Southern Armorican Shear Zone (SASZ;
Figure 5).
During Variscan times, the Armorican Massif underwent deformations related to a major continental collision between Gondwana and Laurussia [
34]. These resulted in the development of large dextral shear zones, including the SASZ, whose occurrence has been traced to the north-western edge of the French Massif Central. The dextral strike-slip component of the displacement is widely recognized across the Middle-Late Paleozoic Europe along NW–SE- and W–E-striking subconcentric wrench faults, e.g., Biscay-Pyrenees, Northern and Southern Armorican, Bristol Channel-Bray-Vittel, and North Artois faults [
35,
36].
Numerous neotectonic paleostress reconstructions, analyses of focal mechanism of earthquakes, and borehole breakouts across the entire Paris basin suggest that this right-lateral deformation of NW–SE- and W–E-striking subconcentric wrench faults is still ongoing. Shear patterns within the SASZ of Variscan age were independently mapped by different authors [
37,
38]. However, microseismical data showed that the SASZ is still a geodynamically active zone clearly pronounced in geomorphic patterns extracted from satellite imagery [
39].
Gunzburger and Magnenet [
40] used the up-to-date extensive synthesis of a huge database of outstandingly dense stress measurements in the Paris Basin obtained by ANDRA (the French radioactive waste management agency) in the framework of the feasibility study of underground nuclear waste storage. They confirmed that, on average, the major horizontal stress, σ
1, in the sedimentary cover of the basin has a constant NW–SE orientation, which is similar to the orientation of σ
1, generally accepted in the underlying basement. This means that Jurassic sediments overlying the Southern Armorican Shear Zone (SASZ) must be affected by this right lateral strike-slip faulting here. One of the possible methods to determine the proper spatial position studied in MIRAGES-2 device samples and fracture networks is to study these issues over the terrain overseen by the entire Vienne Department.
There is considerable evidence [
41] that river valleys or, broadly speaking, ravine-gully networks follow tectonic structures, which are, to a large extent, determined by neotectonic processes and the related stress-field. This geomorphic phenomenon of neotectonically-controlled drainage networks is closely related to selective erosion process within zones of structural weakness.
A number of researchers [
41,
42] have used similarities between morpholineaments extracted from drainage patterns and mapped joint-fault distribution for identifying structural trends and delineating structure that have are buried, deep-seated, or masked by younger sediments. Analysis of digital models of land surface and river valleys, and ravine-gully networks by means of numerical geomorphology, provides a basis for recognizing faults and understanding their mutual arrangement and kinematic types. According to Scheidegger [
41], joints controlling drainage networks and river valleys fragments are of tensile and shear origin and can be used as an effective instrument to reconstruct the neotectonic stress field.
So, to find a solution with azimuthal referencing of revealed fractures in the Lavoux samples, we decided (1) to delineate morpholineaments based on analysis of digital elevation models (DEM) of the land surface and (2) to perform spatial analysis of drainage patterns.
Figure 6 exhibits the shaded-relief elevation and drainage patterns in the Vienne Department area. Yellow dashed lines within
Figure 6b correspond to morpholineaments extracted from a shaded-relief elevation visualization model. The lineaments visible here show the primary WNW–ESE orientation trending the SASZ as well as the lineations of subsidiary submeridional and sublatitudinal faults that appeared because of the dextral reactivation of the shear zone. However, the most spectacular evidence of right lateral reactivation of the SASZ and identification of trends of the principal and subsidiary fault systems is the fact that its formation can be derived from an analysis of drainage network patterns.
Results of this analysis are presented in
Figure 6c,d as drainage segment orientations in rose diagrams with differentially assigned petal widths (10° and 5°, respectively). The major petal anomalies within the constructed rose diagrams are critically dependent on the main neotectonic stresses directions and the strain ellipsoid.
Both the most frequent drainage WNW–ESE-orientated lineations in
Figure 6d coincide with the striking domain of the main dextral Y-shears and dextral R
1-shears. The angle between the bulk shear-zone boundary (or Y-shears) and R
1-shears is ~15°, which corresponds to a φ/2 ratio [
27], where φ = 30 ± 2° is the internal friction angle of the host rock (Lavoux limestone) involved in strike-slip deformations.
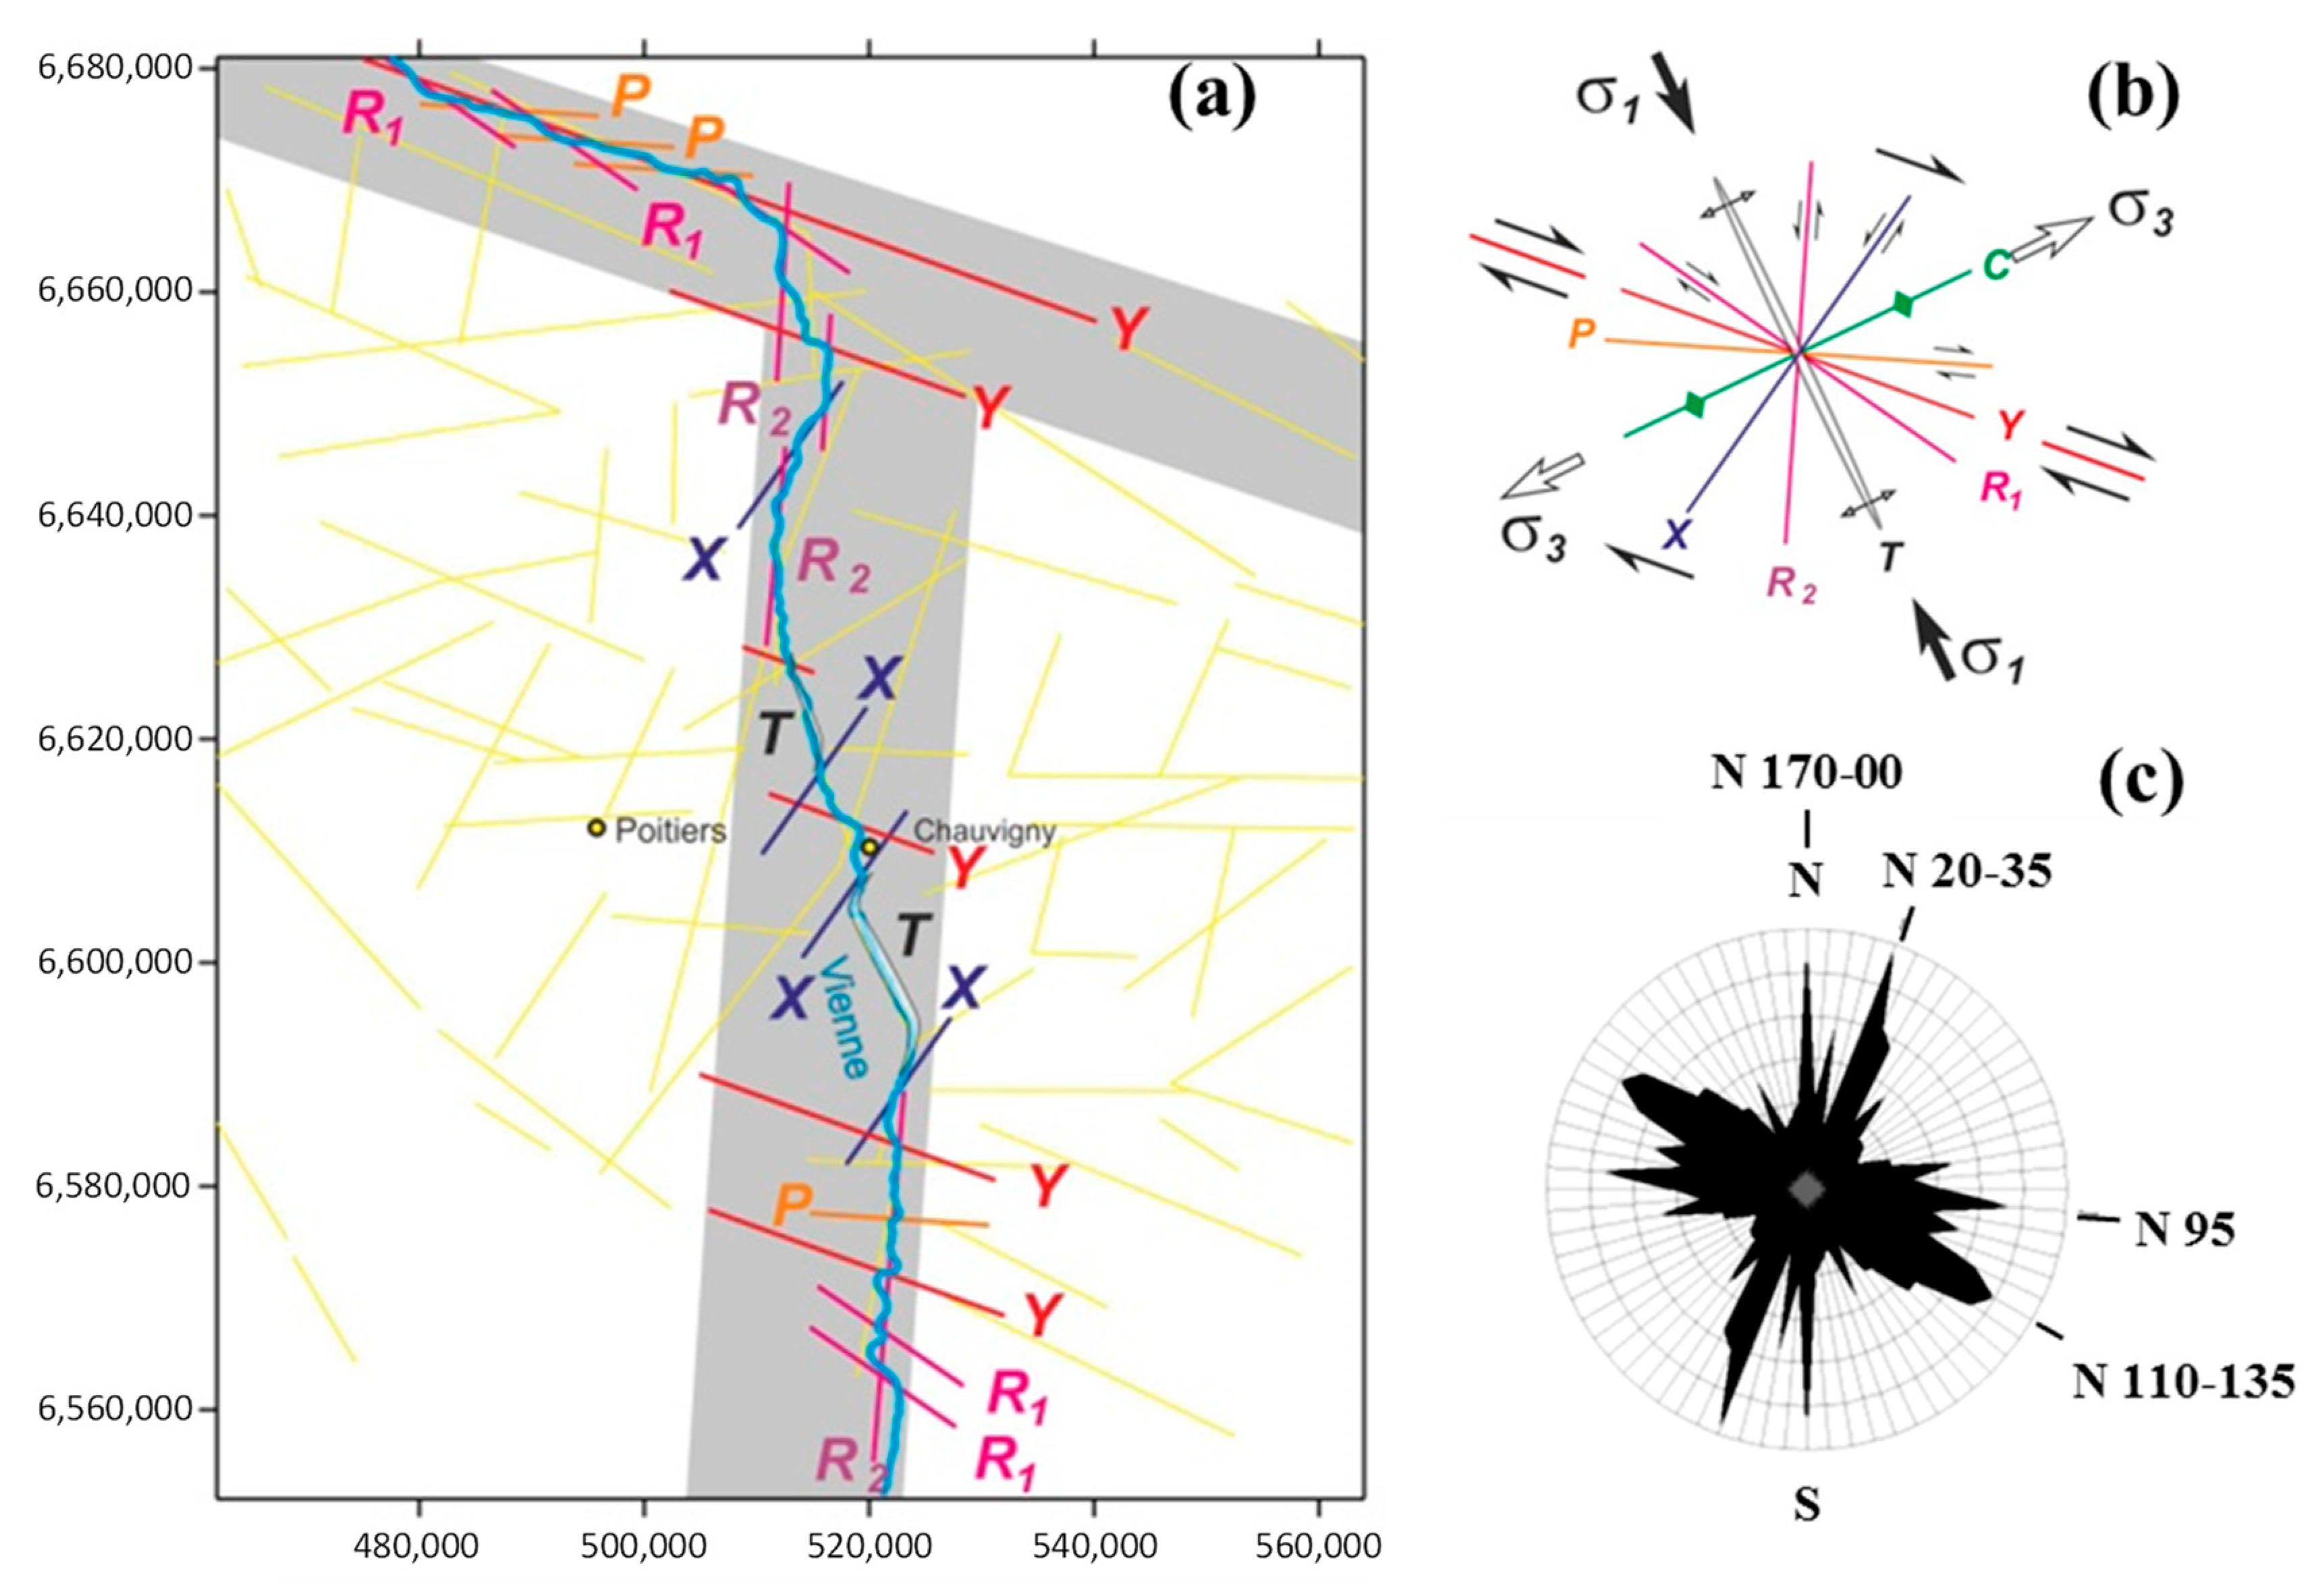
Other drainage segment orientation extremes within the study area reflect submeridional NNE–SSW striking R2 sinistral shears, ENE–WSW striking compressional structures C (stylolitic planes within reversed faults and related compressional fold structures), dextral sublatidional P-shears, and sinistral X-shears.
The strike of principal shear zone Y (azimuth 105–110°) and internal arrangement of subsidiary structures: R1 (azimuth 120–125°), R2 (azimuth 0–5°), C (azimuth 60–65°), P (azimuth 90–95°), and X (azimuth 30–35°), are consistent with the strain ellipsoid where the principal compression stress (σ1) is 150–155°, with trending and extension stress (σ3) of 60–65°. Both principal stresses (σ1 and σ3) are lying sub-horizontally in the strike-slip stress regime.
Actually, the Vienne River’s deflecting and meandering pattern (
Figure 7a) can be represented by a combination of segments of a set of faults developed due to the right lateral reactivation of the SASZ.
All major trends of the Vienne river valley seen in the topography DEM are represented by two major clusters corresponding to master Y shear and secondary R2 shear directions. However, the entrenched river’s meanders appear to be composed of a number of differently-oriented straight segments controlled by fractures (lineaments). Streams follow these lineaments represented by master shears Y and complimentary shears of R1, P, R2, and X types, as well as dilatational fractures, T.
In accordance with Cornet and Röckel [
44], the statistical distribution of the tension fracture orientations, identified within both the Dogger and the Oxfordian limestones of the Paris basin, exhibits a strong preferential orientation in the N150–155° E direction, i.e., parallel to the maximum horizontal stress direction developed during the Alpine tectonic orogeny.
The trend of extensional fissures, T (azimuth 150–155°), is relatively weakly expressed in the rose diagram for the entire drainage pattern of the study region. However, it becomes important for the Vienne River in the area just south and north of Chauvigny and seems to be morphologically and rheologically related to the outcropping, which is a relatively narrow strip of brittle Lavoux limestone. The characteristic lazy S-shape of the dilatational fracture, T, was created by the right lateral faulting along the set of master Y-shears, whose strikes correspond to the direction of the SASZ. We inferred from the analysis of drainage patterns in the Vienne department (
Figure 6 and
Figure 7) the azimuth of σ
1, the maximum principal stress, is about N150–155° E.
These results are in good agreement with the general features of neotectonic stress reconstructions for the Poitou threshold and adjoining massifs summarized in previous publications (
Figure 7c) [
43,
44,
45]. Thermal remote sensing data allowed us to define the relation between fracturing and basement cover. Several observation studies of the outcrops of the Jurassic limestone defined the main directions of the preferential fractures (linked to the tectonic of the region). The cumulative rose diagram presented in this study (
Figure 7b) confirms that the topolineaments controlling the Vienne River valley geometrical pattern developed in concert with two families of regional fractures: (1) Y, R
1, and P shears and (2) R
2 and X shears. The slight maximum corresponding with tension fractures T is visible on this rose diagram.
3.5. Deciphering Spatial Orientations of Preferential Propagation of Dissolution Arrays after Experiments
Since Lavoux limestone sampled in-situ were affected by regional strain within a crustal-scale shear zone, we assumed that our samples, even without being subjected to the action of a regional stress field after extraction from the quarry, bear strain scars, i.e., fractures that can control or at least affect the morphology of the wormhole network.
The mechanical anisotropy caused by regional tectonic stresses in samples before experimental treatment seems to be a plausible factor for deciphering the spatial orientations of preferential propagation of experimentally-obtained dissolution conduits. The identical initial microstructure of samples extracted from one bulk sample of Lavoux limestone provides a strong basis for meaningful comparison of results. The azimuthal referencing of dissolution arrays was performed via rotation of obtained horizontal CT scans to provide the best fit in terms of an alignment for discrete fragments of dissolution arrays (which revealed microcracks enlarged by a dissolution process) with the scheme of orientations of kinematically-defined and mutually-crosscutting fracture sets inferred from regional tectonic and geomorphic patterns analyses (
Figure 6 and
Figure 7).
Azimuthally-referenced CT scans of dissolution arrays and principal wormhole morphology, derived from the results of a spatial comparison of the results of experiments #1, #2, #3, and #4 (
Figure 8) strongly support the influence of a principal displacement zone corresponding with bulk shear displacement Y (azimuth 105–110°) on the studied samples’ right lateral reactivation within the limits of the SASZ, which affected the Dogger Formation in the region of sampling Lavoux limestone (Chauvigny quarry).
A total set of subsidiary Riedel system structures identified within horizontal CT scans of fresh samples (
Figure 3) and samples after experiments (discrete fragments of dominant wormhole and entire dissolution patterns) demonstrate a strain ellipsoid, where the principal compression stress (σ
1) is 150–155° and extension stress (σ
3) is 60–65°. Both principal stresses (σ
1 and σ
3) are lying sub-horizontally in the strike-slip stress regime.
4. Discussion
The spatial geometry of progressively dissolving limestone media affected by CO2-rich solution injection into a well remains poorly understood. The most critical issue is the question about the morphology of the growing dissolution cavity, which could be theoretically represented by three possible scenarios.
The first scenario assumes mean dissolution rates in limestone with an appearance of a dissolution array of quasi-isometric shape that grew due to the stable dissolution front propagating in relatively homogeneous porous media. Here, mineral dissolution always occurs at the same distance from the injection point. The second scenario assumes an appearance of a dendritic dissolution pattern resulting from stochastic dissolution branchworking in porous limestone medium, where permeable regions have already inherited a pre-existing ramified pattern of chaotically connected macro-pores. The third scenario supposes the highly channelized shape of dissolution arrays targeting fractures and zones of structural weakness. In radial flow, the last scenario provides a basis for considerable 3D variation in distances between the dissolution front and the injection point of the well. This variation might be subsequently eventualized in the trend in the dominating single principal wormhole as a potential leakage pathway from the injection well into adjoining stratigraphic intervals.
The results of our experimental studies, with the help of the MIRAGES-2 device, indicate the ground proof of the third scenario, where localized fast preferential fluid pathways are dependent on the pre-existing fracture network. We documented quick directional dissolution front propagation in the final scene of the dominant wormhole development in most cases of CO
2-rich solution injection into core specimens, prominently pronounced even for relatively short time-driven experiments, #9 (12 h ageing,
Figure 9) and #6 (24 h ageing,
Figure 10).
Additional information about the distribution of dissolution networks and azimuthally referenced wormholing morphology trends were experimentally revealed after structurally interpreting the results of experiment #7 (
Figure 11). From a technical point of view, experiment #7, with a core plug drilled at 55°, seems to important because it was performed to mimic the real inclination of a pilot project injection well. The results of 2D and 3D delineating of the dominant wormhole (
Figure 11) indicate the non-horizontal saltatory mechanism of its propagation inside the core specimen. The spatial trend of the wormhole was governed by the interplay of both distributions, including the fracture systems with dramatically variable conductivity, which might serve as regions of attractors or obstacles for dissolution pathways, and intra-stratification (bedding) elements within the entire sample structure.
So, on horizontal CT scans obtained of the dissolution mosaic (
Figure 11a,b), it is shown that conjugated Riedel shears, R
1 and R
2, intersected with one another and produced typical zones of strike-slip deformations with a rhombic block pattern. A model of experimental observations was reported with the angle of radial separation of discrete wormhole precursors 60° from each other under radial flow wormholing [
46], which accommodates the effects of permeability anisotropy caused by natural fracturing.
From our point of view, this angle reflects the angle between the conjugated Riedel shears, 60° = 90° − φ [
27], where φ = 30 ± 2° is the internal friction angle of the host rock (Lavoux limestone) involved in strike-slip deformations. Notably, in some cases, the rhombic pattern of dissolution consists of fragments of master dextral Y-shears and antithetic sinistral R
2 shears, intersecting each other at an angle of about 75° = 90° − φ/2 [
27] (
Figure 11a,b).
The initial strike of the observed mesoscopic wormholes appears to be NNW–SSE, trending parallel to dilatational fractures T (azimuth 150–155°), with a subsequent change in the major trends of dissolution along the master Y shears (azimuth 105–110°) or, more specifically, including the combination of synthetic R1 shears and secondary synthetic P shears.
Practically, the same trend governing the wormhole strike is depicted in the rose diagram of the skeleton model constructed for the principal wormhole developed during experiment #7 (
Figure 12).
The revealed antithetic R
2 shears served as obstacles for dissolution pathways, creating conditions for “jumping” a wormhole from one level to another elevated level (
Figure 9,
Figure 10,
Figure 11 and
Figure 12).
Microstructural analysis of the studied sample (experiment #7) via binary filtration of high-resolution photographs of the R
2 fracture wall demonstrated that this antithetic Riedel shear organizes itself as a rough indented surface due to the presence of slickolitic teeth oblique to the surface of shear displacement (
Figure 13).
At this millimeter scale, small conic dissolution pits are visible parallel to the maximum compressive stress, σ1.
Additional proof of the presence of conically shaped localized slickolitic teeth was derived for the same wall at the micron scale with the help of Scanned Electronic Microscope (SEM) image analysis. The teeth inclined to the wall of the fracture fossilized signatures of the stress field clearly indicate the strike-slip kinematic type of this fracture (
Figure 14).
The microslickolitic topography (combination of dissolution picks and pits) demonstrates the similar behavior over a range of scales studied. From our point of view, this serves as the main reason for generating both in-situ significant roughness and a related drop in conductivity within domains of the antithetic R
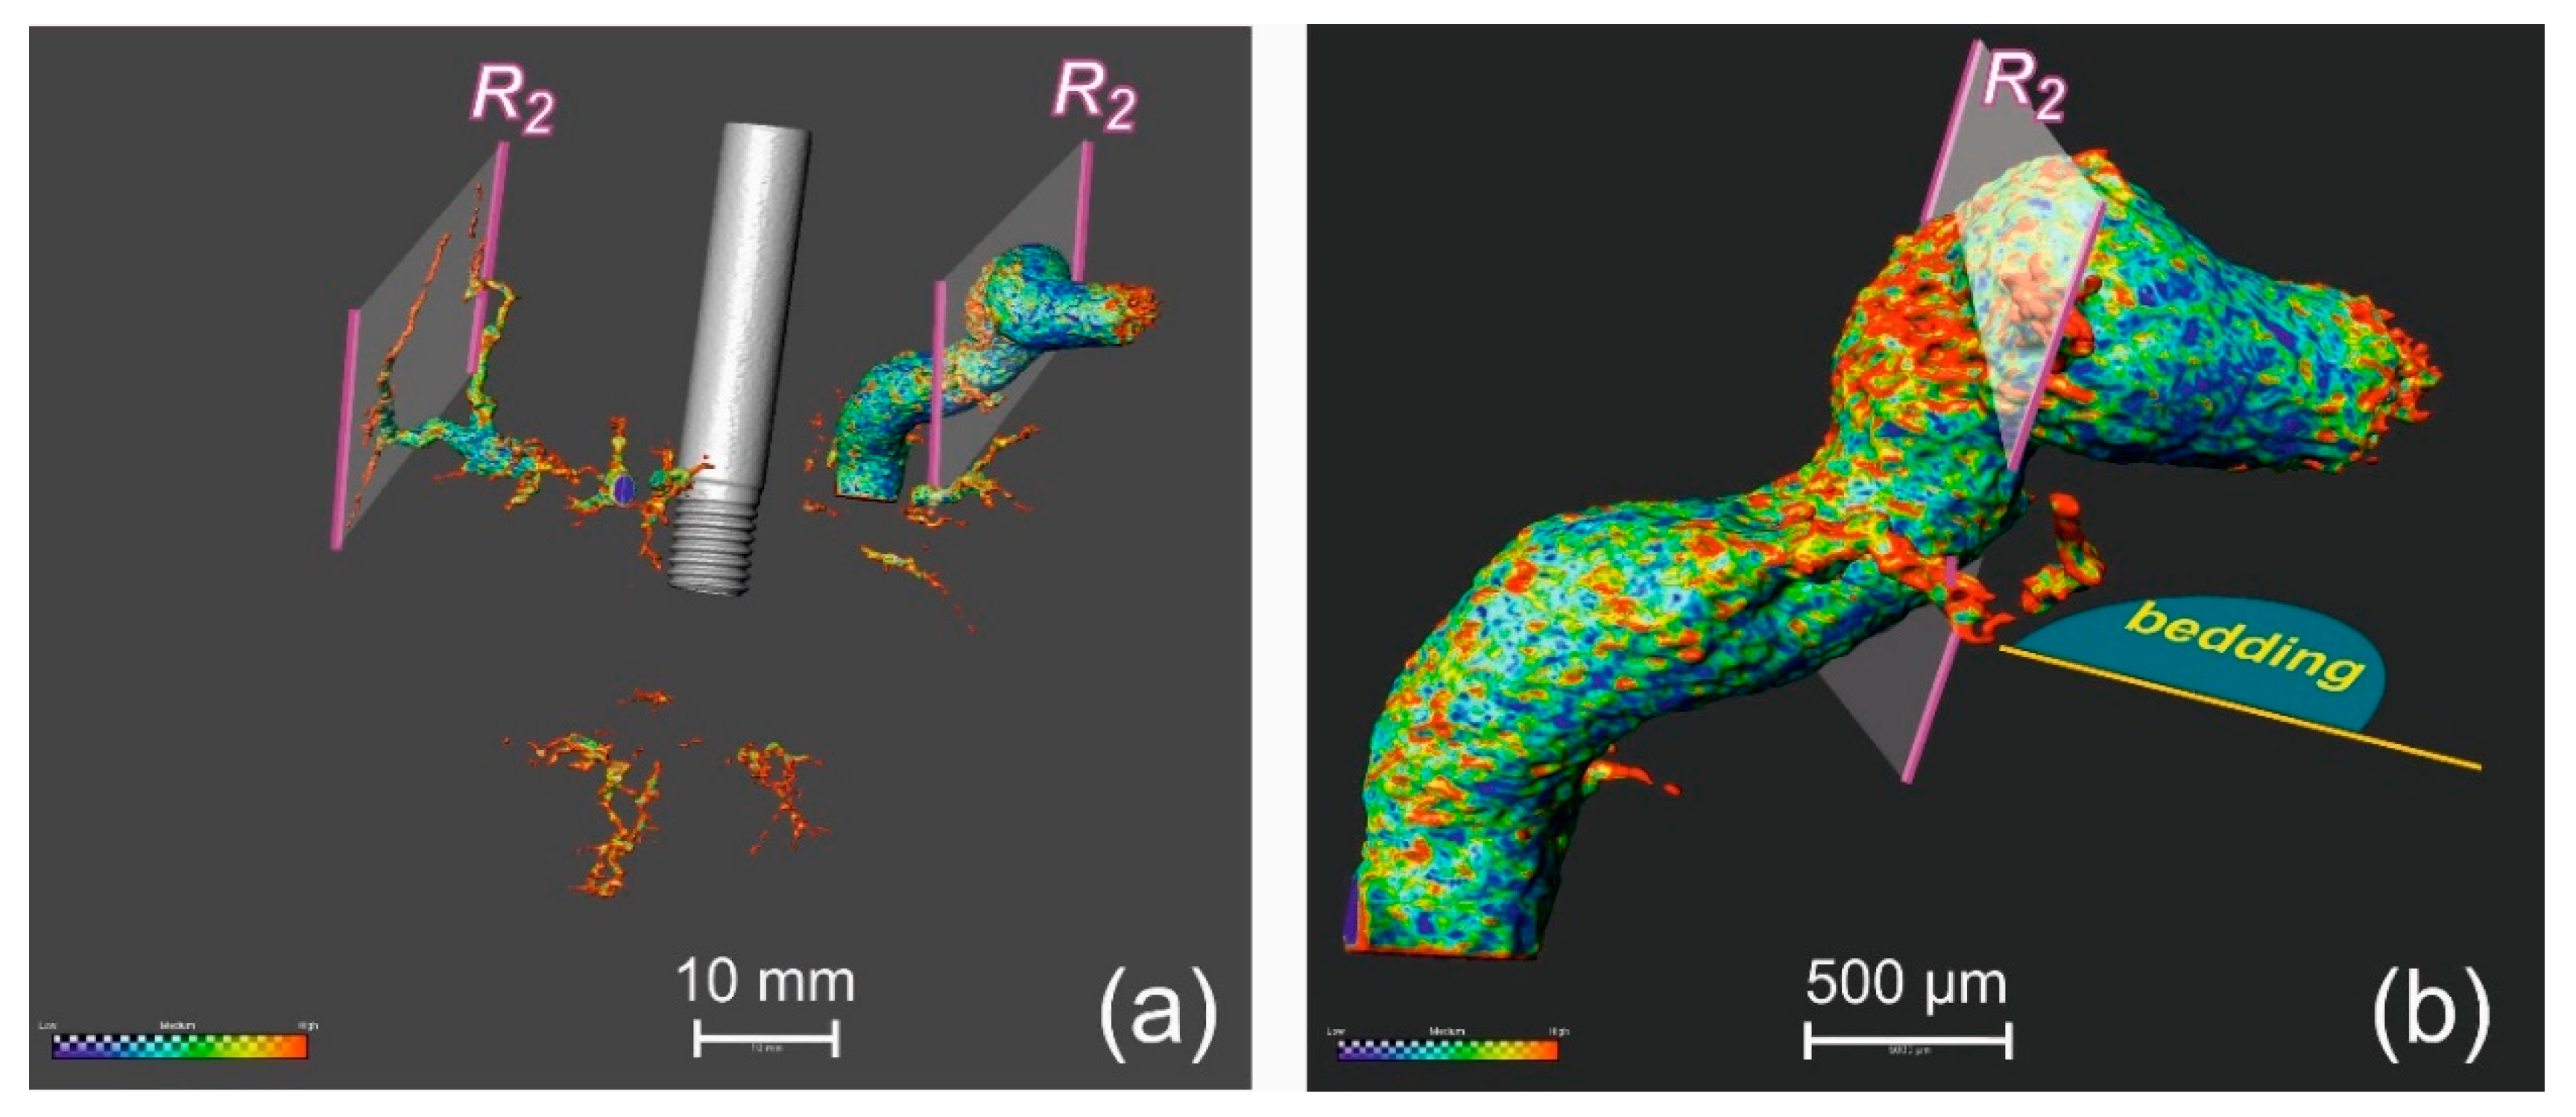
2 shears. This feature can be illustrated by calculating the 3D distribution of the mean curvature,
H, for the surfaces of the dominant wormhole and subsidiary dissolution arrays extracted from CT images for experiment #7 with following 3D visualization using Avizo software. In mathematics, the mean curvature,
H, of a surface,
S, is a measure of the surface deviation from a flat plane. First, a surface (
S), as a triangular approximation of the extrinsically segmented volumes of the entire dissolution pattern, was created. Second, the mean curvature (
H) was calculated using the formula:
where k
1 and k
2 are the principal curvatures of the curves resulting from the intersection between the surface,
S, and orthogonal planes containing the normal vectors.
An invariant under rotation, the principal curvatures were calculated considering direct neighbours to a certain triangle of the surface.
The constructed 3D model of the mean curvature distribution (
Figure 15a) indicates that highly curved (shown in red), and highly indented rough regions of the surface,
S, strongly gravitated to domains of R
2 shears, with partial propagation along bedding surfaces. Note the prominent positive anomaly of the mean curvature recorded within the node of intersection of the principal wormhole with the R
2 fracture plane (
Figure 15b), which acted as an impermeable barrier. Here, a fluid flow touched the steep dipping fracture seal, providing the hopping extension of the dominant wormhole into the upper levels, where tectonically-induced preferential direction facilitated its further growth. Irrespective of the precise mechanism controlling surface reactivity, our results indicate that, beyond the R
2 fracture domain, the surface of the wormhole is almost polished, which is why it is characterized by minimal values of the mean curvature (shown in blue).
A question can be raised concerning the difference in conductivity for conjugated R
1 and R
2 shears. Instead of the classical theory of failure mechanics predicting equitable growth of two sets of Riedel shears, physical experiments and field observations in granular rocks [
47] suggest that R
1 shears developed much better than R
2 shears. In most of the studied cases, shear failure within the strike-slip zone starts with the primary development of a set of R
1 fractures. Continuous, but narrow, zones of R
1 structures are composed of individual shear fractures, R
1, linked by transfer zones containing en-echelon arranged dilatational jogs—tensile joints and normal faults, T [
48,
49]. Closely spaced, but relatively short, R
2 fractures develop later due to secondary restraining in the spatially overlapping bridges between the already developed R
1 fractures [
47]. Therefore, R
2 fractures are usually more subjected to local stress concentration and can be interpreted as a combination of tight shears and compressive jogs (micro-thrusts) serving as damper valves for sub-horizontal fluid conduction.
This point of view explains the multiscale asperity of surfaces for the antithetic R2 shears caused by the presence of tectonically-induced slickolitic peaks and pits, which may constitute fluid-flow barriers due to their different mineralogy, thus affecting the permeability distribution—wormhole growth geometry induced by CO2-rich fluids.
Preliminary chemical analyses of Lavoux limestone within fragments of slickolitic surface of R2 shear and beyond by means of SEM TESCAN VEGA3, equipped with an N EDS detector, revealed a discrepancy in the chemical concentration of Si (1.34–2.76%), Al (1.17–2.55%), and Mg (0.24–0.59%), which were pronounced only within the R2 shear wall. The concentration of those elements beyond the fracture of the R2 shear type were almost zero.
This result supports the concept of dropping reactivity rates in experimental limestone core-plugs along the slickolitic surfaces of R2 shears. These fracture surfaces are affected by residual insoluble minerals that have already precipitated during the tectonically-driven dissolution of calcite.
Little is known about the growth process of cavities induced by aggressive fluid treatments in Lavoux limestones, especially in terms of their spatial position and morphology throughout subsequent dissolution phases. However, formation of an initial dissolution pathway parallel to the maximal compressive stress, σ
1, or in the direction of least resistance, is not surprising when considering the analogical influence of local stresses on the spatial control of opening magma-chamber ruptures and dyke injecting [
50]. Hydraulic fractures in fracking technology are of tensile origin and in-situ stress predetermines their orientation. Their propagation trends parallel to the maximum horizontal stress, σ
1 [
51]. During underground mining activity in a burst-prone coal seam, the primary elongated rock-and-gas outburst cavity is also oriented in the direction of the σ
1 axis [
52].
5. Conclusions
Numerous experimental core injecting flow tests have documented the formation of highly conductive cylindrically channelized carbonate matrix acidizing, which may result in wormholing as rapid and mostly complete tunnelling within host rocks.
This study highlights the phenomenon of the structural control of the propagation of the dissolution network, as shown by the correlation between the direction of the different wormholes and the main regional stress field. The interplay of intra-stratification, fracture systems, and their kinematical environment largely controls the dissolution pattern induced by CO2-rich fluids.
The formation of a primary dissolution pathway tends to start along a tensile fracture, T, with subsequent growth of the artificial cavity (wormhole), controlled by the existing network of fractures. The most prominent artificial “karstification” arrays propagate in volumes affected by master Y shears, synthetic R1 shears, and antithetic R2 shears.
Antithetic shears, R2, organize themselves as slickolitic surfaces, which may act as fluid-flow barriers due to their different mineralogy, thus affecting the permeability distribution—wormhole growth geometry induced by CO2-saturated solutions.
As an important and reasonable tool to document the spatial control of limestone surface reactivity and wormholing propagation, we propose using 3D mapping of the mean curvature of the dissolution array.
We conclude that inferred tectonically-triggered control of the initiation and subsequent evolution of the dissolution pattern create possibilities for the implementation of industrial CCS projects because our results seriously reduce the spatial and morphologic uncertainties in characteristic shapes for growing dissolution structures.


