Article

Managing the Agri-Food System of Watersheds to Combat Coastal Eutrophication: A Land-to-Sea Modelling Approach to the French Coastal English Channel

1
SU CNRS EPHE, Metis UMR 7619, 75005 Paris, France
2
IFREMER, Ctr Bretagne, Département Océanographie et Dynamique Ecosystème, F-29280 Plouzané, France
3
IFREMER, Ecosystèmes et Aquaculture Durable, Unité de Recherche Lagons, 98897 Noumea, New-Caledonia
4
IFREMER, Ctr Bretagne, DYNECO-LEBCO, CS10070, F-29280 Plouzané, France
5
IFREMER, Centre Atlantique, Laboratoire Environnement Ressources Morbihan-Pays de Loire, 44311 Nantes, France
6
SU CNRS, FIRE FR 3020, Boite 105, 4 Place Jussieu, 75005 Paris, France
*
Author to whom correspondence should be addressed.
Geosciences 2019, 9(10), 441; https://doi.org/10.3390/geosciences9100441
Submission received: 23 August 2019 / Revised: 3 October 2019 / Accepted: 9 October 2019 / Published: 16 October 2019

Abstract

:
The continental coastal waters of the Eastern Channel, from Normandy to Hauts-de-France, are subject to the major influence of unbalanced nutrient inputs from inflowing rivers. Several episodes of harmful algal blooms (HABs) compromising fishing and shellfish farming activities have been observed at the coast. For a better understanding of how the land-to-sea aquatic continuum functions, the GRAFS-RIVERSTRAHLER river biogeochemical model was implemented to cover the watersheds of 11 rivers flowing into this area (including the Seine) and chained with the ecological marine ECO-MARS3D model, applied to the French Northern coastal zone. Human activities strongly impact on the functioning of coastal ecosystems. Specifically, for these fertile soils of Northern France, intensive agricultural nitrogen (N) deliveries in excess over silica (Si) and phosphorus (P), essentially of diffuse origin, are potentially responsible for coastal eutrophication. Phosphorous is today equally supplied by diffuse and point sources, after a drastic reduction of inputs from wastewater treatment plants since the 2000s, and is better balanced regarding Si, as shown by the indicators of coastal eutrophication potential (P-ICEP versus N-ICEP). However, despite this drastic P reduction, HABs still appear repeatedly. Exploration of several scenarios of agro-food chain reorganization shows that (i) further progress in urban wastewater treatment to fully comply with current European regulations will not result in a significant reduction of nutrient fluxes to the sea, hence including HABs, and (ii) radical structural changes in agriculture, based on generalization of long and diversified organic crop rotations, reconnection of crop and livestock farming and changes in the human diet have the capacity to significantly reduce nutrient flows, coastal eutrophication and HABs.

Graphical Abstract

1. Introduction

Coastal areas play a fundamental role in the functioning of marine ecosystems. This strategic area is a transitional sector between terrestrial and oceanic systems, whose dynamics is the source of a wide variety of natural resources. Human activities (agricultural and urban) in the upstream watersheds and at the coast have a direct effect on the functioning of coastal marine ecosystems. Many coastal waters in the world are under the influence of river plumes and their unbalanced load of nutrients, possibly leading to harmful algal blooms (HABs) and/or hypoxia (China [1,2]; Gulf of Mexico [3,4]; Baltic Sea [5]; Adriatic Sea [6,7]; etc.). Areas of the English Channel and the North Sea are also known for their eutrophication problems [8,9,10,11]. Indeed, nitrogen (N) and/or phosphorus (P) in excess of silica (Si) in regard to diatom growth requirements are potentially accountable for marine eutrophication for most of these systems [12,13,14,15]. Whereas P fluxes have decreased significantly over the last two decades, owing to better domestic wastewater treatment, N fluxes have remained at best stable in most agricultural areas [16].
Moreover, for several years, different sites of the English Channel and Atlantic coast (Seine Bay, Brest Bay and South Brittany) regularly face HABs occurrences, especially microalgae such as dinoflagellates (Dinophysis spp. [17]) and diatoms (Pseudo-nitzschia spp. (PSN), [18,19,20,21]) in the Seine Bay, the Bay of Brest and South Brittany, but also macroalgae in the south on the Brittany coasts (Ulva spp., [22]), and mucilaginous algae north of the English Channel and the Southern Bight of the North Sea (Phaeocystis spp., [10]).
Pseudo-nitzschia is a cosmopolitan genus regularly observed along the coast of the Eastern Channel and Atlantic (as revealed by the French microphytoplankton monitoring network, REPHY) and is responsible, under certain conditions, for domoic acid (DA) production which is an amnesic neurotoxin ASP (amnesic shellfish poisoning). This toxin is accumulating in the food chain. Shellfish in particular, filtering toxic phytoplankton, can store the toxin in great quantities in their digestive gland (hepatopancreas). This toxin is not harmful for shellfish but causes harm to humans (as well as marine mammals and birds [23,24,25]) consuming it. Several periods of toxic phytoplanktonic blooms in the Bay of Seine affecting fisheries and shellfish activities have been observed. In particular, scallop fishery is greatly impacted by toxic events because, contrary to other filter shellfish, the scallop takes a very long time to decontaminate [26,27]. Two ASP toxic events that occurred between 2004 and 2011–2012 in the eastern English Channel affected scallop fishery in the Seine Bay and induced partial or total closure of fisheries [20].
The presence of these microalgae is concomitant with a dissolved inorganic N excess with regards to the dissolved Si or P. Indeed, DA production has been linked to a low cellular quota of Si [28,29].
The impact on the Seine watershed and the coastal zone of the Seine Bay were previously represented by chaining river and estuarine or coastal zone models, and the effects of nutrient load reduction scenarios have been explored [30,31,32,33,34,35]. These previous studies showed the ability of the models to reproduce the main trends in nutrient loads and algal bloom development in this area. They also pointed out the substantial decrease of P loads and the stability in N loads during the past two decades. Furthermore, the coupling of a watershed model and a marine ecosystem model enables exploring scenarios to evaluate the effect of changes within the river basin at the coastal zone.
Whereas the effect of point source reduction due to improvement of treatments in wastewater treatment plants (WWTP) is relatively easy to take into account, agricultural scenarios are more complex to translate in a modelling approach, and their design might require many actors (e.g., politicians, stakeholders, citizens) to debate and arbitrate among several not only technical options, but possibly radical changes in the agri-food system. Participative workshops have made it possible to build scenarios evolving and modifying agricultural practices and systems, with various actors from the watershed area, but also from the coastal territories. Regarding agriculture, a radical change scenario envisaged a complete re-organisation of the agri-food chain, with a generalisation of organic farming practices making farmers autonomous by stopping the use of chemicals and the import of feed, as well as reconnection of livestock and agriculture and a change in the human diet (A/R/D scenario) [36].
A Pristine scenario was also built considering watersheds completely devoid of human activity, ensuring a kind of zero disturbance state, characterised as “natural”. The “back to the 1980s” scenario aimed to show what the situation would be if no public policy had been implemented for the last 40 years in the field of wastewater treatment or in agricultural practices. The WWTP scenario was intended to assess the progress that can still be made by completing the already advanced implementation program of the Urban Wastewater Directive (UWWD EU [37]).
The first aim of this study was to analyse the potential link between nutrient load and the HABs, particularly PSN, and their occurrence in the Channel coastal area. The second objective was to simulate the spatio-temporal distribution of phytoplankton in the Eastern Channel and Seine Bight under the influence of direct contributions of most adjacent drainage networks from Normandy and Hauts-de-France. Specifically, we wished to analyse the responses of the PSN genus to nutrient deliveries for the 2002–2014 reference period, while also testing the impact of the abovementioned scenarios on coastal eutrophication and associated PSN toxicity that recurrently led to the closure of shellfish fisheries, with severe socio-economic consequences. We believe that these results could help watershed authorities to improve the management of the scallop fishery and find strategies to reduce HABs and, more generally, eutrophication.

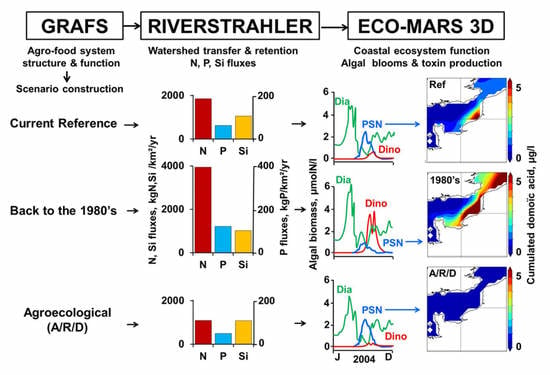
2. Development of A Modelling Chain for Aquatic Continuums: From River Headwaters to Coastal Marine Ecosystems

Three types of models were developed and then chained during this project: (i) a regional agro-food system model linking food production in the watershed to nutrient losses to surface water; (ii) a river network model able to provide nutrient flows at the outlets of the main rivers and streams; and (iii) a model of the coastal marine ecosystem, fed by these riverine flows of nutrients and making it possible to simulate the temporal and spatial distribution of microphytoplankton. Until now, the model chain was essentially applied to the single drainage network of the Seine River [32,34,38], but here the river model was extended to all the coastal rivers of Normandy and Hauts-de-France (Figure 1).

2.1. The GRAFS Model

The Generalized Representation of Agro-Food System (GRAFS) [31,39] is an accounting and modelling tool able to calculate N, P and C fluxes among the main compartments of the agricultural system of a given territory, including the nutrient losses to the hydro system. It can be used in accounting mode to derive nutrient fluxes from data on agricultural structure and production issued from official statistics (namely, in this study, the French Annual Agricultural Statistics (http://agreste.agriculture.gouv.fr/donnees-de-synthese/statistique-agricole-annuelle-saa) for the year 2006), or in modelling mode, for designing coherent agro-food systems corresponding to the story-lines of prospective scenarios as described, for instance, in Billen et al. [39].
The calculation of diffuse inputs of nitrate to surface water through leaching of arable and grassland is based on the estimate of N surpluses, calculated as the difference between N inputs to the soil and N export through harvest. For cropland, leaching flow was estimated to account for about 70% of the surplus, taking into account the frequency of catch crops before spring crops [40,41] (Figure 2). For grassland, the leaching is considered very low as long as the surplus remains below a threshold of 100 kgN ha−1 yr−1 [31].

2.2. The RIVERSTRAHLER River Model

The RIVERSTRAHLER is a biogeochemical model describing the transfer of nutrients from the terrestrial systems of a watershed to the outlet of the river system, imbedded into a GIS environment, Seneque [42]. It allows the calculation of flows and water quality variables at any point in the aquatic continuum based on a number of constraints characterising the watershed, namely, the morphology and hydrology of the river system and the point and diffuse sources of nutrients. River flow information was provided by the Ministry for Ecology and Sustainable Development through the French national hydrologic databank (Banque HYDRO, www.hydro.eaufrance.fr) (Table 1). Data were averaged at a daily time step and then broken down into surface runoff and base flows, using the Bflow recursive filter [43,44] for the method and informatics program, respectively). Surface runoff and base flows were generated using observed discharge time series at 54 (Normandy) and 18 (Hauts-de-France) gauging stations for the 2002–2014 period, for each sub-basin considered for the modelling project.
Urban point source loadings were derived from the databases of the water agencies (Agence de l’Eau Seine-Normandie and Agence de l’Eau Artois Picardie) and took into account progress achieved in wastewater treatment during the simulation period (2002–2014). Diffuse inputs were calculated by the GRAFS model, taken into account land use and agricultural practices. For the purposes of the study, the version of the RIVERSTRAHLER used included the latest developments for taking into account N retention in riparian zones [45].
Seasonal variations of the ~30 water quality variables calculated by the model are provided with a temporal resolution of 10 days (i.e., 36 values over the annual cycle), although biogeochemical processes are calculated at the 6 min time step. Among these variables, the major ones used here for feeding ECO-MARS3D were nutrients represented as N (ammonium -NH4-, nitrate -NO3--), P (total P, phosphates -PO4--), Si (dissolved -DSi- and biogenic -BSi-), and suspended solids (SS) (see [46,47]). Other calculated variables such as oxygen, carbon (six classes of biodegradability), phytoplankton biomass (chlorophyll a (Chla), distributed among three freshwater phytoplankton groups, i.e., diatoms, Chlorophyceae, and Cyanobacteria), bacteria, zooplankton, etc., will not be shown here (see [48]). The living biomass present in the flows of fresh water into the sea is considered to die once in contact with sea water (according to a salinity-dependent mortality process) and to transform into organic N and P detritus pools managed by the ECO-MARS3D.
The domain taken into account by the river modelling approach comprised 11 rivers and covered an area of ~93,000 km2, including the Seine River (79% of the surface area and 90% of the population) and the Somme River, the second largest of the domain (Table 2).

2.3. The ECO-MARS3D Coastal Zone Model

The ECO-MARS3D is composed of a three-dimensional hydrodynamic model called MARS3D (3D Hydrodynamical Model for Application at the Regional Scale) described by Lazure and Dumas [49] to which was coupled a biogeochemical module. A complete description of the hydrodynamic core of this model as well as the different modules (e.g., sediment dynamics, biogeochemistry) can be consulted on the following website: http://wwz.ifremer.fr/mars3d/Le-modele/Descriptif/. Since the late 1990s, the biogeochemical module has been continually improved [17,38,50,51,52]. Among the major elements that are essential for building up living matter, N, Si and P are considered (i) in their mineral form, (ii) included in the living matter and (iii) in their detrital form. The biogeochemical model is therefore an NPZD model (nutrients, phytoplankton, zooplankton, detritus). For dissolved mineral N, a distinction is made between NH4 and NO3; the nitrite form (NO2) is ignored. The phytoplankton compartment is currently represented by three variables: diatoms, for the most part in the mid-spring, dinoflagellates, especially visible in summer and autumn, and nanoflagellates, more transient [53]. All types of microalgae are expressed in the model as their N content.
Here, a specific module was implemented to represent the particular category of diatoms, the genus Pseudo-nitzschia. The PSN module included in the general ECO-MARS3D model thus introduced a new competitor for nutrients and light for the other categories of phytoplankton. It is not yet clear whether all species of PSN produce DA (see [54,55,56,57] for different points of view). Of all species, one of the most toxic would be Pseudo-nitzschia australis [58]. Despite several differing results, we adopted Klein et al.’s [59] hypothesis considering that DA only appears at the end of the growth phase, as soon as Si becomes limited in regard to P or N [29,60]. The basic assumption of the Davidson and Fehling model [29] is that DA is produced by cells as soon as their Si/N or P/N quota falls below a certain threshold.
Here, we retained only a varying Si/N quota by adding to the current nitrogen state variable a second state variable describing the silicic content of Pseudo-nitzschia. The current growth limitation of Pseudo-nitzschia by silica is then given by a Droop function of intracellular Si quota:
f S i   =   q S i     q S i m i n q N u t S i
(qSimin = minimum silica quota for Pseudo-nitzschia)
The uptake of dissolved silicate from ambient seawater is given by a Michaelis-type function:
v S i   =   v m a x S i S i K S i   +   S i
For temperature effect on growth, a new development was based on the observations by Thorel et al. [61], who showed that the effect of temperature on the growth of the species Pseudo-nitzschia australis followed the asymmetric law of Blanchard et al. [62] rather than the normal law (as in Pénard [60]).
f T   =   [ m a x ( 0 ,   T l e t h a l T ) T l e t h a l     T o p t ] β e β [ m a x ( 0 ,   T l e t h a l T ) T l e t h a l T o p t     1 ]
using β = 0.6 for Pseudo-nitzschia
This new formulation tightens the temporal window of PSN appearance in late spring/early summer (June–July) by delaying growth in early spring and by severely limiting it in summer when temperatures exceed 17–18 °C.
Pseudo-nitzschia diatoms sink at a settling rate depending on their nutrient status (as bulk diatoms, see [52])
Equations for Pseudo-nitzschia state variables are provided in Table 3, along with the parameter values used in this simulation. A more extensive description and validation of this model component will be provided in Ménesguen et al. [63].
Pseudo-nitzschia nitrogen content XpsnzN (µmol N·L−1)
d X p s n z N   d t = f T [ µ m a x p s n z min ( f N p s n z , f S i p s n z , f P p s n z , f L p s n z ) m p s n z ] X p s n z N   τ p s n z m e s o z o o µ m a x m e s o z o o f T [ 1 e γ m e s o z o o ( P r e y m e s o z o o t h m e s o z o o ) ] X m e s o z o o
Pseudo-nitzschia silicon content XpsnzSi (µmol Si L−1)
d X p s n z S i   d t = ν S i X p s n z N   f T m p s n z X p s n z S i   q S i p s n z τ p s n z m e s o z o o µ m a x m e s o z o o f T [ 1 e γ m e s o z o o ( P r e y m e s o z o o t h m e s o z o o ) ] X m e s o z o o
Domoïc acid concentration (ASP toxin) in suspended matter XAd (µg·L−1)
d X D A   d t = r D A [ f S i p s n z < f S i _ t h ] X p s n z N   d D A X D A   The   current   Pseudo-nitzschia   silicium   quota   is   given   by :   q S i p s n z = X p s n z S i   X p s n z N   .
Taking into account the 12 years studied and the need for many calibration runs over a domain wider than the region of interest (in this study, the model was run over the MANGA domain defined by Ménesguen et al. [51], covering the whole French Atlantic continental shelf and the English Channel), a rather coarse horizontal resolution with 16 km × 16 km square meshes on each side was adopted to run the ECO-MARS3D model allowing a realistic simulation of the main regions of the shelf ecosystem. The vertical dimension is represented by 30 sigma layers in the water column and no explicit sediment layer; bulk benthic detritus were simulated as state variables fixed in the bottom water layer (see [51]). Boundary conditions for all biogeochemical state variables are managed as null gradient conditions at the oceanic and North Sea frontiers of the MANGA domain, whatever the scenario used for terrestrial nutrient loadings. A two-year spin-up is made before the 12 year simulation for each loading scenario.
The ARPEGE meteorological model from Météo-France provided the fields (every 6 h with a 0.5° spatial resolution) necessary to force the model ecosystem (wind, atmospheric pressure, air temperature, cloud cover, relative humidity). The main continental nutrient inputs from rivers were taken into account over the whole study area and came from the simulations provided by the GRAFS-RIVERSTRAHLER model.

3. Nutrient Fluxes Delivered at the Coast

The use of modelled riverine input flows (instead of measured flows) for marine ecosystem simulations was necessary for at least two reasons:
(i) Sufficiently frequent observation data were not available for all rivers and for all the years of the chronicle we wished to study. A modelling approach was therefore closely adapted to reconstruct a complete and homogeneous series of nutrient fluxes delivered to the Seine Bay and the Channel.
(ii) The desire to study the effect of modelled scenarios requires a reference situation calculated according to the same procedures as for the simulated scenarios.
Interestingly, the modelling approach used here was based on the representation of deterministic processes and did not use calibration procedures, so that the differences between simulations and observations resulted either from incomplete process representation or poor knowledge of the constraints on the system (or both). Regarding GRAFS-RIVERSTRAHLER, our knowledge of diffuse sources (agricultural soil N balance, lithology, etc.) and point sources (database from the Seine-Normandy and Artois Picardy water agencies) was necessarily imperfect, as was true for boundary conditions of ECO-MARS3D.

3.1. Inter-Annual Variations of Riverine Water Flow and Quality

Simulation of seasonal variations in water flows and concentrations were provided for the outlet of the two largest rivers (the Seine and Somme rivers) and compared to the available data observed at the same stations (Figure 3).
To evaluate the model results, we calculated (i) the normalised RMSE (NRMSE) and (ii) the relative bias, for inter-annual variations per decade and for the values of the major variables (see Figure 3, Table 4). Both are expressed as a percentage, NRMSE representing the variability of the model results with respect to the observations, normalised to the variability of the observations, and the relative bias indicating an over- or underestimation of the observations by the model simulations.
As hydrology is the primary determinant of seasonal and inter-annual nutrient flow variations, it is important to correctly simulate water flows. The simulations of water flows compared very well with the observations (NRMSE = 5% and 6%; Bias = −7% and −1%, respectively, for the Seine and the Somme (Table 4)). Note that the water flow simulations were based on the daily observations of discharge, for about 15 years with the hydrological stations distributed in the basin, that were broken down into surface runoff and base flows. The reconstitution procedure was therefore perfectly validated here.
Variations in the concentration of suspended solids are essentially controlled by the water flow rate, through bottom erosion and sedimentation processes, which are difficult to model at the scale of a complete hydrographic network. Nevertheless, the model reflected the general trends of the observed variations (NRMSE = 16% and 15%; Bias = 23% and 6%, respectively, for the Seine and the Somme).
Changes in wastewater treatment over the past decade (implementation of nitrification, then denitrification [64]) explain the inter-annual variations in ammonium. Inaccuracies in the documentation of these changes in our database probably led to the dispersion of the observed values around a general trend that was correctly reflected by the model, however, except at the end of the period studied, when the simulation was not as good (Figure 3). Seasonal and inter-annual variations in total P are mainly related to urban inputs from wastewater treatment plants (WWTPs) and notably changed during the period studied with improved WWTP processing [65]. These changes over the 2002–2014 period complicated the model results for both ammonium and P because input provided by the water agencies was not necessarily robust in this moving context. The overall percentage of variation was higher on the Seine where major changes occurred than on the Somme (NRMSE = 41% and 7%, respectively), while no significant systematic bias was observed (7% and −28%).
Simulating algal development, characterised by episodic and transient blooms in rivers closely linked to variations in hydrology but also to biological control by nutrients and predation, remains a major challenge. Whereas the model generally simulated the appearance of blooms and their amplitude quite well, bloom episodes were simulated in 2012 and 2014 but not always observed (see [65]). An overestimation of the calculation was, therefore, found (Bias = −33%), with a reasonable variability (NRMSE = 18%) (Table 4). No values were available for the Somme River.
Silica concentrations, which depend on the lithology of the watersheds and uptake by diatoms blooms, resulting in significant Si depletions, compare fairly well with the observed values. Our simulations adequately reflected the winter level, but because the simulation of the episodes of phytoplankton blooms was more difficult, Si depletion occurred with a short time lag, which explains the variability (NMRSE = 25%). However, on the whole, the bias was relatively low (7%).

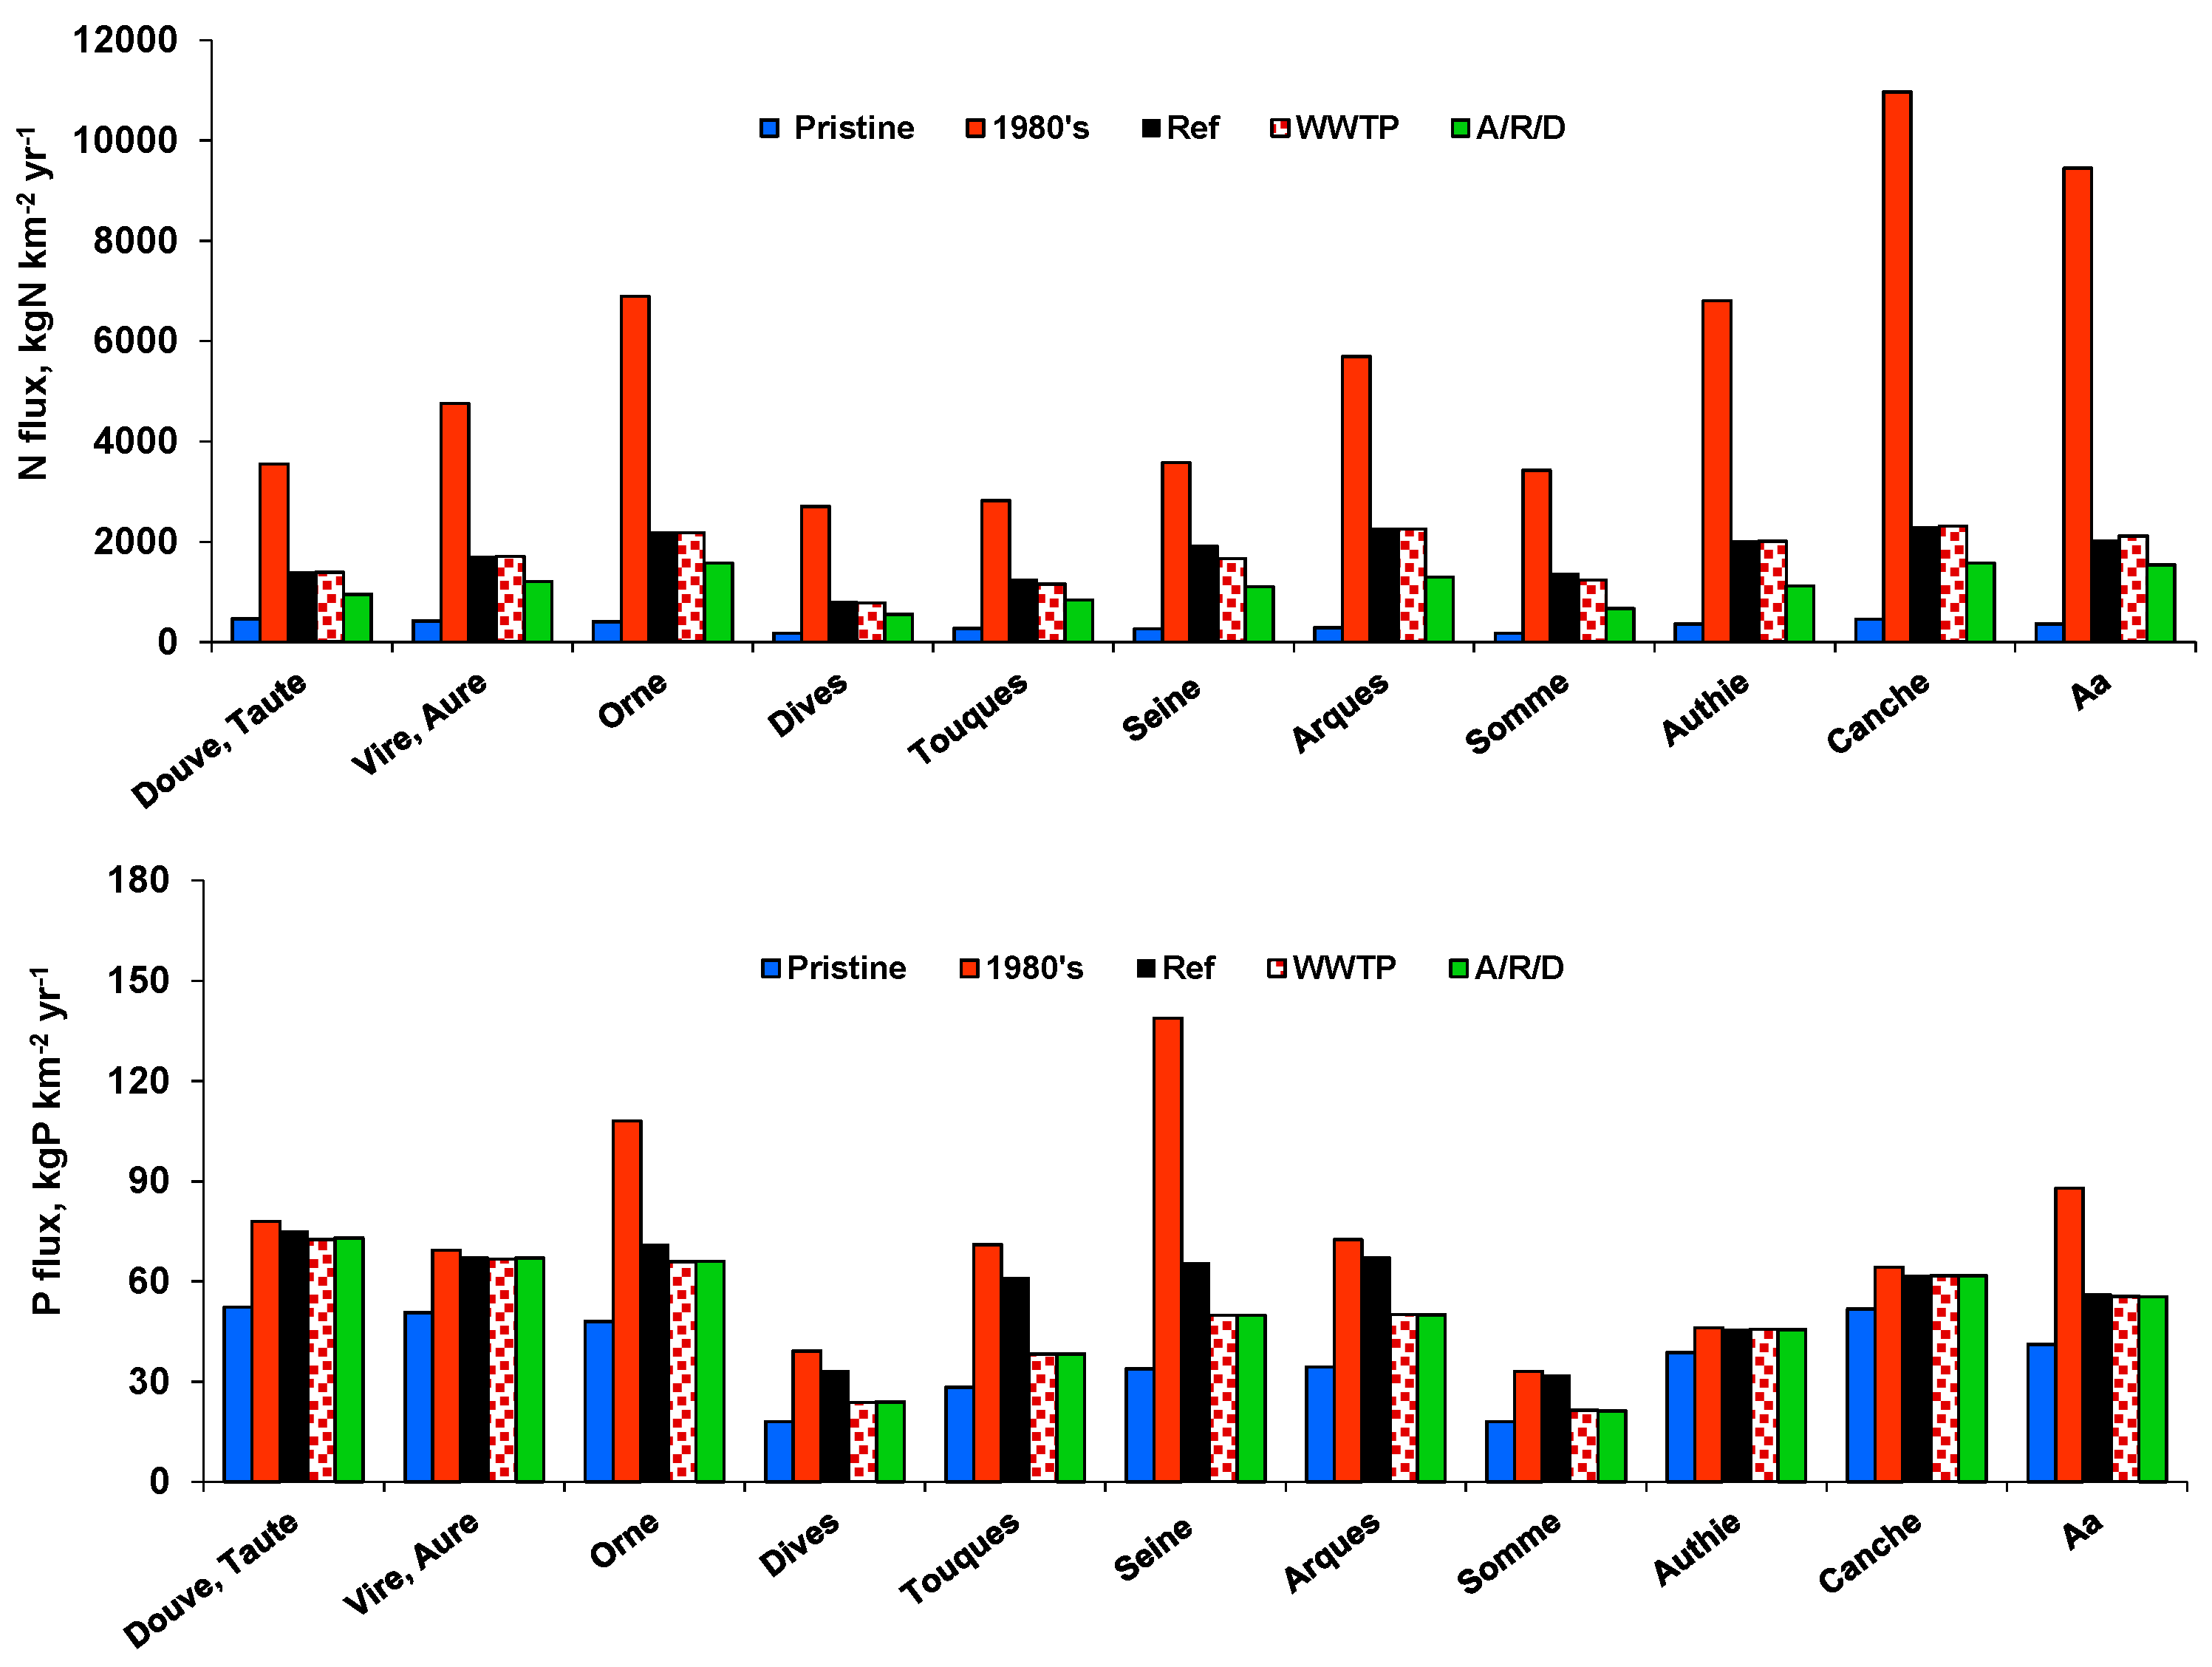
3.2. Fluxes Delivered to the Coastal Zones

The average annual N and P fluxes calculated at the outlet of the main rivers of the domain are presented in absolute value and per surface area of the river basin (Table 5 and Figure 4, respectively). Due to its drainage surface area and water discharge, the Seine River delivered 82 and 83% of the total N and P fluxes, respectively, compared to the 2.8 and 3.4% from the Somme River, the second largest of the domain, and to the 0.7 and 1.1% from the smallest Arques River (Table 5). The differences in total Si flux were less pronounced (71% for the Seine, 5.7% for the Somme, and 1.7% for the Arques), with Si taken up by diatoms in the Seine probably higher, due to the longer residence time allowing diatom growth; diffuse Si fluxes from rock weathering were otherwise similar.
In complement to the absolute value of the N, P, and Si fluxes, specific fluxes per km² of surface area allow one to visualise the human pressures over the basins in a comparative view (Figure 4). Except for the Somme basin, all coastal rivers of the Hauts-de-France coast tended to show higher N pressure than the Normandy rivers, with the exception of the Orne River, reflecting the more intensive agriculture in Hauts-de-France than in Normandy. Conversely, P pressure would seem to be lower for Hauts-de-France rivers than for Normandy rivers. Overall, the differences in specific fluxes varied at a ratio of 2.8 and 2.4 for N and P, respectively. The ICEP (indicator of coastal eutrophication potential) [14,16,66] calculates the nitrogen (N-ICEP) or phosphorus (P-ICEP) excess in regard to Si with respect to diatom growth requirements according to stoichiometry [67,68]; it is expressed in mgC per day and per km² of catchment area and, therefore, corresponds to the amount of non-siliceous algal biomass likely to be produced after Si has been exhausted. The risks of eutrophication are limited when the ICEP takes values that are close to zero or negative (Figure 5). Interestingly, N-ICEP was systematically largely positive for all the rivers, indicating a strong eutrophication potential due to an N excess over the area studied. In contrast, except for the Seine River, P seems not be in excess in regard to Si, as indicated by negative P-ICEP values, with P the limiting element.

4. Impact of the Riverine Nutrient Deliveries at the Coastal Zone

4.1. Coastal Water Quality and Model Evaluation

To ensure that the ECO-MARS3D model correctly represents the environmental conditions at the chosen resolution of 16 km × 16 km, the main hydro-biological variables were compared to the measurements available at two stations in the Seine Bay (i.e., Géfosse and Antifer) and one near Dover Strait (Dunkerque) over the 2002–2012 period (see Figure 1). For these stations, simulated seasonal cycles as well as the levels of the major water quality variables (i.e., temperature, salinity, nutrients, chlorophyll) were in good agreement with the observations over the entire period, even if greater differences existed for some years (2003 in particular) (Figure 6).
The ECO-MARS3D coastal marine model was evaluated in a way similar to the GRAFS-RIVERSTRAHLER model (Table 6). The percentage of NRMSE (variability) was about 15–20% except for temperature at Antifer (27%) and Silica at Dunkerque (23%). Bias was not systematic, except for phosphate underestimated by the model; bias was the lowest (<10%) for temperature and salinity (Table 6). For the other variables, bias was about 30% (either positive or negative).

4.2. Pseudo-nitzschia Simulations

The simulated Pseudo-nitzschia N biomass was converted in abundance (1 μmol L−1 N = 1,000,000 cells L−1; [69]) for a quantitative evaluation of the Pseudo-nitzschia module. The evolution over the 11 years of PSN observed and simulated abundance (Figure 7a) compared with observations showed that the model accurately simulated the maximum levels (~2,000,000 cells L−1). However, calculated PSNs were overestimated in winter with a simulated abundance of 10,000–50,000 cells L−1, while no cells were detected by microscopic counts. Focusing on an average seasonal distribution (2002–2012), PSN abundance simulated at the Antifer station showed an adequate trend with an overall maximum from June to August (Figure 7b). However, a short bloom generally occurs in February according to REPHY counts, which was not simulated by the model, while the model simulated a regular decline in the bloom rather than the net abrupt decline shown by the observations (Figure 7b).

5. Exploring Different Scenarios in the Land-to-Sea Continuum

The modelling approach of the GRAFS-RIVERSTRAHLER model made it possible to evaluate the effects on riverine nutrient fluxes (averaged over the 2002–2014 period) delivered to coastal areas for the five scenarios constructed (Figure 8). The difference between the results for the Pristine and 1980s scenarios can be seen as two extreme situations, respectively, without human impact and with a maximum effect at a time when wastewater was collected in WWTPs but discharged without sufficient treatment. The 1980s also corresponded to a maximum amount of fertiliser, although the inertia of aquifers (not taken into account in these simulations) has probably partially masked the subsequent evolution, since equilibration between soils and aquifer was probably not reached. Therefore, the 2002–2014 reference period studied (Ref scenario) was more marked by measures related to point source pollution, i.e., a completion of WWTP upgrading for P (dephosphatation) and N treatments (nitrification and denitrification). A pursuit of wastewater treatment improvement (see the WWTP scenario) would no longer have much effect on N and P fluxes, both because this upgrading was already largely effective (see Ref scenario) and because diffuse N inputs dominated over point inputs, while point P sources decreased to the level of the P diffuse inputs, rather low in this lowland region with small erosion [70]. With the A/R/D scenario, N flux would indeed be lowered by a further 20% and would decrease the N-ICEP risk of eutrophication by 30% (Table 7). This indicates that, to go further in reducing N diffuse inputs, more radical changes in the entire agri-food chain would be necessary. Regarding P, a 22% flux decrease could be, however, expected from the WWTP scenario, without further changes for the A/R/D scenario, which only concerned N. The P-ICEP, still positive at the outlet of the Seine for the Reference situation (i.e., 1.7 gC km−2 d−1, approaching zero, compared to 10.3 gC km−2 d−1 for the 1980s scenario), switched to below zero for a full compliance of the UWWD EU [37] (WWTP scenario), indicating a good P:Si nutrient balance and, hence, no risk of eutrophication with respect to P (Table 7).
Whereas inter-annual fluctuations differed in terms of the dinoflagellate biomass between 2002 and 2014, with a decrease since 2007 (see the Reference situation curve, Figure 9), the diatom biomass fluctuated around 4 µmol N L−1 with a contribution of about 25% PSN, which episodically produced DA, with the highest concentrations in 2002 and 2004 (20 and 50 ng L−1, respectively) and low values for the other years (<5 ng L−1). In the Pristine scenario, dinoflagellates did not develop, and the diatom biomass was reduced by a factor of 2, while the proportion in PSN remained the same. However, no productio of DA was shown. The 1980s scenario showed a large increase in dinoflagellates, especially during the middle half of the period studied, following the seasonal trend of the Ref scenario. Whereas diatom biomass increased, PSN accordingly decreased, but produced more DA, probably because of a strong Si limitation. The A/R/D scenario, which would prevent dinoflagellates from growing, would maintain a diatom biomass level similar to the reference, including PSN, which did not, however, produce DA (Figure 9).
Although the simulated average spatial distribution of DA (cumulated over the period) showed higher values in the upper Normandy section, DA was spread over the entire coastline for the 1980s scenario, while values appeared very low in both the Pristine and A/R/D scenarios (Figure 10).

6. Discussion

6.1. Pseudo-nitzschia, Potentially Toxic Diatom Algae at Low Silica Concentration

Two emblematic health crisis episodes due to the growth of toxin-producing Pseudo-nitzschia occurred in 2004 and 2011 ([19]; IFREMER data), although, in 2011, DA concentrations in the water remained low despite high accumulation in molluscs. During these two periods, production of the DA neurotoxin led to the closure of scallop fishing, because contaminated scallops were unsuitable for human consumption.
Based on the literature and as taken into account in the PSN module, PSN develops when Si is low [28,29]. Indeed, marine concentrations of dissolved Si during the summer period were low in 2004 and 2011 (8 and 4 µmol L−1 in 2004 and 2011 versus 12 µmol L−1 on average for the other years). Silica concentrations were also low in the Seine River from April–May, at the start of the PSN bloom (i.e., 0.83 and 0.31 mgSi L−1 in 2004 and 2011, respectively), although low values were also found in 2009 with no toxicity problem to our knowledge, the threshold for PSN development/toxicity was likely not exceeded. For the rest of the years studied, spring riverine Si averaged 2.7 mgSi L−1; 2004 and 2011 were also characterised by rather low water deliveries, resulting in very low Si flows from the catchment areas. A low regeneration of biogenic Si, trapped in the bottom layer of river sediment, reservoirs, and coastal water after diatom sedimentation could also explain Si deficiency [71,72].
Moreover, nutrient imbalance, as shown by largely positive N-ICEP, would mean an excess of N in regard to Si, differently from P-ICEP, close to the required stoichiometry. Following the Davidson and Fehling model [29], DA is produced by cells with a low Si/N and P/N cell quota reflecting low ratios in water. With a rather good balance between P and Si, we can assume that these conditions were met for both PSN blooms and their toxicity, i.e., an excess of N over Si and over P. Whereas depleted Si favour PSN, N would foster DA [73,74], with more toxicity with urea than NH4 or NO3 [75], even though several other controlling factors can be found [69,76,77,78]. The PSN module, which mathematically formalised PSN growth and DA production on these bases, together with a refinement of the relationship of physiology to temperature ([61], was used for the first time and adequately reproduced the observations.
The ICEP indicator was originally developed [14] to express the conditions for non-diatoms, HABs such as dinoflagellates [34] or Phaeocystis [10] appearing in the case of high P- and/or N-ICEP (i.e., Si depletion) instead of desirable diatoms.
The development of potentially toxic diatoms such as PSN challenged the significance of the concept behind the ICEP indicator. In fact, the concept remains valid because the development of PSN diatoms and their toxin production is considered a step in the algal successions and gradual Si depletion, from palatable diatoms in early spring to undesirable toxic PSN during the mid-spring/summer period when the water temperature fits with PSN optimal growth [79]. When Si is exhausted, diatoms and PSN are replaced by non-diatom algae, possibly harmful as well (e.g., mucilaginous, dinoflagellates).
The PSN module, however, does not take into account the variety of PSN species with different behaviours in producing toxins [80].

6.2. A Model Chain for the Land-to-Sea Continuum

Since the 2000s, the RIVERSTRAHLER-ECO-MARS3D model chain has been incrementally improved. In the study reported by Cugier et al. [32], only the Seine Basin and the Seine Bight were considered for a 10 year period (1989–1998), simulating the impact of riverine delivery in terms of nutrients and phytoplankton (diatoms and flagellates). This impact was retrospectively and prospectively modelled, with the prospective view based only on treatment improvement in WWTPs. Wastewater inputs into the river were a major problem for water quality in the river and at the coast before the implementation of the EU-WFD [81]. Already at that time we showed that dry years with Si deficiency were characterised by summer dinoflagellate blooms (Dinophysis spp.), whose toxicity was regularly reported beginning in the 1980s [82]. More recently, the study domain was enlarged to include the major watersheds of the Normandy coast simulating the 2000–2006 period during which treatments in WWTPs were upgraded for P and organic carbon load [34]. Scenarios were also explored for the new implementation of N treatment in WWTPs (nitrification in 2007 and denitrification in 2011) and a simplistic and unrealistic scenario for agriculture, showing an impressive response by the model chain. This involved a drastic reduction of the dinoflagellate blooms along the entire Normandy coast, in particular in the Orne Bight, a protected natural area, and in the Veys Bight (impacted by four major modelled rivers: the Douve, Taute, Vire and Aure), designated a regional natural park and a Ramsar site where scallop fisheries are also emblematic. In the present study, the model chain not only covered the previous Normandy domain, but also the Hauts-de-France coasts (see Figure 1, Table 2), strongly influenced by the Seine River, marine currents being mostly oriented to the North, to the English Channel and the Southern North Sea [83]. The French authorities were required to reduce the Seine nutrient fluxes, especially N, to improve the water quality of neighbouring countries and even sanctioned by the European Court of Justice. This required adequate implementation of the EU Nitrate Directive (91/676/ CEE [84]).
The chain of models, from head-river waters to coastal zone, GRAFS-RIVERSTRAHLER-ECO-MARS3D is now well adapted for simulating eutrophication problems along the French northern coastal zone, taking into account the riverine nutrient deliveries, as linked to the major human pressures within the watershed, i.e., point sources from WWTPs and diffuse sources from agriculture.
Regarding the algal communities, RIVERSTRAHLER considers three groups of algae, among which diatoms dominate spring blooms, as commonly observed in rivers, whereas Chlorophyceae take over the diatoms when Si is depleted and the temperature increases [46,47]. Cyanobacteria do not find conditions for their development in rivers in the North of France; the model results are in accordance with the observations. The ECO-MARS3D also considers three groups, the diatoms, including PSN and dinoflagellates, thus accurately accounting for the major phytoplankton functional groups in the domain studied and the associated toxin problems, although complex physiological plasticity of phytoplankton, such as mixotrophy of dinoflagellates or variations in their stoichiometry are not taken into account [85].
Typically, the GRAFS-RIVERSTRAHLER nutrient fluxes represented the terrestrial forcing for ECO-MARS3D. These nutrient deliveries are the result of the nutrient inputs (N, P, Si) from the watershed and their transfer and transformations in the drainage network. The 2002–2014 period was specifically characterised by significant changes in pressures. Domestic point sources have been considerably reduced since the application of the EU-WFD in the 2000s, especially for P and ammonium loads [64,65,86]. For example, P concentrations in the Seine basin upstream from Paris can now be lower than 0.05 mg L−1 in the water column, thus able to limit algal growth. Even in the river section downstream of Paris’ WWTPs, concentrating more than half of the population of the area studied, P concentrations remain on the order of 0.09 mgP-PO4 L−1 in 2013 versus 1.8 mgP-PO4 L−1 for 1990 and 0.2 mgP-PO4 L−1 for 2000, for the annual average. Regarding diffuse sources in the Seine River, nitrate concentrations have been stabilised at 5 mgN-NO3 L−1 since the early 2000s, after a regular concentration increase resulting from fertiliser use for agriculture intensification (from 3.3 mgN-NO3 L−1 in the late 1980s to 5.4 mgN-NO3 L−1 in the early 2000s, i.e., about 10% per year, before good agricultural practices were recommended [87]. Recently, N concentrations appeared to stabilise owing to improved wastewater treatment (including denitrification [86]). As a result of all these changes, the marine coastal waters shifted from an N limitation to a P limitation [33].
Noteworthy, this land-to-sea model chain, useful for simulating the response in terms of harmful algal blooms (HABs) in a coastal marine system to anthropogenic terrestrial inputs, would make it possible to analyse changes in human activity in the watershed, not only in terms of point and diffuse nutrient inputs, but also in terms of water management of the drainage network (canalisation, ponds and reservoir creation, etc.; see [88]).
However, a number of limitations of the present study should be kept in mind. Although the biogeochemical modules of both RIVERSTRAHLER and ECO-MARS 3D take into account the major biological functional groups, the diversity of the phytoplanktonic communities and their physiological behaviour are not taken into account and would need more experimental studies, in nutrient limitation conditions especially.
Regarding the spatial resolution, the coarse grid chosen here might not be capturing the coastal circulation realistically, but observed data are missing to be compared with simulations at a fine scale (i.e., 1 km × 1 km). As far as scenarios are concerned, without knowing the changes that might occur simultaneously to watershed management (e.g., ocean boundary conditions for the biogeochemical variables, atmospheric deposition, modification of the hydrological regime due to the presence of climate change), all these constraints to the modelling approach were kept constant.

6.3. Construction and Exploration of Scenarios

Here, the scenarios considered focused on agriculture, since N contamination of surface and groundwaters are nowadays the main concern. As mentioned above, scenarios tested with RIVERSTRAHLER until the 2010s were mostly dedicated to exploring the impact of reducing the N and P loads from WWTPs. However, while the reduction of P was spectacular, the reduction of N from WWTPs was relatively low despite the treatment of nitrification followed by denitrification, because diffuse N sources dominated over the N point sources in the North of France region, with its highly fertile soils and specialisation in intensive conventional cropping that has long been in place [87].
Considering the multiple threats related to agricultural N excess in the environment, among which groundwater contamination and closure of drinking water wells [89], nitrous oxide emission [90], loss of biodiversity [91,92], eutrophication, and toxin production [93,94] (see also ENA [95]), we developed a tool to link to RIVERSTRAHLER by providing N concentrations in runoff water on the basis of agricultural specificities by sub-watersheds (e.g., crop rotations, quantity and quality of inputs, crop harvest). The GRAFS approach (Generalized Representation of Agrofood Systems), first developed for N [31], can build spatialised agricultural scenarios considering intensive cropping or livestock, integrated livestock and crops, etc.
During two workshops of participative science called “Ateliers du Futur”, two scenarios of changes in agricultural practices and agro-food systems were developed with representatives of the major actors in the watershed and the coastal sea (citizens, farmers, fishermen, farmer associations, nature protection activists, governmental agencies, etc.). While a scenario of good agricultural practices (O/S, not shown) explored the results of the current regulations, without questioning the main trends (specialisation, openness of the market, industrial fertilisation), the scenario for farm autonomy, reconnection of crop and livestock, and changes in the human diet (A/R/D) was based on still weak signals that could become the main stream in the future. Consumers are indeed increasingly demanding healthy food (without pesticides and other chemicals), paying attention to animal welfare, and are concerned with care for the environment (water and air quality, biodiversity, climate change) and with quality of human life and equity. These scenarios, described from an agri-food system point of view by GRAFS [36] were here used as inputs to the RIVERSTRAHLER-ECO-MARS3D. The results of these scenarios clearly showed that a full rethink of the agri-food system (A/R/D) would be best suited if one wishes to reduce N fluxes and N-ICEP: an improvement of 68% in N-flux and 55% for N-ICEP was predicted for the A/R/D scenario compared to the reference situation. The A/R/D scenario, although extreme in some respects (generalisation of organic agriculture, reduction by half of the animal protein consumption), was shown to still meet the food needs of the population [36]. It would be the most effective in reducing both eutrophication potential (see Table 7) and bloom toxicity (see Figure 10). In addition, the A/R/D scenario, which would improve river water quality, has been shown to reduce greenhouse gas emissions by 36% in the Seine Basin (50% for all of France [86]).
The Pristine scenario, exploring a situation without human activities, represented a baseline for natural biogeochemical fluxes, with N and P fluxes amounting 10% and 30%, respectively, of the Reference situation.
Regarding the two scenarios dealing with point sources, the strict application of the regulations (WWTP scenario) revealed no significant difference in terms of N fluxes (about 3%, compared to the Reference situation). This scenario confirms the need to reduce N from diffuse agricultural sources. Conversely, significant improvement for P fluxes could still be expected (>25%) for the Seine, the Somme, the Dives, the Touques, the Arques and the Aa rivers leading to a systematically negative P-ICEP for all rivers, accentuating the role of N in eutrophication potential.
The “back to the 1980s” scenario showed the impact of all the measures taken since that time, having led to a 17% reduction in N fluxes and 57% for P. Conversely, this type of scenario showed that a disengagement of the French State in public policies, such as for sanitation, or any WWTP malfunction event, could lead to a renewed serious environmental crisis. Interestingly, unlike fishermen across the Channel, French actors did not develop shelling of the scallop, i.e., selling the nut only, without hepatopancreas, safe for human consumption. The red label of the product was preferred to adaptation measures, so that the preventive A/R/D scenario, the most efficient in terms of eutrophication and toxicity, was retained.

7. Conclusions

The study has shown the progress made on the understanding of toxic PSN blooms and has determined how they can be driven by nutrient fluxes from watersheds. A major outcome was (i) the implementation of a PSN module in the marine ECO-MARS3D model and (ii) its off-line coupling with the GRAFS-RIVERSTRAHLER river drainage network model newly applied to 11 rivers of the coastline of the North of France. After validation of the tools for an 11 year reference period (2002–2012), we explored a range of scenarios of environmental conditions, leading to the conclusion that a reduction of eutrophication and toxin production can only be expected from radical changes in the human activities in the watersheds, especially in the structure of its agri-food system.

Author Contributions

Conceptualization, J.G., P.R., G.B. and A.M.; Funding acquisition, P.R.; Investigation, J.G., G.B., P.C. and A.M.; Methodology, J.G., R.L.G., G.B. and A.M.; Project administration, P.R.; Resources, M.S. and V.T.; Software, R.L.G., A.R. and S.T.; Writing – original draft, J.G.; Writing – review & editing, J.G., P.R., R.L.G., G.B., P.C., M.S., A.M. and V.T.

Funding

This work was undertaken within the framework of the LITEAU program, funded by the French Ministère de la Transition Ecologique et Solidaire, and by the Agence de l’Eau Seine Normandie. The Flam project (Microalgae blooms in the Channel: watershed impact on toxic phytoplankton development, Contract: 12-MUTS-LITEAU-4-CVS-016 2012 – n°CHORUS 2100 949 494) was coordinated by Philippe Riou (IFREMER).

Acknowledgments

This work is also a contribution to the PIREN Seine research program (www.piren-seine.fr), within the framework of the Zone Atelier Seine, a site of the international Long Term Socio Ecological Research (LTSER) network.

Conflicts of Interest

The authors declare no conflict of interest.

References

  1. Xiao, Y.; Ferreira, J.G.; Bricker, S.B.; Nunes, J.P.; Zhu, M.; Zhang, X. Trophic assessment in Chinese coastal systems-review of methods and application to the Changjiang (Yangtze) estuary and Jiaozhou Bay. Estuar. Coasts 2007, 30, 901–918. [Google Scholar] [CrossRef]
  2. Huang, J.; Xu, C.-C.; Ridoutt, B.G.; Wang, X.-C.; Ren, P.-A. Nitrogen and phosphorus losses and eutrophication potential associated with fertilizer application to cropland in China. J. Clean. Prod. 2017, 159, 171–179. [Google Scholar] [CrossRef]
  3. Rabalais, N.N.; Díaz, R.J.; Levin, L.A.; Turner, R.E.; Gilbert, D.; Zhang, J. Dynamics and distribution of natural and human-caused coastal hypoxia. Biogeosciences 2010, 7, 585–619. [Google Scholar] [CrossRef]
  4. Ulloa, M.J.; Álvarez-Torres, P.; Horak-Romo, K.P.; Ortega-Izaguirre, R. Harmful algal blooms and eutrophication along the mexican coastof the Gulf of Mexico large marine ecosystem. Environ. Dev. 2017, 22, 120–128. [Google Scholar] [CrossRef]
  5. Conley, D.J.; Humborg, C.; Rahm, L.; Savchuk, O.P.; Wulff, F. Hypoxia in the Baltic Sea and basin-scale changes in phosphorus biogeochemistry. Environ. Sci. Technol. 2002, 36, 5315–5320. [Google Scholar] [CrossRef] [PubMed]
  6. Giani, M.; Djakovac, T.; Degobbis, D.; Cozzi, S.; Solidoro, C.; Umani, S.F. Recent changes in the marine ecosystems of the northern Adriatic Sea. Estuar. Coast. Shelf Sci. 2012, 115, 1–13. [Google Scholar] [CrossRef]
  7. Vilicic, D.; Kuzmic, M.; Tomazi, I.; Ljubesic, Z.; Bosak, S.; Precali, R.; Djakovac, T.; Maric, D.; Godrijan, J. Northern Adriatic phytoplankton response to short Po River discharge pulses during summer stratified conditions. Mar. Ecol. 2013, 34, 451–466. [Google Scholar] [CrossRef]
  8. Radach, G.; Patsch, J. Variability of Continental Riverine Freshwater and Nutrient Inputs into the North Sea for the Years 1977–2000 and Its Consequences for the Assessment of Eutrophication. Estuar. Coasts 2007, 30, 66–81. [Google Scholar] [CrossRef]
  9. Peperzak, L.; Poelman, M. Mass mussel mortality in The Netherlands after a bloom of Phaeocystis globosa (prymnesiophyceae). J. Sea Res. 2008, 60, 220–222. [Google Scholar] [CrossRef]
  10. Lancelot, C.; Thieu, V.; Polard, A.; Garnier, J.; Billen, G.; Hecq, W.; Gypens, N. Ecological and economic effectiveness of nutrient reduction policies on coastal Phaeocystis colony blooms in the Southern North Sea: An integrated modeling approach. Sci. Total Environ. 2011, 409, 2179–2191. [Google Scholar] [CrossRef]
  11. Desmit, X.; Thieu, V.; Billen, G.; Campuzano, F.; Dulière, V.; Garnier, J.; Lassaletta, L.; Ménesguen, A.; Neves, R.; Pinto, L.; et al. Reducing marine eutrophication may require a paradigmatic change. Sci. Total Environ. 2018, 635, 1444–1466. [Google Scholar] [CrossRef] [PubMed]
  12. Justić, D.; Rabalais, N.N.; Turner, R.E. Stoichiometric nutrient balance and origin of coastal eutrophication. Mar. Pollut. Bull. 1995, 30, 41–46. [Google Scholar] [CrossRef]
  13. Billen, G.; Garnier, J. The Phison River Plume: Coastal eutrophication in response to changes in land use and water management in the watershed. Aquat. Microb. Ecol. 1997, 13, 3–17. [Google Scholar] [CrossRef]
  14. Billen, G.; Garnier, J. River basin nutrient delivery to the coastal sea: Assessing its potential to sustain new production of non siliceous algae. Mar. Chem. 2007, 106, 148–160. [Google Scholar] [CrossRef]
  15. Anderson, D.M.; Burkholder, J.M.; Cochlan, W.P.; Glibert, P.M.; Gobler, C.J.; Heil, C.A.; Kudela, R.M.; Parsons, M.L.; Rensel, J.E.J.; Townsend, D.W.; et al. Harmful algal blooms and eutrophication: Examining linkages from selected coastal regions of the United States. Harmful Algae 2008, 8, 39–53. [Google Scholar] [CrossRef] [Green Version]
  16. Romero, E.; Garnier, J.; Lassaletta, L.; Billen, G.; Le Gendre, R.; Riou, P.; Cugier, P. Large-scale patterns of river inputs in SW Europe: Seasonal and interannual variations and potential eutrophication effects at the coastal zone. Biogeochemistry 2013, 113, 481–505. [Google Scholar] [CrossRef]
  17. Guillaud, J.-F.; Ménesguen, A. Modélisation sur vingt ans (1976–1995) de la production phytoplanctonique en baie de Seine. Oceanol. Acta 1998, 21, 887–906. [Google Scholar] [CrossRef]
  18. Amzil, Z.; Fresnel, J.; Gal, D.L.; Billard, C. Domoic acid accumulation in French shellfish in relation to toxic species of Pseudo-nitzschia multiseries and P. pseudodelicatissima. Toxicon 2001, 39, 1245–1251. [Google Scholar] [CrossRef]
  19. Nézan, E.; Antoine, E.; Fiant, L.; Amzil, Z.; Billard, C. Identification of Pseudo-nitzschia australis and P. multiseries in the Bay of Seine. Was there a relation to presence of domoic acid in king scallops in autumn 2004? Harmful Algae News 2006, 31, 1–3. [Google Scholar]
  20. Husson, B.; Hernandez-Farinas, T.; Le Gendre, R.; Schapira, M.; Chapelle, A. Two decades of Pseudo-nitzschia spp. blooms and king scallop (Pecten maximus) contamination by domoic acid along the French Atlantic and English Channel coasts: Seasonal dynamics, spatial heterogeneity and interannual variability. Harmful Algae 2016, 51, 26–39. [Google Scholar] [CrossRef]
  21. Thorel, M.; Claquin, P.; Schapira, M.; Le Gendre, R.; Riou, P.; Goux, D.; Le Roy, B.; Raimbault, V.; Deton-Cabanillas, A.-F.; Bazin, P.; et al. Nutrient ratios influence variability in Pseudo-nitzschia species diversity and particulate domoic acid production in the Bay of Seine (France). Harmful Algae 2017, 68, 192–205. [Google Scholar] [CrossRef] [PubMed]
  22. Charlier, R.H.; Morand, P.; Finkl, C.W.; Thys, A. Green Tides on the Brittany Coasts. Environ. Res. Eng. Manag. 2007, 41, 52–59. [Google Scholar]
  23. Scholin, C.A.; Gulland, F.; Doucette, G.J.; Benson, S.; Busman, M.; Chavez, F.P.; Cordarok, J.; DeLong, R.; De Vogelaere, A.; Harvey, J.; et al. Mortality of sea lions along the central California coast linked to a toxic diatom bloom. Nature 2000, 403, 80–84. [Google Scholar] [CrossRef] [PubMed]
  24. Bargu, S.; Silver, M.W.; Ohman, M.D.; Benitez-Nelson, C.R.; Garrison, D.L. Mystery behind Hitchcock’s birds. Nat. Geosci. 2012, 5, 2–3. [Google Scholar] [CrossRef]
  25. Soliño, L.; Ferrer-Obiol, J.; Navarro-Herrero, L.; González-Solís, J.; Costa, P.R. Are pelagic seabirds exposed to amnesic shellfish poisoning toxins? Harmful Algae 2019, 84, 172–180. [Google Scholar] [CrossRef]
  26. Blanco, J.; Acosta, C.P.; Bermudez de la Puente, M.; Salgado, C. Depuration and anatomical distribution of the amnesic shellfish poisoning (ASP) toxin domoic acid in the king scallop Pecten maximus. Aquat. Toxicol. 2002, 60, 111–121. [Google Scholar] [CrossRef]
  27. Amzil, Z.; Royer, F.; Sibat, M.; Fiant, L.; Gelin, M.; Le Gal, D.; Francoise, S. First report on amnesic and diarrhetic toxins detection in French scallops during 2004–2005 monitoring surveys. In Proceedings of the Sixth International Conference on Molluscan Shellfish Safety, Blenheim, New Zealand, 18–23 March 2009; Available online: https://archimer.ifremer.fr/doc/00015/12577/ (accessed on 11 October 2019).
  28. Fehling, J.; Davidson, K.; Bolch, C.J.; Bates, S.S. Growth and domoic acid production of Pseudo-nitzschia seriata under phosphate and silicate limitation. J. Phycol. 2004, 40, 674–683. [Google Scholar] [CrossRef]
  29. Davidson, K.; Fehling, J. Modelling the influence of silicon and phosphorus limitation on the growth and toxicity of Pseudo-nitzschia seriata. Afr. J. Mar. Sci. 2006, 28, 357–360. [Google Scholar]
  30. Billen, G.; Garnier, J.; Ficht, A.; Cun, C. Modelling the response of water quality in the Seine Estuary to human activity in its watershed over the last 50 years. Estuaries 2001, 24, 977–993. [Google Scholar] [CrossRef]
  31. Billen, G.; Garnier, J.; Lassaletta, L. Modelling the nitrogen cascade from watershed soils to the sea: From regional to global scales. Phil. Trans. R. Soc. B 2013, 368, 20130123. [Google Scholar] [CrossRef]
  32. Cugier, P.h.; Billen, G.; Guillaud, J.F.; Garnier, J.; Ménesguen, A. Modelling the eutrophication of the Seine Bight (France) under historical, present and future riverine nutrient loading. J. Hydrol. 2005, 304, 381–396. [Google Scholar] [CrossRef]
  33. Passy, P.; Gypens, N.; Billen, G.; Garnier, J.; Lancelot, C.; Thieu, V.; Rousseau, V.; Callens, J. A model reconstruction of riverine nutrient fluxes and eutrophication in the Belgian Coastal Zone since 1984. J. Mar. System. 2013, 128, 106–122. [Google Scholar] [CrossRef]
  34. Passy, P.; Le Gendre, R.; Garnier, J.; Cugier, P.; Callens, J.; Paris, F.; Billen, G.; Riou, P.; Romero, E. Eutrophication modelling chain for improved management strategies to prevent algal blooms in the Seine Bight. Mar. Ecol. Prog. Ser. 2016, 543, 107–125. [Google Scholar] [CrossRef] [Green Version]
  35. Garnier, J.; Billen, G.; Némery, J.; Sebilo, M. Transformations of nutrients (N, P, Si) in the turbidity maximum zone of the Seine estuary and export to the sea. Estuar. Coast. Shelf Sci. 2010, 90, 129–141. [Google Scholar] [CrossRef]
  36. Billen, G.; Le Noë, J.; Garnier, J. Two contrasted future scenarios for the French agro-food system. Sci. Total Environ. 2018, 637, 695–705. [Google Scholar] [CrossRef]
  37. European Commission. UWWTD EU Directive (Urban Wastewater Treatment Directive. 91/271/CEE du Conseil; du 21mai 1991; Relative au Traitement des Eaux Urbaines Résiduaires; JO L135 du 30.5.1991; European Commission: Brussels, Belgium, 1991; pp. 40–52. [Google Scholar]
  38. Romero, E.; Garnier, J.; Billen, G.; Ramarson, A.; Riou, P.; Le Gendre, R. The biogeochemical functioning of the Seine estuary and the nearby coastal zone: Export, retention and transformations. A modelling approach. Limnol. Oceanogr 2018, 64, 895–912. [Google Scholar] [CrossRef]
  39. Le Noë, J.; Billen, G.; Garnier, J. Nitrogen, phosphorus and carbon fluxes through the French Agro-Food System: An application of the GRAFS approach at the territorial scale. Sci. Total Environ. 2017, 586, 42–55. [Google Scholar] [CrossRef]
  40. Anglade, J.; Billen, G.; Garnier, J.; Makridis, T.; Puech, T.; Tittel, C. Agro-environmental performance of organic compared to conventional cash crop farming in the Seine watershed. Agric. Syst. 2015, 139, 82–92. [Google Scholar] [CrossRef]
  41. Anglade, J.; Billen, G.; Garnier, J. Reconquérir la qualité de l’eau en régions de grande culture: Agriculture biologique et reconnexion avec l’élevage. Fourrages 2017, 231, 257–268. [Google Scholar]
  42. Ruelland, D.; Billen, G.; Brunstein, D.; Garnier, J. SENEQUE 3: A GIS interface to the RIVERSTRAHLER model of the biogeochemical functioning of river systems. Sci. Total Environ. 2007, 375, 257–273. [Google Scholar] [CrossRef]
  43. Lyne, V.; Hollick, M. Stochastic time-variable rainfall–runoff modelling. In Proceedings of the Hydrology and Water Resources Symposium, Perth, Australia, 10–12 September 1979; National Committee on Hydrology and Water Resources of the Institution of Engineers: Barton, Australia; pp. 89–92. [Google Scholar]
  44. Arnold, J.G.; Allen, P.M. Automated methods for estimating baseflow and ground water recharge from streamflow records. J. Am. Water Resour. Assoc. 1999, 35, 411–424. [Google Scholar] [CrossRef]
  45. Billen, G.; Ramarson, A.; Thieu, V.; Théry, S.; Silvestre, M.; Pasquier, C.; Hénault, C.; Garnier, J. Nitrate retention at the river–watershed interface: A new conceptual modeling approach. Biogeochemistry 2018, 139, 31–51. [Google Scholar] [CrossRef]
  46. Garnier, J.; Billen, G.; Coste, M. Seasonnal succession of diatoms and Chlorophyceae in the drainage network of the river Seine: Observations and modelling. Limnol. Oceanogr. 1995, 40, 750–765. [Google Scholar]
  47. Garnier, J.; Billen, G.; Akopian, M.; Némery, J.; Pinault, S.; Desruelle, M.; Dufayt, O.; Flipo, N.; Even, S.; Poulin, M. Développement des Peuplements Végétaux Dans le Bassin de la Marne: Dynamique des Nutriments et Eutrophisation. Contrôle par les Organismes Filtreurs; Rapport synthèse Piren-Seine. 1998–2001; PIREN Seine: Paris, France, 2002; p. 43. Available online: http://piren16.metis.upmc.fr/?q=webfm_send/447 (accessed on 11 October 2019).
  48. Garnier, J.; Billen, G.; Hannon, E.; Fonbonne, S.; Videnina, Y.; Soulie, M. Modeling transfer and retention of nutrients in the drainage network of the Danube River. Estuar. Coast. Shelf Sci. 2002, 54, 285–308. [Google Scholar] [CrossRef]
  49. Lazure, P.; Dumas, F. An external-internal mode coupling for a 3D hydrodynamical model for applications at regional scale (MARS). Adv. Water Resour. 2008, 31, 233–250. [Google Scholar] [CrossRef]
  50. Ménesguen, A.; Hoch, T. Modelling the biogeochemical cycles of elements limiting primary production in the English Channel, I. Role of thermohaline stratification. Mar. Ecol. Prog. Ser. 1997, 146, 173–188. [Google Scholar] [CrossRef]
  51. Ménesguen, A.; Desmit, X.; Dulière, V.; Lacroix, G.; Thouvenin, B.; Thieu, V.; Dussauze, M. How to avoid eutrophication in coastal seas? A new approach to derive river-specific combined nitrate and phosphate maximum concentrations. Sci. Total Environ. 2018, 628, 400–414. [Google Scholar] [CrossRef]
  52. Ménesguen, A.; Dussauze, M.; Dumas, F.; Thouvenin, B.; Garnier, V.; Lecornu, F.; Répécaud, M. Ecological model of the Bay of Biscay and English Channel shelf for environmental status assessment part 1: Nutrients, phytoplankton and oxygen. Ocean Model. 2018, 133, 56–78. [Google Scholar] [CrossRef] [Green Version]
  53. Belin, C.; Raffin, B. Les Espèces Phytoplanctoniques Toxiques et Nuisibles sur le Littoral Français de 1984 à 1995, Résultats du REPHY (Réseau de Surveillance du Phytoplancton et des Phycotoxines); Rapport Ifremer RST.DEL/MP-AO 98-16; Institut Français de Recherche Pour L’Exploitation de la Mer: Issy-les-Moulineaux, France, 1998; p. 283. [Google Scholar]
  54. Busch, J.A.; Andree, K.B.; Diogene, J.; Fernandez-Tejedor, M.; Toebe, K.; John, U.; Krock, B.; Tillmann, U.; Cembella, A.D. Toxigenic algae and associated phycotoxins in two coastal embayments in the Ebro Delta (NW Mediterranean). Harmful Algae 2016, 55, 191–201. [Google Scholar] [CrossRef] [Green Version]
  55. Lelong, A.; Hegaret, H.; Soudant, P.; Bates, S.S. Pseudo-nitzschia (Bacillariophyceae) species, domoic acid and amnesic shellfish poisoning: Revisiting previous paradigms. Phycologia 2012, 51, 168–216. [Google Scholar] [CrossRef]
  56. Parsons, M.L.; Scholin, C.A.; Miller, P.E.; Doucette, G.J.; Powell, C.L.; Fryxell, G.A.; Dortch, Q.; Soniat, T.M. Pseudo-nitzschia species (Bacillariophyceae) in Louisiana coastal waters: Molecular probe field trials, genetic variability, and domoic acid analyses. J. Phycol. 1999, 35, 1368–1378. [Google Scholar] [CrossRef]
  57. Wells, M.L.; Trick, C.G.; Cochlan, W.P.; Hughe, M.P.; Trainer, V.L. Domoic acid: The synergy of iron; copper; and the toxicity of diatoms. Limnol. Oceanogr. 2005, 50, 1908–1917. [Google Scholar] [CrossRef]
  58. Trainer, V.L.; Pitcher, G.C.; Reguera, B.; Smayda, T.J. The distribution and impacts of harmful algal bloom species in eastern boundary upwelling systems. Prog. Oceanogr. 2010, 85, 33–52. [Google Scholar] [CrossRef]
  59. Klein, C.; Claquin, P.; Bouchart, V.; Le Roy, B.; Veron, B. Dynamics of Pseudo- nitzschia spp. and domoic acid production in a macrotidal ecosystem of the Eastern English Channel (Normandy, France). Harmful Algae 2010, 9, 218–226. [Google Scholar] [CrossRef]
  60. Pénard, C. Détection Satellitaire et Modélisation Opérationnelle de la Production Végétale Non-Fixée (phytoplancton et ulves) Dans la Bande Côtière Bretonne. Ph.D. Thesis, Université de Bretagne Occidentale, Brest, France, 2009; p. 227. [Google Scholar]
  61. Thorel, M.; Fauchot, J.; Morelle, J.; Raimbault, V.; Le Roy, B.; Miossec, C.; Kientz-Bouchart, V.; Claquin, P. Interactive effects of irradiance and temperature on growth and domoic acid production of the toxic diatom Pseudo-nitzschia australis (Bacillariophyceae). Harmful Algae 2014, 39, 232–241. [Google Scholar] [CrossRef]
  62. Blanchard, G.F.; Guarini, J.M.; Richard, P.; Gros, P.; Mornet, F. Quantifying the short-term temperature effect on light-saturated photosynthesis of intertidal microphytobenthos. Mar. Ecol. Prog. Ser. 1996, 134, 309–313. [Google Scholar] [CrossRef]
  63. Ménesguen, A.; Dussauze, M.; Thouvenin, B. Ecological model of the Bay of Biscay and English Channel shelf for ecological status assessment. Part 2: Three types of HAB (Karenia, Phaeocystis, Pseudo-nitzschia) and their link with nitrogen anthropogenic enrichment. Ocean Model. 2019. in revision. [Google Scholar]
  64. Aissa-Grouz, A.; Garnier, J.; Billen, G.; Mercier, B.; Martinez, A. The response of river nitrification to changes in wastewater treatment (The case of the lower Seine River downstream from Paris). Ann. Limnol. Int. J. Lim. 2015, 51, 351–364. [Google Scholar] [CrossRef] [Green Version]
  65. Aissa-Grouz, N.; Garnier, J.; Billen, G. Long trend reduction of phosphorus wastewater loading in the Seine: Determination of phosphorus speciation and sorption for modeling algal growth. Environ. Sci. Pollut. Res. 2018, 25, 23515. [Google Scholar] [CrossRef]
  66. Garnier, J.; Beusen, A.; Thieu, V.; Billen, G.; Bouwman, L. N:P:Si nutrient export ratios and ecological consequences in coastal seas evaluated by the ICEP approach. Special issue “Past and Future Trends in Nutrient Export from Global Watersheds and Impacts on Water Quality and Eutrophication”. Global Biogeochem. Cy. 2010, 24, GB0A05. [Google Scholar] [CrossRef]
  67. Redfield, A.C.; Ketchum, B.H.; Richards, F.A. The influence of organisms on the composition of sea-water. In The Sea; Hill, M.N., Ed.; John Wiley: New York, NY, USA, 1963; pp. 12–37. [Google Scholar]
  68. Conley, D.J.; Kilham, S.S.; Theriot, E.C. Differences in silica content between marine and freshwater diatoms. Limnol. Oceanogr. 1989, 34, 205–213. [Google Scholar] [CrossRef]
  69. Hagström, J.A.; Graneli, E.; Moreira, M.O.P.; Odebrecht, C. Domoic acid production and elemental composition of two Pseudo-nitzschia multiseries strains, from the NW and SW Atlantic Ocean, growing in Phosphorus-or Nitrogen-limited chemostat cultures. J. Plankton Res. 2011, 33, 297–308. [Google Scholar] [CrossRef]
  70. Garnier, J.; Passy, P.; Thieu, V.; Callens, J.; Silvestre, M.; Billen, G. Fate of Nutrients in the Aquatic Continuum of the Seine River and its Estuary: Modelling the Impacts of Human Activity Changes. In The Watershed Biogeochemical Dynamics at Large River-Coastal Interfaces: Linkages with Global Climate Change; Bianchi, T.S., Allison, M.A., Cai, W.-J., Eds.; Cambridge University Press: Cambridge, UK, 2014; p. 671. ISBN 978-1-107-20257-7. [Google Scholar]
  71. Humborg, C.; Pastuszak, M.; Aigars, J.; Siegmund, H.; Morth, C.M.; Ittekkot, V. Decreased silica land–sea fluxes through damming in the Baltic Sea catchment—Significance of particle trapping and hydrological alterations. Biogeochemistry 2006, 77, 265–281. [Google Scholar] [CrossRef]
  72. Harrison, J.A.; Frings, P.J.; Beusen, A.H.W.; Conley, D.J.; McCrackin, M.L. Global importance, patterns, and controls of dissolved silica retention in lakes and reservoirs. Glob. Biogeochem. Cy. 2012, 26, GB2037. [Google Scholar] [CrossRef]
  73. Bates, S.S.; Garrison, D.L.; Horner, R.A. Bloom dynamics and physiology of domoic-acid-producing Pseudo-nitzschia species. In Physiological Ecology of Harmful Algal Blooms; Anderson, D.M., Cembella, A.D., Hallegraef, G.M., Eds.; Springer: Berlin, Germany, 1998; pp. 267–292. [Google Scholar]
  74. Cochlan, W.P.; Herndon, J.; Kudela, R.M. Inorganic and organic nitrogen uptake by the toxigenic diatom. Pseudo-nitzschia australis (Bacillariophyceae). Harmful Algae 2008, 8, 111–118. [Google Scholar] [CrossRef]
  75. Radan, R.L.; Cochlan, W.P. Differential toxin response of Pseudo-nitzschia multiseries as a function of nitrogen speciation in batch and continuous cultures, and during a natural assemblage experiment. Harmful Algae 2018, 73, 12–29. [Google Scholar] [CrossRef]
  76. Trainer, V.L.; Wells, M.L.; Cochlan, W.P.; Trick, C.G.; Bill, B.D.; Baugh, K.A.; Beall, B.F.; Herndon, J.; Lundholm, N. An ecological study of a massive toxigenic bloom of Pseudo-nitzschia cuspidate off the Washington State coast. Limnol. Oceanogr. 2009, 54, 1461–1474. [Google Scholar] [CrossRef]
  77. Fuentes, M.S.; Wikfors, G.H. Control of domoic acid toxin expression in Pseudo-nitzschia multiseries by copper and silica: Relevance to mussel aquaculture in New England (USA). Mar. Environ. Res. 2013, 83, 23–28. [Google Scholar] [CrossRef]
  78. Lema, K.A.; Latimier, M.; Nézan, E.; Fauchot, J.; Le Gac, M. Inter and intra-specific growth and domoic acid production in relation to nutrient ratios and concentrations in Pseudo-nitzschia: Phosphate an important factor. Harmful Algae 2017, 64, 11–19. [Google Scholar] [CrossRef]
  79. Quijano-Scheggia, S.; Garcés, E.; Flo, E.; Fernandez-Tejedor, M.; Diogène, J.; Camp, J. Bloom dynamics of the genus Pseudo-nitzschia (Bacillariophyceae) in two coastal bays (NW Mediterranean Sea). Sci. Mar. 2008, 72, 577–590. [Google Scholar]
  80. Trainer, V.L.; Bates, S.S.; Lundholm, N.; Thessen, A.E.; Cochlan, W.P.; Adams, N.G.; Trick, C.G. Pseudo-nitzschia physiological ecology; phylogeny; toxicity; monitoring and impacts on ecosystem health. Harmful Algae 2012, 14, 271–300. [Google Scholar] [CrossRef]
  81. European Commission. EU-WFD (European Water Framework Directive). Directive 2000/60/EC of the European Parliament and of the Council of 23 October 2000; OLJ 327/1, 22.12; European Commission: Brussels, Belgium, 2000; pp. 1–72. [Google Scholar]
  82. Belin, C.; Chapelle, A.; Delmas, D.; Nezan, E.; Siano, R. DYNAPSE—DYNamiques des Efflorescences et de la Toxicité des Espèces Phytoplanctoniques Nuisibles du Genre Pseudo-Nitzschia en Région Loire Bretagne; ODE/DYNECO/PELAGOS, 2013-01; Institut Français de Recherche Pour L’Exploitation de la MerI: Issy-les-Moulineaux, France, 2013; Available online: https://archimer.ifremer.fr/doc/00189/30035/ (accessed on 11 October 2019).
  83. Salomon, J.-C.; Breton, M. An atlas of long-term currents in the channel. Oceanol. Acta 1993, 16, 439–448. Available online: https://archimer.ifremer.fr/doc/00099/21068/ (accessed on 11 October 2019).
  84. European Commission. EU-Nitrate Directive. Council Directive 91/676/EEC of 12 December 1991 Concerning the Protection of Waters Against Pollution Caused by Nitrates from Agricultural Sources (91/676/ CEE, European Council); European Commission: Brussels, Belgium, 1991. [Google Scholar]
  85. Kerimoglu, O.; Große, F.; Kreus, M.; Lenhart, H.-L.; van Beusekom, J.E.E. A model-based projection of historical state of a coastal ecosystem: Relevance of phytoplankton stoichiometry. Sci. Total Environ. 2018, 639, 1311–1323. [Google Scholar] [CrossRef] [PubMed] [Green Version]
  86. Garnier, J.; Marescaux, A.; Guillon, S.; Vilmin, L.; Rocher, V.; Billen, G.; Thieu, V.; Silvestre, M.; Passy, P.; Groleau, A.; et al. Ecological functioning of the Seine River: From long-term modelling approaches to high-frequency data analysis. Handb. Env. Chem. 2019. [Google Scholar] [CrossRef]
  87. Le Noë, J.; Billen, G.; Esculier, F.; Garnier, J. Long term socio-ecological trajectories of agro-food systems revealed by N and P flows: The case of French regions from 1852 to 2014. Agric. Ecosyst. Environ. 2018, 265, 132–143. [Google Scholar] [CrossRef]
  88. Passy, P.; Garnier, J.; Billen, G.; Fesneau, C.; Tournebize, J. Restoration of ponds in rural landscapes: Modelling the effect on nitrate contamination of surface water (the Seine watershed, France). Sci. Total Environ. 2012, 430, 280–290. [Google Scholar] [CrossRef]
  89. Direction Générale de la Santé. Abandons de Captages Utilisés Pour la Production d’eau Destinée à la Consommation Humaine; Bilan Février 2012; Secrétariat d’Etat Chargé de la Santé: Paris, France, 2012; p. 22. [Google Scholar]
  90. Garnier, J.; Le Noë, J.; Marescaux, A.; Sanz-Cobena, A.; Lassaletta, L.; Silvestre, M.; Thieu, V.; Billen, G. Long term changes in greenhouse gas emissions of French agriculture (1852–2014): From traditional agriculture to conventional intensive systems. Sci. Total Environ. 2019, 660, 1486–1501. [Google Scholar] [CrossRef]
  91. James, C.; Fisher, J.; Russel, V.; Collings, S.; Moss, B. Nitrate availability and hydrophyte species richness in shallow lakes. Freshw. Biol. 2005, 50, 1049–1063. [Google Scholar] [CrossRef]
  92. Camargo, J.A.; Alonso, A.; Salamanca, A. Nitrate toxicity to aquatic animals: A review with new data for freshwater invertebrates. Chemosphere 2005, 58, 1255–1267. [Google Scholar] [CrossRef]
  93. Heisler, J.; Glibert, P.M.; Burkholder, J.M.; Anderson, D.M.; Cochlan, W.; Dennison, W.C.; Dortch, Q.; Gobler, C.J.; Heil, C.A.; Humphries, E.; et al. Eutrophication and harmful algal blooms: A scientific consensus. Harmful Algae 2008, 8, 3–13. [Google Scholar] [CrossRef] [Green Version]
  94. Glibert, P.M.; Maranger, R.; Sobota, D.J.; Bouwman, L. The Haber Bosch–harmful algal bloom (HB–HAB) link. Environ. Res. Lett. 2014, 9, 105001. [Google Scholar] [CrossRef]
  95. Sutton, M.A.; Howard, C.M.; Erisman, J.W.; Billen, G.; Bleeker, A.; Grennfelt, P.; van Grinsven, H.; Grizzetti, B. (Eds.) ENA, European Nitrogen Assessment; Cambridge University Press: London, UK, 2011; p. 612. [Google Scholar]
Figure 1. Domain of the study: the river networks adjacent to the Normandy and Hauts-de-France coastlines; and the Seine Bight and the English Channel (16 km × 16 km) where the GRAFS- RIVERSTRAHLER and ECO-MARS3D models were respectively implemented. The names of the watershed (black shaded with white) and the stations (black) used for validation are indicated.
Geosciences 09 00441 g001
Figure 2. Representation of the principles of the GRAFS/RIVERSTRAHLER/ECO-MARS3D model chain.
Geosciences 09 00441 g002
Figure 3. Seasonal and inter-annual variations in water flow and nutrient concentrations for the Seine River at Poses and the Somme at Abbeville; the outlets of the Seine and Somme rivers. Simulations by GRAFS-RIVERSTRAHLER and comparison with observations.
Geosciences 09 00441 g003
Figure 4. Specific nutrient fluxes at the outlets of the rivers studied and averaged for the reference period, 2002–2014 (total N, P, and Si in kg km−2 y−1).
Geosciences 09 00441 g004
Figure 5. Indicator of coastal eutrophication potential for N and P (N-ICEP-N and P-ICEP; kg C km−2 y−1) for the rivers studied and averaged for the 2002–2014 period.
Geosciences 09 00441 g005
Figure 6. Seasonal and inter-annual variations of major quality variables at the coastal zone stations: Géfosse, Antifer, and Dunkerque (see locations in Figure 1). From top to bottom: temperature (°C); salinity (-); and nutrient concentrations (nitrate, silica, phosphate; µM) and chlorophyll (Chloro, µg·L−1). Simulations by the ECO-MARS3D model and comparison with observations.
Geosciences 09 00441 g006
Figure 7. (a) Inter-annual variations in Pseudo-nitzschia abundance at Antifer over the 2002–2012 period. (b) Average seasonal cycle of abundance from Pseudo-nitzschia over the same period. (Observed REPHY counts in red; ECO-MARS3D-simulated biomass converted into abundance following Hagström et al. [69]).
Geosciences 09 00441 g007
Figure 8. Average nitrogen and phosphorus fluxes delivered at the Normandy and Hauts-de-France coastlines by the main rivers in the area studied for the reference situation and for different scenarios tested, as simulated by the GRAFS-RIVERSTRAHLER model.
Geosciences 09 00441 g008
Figure 9. Seasonal and inter-annual simulated variations (ECO-MARS3D) of major phytoplankton variables at the coastal zone station Antifer. From top to bottom: biomass of (a) dinoflagellates; (b) diatoms; (c) Pseudo-nitzschia; and (d) domoic acid concentration. Comparison of the reference situation (2002–2012; Ref) with three scenarios (Pristine, 1980s, and A/R/D (autonomy/reconnection/demitarian diet)).
Geosciences 09 00441 g009
Figure 10. Comparison of the geographical distributions of cumulated concentration of domoic acid (over the period studied) simulated by the ECO-MARS3D model under the reference situation and the three contrasted scenarios.
Geosciences 09 00441 g010
Table 1. Constraints taken into account by the RIVERSTRAHLER model for calculating nutrient flows at the outlets of the main rivers of the Normandy and Hauts-de-France coastal zones.
Data SourcesNormandyHauts-de-France
HydrologyHYDRO database (http://www.hydro.eaufrance.fr)
Point sources
WWTPs Seine Normandy Water Agency Artois Picardy Water Agency
IndustriesSeine Normandy Water Agencynd
Diffuse sources
Land use Corine Land Cover
N concentrations Calculated from GRAFS
Riparian retentionTemperature fonct (Topt = 40 °C; dti = 10 °C)
Table 2. General characteristics of the watersheds studied.
RegionsRiver Names Surface Area Population CroplandGrassland
km2 Inhabitants % %
NormandyDouve & Taute1440129,42415.476.9
Vire & Aure1575440,40222.769.9
Orne2903440,75735.748.7
Dives1776152,53238.451.1
Touques1273165,72322.962.9
Seine (Eure, Risle)73,2242,0829,87550.520.2
Arques1020101,79544.534.0
Hauts-de-FranceSomme6029632,98977.37.2
Authie108948,45968.218.1
Canche132782,61564.122.6
Aa1144196,09366.417.9
Table 3. Parameters specific to Pseudo-nitzschia and differential equations associated with the Pseudo-nitzschia sub-model. State variables and parameters not specifically linked to Pseudo-nitzschia are explained in Ménesguen et al. [52].
Parameter MeaningUnitValue
µmaxpsnzMaximum growth rated−11.6
Toptpsnz Optimal temperaturedegree C15
TlethalpsnzLethal temperaturedegree C21
βpsnzSteepness parameter of Blanchard’s curveunitless0.6
KNO3psnzHalf-saturation constant for NO3 uptakemicromolN·L−11.5
KNH4psnzHalf-saturation constant for NH4 uptakemicromolN·L−10.8
KPO4psnzHalf-saturation constant for PO4 uptakemicromolP·L−10.03
KSipsnzHalf-saturation constant for Si(OH)4 uptakemicromolSi·L−11
vmaxSipsnzMaximum Si(OH)4 uptake ratemicromolSi.micromolN−1·d−10.15
qminSiMinimum Si quotamicromolSi.micromol·N−10.85
fSi_thSi limitation threshold for DA toxin productionunitless0.3
rdaDA toxin production ratemicrogDA.micromolN−1·d−110
ddaDA toxin destruction rated−10.02
IkpsnzIk parameter of Smith’s curve of light effectW·m−240
mpsnzMortality rated−1 0.015
τpsnz_mesozooEdibility for the mesozooplanktonunitless0.3
τpsnz_microzooEdibility for the microzooplanktonunitless0.3
Table 4. Evaluation of GRAFS-RIVERSTRAHLER performance for the Seine River at Poses and Abbeville. The goodness of fit of the simulations with respect to the observed concentration was evaluated for the major water quality variables by calculating the root mean square error, normalised to the range of the observed data (NRMSE), according to the formula (NRMSE = 100 × SQR (1/n Σ (Obsi − Simi)2)/(MAX(Obs) − MIN(Obs))) where n is the number of observations. The relative bias is calculated as follows (Bias = 100 × (1/n Σ (Simi − Obsi)/MEAN (Obs)).
Poses Abbeville
Water Quality VariablesUnitsObs. (n)NRMSEBiaisObs. (n)NRMSEBiais
%% %%
Dischargem3·s−14685−74686−1
NitratemgN·L−1368991085936
PhosphatesmgP·L−1368417701428
Total phosphorus mgP·L−13681830
SilicamgSi L−13442570
Chlorophyll aµg·L−135418−330
Suspended Solidsmg·L−13471623116156
Table 5. Average discharge and nutrient fluxes at the outlet of the rivers averaged for 2002–2014 (total N, P, and Si in kton y−1). The Douves and Taute on the one hand and Vire and Aure on the other hand are considered together as they meet before flowing to the coastal zone.
RegionsRiver Names Average Dischargekton N yr−1kton P yr−1kton Si yr−1
m3 s−1
NormandyDouve & Taute17.52.90.11.5
Vire & Aure16.93.60.12.0
Orne31.95.80.14.5
Dives8.02.40.12.1
Touques9.72.90.12.1
Seine (Eure, Risle)532.1141.74.869.6
Arques9.11.30.11.7
Hauts-de-FranceSomme37.24.90.25.7
Authie11.22.40.12.5
Canche17.42.30.13.2
Aa16.82.20.13.7
Table 6. Evaluation of ECO-MARS3D performance for the coastal zone stations (Antifer, Gefosse, Dunkerque). The goodness of fit of the simulations with respect to the observed concentrations (Obs.) was evaluated for the major water quality variables by calculating the root mean square error normalised to the range of the observed data (NRMSE), according to the formula (NRMSE = 100 × SQR (1/n Σ (Obsi − Simi)2)/(MAX(Obs) − MIN(Obs)) where n is the number of observations). The NRMSE represents a percentage of variation. The relative bias is calculated as follows (Bias = 100 × (1/n Σ (Simi − Obsi)/MEAN Obs)).
Antifer Gefosse Dunkerque
Water quality variablesUnitsObs. (n)NRMSEBiaisObs. (n)NRMSEBiaisObs. (n)NRMSEBiais
%% %% %%
Temperature°C111927−164647116180
Salinity698134466100164211
NitrateµM23715−3820310444921−10
PhosphatesµM23817−7220317−3313616−12
SilicaµM24113−3320618151372356
Chlorophyll aµg L−132512−36239144814120−49
Table 7. Indicator of coastal eutrophication potential for N and P (N-ICEP and P-ICEP) for the rivers studied and averaged for 2002–2014 (reference period; Ref) and calculated for four scenarios (see text).
N-ICEP, kgC km−2 d−1 P-ICEP, kgC km−2 d−1
Pristine1980’sRefWWTPA/R/DPristine1980’sRefWWTPA/R/D
NormandyDouve & Taute−7.540.96.76.7−0.1−8.9−6.3−6.6−6.9−6.8
Vire & Aure−8.460.111.811.74.0−9.3−7.0−7.4−7.5−7.5
Orne−7.794.520.219.910.5−8.7−1.8−6.3−6.9−6.9
Dives−3.136.86.86.32.7−3.8−1.4−2.1−3.2−3.2
Touques−6.034.29.27.62.8−7.0−2.3−3.5−6.1−6.1
Seine−1.551.024.520.311.5−1.810.31.7−0.2−0.2
Arques−5.679.625.425.210.2−6.2−1.9−2.6−4.5−4.5
Hauts-de-FranceSomme−4.446.714.212.23.4−5.2−3.5−3.7−4.8−4.8
Authie−4.097.521.921.97.8−5.3−4.5−4.6−4.6−4.6
Canche−0.6165.128.228.417.0−1.9−0.5−0.9−0.9−0.9
Aa−0.5142.625.526.617.6−1.63.6−0.2−0.3−0.3

